Numerical Research of the Modification of the Combustion System in the OP 650 Boiler


Department of Power Engineering and Turbomachinery, Silesian University of Technology, Konarskiego 18, 44-100 Gliwice, Poland
Energies 2020, 13(3), 725; https://doi.org/10.3390/en13030725
Submission received: 28 November 2019
/
Revised: 3 February 2020
/
Accepted: 4 February 2020
/
Published: 7 February 2020
Abstract
:Changes in the combustion system are one of the paths leading to improved combustion quality. This is manifested by a reduction of the unburnt carbon in fly ash and slag and a reduction in harmful emissions. The article presents the numerical analysis of the modification of the combustion system in the OP 650 boiler. The modifications consisted of changing the direction of swirl of the dust–air mixture in individual burners and changing the distribution of air to Over-Fire Air (OFA) nozzles. These had an impact on NOx and CO emissions and the temperature achieved at the outlet of the chamber. The content of O2, CO, and NOx emissions, flue gas temperature at the outlet from the chamber, flue gas temperature after the platen superheater, as well as temperature at the outlet from the model were presented. The percentage of coal flow directed towards the slag hopper was also noted.
1. Introduction
For the entire global economy, the progress in modern technologies for the development of renewable and zero-emission energy sources is necessary. However, until complete discontinuation of energy based on fossil fuels, it is necessary to modernize and develop low-carbon combustion technologies to achieve the required emission standards for harmful substances, including nitrogen oxides (NOx).
Currently the most important legal requirements regarding the emission of NOx resulting from the energetic combustion of fuels are presented in the Industrial Emissions Directive IED [1]. Its main task is to set standards for achieving a high level of environmental protection, preventing industrial pollution. The Best Available Technique (BAT) reference document [2] is the benchmark for the value of emission standards. Pursuant to the IED directive, facilities that do not meet emission requirements will have to be taken out of service.
During the combustion process of fuel in power boilers, NOx are formed. The most effective methods of NOx reduction are currently the secondary methods—Selective Non-Catalytic Reduction (SNCR) and Selective Catalytic Reduction (SCR). Primary methods for NOx reduction are still being developed because they are much cheaper to invest and operate compared to secondary methods. Primary methods are the basis for more advanced methods of NOx reduction.
The main purpose of primary methods is to reduce the temperature in the combustion chamber and minimize the intensity of contact between fuel particles and air while producing a fuel-rich zone where it is possible to reduce NO2 to N2.
Numerical modeling is a very useful tool used to check different working conditions without having to make real and expensive changes to the object. Numerical calculations of boilers allows for simulation of flows and phenomena occurring in the chamber, optimization of the combustion process, and modification of existing boiler structures [3,4]. Changes in the combustion system are one of the paths leading to improved combustion quality. This is manifested by a reduction of the unburnt carbon in fly ash and slag and a reduction in harmful emissions.
In Hwang et al. [5], technology for recycling ash to the combustion chamber in a 500 MW pulverized boiler to reduce loss of ignition (LOI) was proposed. Numerical tests were done to pick out the best place for the recurrent ash application and its quantity in order to minimize its negative impact on the boiler condition. In order to obtain ash with a low LOI index, reversible ash can be burned, which was clearly demonstrated by real-scale tests.
Chen et al. [6] showed the numerical results of the combustion process calculation in a 600 MW coal boiler for different configurations of corner burners. Velocity profiles, contour of temperature, flue gas composition, heat received by screen walls, vortex circle diameter, and the swirl number were presented. For the appropriate operating conditions of this boiler, tests showed that the best solution will be to place burners in the center of the chamber walls. The effectiveness of reduction of NOx emissions by using air staging depends primarily on the intensity of mixing air and fuel as well as the ratio of excess air and the residence time of the fuel particles in the combustion zone. The higher the intensity and the longer the residence time, the higher the effectiveness [7]. In Yang et al. [8] for a 600 MWe boiler, numerical and experimental tests for changing the swirl burner operation mode, secondary air displacement, and the use of separate over-fire air were carried out. The results presented that NOx emissions and unburned combustibles in flue gas decreased when the swirl burner setting was changed from co-rotation to opposite mode. The introduction of separate over-fire air resulted in a significant reduction in NOx emissions. Based on research shown in [9], Stupar et al. showed that for a boiler in Kostolac Thermal Power Plants (TPP), air staging along its entire height slowed combustion while the heat exchange process was more intense. Although this occurrence carried on to a decrease in NOx concentration, it reduced the power of the boiler as well as raised the boiler efficiency. The research also showed that the boiler efficiency, in each considered case, with the air staging arrangement used, was higher due to the opportunity for operation of the boiler with a lower value of the air excess ratio. In addition, the results showed that the distribution of air, and the place of air supply, may affect the parameters of superheated and heated steam. In Ma et al. [10] an innovative combustion system for a 600 MWe boiler was used to reduce NOx emissions without increasing the carbon content in fly ash. The system primarily depends on displacement of the fuel-lean nozzles from arches to the front/rear walls of the furnace and rearranging the supply of the air and providing separated over-fire air. The article presents the impact of over-fire air location on the combustion process as well as NOx emission. Based on numerical studies, a significant reduction of NOx (approximately 50%) was demonstrated for all particular Separated Over-Fire Air (SOFA) location settings. Laubscher et al. [11] examined the impact of changing the direction of secondary air in pulverized swirl burners on the wall of the boiler combustion chamber, platen superheater, and high temperature superheater heat absorption using numerical simulations. It was found that changing the direction of all burners towards the chamber wall increased heat absorption in the furnace by up to 6.67%, and the unburned carbon fraction decreased from 0.029% to 0.022% compared to the current configuration of the burners’ swirl. The results showed that increased mixing in the burner region also reduced CO levels. Simulations showed that there is interaction between neighboring burners that affects the combustion rate as well as the heat absorption in the waterwall and the plate superheater for the modeled boiler.
There has not been much research on the impact of changing the swirl direction of individual burners and changing the distribution of air to OFA nozzles on the combustion process in boilers with an air grading system. Therefore, this article presents the results of such numerical tests for the OP 650 boiler.
2. Boundary Conditions and Modeling Description
2.1. Boundary Conditions
The OP 650 boiler was a two-pass pulverized coal fired boiler with natural circulation and reheated steam. The boiler operational parameters are presented in Table 1. On the front wall there were swirl burners placed in four rows. Each mill supplied four burners. Figure 1 shows the location of the burners on the front wall along with the directions of swirling of pulverized coal–air mixture as well as a burner diagram. During the simulation, 16 burners operated with mills marked A, B, C, and D. The burners fed with the mill marked E worked in cooling mode. The upper OFA nozzles had the designations R2 and R5 (OFA_u). OFA nozzles with designations R1, R3, R4, and R6 worked as the lower nozzles (OFA_l). The geometry of the burners for computational fluid dynamics (CFD) simulations was simplified. The diagram indicates: R—core air, P + I—fuel + primary air, II—secondary air II, III—secondary air III. The swirled blades were available only for the fuel–air mixture. In the burner, fuel and primary air were swirled through the vanes with angle of 40° as shown in Figure 1. Lower OFA nozzles were divided into two parts. In Figure 1 it is shown that in the middle part, the air was fed without swirling, while the air through the extreme ring was fed at an angle of 40°. Table 2 contains individual values of coal and air mass flow for each mill together with factor temperatures.
2.2. Modeling Description
In the boiler combustion chamber, heat is transported by radiation [12]. Modeling of heat-flow phenomena that occur in the furnace chamber is largely complex and non-linear. This is due to the high temperatures of the flue gas in the chamber, the generally high velocity at the exit of the burners, as well as heat exchange between flue gas and large surfaces of the waterwall. The analyzed burner configuration and the uneven distribution of coal dust and air should also be taken into account.
Boundary conditions and adopted models of phenomena have a great impact on the correctness of the solution [13]. To perform proper numerical modeling, one needs to know specific boiler data entered as boundary conditions for the model. Not all quantities can be determined by measuring on a real object. Therefore, balance calculations of the entire boiler should be carried out to obtain the required data. They were implemented in the model as boundary conditions and were relevant in terms of verification of the numerical model. A fully balanced zero-dimensional model based on measurement data was used here. The model was based on heat-flow balance computation of the whole boiler, taking into consideration each heat exchanger in the way of flue gas flow (combustion chamber, superheaters, water and air heaters). The dimensions of the boiler (depth, width, height) were also taken into account. This model for each of the heat exchangers included the diameter and length of the pipes, pitch of pipe bank, number of pipes, and the number of pipe rows. The zero-dimensional model also took into account slagging and fouling factors as well as pipe heat efficiency in calculating the heat exchange between flue gas and the operating medium. The model provided the temperature of the flue gas and the operating medium at the outlet of each heat exchanger. The model also provided the average velocities of flue gas and operating medium. In calculating the combustion chamber, it took into account the dimensions of the waterwalls and the emissivity of the chamber and flame. It was assumed that the walls were treated as flat surfaces exchanging heat with flue gas.
In the numerical model the boiler geometry was simplified as much as possible and divided into blocks. The purpose of the division into blocks was to create an appropriate grid. The model included in the flue gas path the third platen stage of the live steam superheater, the fifth last stage of the live steam superheater, the second stage of the steam reheater, and the last collective heat exchange surface. The last surface replaced the fourth stage of the live steam superheater, the first stage of the steam reheater, and the second stage of the water heater. The isometric view of the boiler model with numerical mesh is shown in Figure 2. The mesh was finest in the area of the burners, where the combustion process occurs, and in the area of the platen superheater to receive more accurate results. However, in the area of the slag hopper and the second pass, the mesh was thinned. The boiler’s numerical mesh consisted of 807,384 cells.
Saturation parameters prevail in the evaporator. Thus for waterwalls a saturation temperature of 615 K and an internal emissivity of 0.6 were set [14]. The evaporator walls and first stage pipes of the live steam superheater were modeled as flat heat exchange surfaces with flue gas. The evaporator wall thickness corresponding to the wall thickness of the evaporator pipe equal to 0.0036 m was also assumed. The evaporator included a combustion chamber and boiler draft. The second pass was also screened by the first stage live steam superheater pipes. A temperature of 610 K and an internal emissivity of 0.7 were set on the walls. A thickness of 0.005 m was assumed for the second pass walls. For slag hopper walls the temperature of 515 K and an internal emissivity of 0.5 were set. For outlet boundary conditions the outflow condition was set.
The superheaters were modeled in the shape of a rectangular plate exchanging heat with flue gases. The heat exchangers were treated as a porous body. In the porous body the standard energy transport equation with modifications to the conduction flux was solved. In the porous medium, the conduction flux used an effective conductivity. Turbulence was calculated in the porous body, as the mass flow of fluid was based on, i.a., porosity of the medium. The superficial velocity inside the porous body, based on the volumetric flow rate, was used. Additional momentum sources in the momentum equations are presented below.
where in Equation (1) i is the momentum equation for x, y, z directions; |v| is the magnitude of the velocity; µ is dynamic viscosity; 1/α = D means viscous loss term based on Darcy’s Law; C2 means inertial loss term. In the zero-dimensional model, knowing the geometry of the heat exchanger, it is possible to calculate the pressure drop Δp and flue gas velocity v. Pressure drop versus velocity through the porous body can be extrapolated to determine the D and C2 coefficients. Using the zero-dimensional model, it is possible to prescribe the heat flux retrieved by the heat exchanger from the flue gas. The pressure drop can be calculated by Equation (2).
where in Equation (2) ζ is the number of resistance; ρfg is the density of the flue gas; νfg is the velocity of the flue gas. Turbulence modeling is a very complex process. Turbulent flow has a rapid, random and three-dimensional nature, which makes it a difficult phenomenon to model. In simulations the realizable k-epsilon turbulence model [15] was used. It is one of the most commonly used turbulence models, especially for vortex flows. It contains two transport equations that characterize the turbulent fluid flow properties. The first variable ‘k’ represents turbulence in the form of kinetic energy of turbulence. The second transported ‘epsilon’ variable is the degree of dissipation (dissipation) of energy and determines the scale of turbulence.
The model of combustion of volatile fraction used in the simulation was set as Finite-Rate/the Eddy Dissipation. This model assumes that the combustion reaction rate is directly related to the time needed to mix the reagents at the molecular level. In turbulent flows, the mixing time is dominated by the vortex properties, and therefore it is determined by the kinetic energy of turbulence and dispersion. In addition, the Arrhenius equation is introduced, which links the reaction rate constant with the activation energy and temperature. This prevents the combustion reaction from occurring when the reagents are in the computational domain before the flame. The volatile fraction and CO reactions of the combustion process are shown below.
In this study the SIMPLE method was used to evaluate the flow fields. The Lagrange approach was utilized to simulate the trajectory of a fuel particle in a gas phase. The gas phase was modeled in Euler coordinates. The exchange of heat, mass, and momentum between the fuel particles and the flue gas was computed by a model of the discrete phase (Discrete Phase Model—DPM). Coal devolatilization was computed by the Single Rate model [16]. The kinetic diffusion approach [17,18] was exploited to execute the combustion process of chair particles. The reaction of char combustion to CO2 according to this model is showed below. The kinetics parameters for the char and devolatilization models and homogenous reactions are presented in Table 5. These parameters are typical for Polish coal.
Radiation heat exchange between the walls and the fuel particles as well as flue gas and coal particles was taken into consideration by utilizing the Discrete Ordinates model (DO). The model solves radiation transport equations for a finite number of discrete constant angles. The accuracy of angular discretization is controlled by the values of the theta division and phi division coefficients. For the problem being analyzed, it was important to obtain a greater degree of discretization. The value of 4 was assumed for the theta division and phi division coefficients and for theta pixels and phi pixels the value of 3. Due to the significance of the model, radiation calculations were used in each iteration. In radiation heat transfer emissivity of the particle was also included. The grey gas model was used to calculate the flue gas absorptivity. The shape of the coal was established as spherical. The division of the fuel particles was computed with the Rosin–Rammler–Sperling distribution. Pulverized coal particles were reflected after contact with the wall. At the outlet from the model and at the bottom of the slag hopper, the particle condition was set for the escape. Through the surface of the inlet of the burners, a particle of pulverized-coal was injected cf.1. The particles temperature was set to 100 °C. The number of injected particles was 1512.
Calculations of NOx were done including fuel and thermal paths. The function of probability density (PDF) for turbulent interaction was selected. The thermal NOx was calculated according to the Zeldovich mechanism [19]. As a consequence of energy delivery in O2, chains are interrupted and free atoms of O may participate in the reaction:
In mixtures rich in fuel as well as in conditions congruous to stoichiometric it was proposed to join the third reaction [20,21,22]:
The O and OH radical concentrations were specified with the partial equilibrium approach [23,24,25]. Intermediates resulting from the volatile oxidation reaction HCN/NH3/NO were selected, while for char oxidation NO was selected [26,27].
Based on the measurements, heat-flow calculations of the OP 650 boiler were carried out using a zero-dimensional model to validate the numerical model. Numerical simulation was performed in the Ansys.Fluent program. The modification of the combustion system consisted of simulations for individual cases of changes in the direction of swirling the dust–air mixture in burners and changes in air distribution in the upper and lower OFA nozzles. Therefore, it was specified:
- -
- changes the swirl directions of individual burners occurred (9 cases),
- -
- changes of air distribution in the upper and lower OFA nozzles occurred (4 cases).
In Figure 3, nine cases of changes in the direction of swirling the dust–air mixture for individual burners was shown. For individual cases, the swirls were determined according to a specific strategy. The goal was to check the effect of opposite or compatible swirl directions for adjacent columns or rows of burners on flue gas temperature and NOx and CO emissions. Further cases were designated as WIR 1, WIR 2, WIR 3, WIR 4, WIR 5, WIR 6, WIR 7, WIR 8, and WIR 9. The changes in the distribution of air streams between the upper OFA nozzles and the lower OFA nozzles are shown in Table 6. Four cases of air distribution were analyzed and designated as: OFA 1, OFA 2, OFA 3, OFA 4.
In the first case designated OFA 1, 25% of the air was transferred from the upper OFA nozzles to the lower OFA nozzles. The second case (OFA 2) involved transferring 25% of the air from the lower OFA nozzles to the upper OFA nozzles. The third case (OFA 3) was the supply of 50% of the air from the lower to upper OFA nozzles. The last case (OFA 4) was the transfer of 10% of the total air flow III from the burners to the upper OFA nozzles.
3. Results and Discussion
3.1. Model Verification
The key parameters in the process of verifying the correctness of the base CFD model were calculated using the zero-dimensional model. In Table 7 the O2 content in flue gas at the model outlet, flue gas temperature at the combustion chamber outlet TCCO, and flue gas temperature behind the platen superheater TPSO are presented. The amounts of heat absorption (HA) in waterwalls and tube banks of heat exchangers are provided in Table 7. The subscript w is water wall, ps means platen superheater, 5th is the fifth stage of live steam superheater, 2nd is the second stage of steam reheater, and chs means collective heat surface.
Figure 4 and Figure 5 show the temperature distribution and the content of NOx, O2, and CO in flue gas on selected planes of the combustion chamber. According to Figure 4, the highest temperatures occurred in the 3rd and 4th row of burners. This caused the largest local NOx concentration to occur in this area as shown in Figure 4. The burner’s operation was clearly outlined—the core air tongue was visible. Figure 5 shows that the most thermally loaded zones at the outlet of the combustion chamber were the central, lower, and left part of the platen superheater. The O2 distribution in Figure 5 shows the largest amount of O2 in the area of the burners and correct operation of the OFA upper nozzles. As the burner level increased, the O2 range was reduced. The largest amount of CO occurred in the area of the lower burners.
3.2. Results of Modification of the Combustion System
Depending on the individual calculations, the content of O2, CO, and NOx at the model outlet is shown in Table 8. The emission of CO and NOx was converted to 6% of O2 in the flue gas. Table 8 also presents flue gas temperature at the outlet from the chamber TCCO, after the platen superheater TPSO as well as temperature at the outlet from the model TOUT.
Six swirl cases (designated as WIR 1, WIR 4, WIR 5, WIR 6, WIR 7, and WIR 9) and all OFA cases (marked as OFA 1, OFA 2, OFA 3, and OFA 4) were selected for further analysis. The other cases were not further analyzed due to the small differences between them in the size distribution and the increase in emissions of unwanted exhaust components.
The NOx and CO emissions at the outlet from the model for swirl cases are presented in Figure 6. The temperature of the flue gas at the outlet from the combustion chamber TCCO and the decrease in flue gas temperature in the platen superheater ΔTF for the swirl cases are presented in Figure 7. However, in Figure 8 the NOx and CO emissions at the outlet from the model for OFA air distribution cases are shown. The temperature of the flue gas at the outlet from the combustion chamber TCCO and the decrease in flue gas temperature in the platen superheater ΔTF for OFA air distribution cases are presented in Figure 9.
For the WIR cases 1, 4, 6, 7, and 9, a decrease in NOx emission at the outlet from the model was noted, as shown in Figure 6. The largest reduction was obtained for case WIR 1 and it amounted to less than 12%. This is probably due to a more favorable mixing of the reagents in the high temperature zone and, consequently, less NOx formation. The level of CO emissions was at a comparable level. The largest increase occurred for cases WIR 6 and 7, as can be seen in Figure 6. This result may be influenced by the creation of areas in the chamber with insufficient O2, which causes incomplete combustion of coal. In no case was a significant increase in flue gas temperature observed from the chamber outlet, as shown in Figure 7. In most cases, the temperature decreased—the largest reduction occurred for cases WIR 1 and 4. Decreasing the flue gas temperature at the combustion chamber outlet reduced the flow of water that cools the superheated steam.
In Laubscher et al. [11] it was shown that the operation of all burners with the same swirl angle caused the temperature of the flue gas at the combustion chamber outlet to drop. This configuration also extended the heat consumption from flue gas to the evaporator as well as decreased unburnt carbon (UC). It was noticed that if two pairs of burners on opposite walls had opposite rotations (mutually reinforced each other), this reduced the temperature of the flue gas from the combustion chamber as well as decreased UC and CO. It also resulted in a higher heat consumption from flue gas to the evaporator. Yang et al. [8] showed that setting the swirl burner from co-rotating to counter-rotating mode reduced NOx emissions and UC. A similar situation with regards the arrangement of the burners side by side with the opposite swirl occurred in the case of WIR 1. For this case, the lowest NOx and CO emissions were recorded at the outlet of the model. The lowest percentage of coal flow falling towards the slag hopper was noted also for WIR 1, leading to a decrease in UC.
Figure 8 presents that the introduction of more air into the lower OFA nozzles (case OFA 1) resulted in an increase in NOx emissions by 9.3% and CO by 46.2% at the outlet of the model compared to the base case. However, in the case in Figure 9, the decrease in the temperature of the flue gas at the outlet of the chamber by nearly 18 K was observed.
In Figure 8 it can be noticed that increasing the air flow to the upper OFA nozzles by 25% (case OFA 2) led to a reduction of NOx emissions by 15.6% and CO by 60%. Further increasing the air flow to the upper OFA nozzles (case OFA 3) reduced NOx emissions by almost 22% and CO by 97% compared to the base model. Case OFA 4 caused similar changes as case OFA 2. This was a result of the primary methods for NOx reduction. More air was directed above the flame and less to the high temperature areas, which reduced the NOx formation and caused better combustion of CO in the upper zones of the chamber. It also reduced the amount of CO and increased the temperature at the outlet of the chamber. However, it should be noted that the distribution of air between the two levels of OFA nozzles was examined in this article. A similar trend was observed in Jo et al. [4] where with the increase in the share of air in SOFA nozzles, the temperature at the combustion chamber outlet increased as well, and NOx emissions decreased.
Another trend was in Stupar et al. [9]. It was shown that along with the reduction of the air flow to OFA nozzles, the flue gas temperature at the combustion chamber and boiler outlet decreased as well, and NOx and CO emissions were reduced. Yang et al. [8] showed that the introduction of SOFA nozzles caused a double reduction of NOx emissions. In Ma et al. [10] it was shown that by introducing, i.a., SOFA nozzles, NOx emissions were reduced without increasing the carbon content in fly ash.
In Figure 9 it can be observed that the largest increase in flue gas temperature at the outlet of the chamber compared to the base case was occurred for case OFA 2. Figure 9 presents that for case OFA 3, the highest temperature increase was recorded on the platen superheater. Increasing the flue gas temperature at the combustion chamber outlet increased the flow of water that cooled the superheated steam.
In the following figures the contours of the temperature of flue gas and NOx, O2, and CO content on selected planes of the analyzed boiler were shown. Figure 10 shows that for cases WIR 1 and 4, better temperature equalization was achieved at individual burner levels. However, for cases WIR 1 and 4, the outlet temperature from the combustion chamber compared to the base model was lower, as determined in Table 8. This may be due to a more homogeneous swirling direction of the mixture for adjacent burners. In Figure 10 it can be noticed for cases WIR 5, 6, 7, and 9 that lower temperatures occurred at lower levels of the burners. Figure 10 shows that a comparable or higher temperature of flue gases at the outlet from the combustion chamber compared to the base model was obtained. This can be also determined from Table 8.
In Figure 11 for the OFA 2 and OFA 3 cases one can see better temperature equalization in the boiler cross-section for the upper OFA nozzles and the highest row of burners compared to the base model. This resulted in obtaining a higher temperature at the outlet of the chamber, because in these areas there was a better burning of CO. For these cases and the OFA 4 case, the air flow from the upper OFA nozzles was clearly larger and touched the rear wall of the boiler causing a greater disturbance of the flue gas as shown in Figure 11.
The least large local amounts of NOx occurred for the WIR 1 case as shown in Figure 12. This is probably due to a more even temperature distribution. In contrast, the largest amount of local NOx occurred most frequently for WIR cases 5 and 7, which was related to the burner swirl system. For all WIR cases, larger amounts of NOx formed in the 3rd and 4th row of burners because this was the place of the highest temperature in the chamber.
Directing more air to the upper OFA nozzles (OFA cases 2, 3, and 4) resulted in a decrease in NOx at the level of these nozzles, as can be seen in Figure 13. The lowest local NOx concentrations occurred for the case OFA 4 because the amount of secondary air was limited in the area of the burners. Case OFA 1 did not contribute to a decrease in the amount of NOx at the outlet of the chamber.
Changes the directions of swirl of the dust–air mixture did not significantly affect the temperature distribution at the combustion chamber outlet as shown in Figure 14. The reason for this may be the temperature equalization in the upper zones of the chamber. It can be seen that the highest temperature occurred in WIR 5 and 9 cases and the lowest case WIR 4.
For the OFA 2 and OFA 3 cases, a more even temperature distribution on the outlet plane of the chamber was observed (Figure 15). This condition may be influenced by better mixing of the combustion process components, caused in turn by a larger disturbance in the flue gas flow as a result of introducing a larger air flow into the upper OFA nozzles. For OFA 2, the highest increase in average outlet temperature was noted, which was caused by a more intensive combusting of CO.
It can be seen in Figure 15 that the most thermally loaded zone at the outlet from the chamber was the central, lower, and left parts of the platen superheater. For the proper operation of the platen superheater, an even inflow flue gas profile is required. In this case, the superheater tubes were evenly loaded with heat and the steam temperature spread across the width of the stage was reduced. Thus, due to the proper operation of the platen superheater, the WIR 7 and OFA 3 cases were the most advantageous, as shown in Figure 14 and Figure 15.
For cases 1, 4, 6, and 9, an increase in O2 in the area of the slag hopper was observed (Figure 16). This is due to mutually directed pairs of burners with opposite swirl directions in the first row. The highest degree of penetration through the chamber depth was observed for the case WIR 9. This resulted in the lowest O2 content in the flue gas at the outlet of the model for the swirl cases, as shown in Table 8.
For the case OFA 1, one can see in Figure 16 the contour with a higher O2 concentration closer to the front wall and boiler ceiling. There was also an increase in O2 at the outlet of the chamber in this case. For this case, the air flow to the upper OFA nozzles was the smallest, because the O2 from the air could be transported to the upper zones of the chamber in an easier way with the help of the flue gas momentum. The smallest O2 contours above OFA nozzles were observed in Figure 16 for case OFA 3. It resulted from the largest flow of air fed to the upper OFA nozzles creating a more pronounced barrier. This case was characterized by the lowest amount of O2 in the flue gas at the model outlet, as can be seen in Table 8.
The largest amounts of CO occurred in the areas of the burners. Above the burner level, the CO concentration decreased due to the air from OFA nozzles burning into CO2 in accordance with reaction 2, as shown in Figure 17. For the WIR cases 5, 6, and 7, a higher CO concentration also occurred in the area of the slag hopper due to low flow disturbance in the lower rows of burners.
When comparing case 5 with 6, a certain tendency was observed. It can be seen that for case WIR 5 the amount of O2 in the slag hopper disappeared, without entering into the reaction of CO to CO2 oxidation—according to Equation (4), as can be seen in Figure 17. However, this O2 reacted with carbon according to reaction 3 to form CO2, which can also be seen in Figure 18. For the case WIR 5 a large percentage of fuel particles compared to case 6 were directed downwards to the slag hopper. Analyzing the case WIR 6, it was observed that O2 remained in the slag hopper because not too many fuel particles were directed to the slag hopper. Therefore, the O2 did not react with carbon to create CO2 according to reaction 3. However, O2 reacted with CO according to reaction 2, reducing its content compared to case WIR 5. On the other hand, O2 appeared in the hopper due to the swirl direction in the 1st and 2nd order burners. In the case where O2 was present in the slag hopper, this was supported by the swirl directions aiming towards the slag hopper. The lack of O2 in the slag hopper also resulted from the swirl directions disturbing the air flow directed to the hopper in other cases.
The transfer of part of the secondary air from the burners to the upper OFA nozzles (case OFA 4) caused a larger amount of CO in the area of the burners; however this amount was burned in the OFA upper nozzles zone. Figure 17 shows that for the case OFA 3, the lowest amounts of CO were found in the entire area of the furnace chamber.
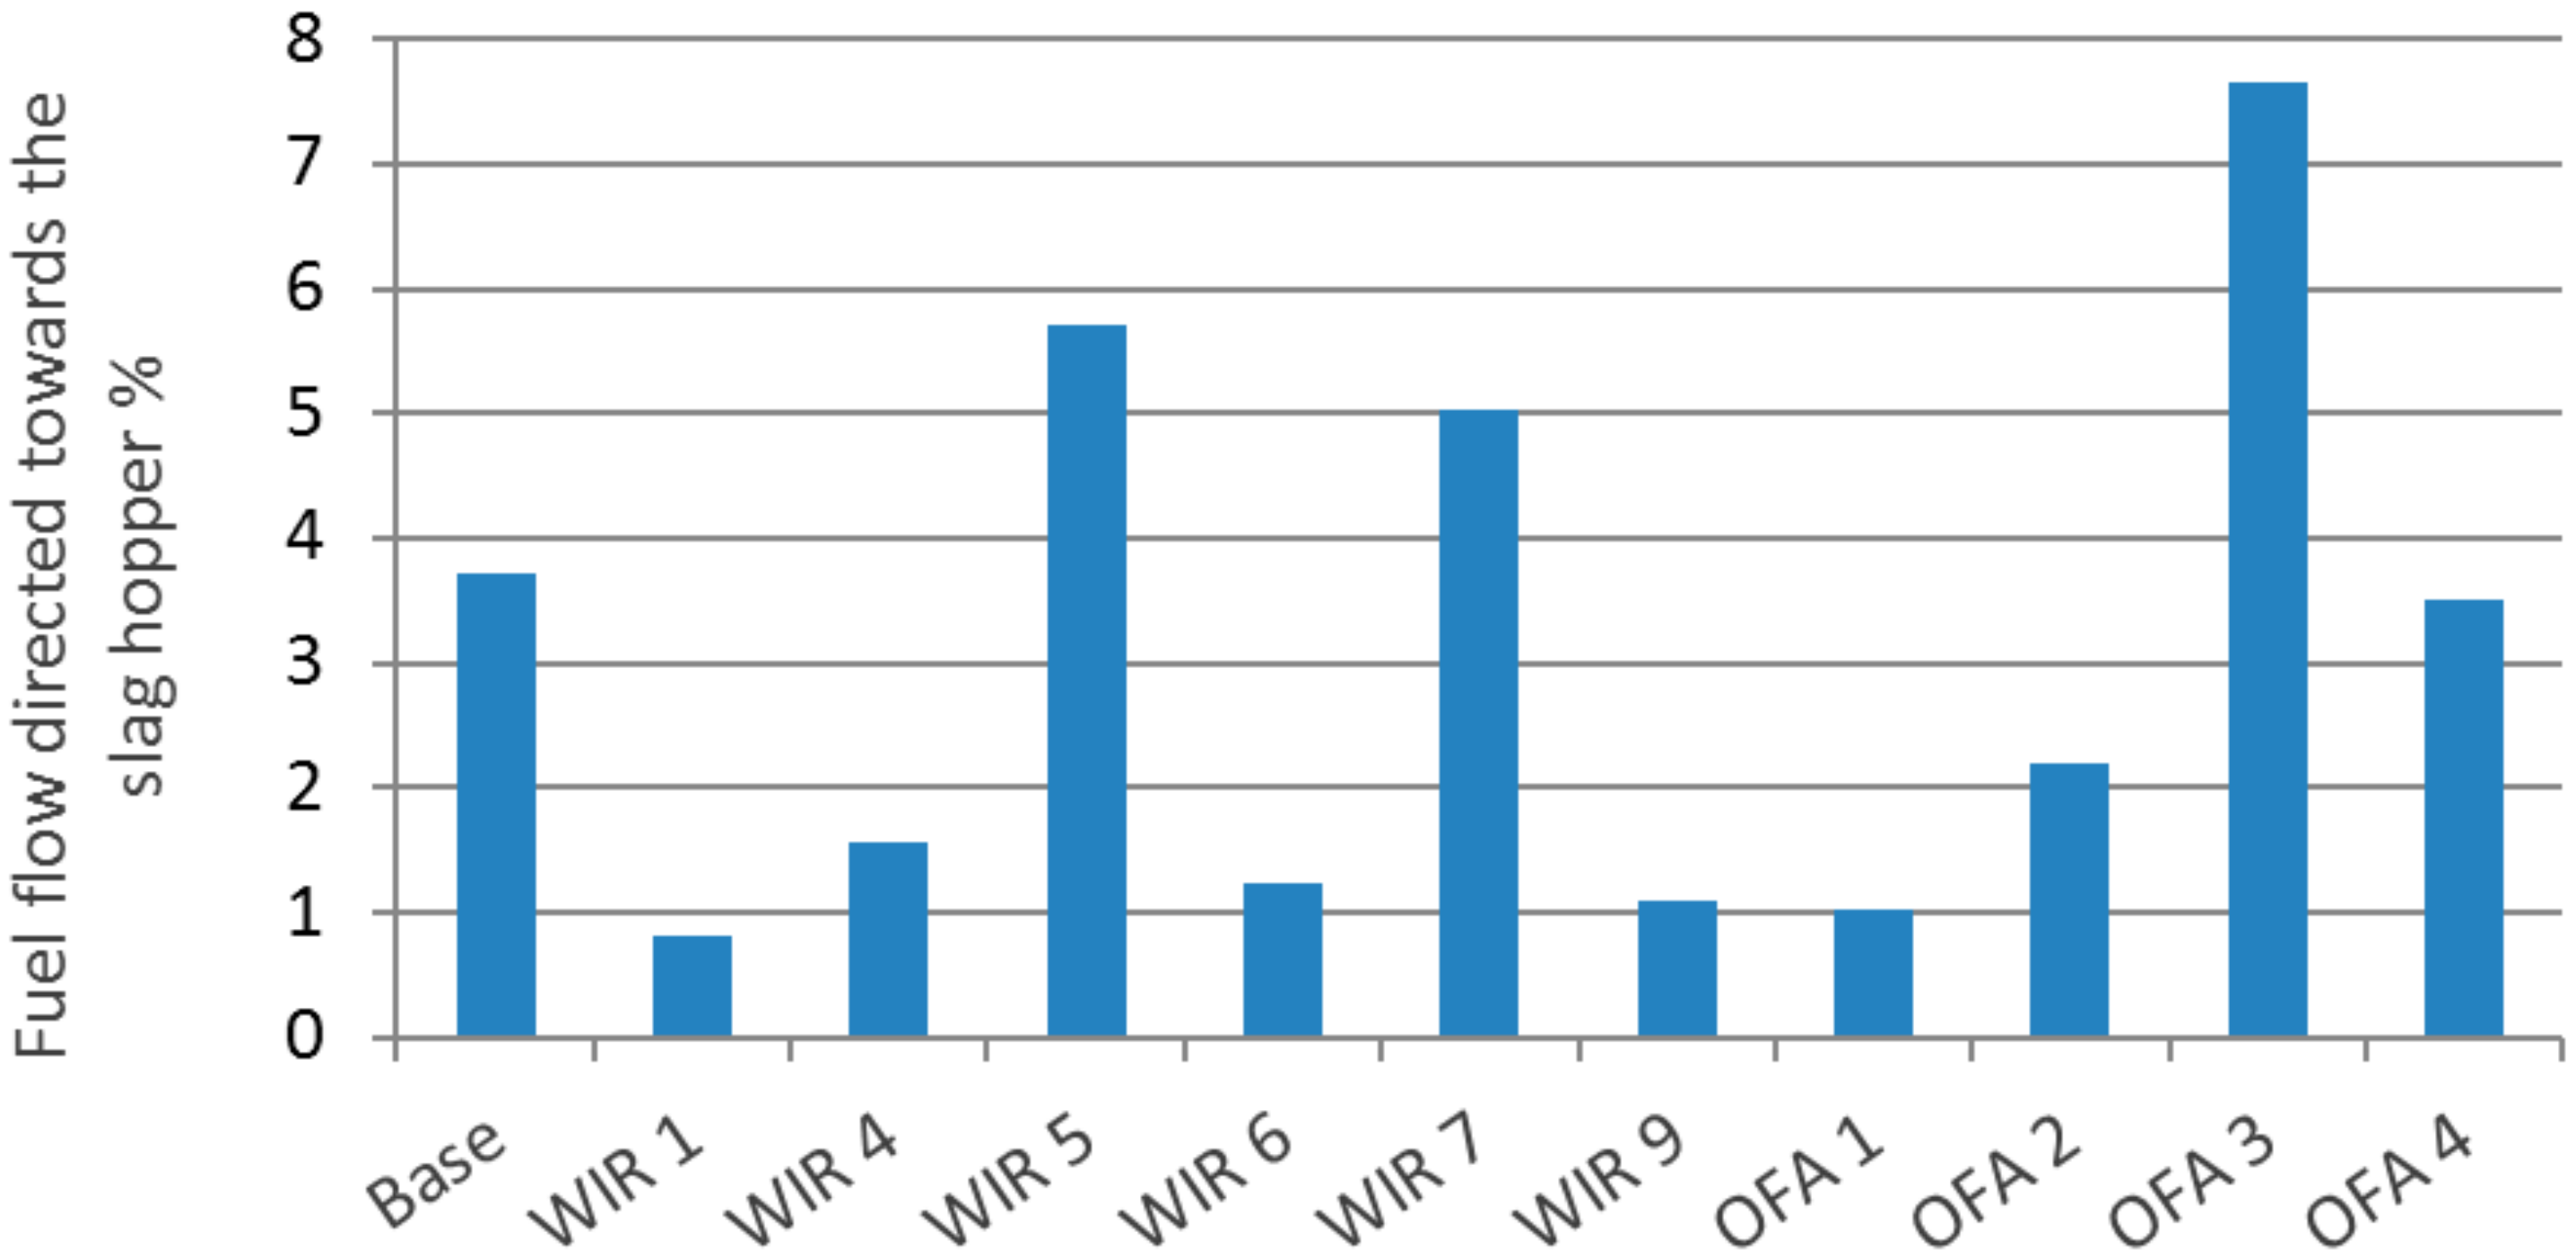
The lowest percentage of coal flow falling towards the slag hopper was noted for the WIR 1, 6, and 9 and OFA 1 cases, as shown in Figure 18. The OFA 3 case proved to be the least favorable in this respect, and significantly increased the percentage of coal flow directed towards the slag hopper. This lead to an increase in the unburnt loss.
4. Conclusions
Modification of the combustion system by changing the base configuration of the swirl directions of the dust–air mixture and by changing the air distribution between the upper and lower OFA nozzles had an impact on NOx and CO emissions and the temperature achieved at the outlet of the chamber. For all swirl cases selected for further analysis, except in the case of WIR 5, decrease of NOx emission was found. For the selected cases of the change in swirl direction for comparison, a comparable level of CO emission was noted. In the cases WIR 6 and 7 an adverse increase occurred only. Numerical tests showed a decrease in flue gas temperature at the combustion chamber outlet for cases WIR 1, 4, 6, and 7 compared to the base case. The largest decrease occurred for cases WIR 1 and 4. However for cases WIR 5 and 6, a minimal increase in flue gas temperature was noted. In case OFA 1 it was observed that the introduction of more air to the lower level of OFA nozzles did not bring favorable results. This action resulted in an increase in NOx and CO emissions as well as a decrease in temperature at the outlet of the chamber. A positive effect on the operation of the combustion chamber was demonstrated as a result of transferring part of the air flow to the upper level of OFA nozzles from the lower nozzles (OFA 2 and 3 cases) and part of secondary air III (case OFA 4) from the burners. This led to a reduction in NOx and CO emissions, increasing the outlet temperature from the chamber and increasing the temperature drop on the superheater. The highest local NOx concentrations occurred in the 3rd and 4th row of burners, in the area with the highest temperatures. The directions of the mixture swirling affect the temperature distribution in the area of the burners, but they did not significantly affect the temperature distribution at the outlet of the chamber. For cases WIR 1 and 4, better temperature equalization was achieved at individual burner levels. A more even temperature of the boiler cross-section can be seen in case OFA 2 and OFA 4 for the level of the upper OFA nozzles and the highest row of burners. There was better temperature equalization on the outlet plane of the chamber in cases OFA 4 and OFA 2. An even inflow flue gas profile was required for proper operation of the platen superheater. Thus, cases WIR 7 and OFA 3 were the most advantageous. In order for the tested boiler to meet the currently required emission standards for NOx, secondary methods for reducing NOx should be used. Using numerical methods, it is possible to study various swirl systems in burners and air staging installations without having to build real installations in order to find the best and the most optimal solutions. The best configuration, which permitted minimization of the pollutant emissions both for NOx and CO, was case OFA 3. However in this case the fuel flow directed towards the slag hopper was on the highest level. Therefore, an optimal design for all cases analyzed in term of pollutant emissions was case WIR 1.
Funding
This research was funded by Politechnika Śląska Statutory Research Found.
Acknowledgments
The author would like to thank for colleagues from the Boiler and Steam Generators Group for their help and technical support.
Conflicts of Interest
The author declares no conflict of interest.
References
- European Parliament and of the Council. Industrial Emissions. In Integrated Pollution Prevention and Control; 2010/75/EU; European Parliament and of the Council: Brussels, Belgium, 2010. [Google Scholar]
- Best Available Techniques Reference Document for the Large Combustion Plants; Final Draft; European Commission: Brussels, Belgium, 2016.
- Torresi, M.; Fornarelli, F.; Fortunato, B.; Camporeale, S.M.; Saponaro, A. Assessment against Experiments of Devolatilization and Char Burnout Models for the Simulation of an Aerodynamically Staged Swirled Low-NOx Pulverized Coal Burner. Energies 2017, 10, 66. [Google Scholar] [CrossRef] [Green Version]
- Jo, H.; Kang, K.; Park, J.; Ryu, C.; Ahn, H.; Go, Y. Optimization of Air Distribution to Reduce NOx Emission and Unburned Carbon for the Retrofit of a 500 MWe Tangential-Firing Coal Boiler. Energies 2019, 12, 3281. [Google Scholar] [CrossRef] [Green Version]
- Hwang, M.; Kim, S.; Kim, G.; Lee, B.; Song, J.; Park, M.; Jeon, C. Simulation studies on direct ash recycling and reburning technology in a tangentially fired 500 MW pulverized coal boiler. Fuel 2013, 114, 78–87. [Google Scholar] [CrossRef]
- Chen, S.; He, B.; He, D.; Cao, Y.; Ding, G.; Liu, X.; Duan, Z.; Zhang, X.; Song, J.; Li, X. Numerical investigations on different tangential arrangements of burners for a 600 MW utility boiler. Energy 2017, 122, 287–300. [Google Scholar] [CrossRef]
- Biedermann, F.; Brunner, T.; Obernberger, I.; Sippula, O.; Boman, C.; Ohman, M.; Bafer, L. Summary and Evaluation of Existing Data on Air Staging Strategies—Project ERA-NET “Future BioTex” Report. 2010. Available online: https://futurebiotec.bioenergy2020.eu/files/FutureBioTec-Summary%20and%20Evaluation%20of%20Air%20Staging%20Strategies.pdf (accessed on 6 February 2020).
- Yang, W.; Wang, B.; Lei, S.; Wang, K.; Chen, T.; Song, Z.; Ma, C.; Zhou, Y.; Sun, L. Combustion optimization and NOx reduction of a 600 MWe down-fired boiler by rearrangement of swirl burner and introduction of separated over-fire air. J. Clean. Prod. 2019, 210, 1120–1130. [Google Scholar] [CrossRef]
- Stupar, G.; Tucaković, D.; Żivanović, T.; Stevanović, Ž.; Belośević, S. Predicting effects of air staging application on existing coal-fired power steam boiler. Appl. Therm. Eng. 2019, 149, 665–677. [Google Scholar] [CrossRef]
- Ma, L.; Fang, Q.; Tan, P.; Zhang, C.; Chen, G.; Lv, D.; Duan, X.; Chen, Y. Effect of the separated overfire air location on the combustion optimization and NOxreduction of a 600 MWeFW down-firedutility boiler with a novel combustion system. Appl. Energy 2016, 180, 104–115. [Google Scholar] [CrossRef]
- Laubscher, R.; Rousseau, P. Numerical investigation into the effect of burner swirl direction on furnace and superheater heat absorption for a 620 MWe opposing wall-fired pulverized coal boiler. Int. J. Heat Mass Transf. 2019, 137, 506–522. [Google Scholar] [CrossRef]
- Pronobis, M. Modernization of Power Boilers; WNT: Warszawa, Poland, 2013. [Google Scholar]
- Grądziel, S. Modeling of Flow-Thermal Phenomena Occurring in a Power Boiler Evaporator with Natural Circulation; PK: Kraków, Poland, 2012. [Google Scholar]
- Hernik, B.; Pronobis, M. A zero-dimensional model used as a basis for numerical modelling of OP-650 boiler. Arch. Energy 2012, 42, 17–26. [Google Scholar]
- Shih, T.H.; Liou, W.; Shabbir, A.; Yang, Z.; Zhu, J. A new k-ε eddy-viscosity model for high Reynolds number turbulent flows—Model development and validation. Comput. Fluids 1995, 24, 227–238. [Google Scholar] [CrossRef]
- Badzioch, T.; Hawksley, P. Kinetics of thermal decomposition of pulverized coal particles. Ind. Eng. Chem. Process Des. Dev. 1970, 9, 521–530. [Google Scholar] [CrossRef]
- Baum, M.; Street, P. Predicting the Combustion Behavior of Coal Particles. Combust. Sci. Technol. 1971, 3, 231–243. [Google Scholar] [CrossRef]
- Field, M. Rate of combustion of size-graded fractions of char from a low rank coal between 1200 K–2000 K. Combust. Flame 1969, 13, 237–252. [Google Scholar] [CrossRef]
- Zel’dovich, Y.B. The Oxidation of Nitrogen in Combustion Explosions. J. Acta Physicochim. 1946, 21, 577–628. [Google Scholar]
- Lavoie, G.A.; Heywood, J.B.; Keck, J.C. Experimental and Theoretical Study of Nitric Oxide Formation in Internal Combustion Engines. Combust. Sci. Technol. 1970, 1, 313–326. [Google Scholar] [CrossRef]
- Fenimore, C.P.; Jones, G.W. The water catalysed oxidation of carbon monoxide by oxygen at high temperatures. J. Phys. Chem. 1957, 61, 651–654. [Google Scholar] [CrossRef]
- Fenimore, C.P. Formation of Nitric Oxide in Premixed Hydrocarbon Flames. In Symposium (International) on Combustion; Combustion Institute: New York, NY, USA, 1971; Volume 13, pp. 373–380. [Google Scholar]
- Westenberg, A.A. Kinetics of NO and CO in lean, premixed hydrocarbon-air flames. Comb. Sci. Technol. 1971, 4, 59. [Google Scholar] [CrossRef]
- Westbrook, C.; Dryer, F. Chemical Kinetic Modelling of Hydrocarbon Combustion. Prog. Energy Comb. Sci. 1984, 10, 1–57. [Google Scholar] [CrossRef]
- Baulch, D.L.; Cobos, C.; Cox, R.A.; Esser, C.; Frank, P.; Just, T.; Kerr, J.A.; Pilling, M.J.; Troe, J.; Walker, R.W.; et al. Evaluated Kinetic Data for Combustion Modelling. J. Phys. Chem. Ref. Data 1992, 21, 411–734. [Google Scholar] [CrossRef] [Green Version]
- Lockwood, F.C.; Romo-Millanes, C.A. Mathematical Modelling of Fuel—NO Emissions From PF Burners. J. Int. Energy 1992, 65, 144–152. [Google Scholar]
- Winter, F.; Wartha, C.; Loffler, G.; Hofbauer, H. The NO and N2O Formation Mechanism During Devolatilization and Char Combustion Under Fluidized Bed Conditions. In Symposium (International) on Combustion; Elsevier: Amsterdam, The Netherlands, 1996; Volume 26, pp. 3325–3334. [Google Scholar]
Figure 1.
Burner system with marked swirl direction (left) and scheme of the burner (right).

Figure 2.
Isometric view of the boiler model geometry with a numerical mesh.
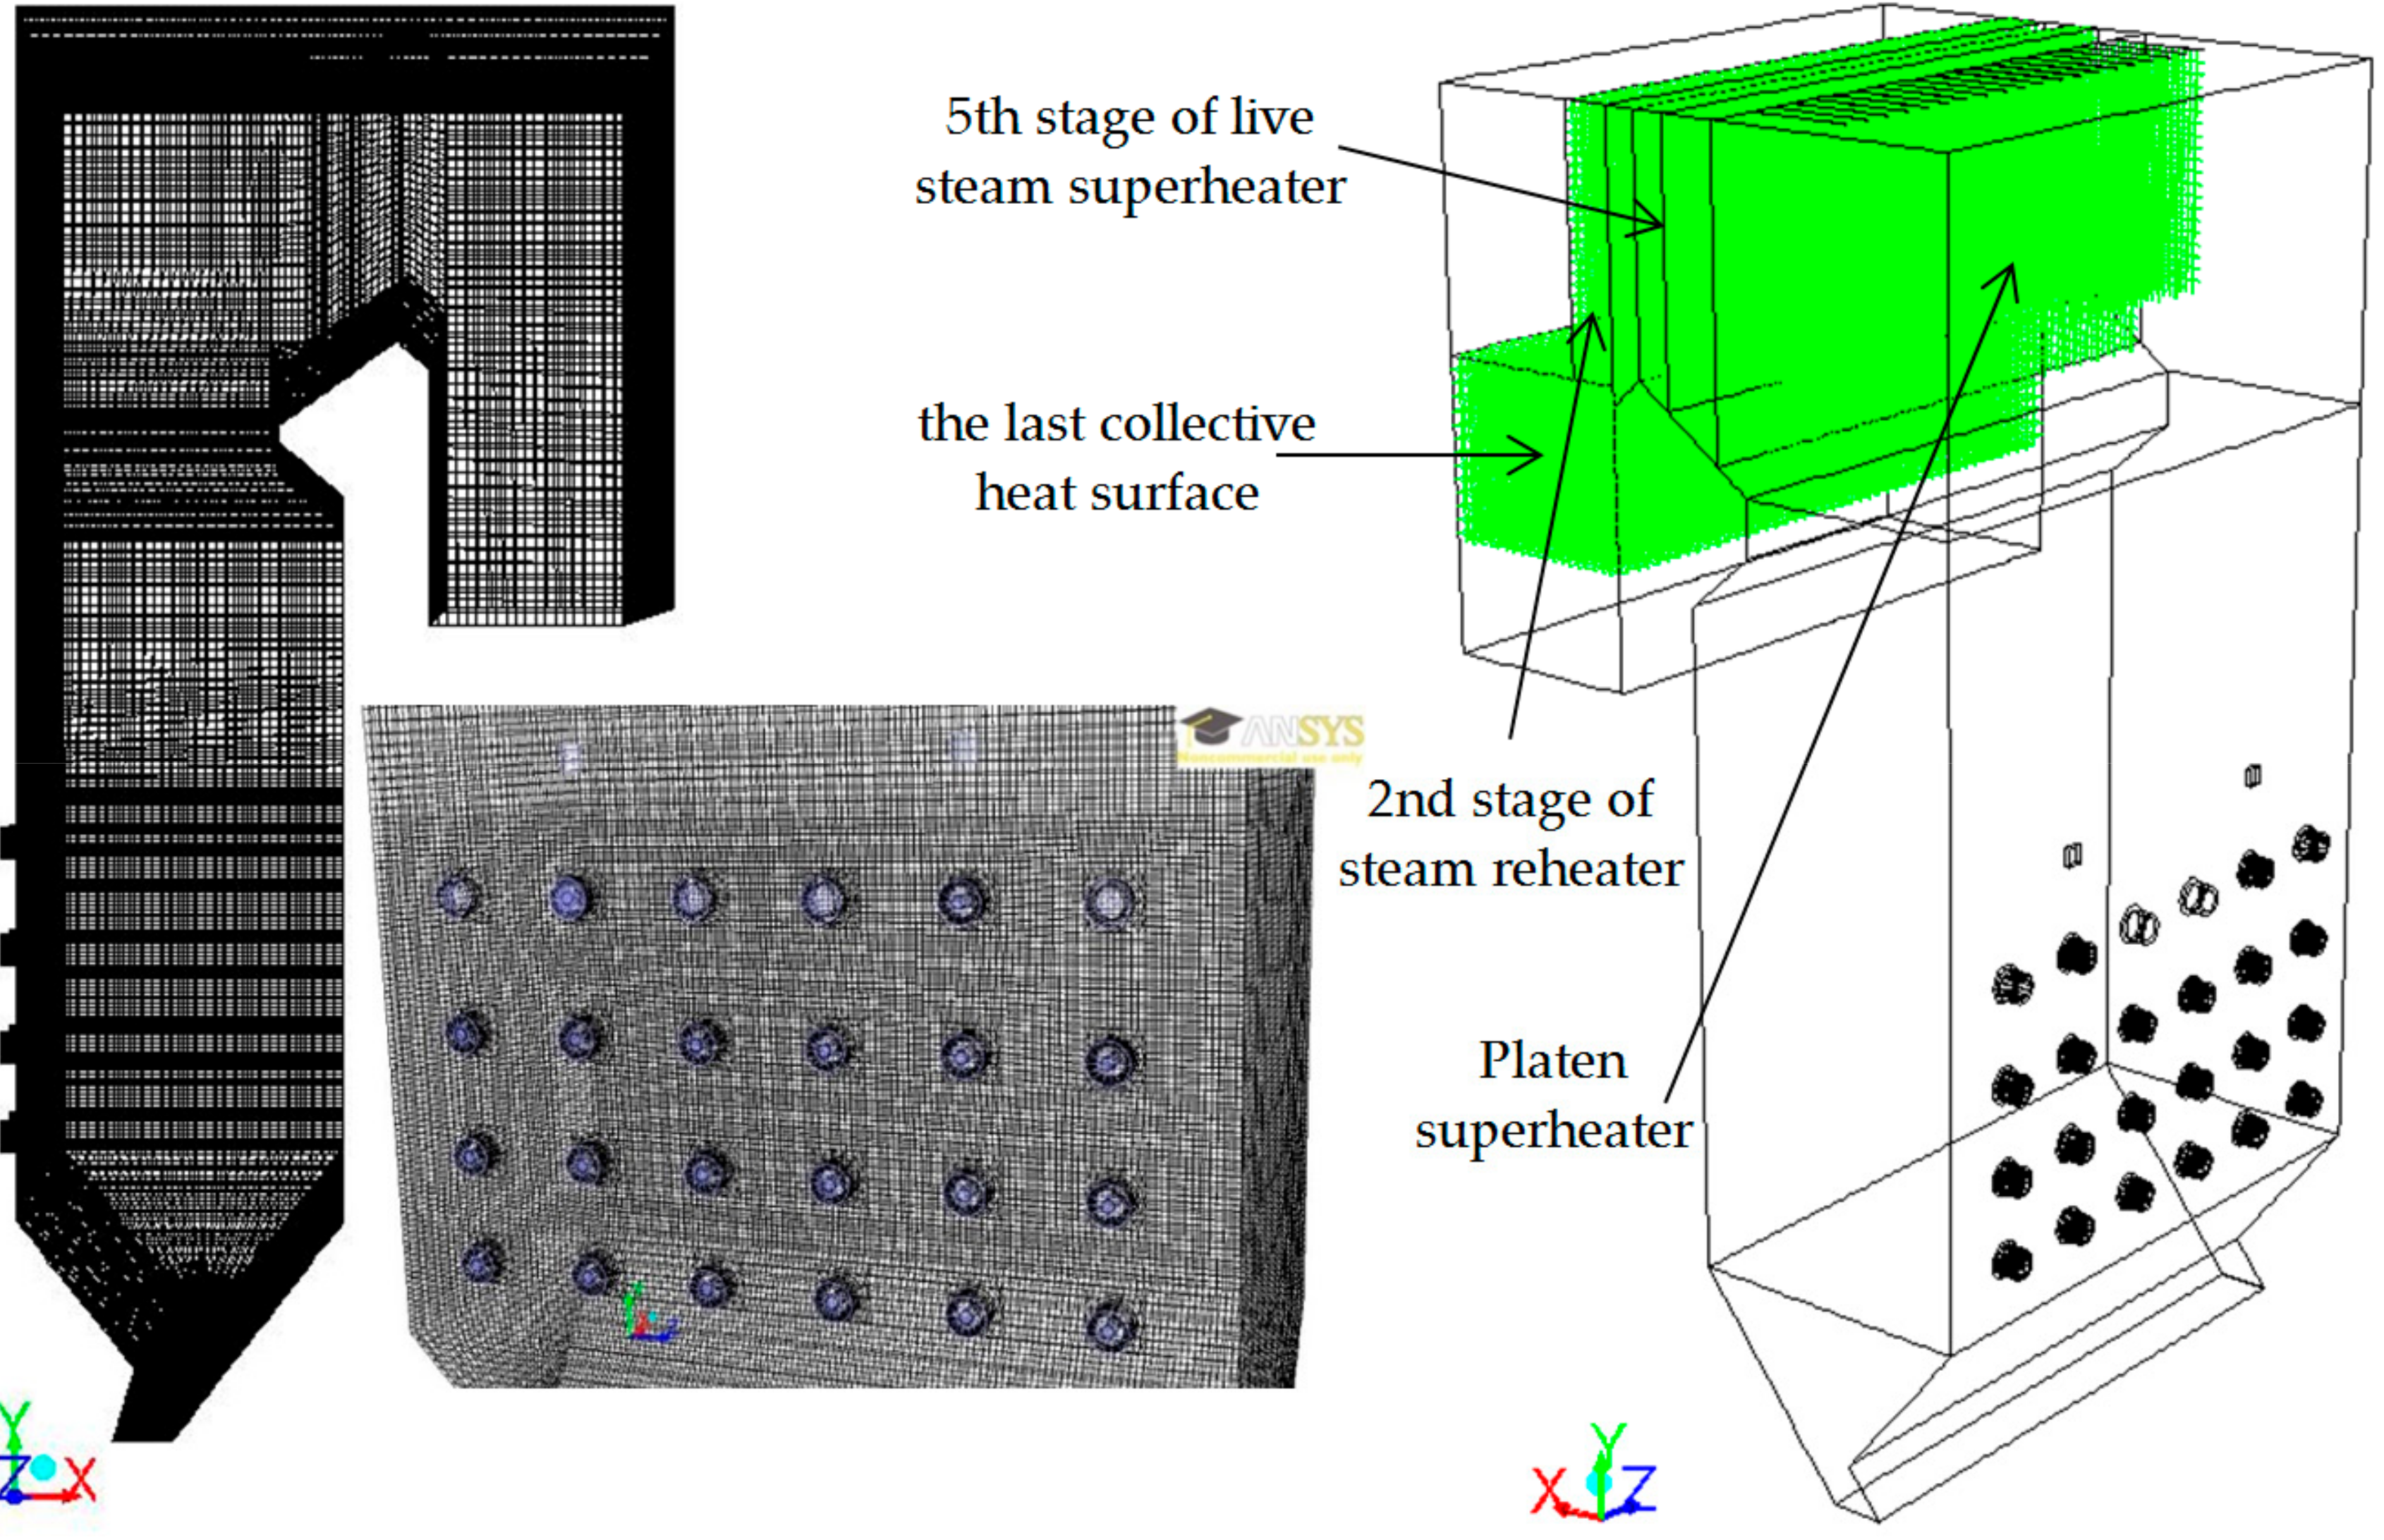
Figure 3.
Cases of swirling the dust–air mixture in burners.
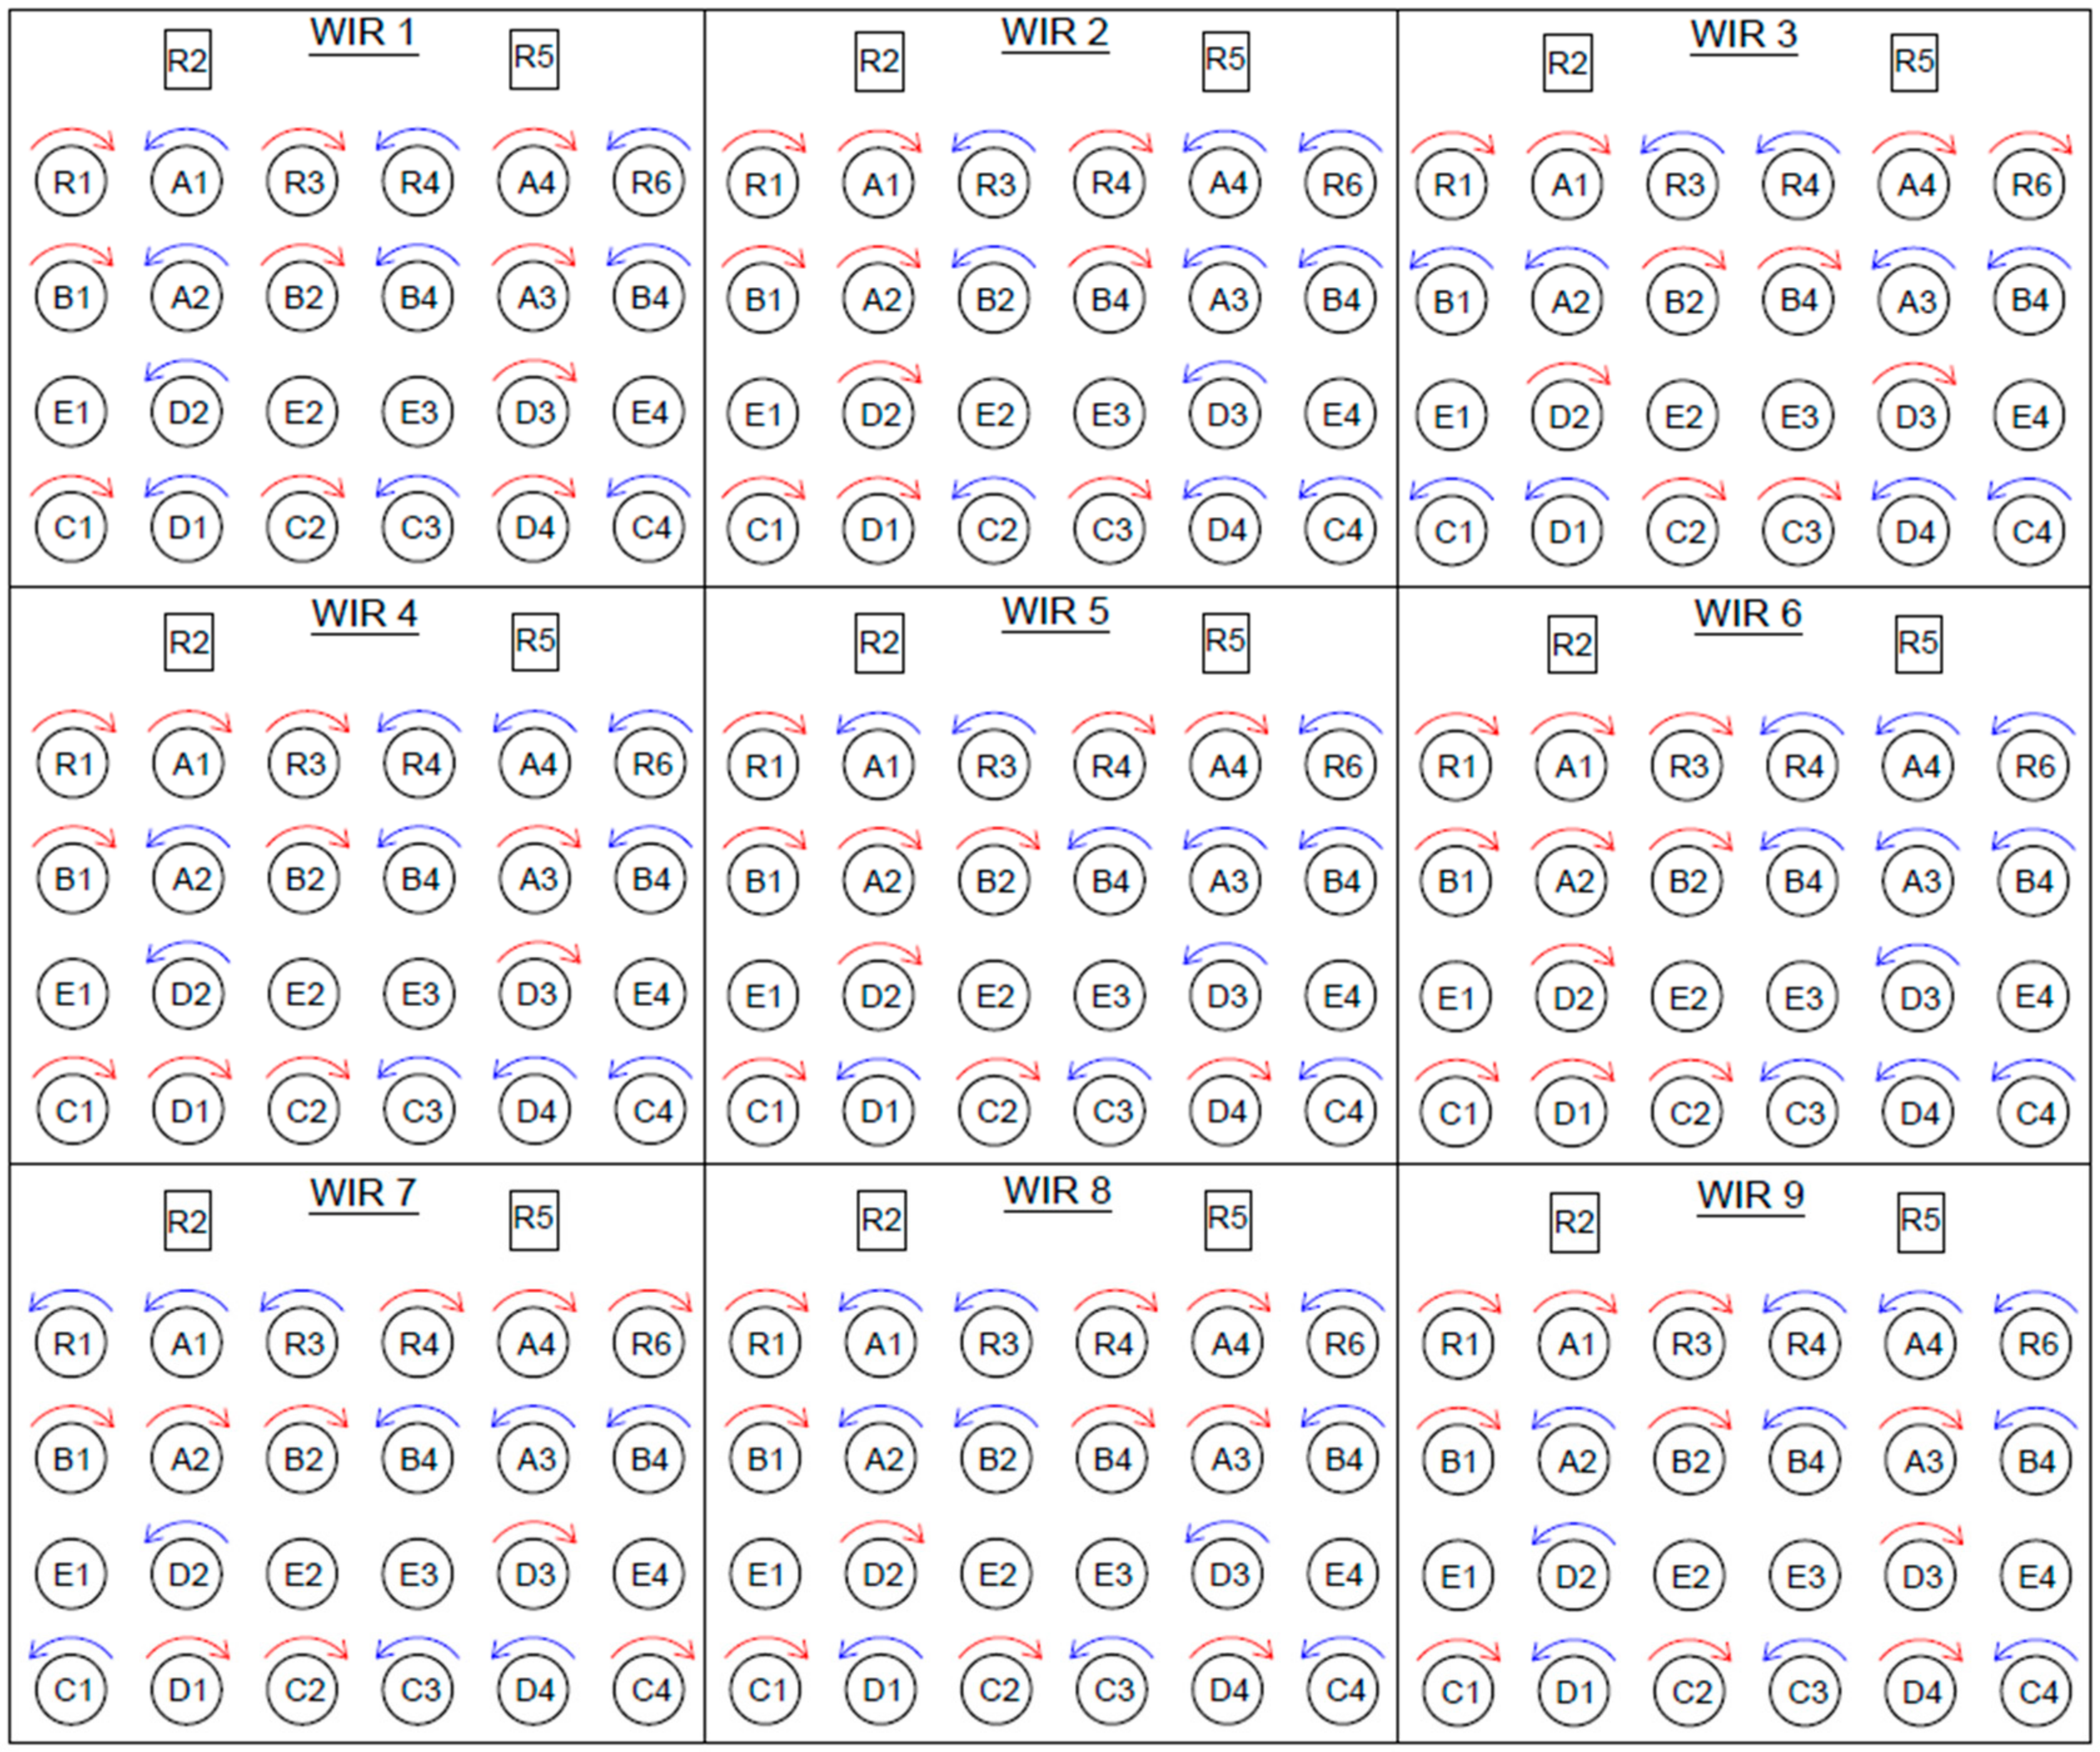
Figure 4.
The temperature of flue gas (K) (left) and NOx mass fraction (right) in burners and OFA nozzle planes for base cases.
Figure 4.
The temperature of flue gas (K) (left) and NOx mass fraction (right) in burners and OFA nozzle planes for base cases.
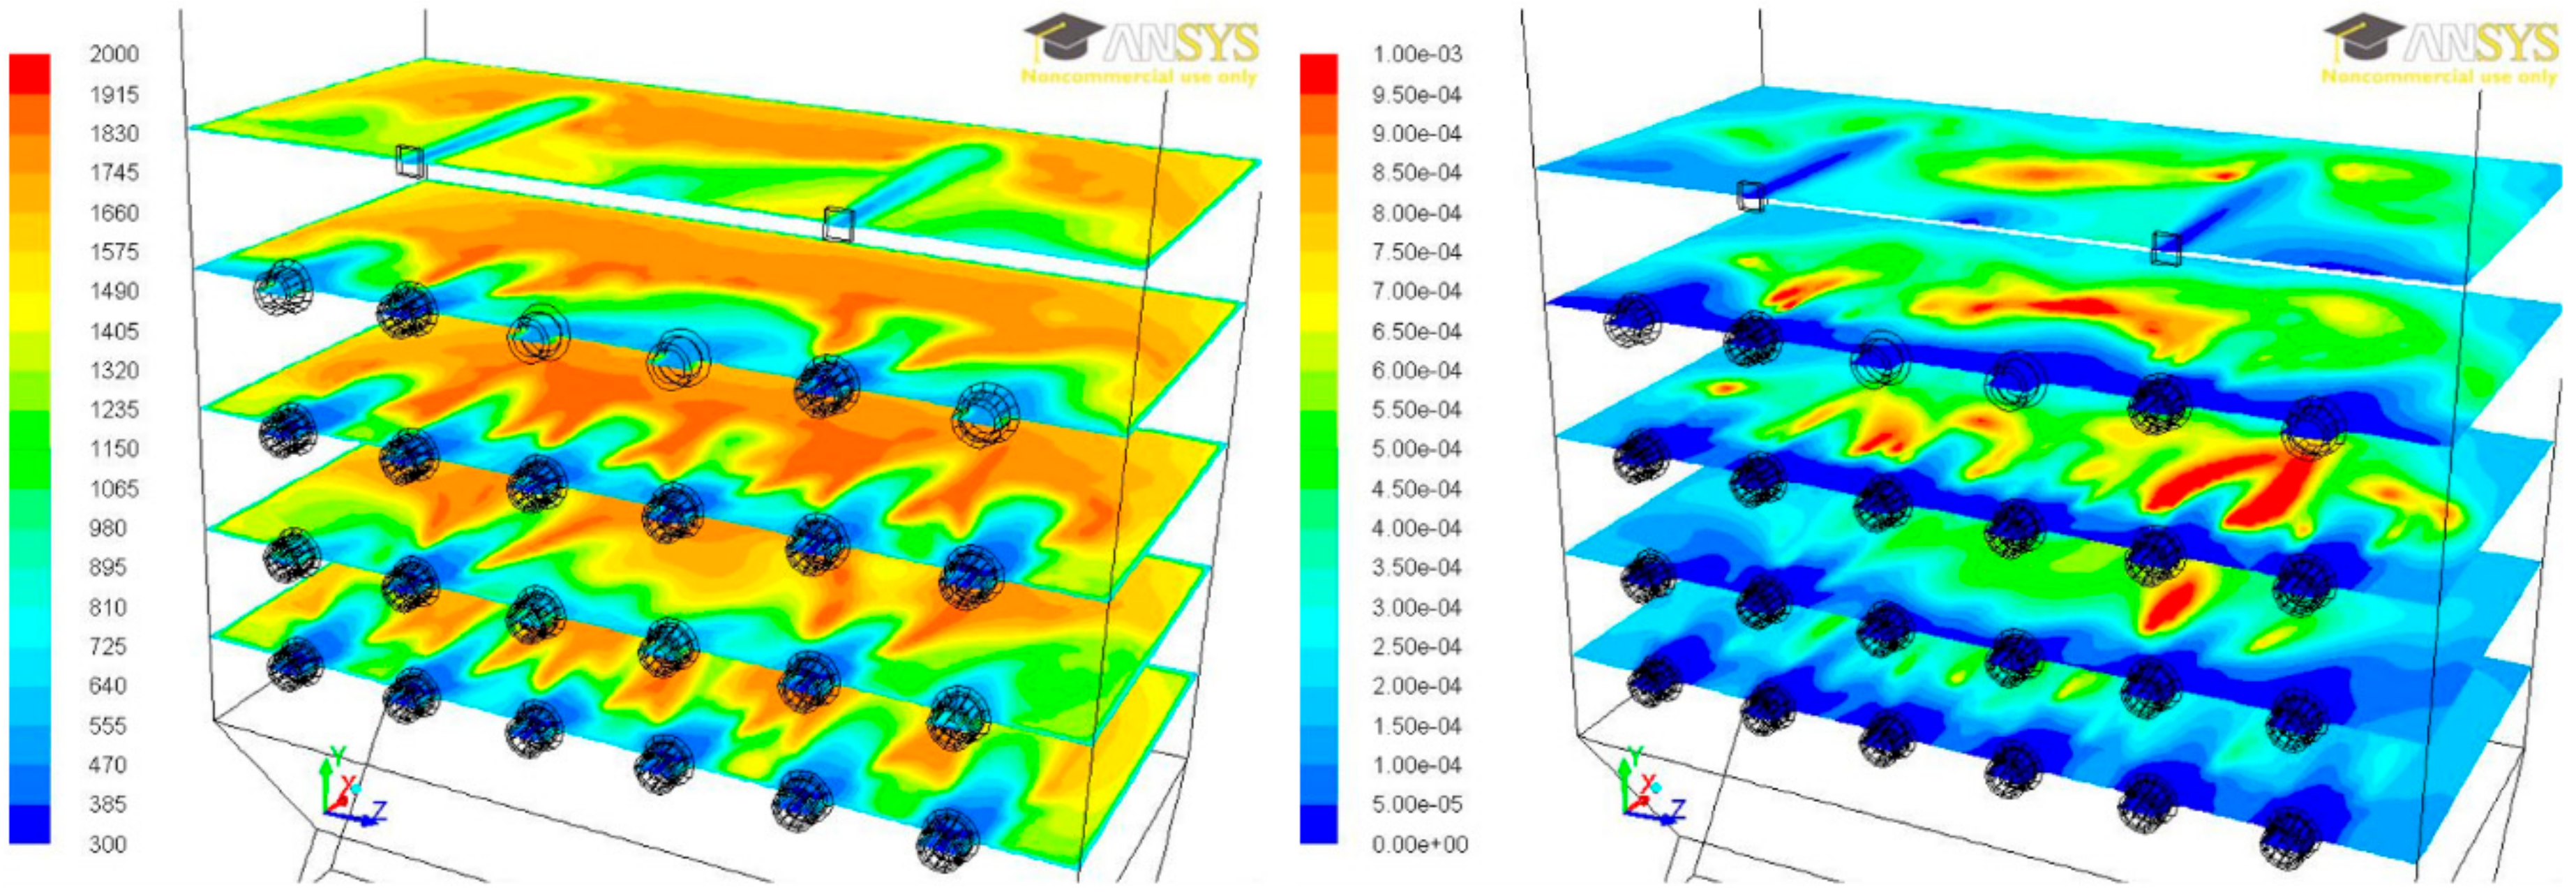
Figure 5.
The temperature of flue gas (K) at the outlet of the furnace (left), O2 (middle), and CO mass fraction (right) in the vertical plane for base cases.
Figure 5.
The temperature of flue gas (K) at the outlet of the furnace (left), O2 (middle), and CO mass fraction (right) in the vertical plane for base cases.

Figure 6.
The dependence of NOx (left) and CO (right) emissions at the model outlet for individual swirl cases.
Figure 6.
The dependence of NOx (left) and CO (right) emissions at the model outlet for individual swirl cases.
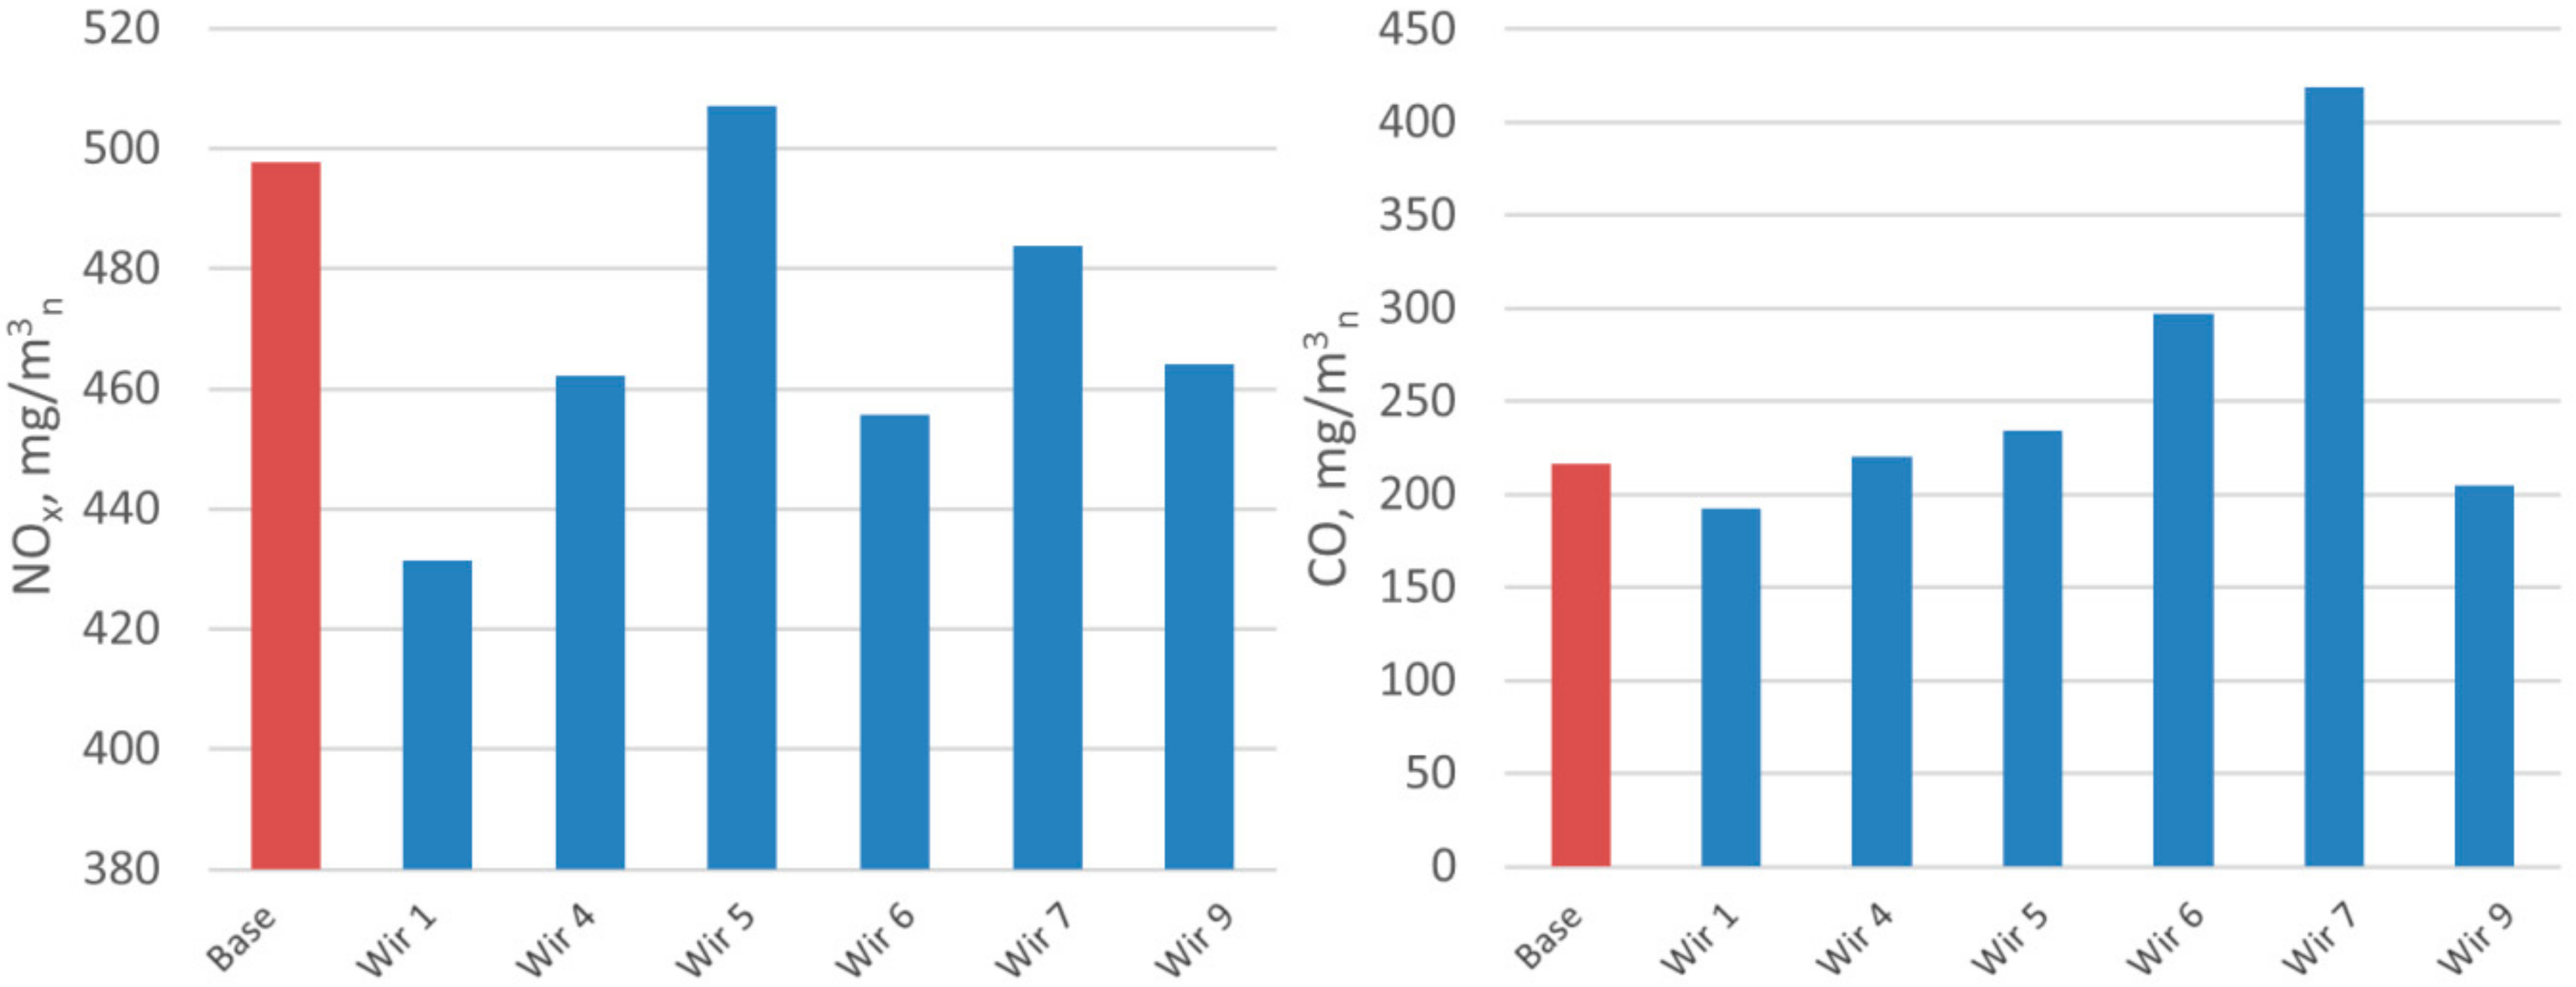
Figure 7.
Temperature of the flue gas (K) at the outlet from the combustion chamber (left) and the decrease in flue gas temperature in the platen superheater (right) for individual swirl cases.
Figure 7.
Temperature of the flue gas (K) at the outlet from the combustion chamber (left) and the decrease in flue gas temperature in the platen superheater (right) for individual swirl cases.
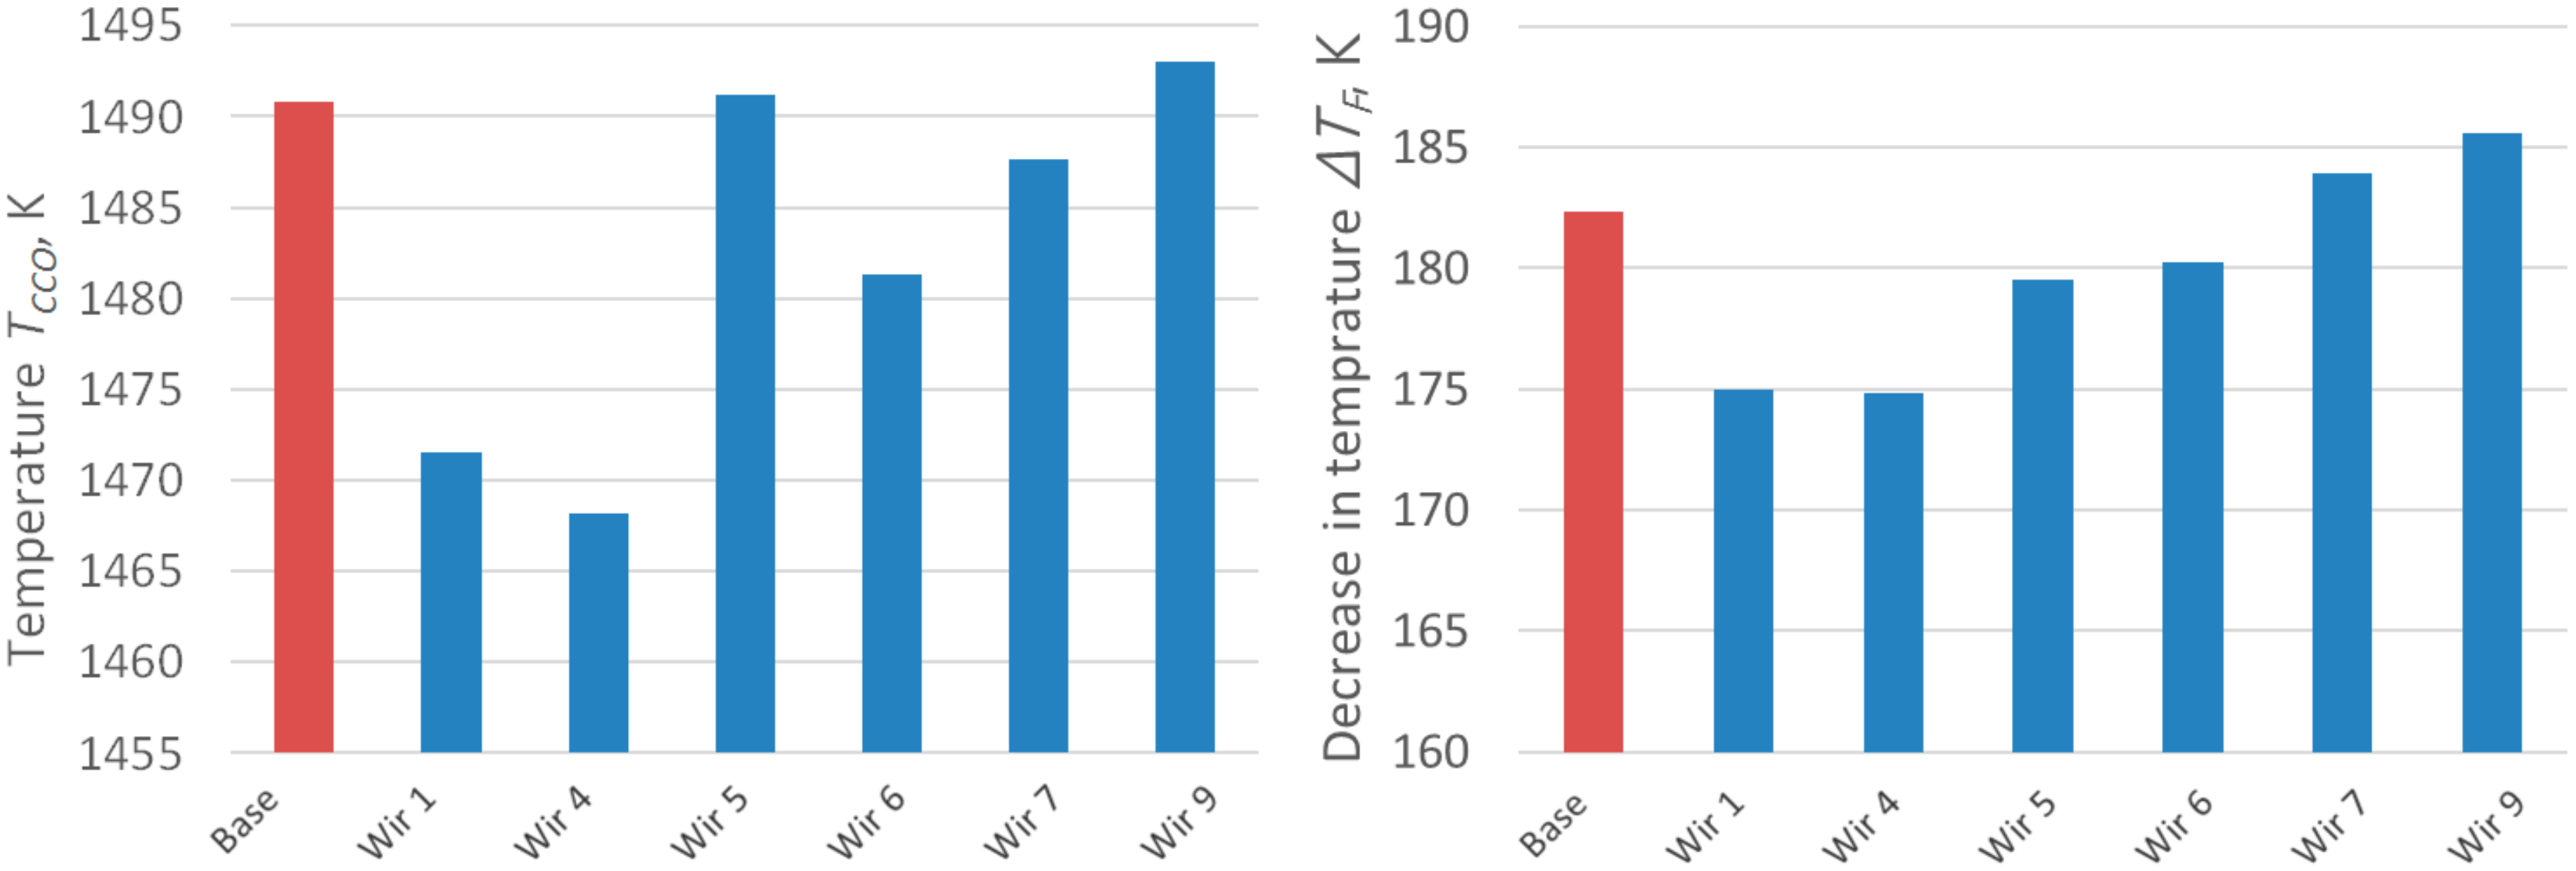
Figure 8.
The dependence of NOx (left) and CO (right) emissions at the model outlet for individual OFA cases.
Figure 8.
The dependence of NOx (left) and CO (right) emissions at the model outlet for individual OFA cases.
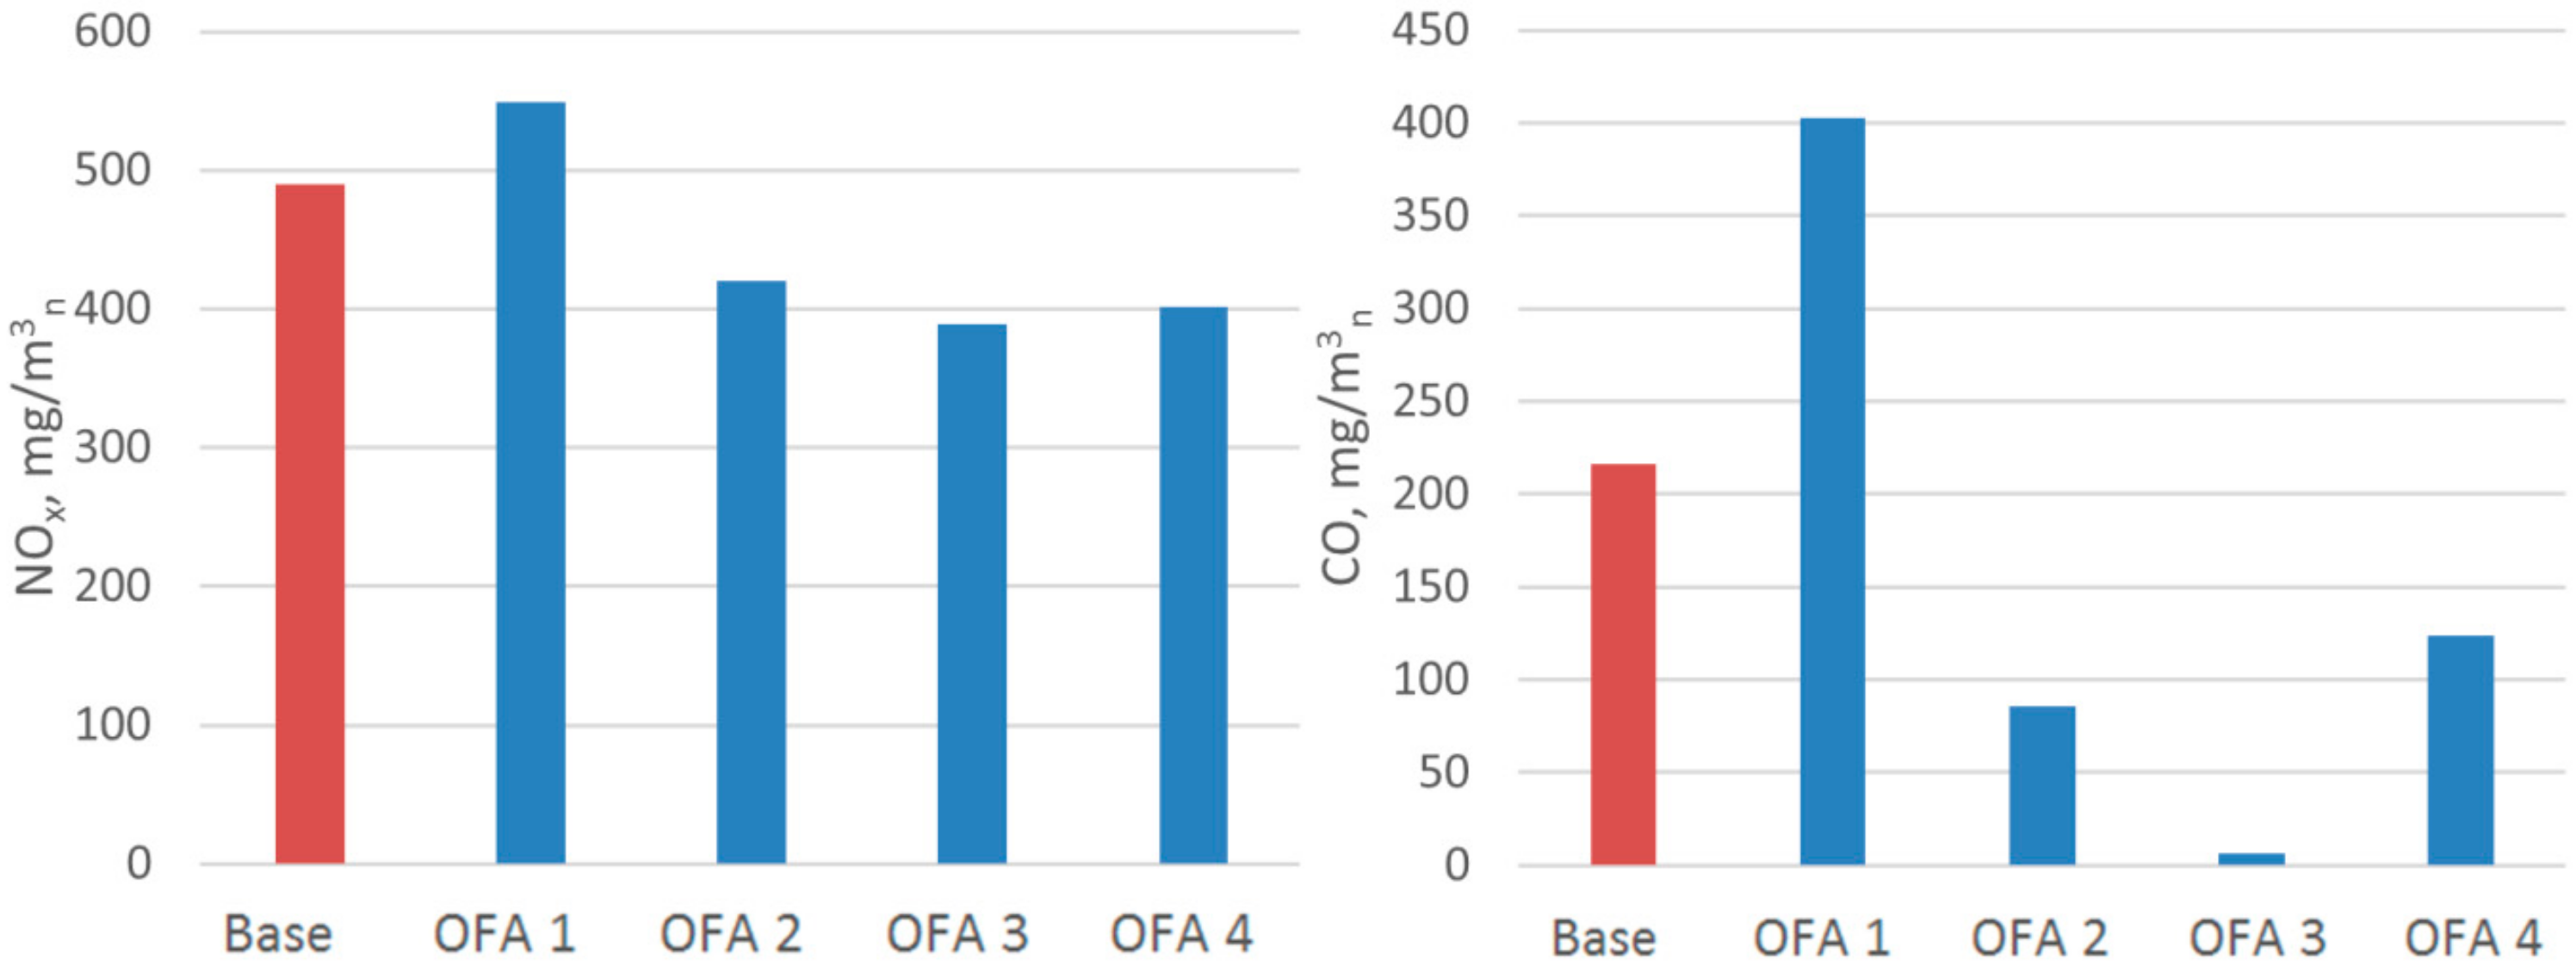
Figure 9.
Temperature of the flue gas (K) at the outlet from the combustion chamber (left) and the decrease in flue gas temperature in the platen superheater (right) for individual OFA cases.
Figure 9.
Temperature of the flue gas (K) at the outlet from the combustion chamber (left) and the decrease in flue gas temperature in the platen superheater (right) for individual OFA cases.

Figure 10.
The temperature of flue gas (K) in burners and OFA nozzle planes for swirl cases.
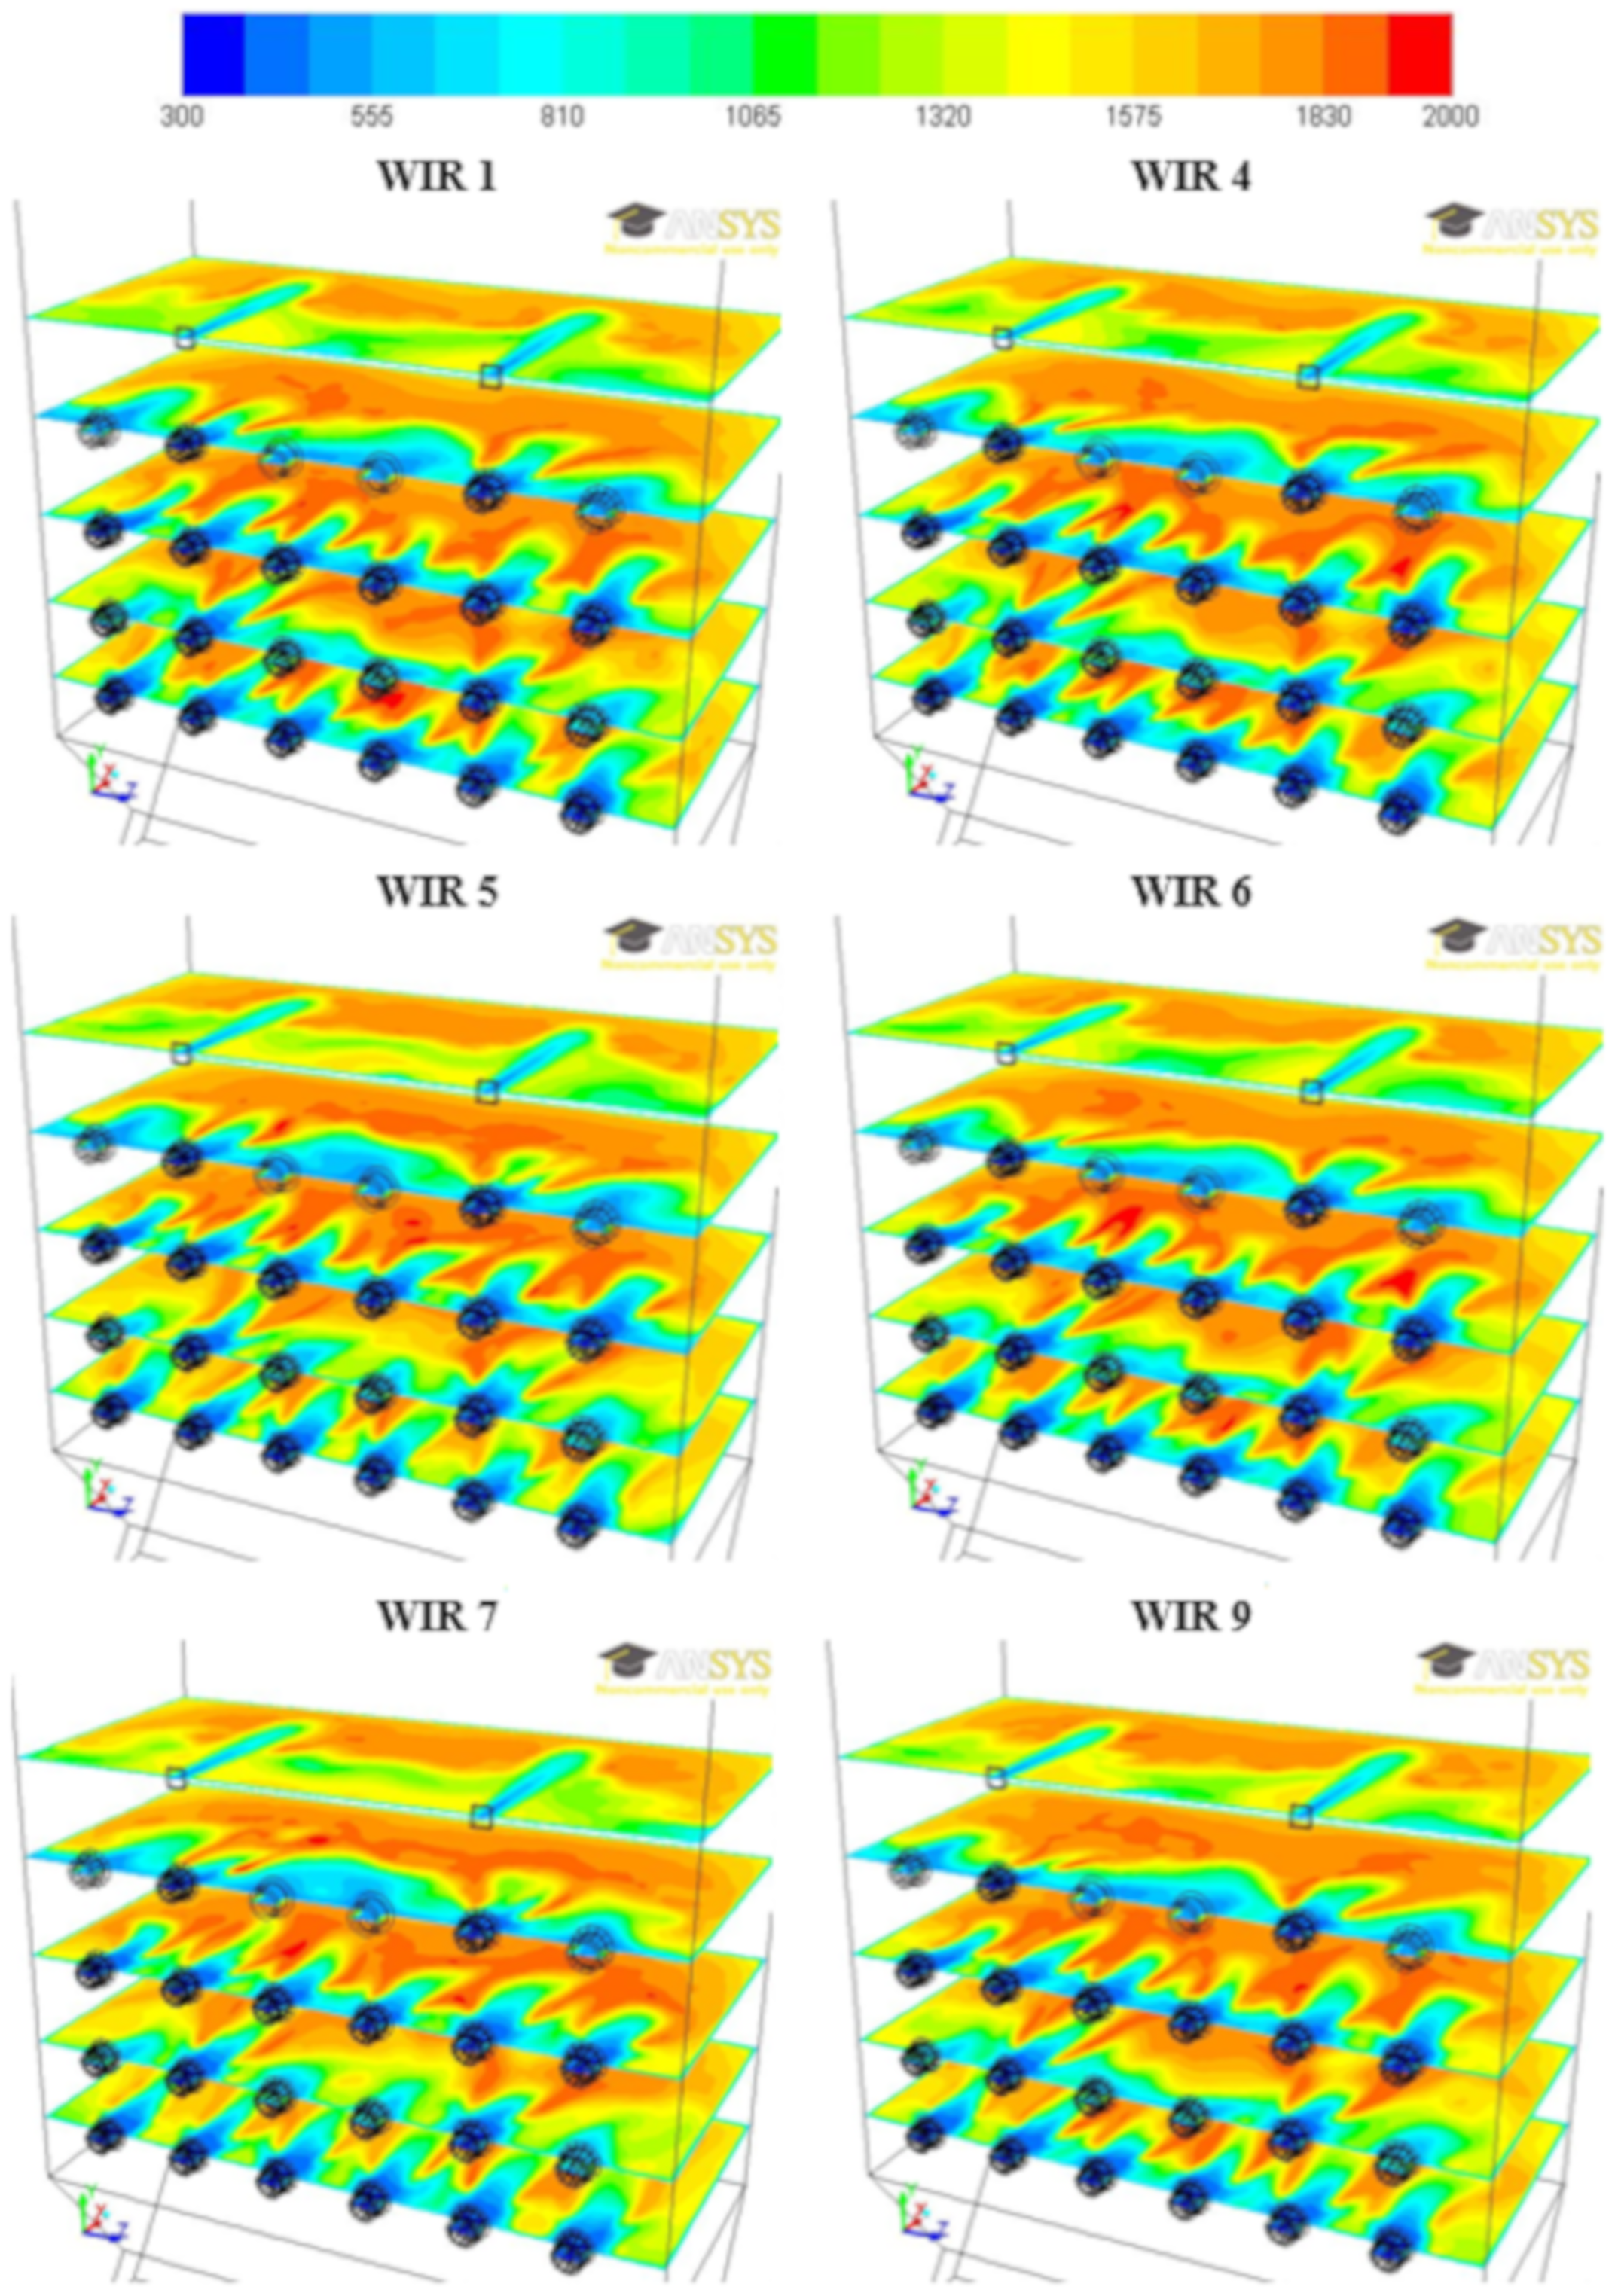
Figure 11.
The temperature of flue gas (K) in burners and OFA nozzle planes for OFA cases.
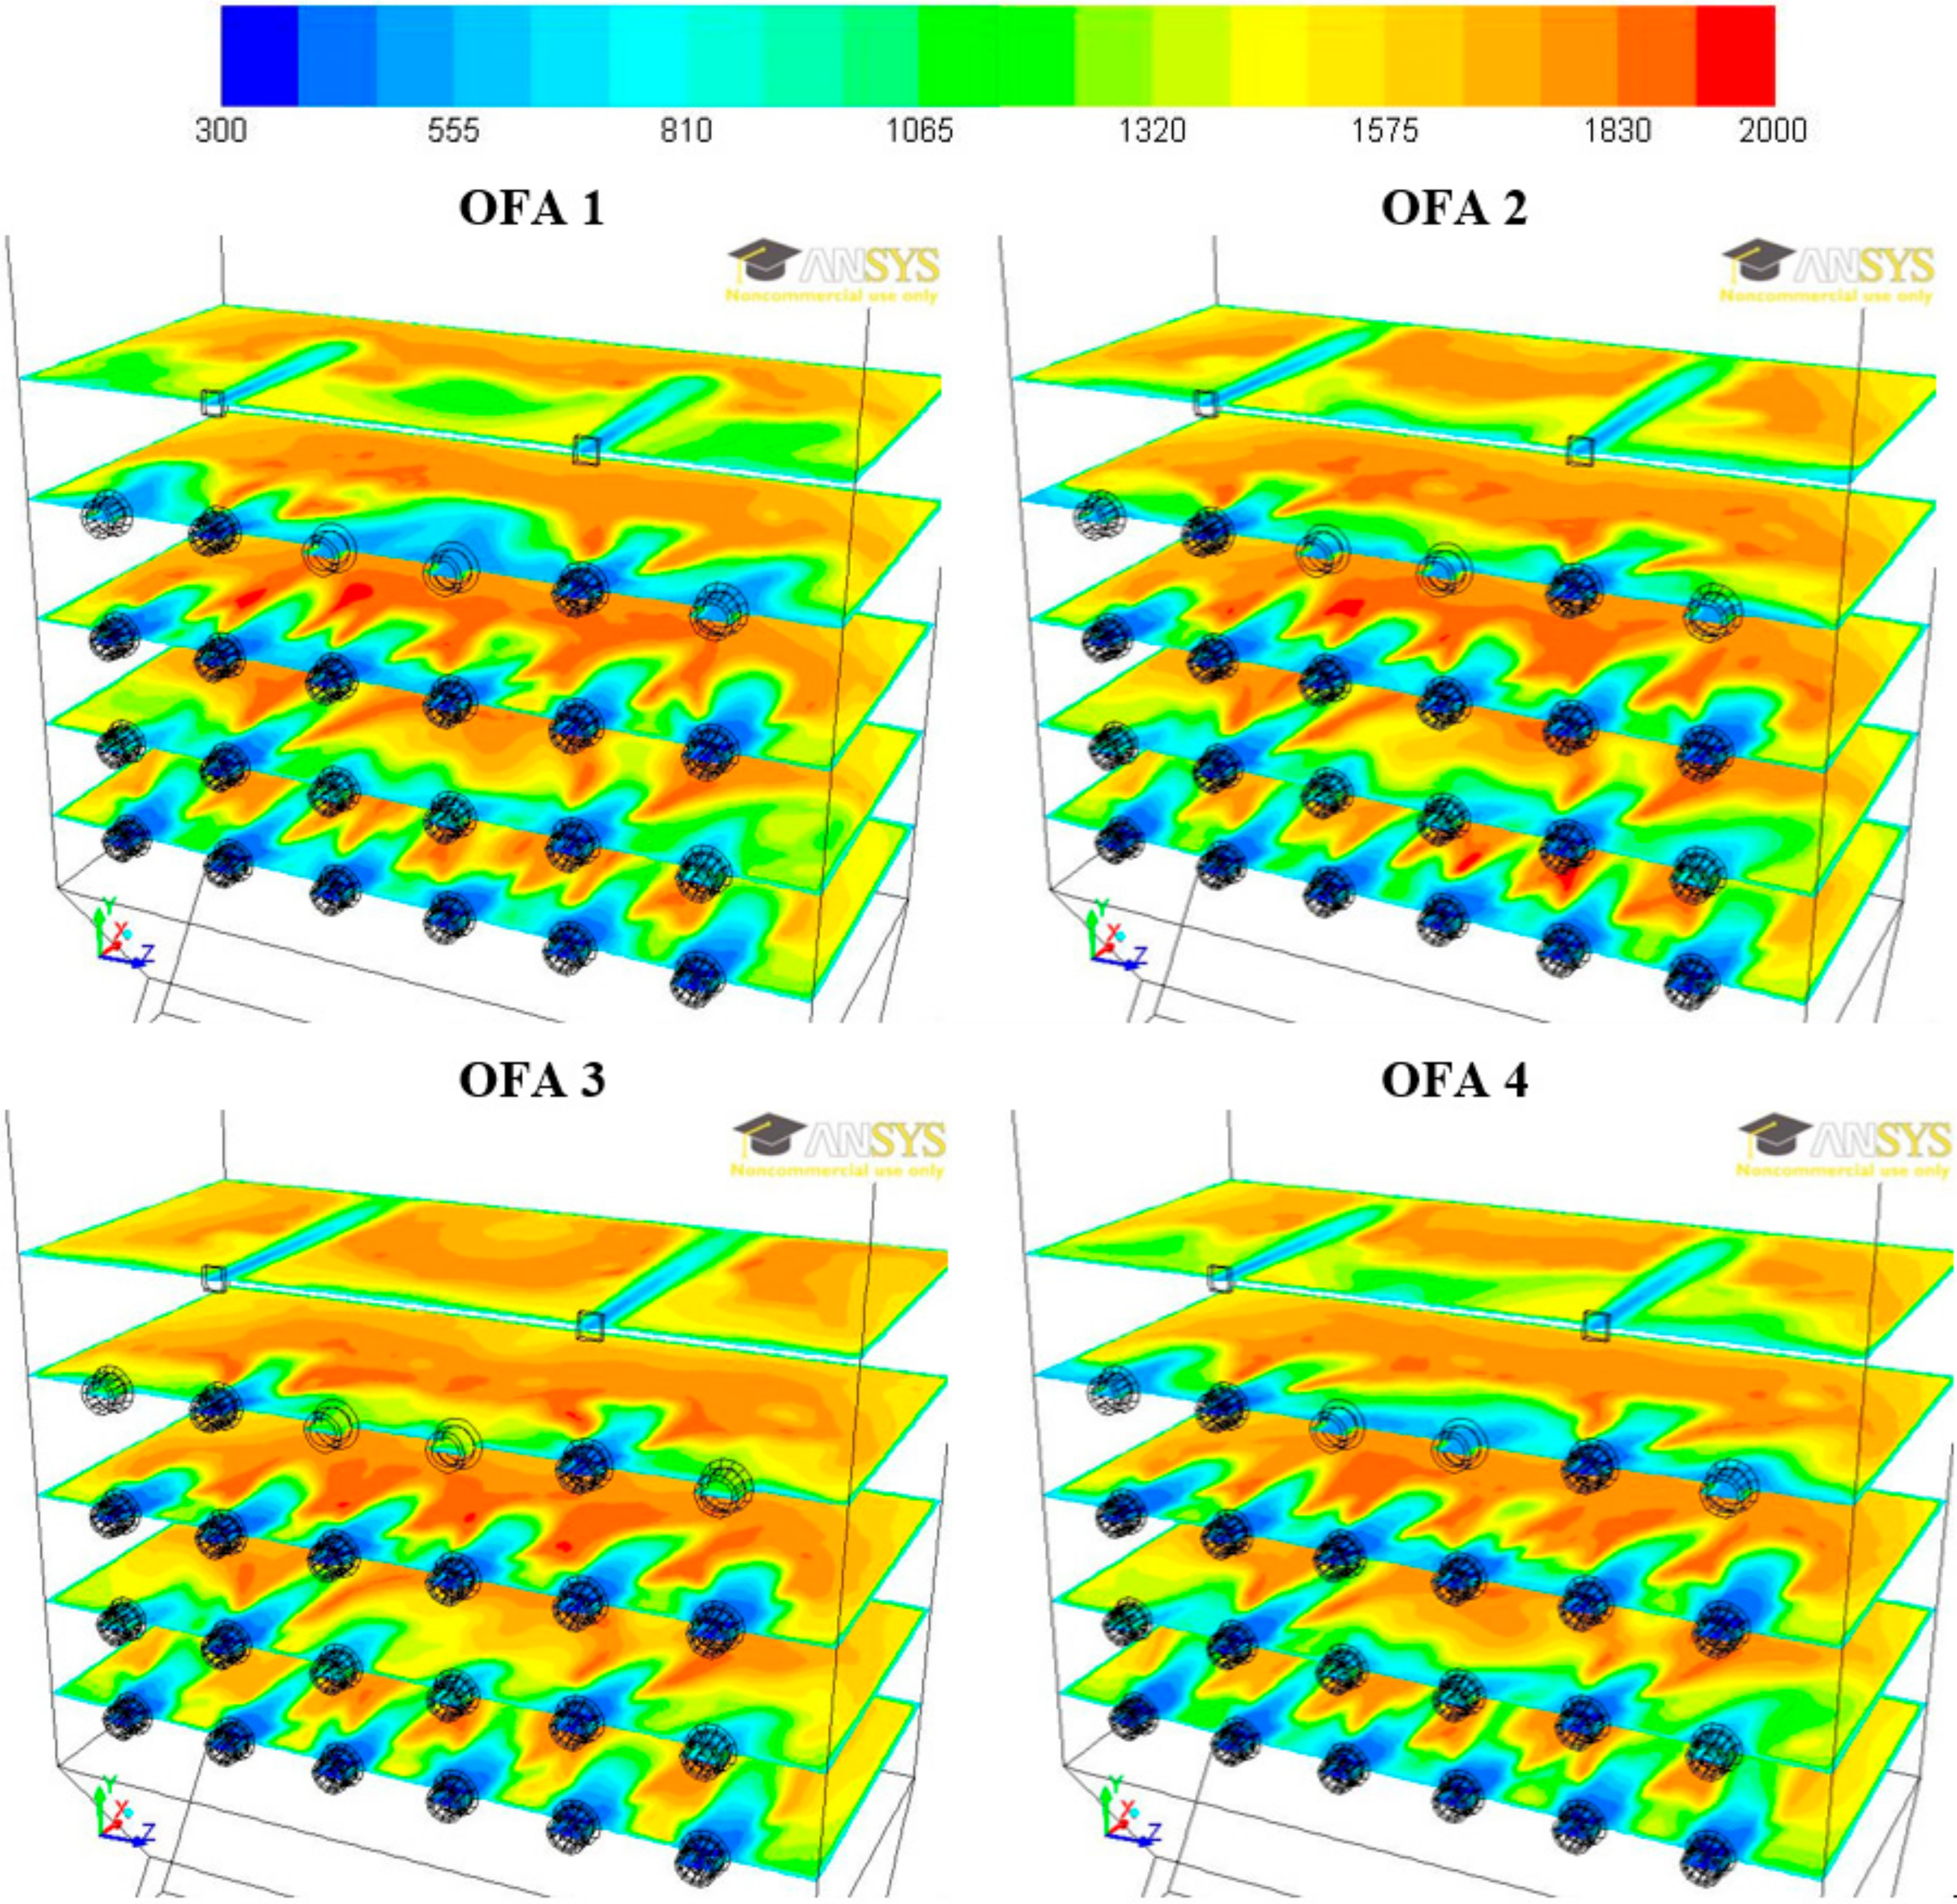
Figure 12.
The mass fraction of NOx in burners and OFA nozzle planes for swirl cases.

Figure 13.
The mass fraction of NOx in burners and OFA nozzle planes for OFA cases.
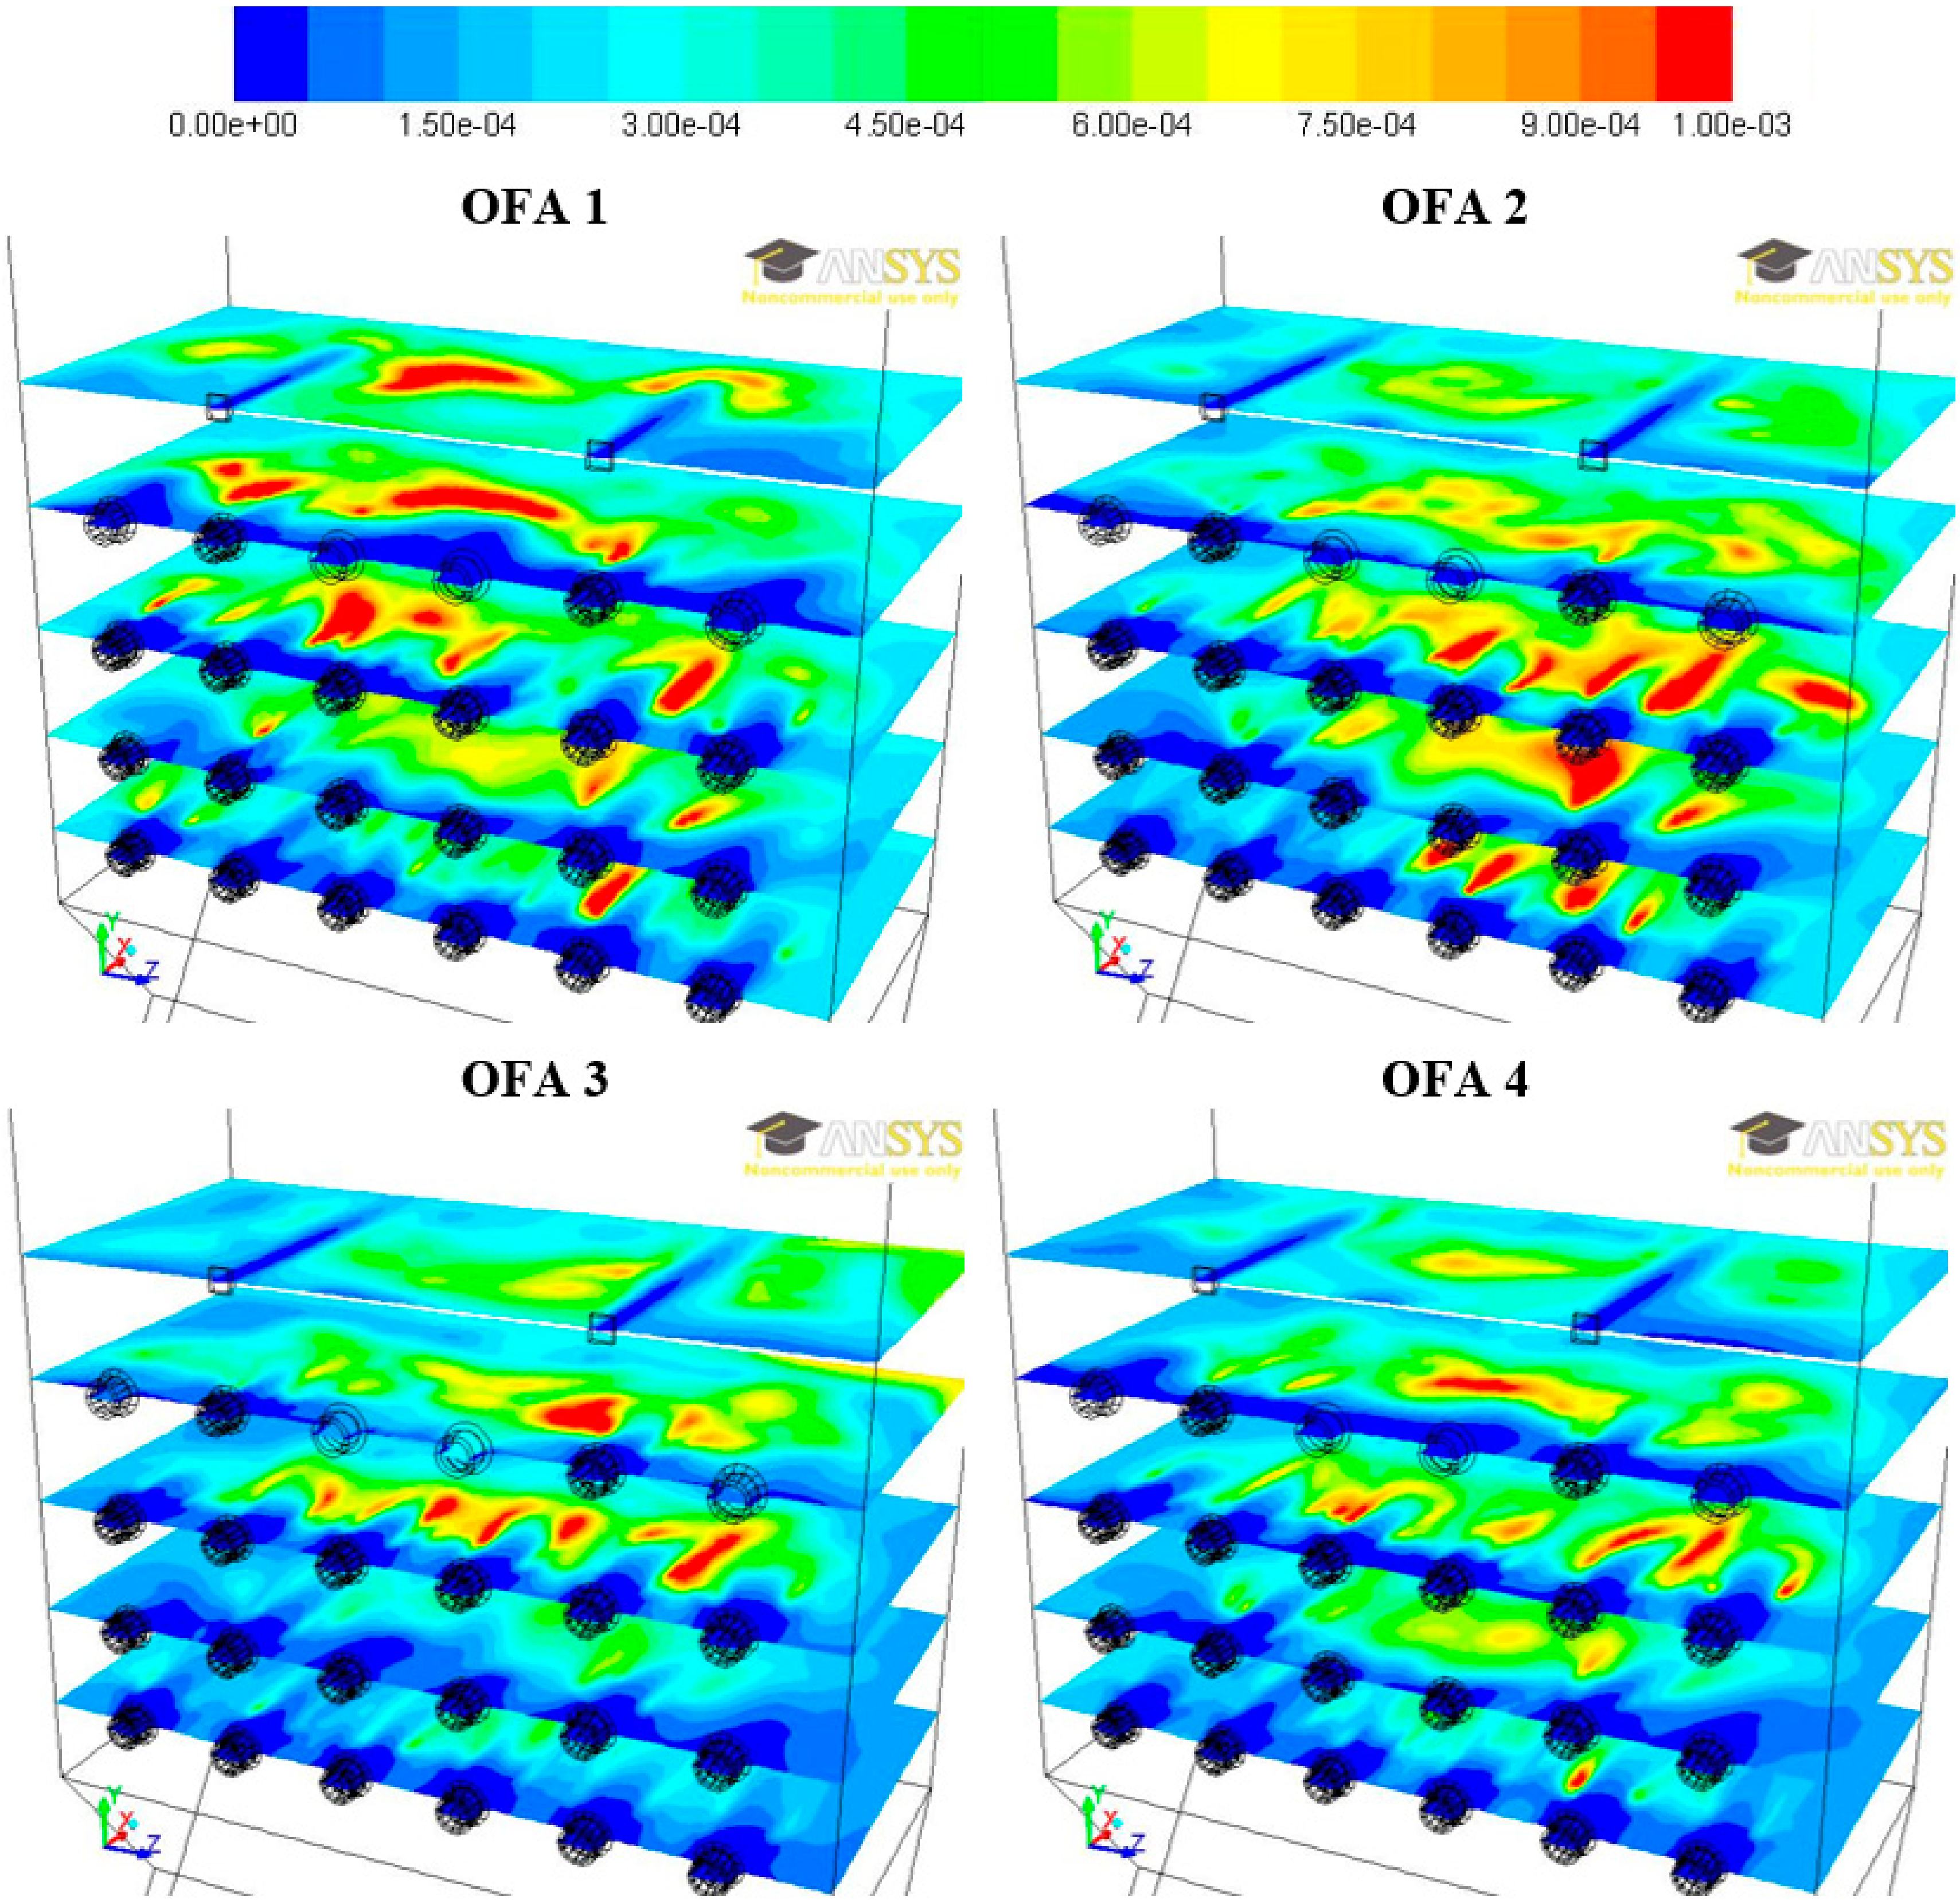
Figure 14.
Distribution of flue gas temperature (K) at the outlet of the chamber for swirl cases.
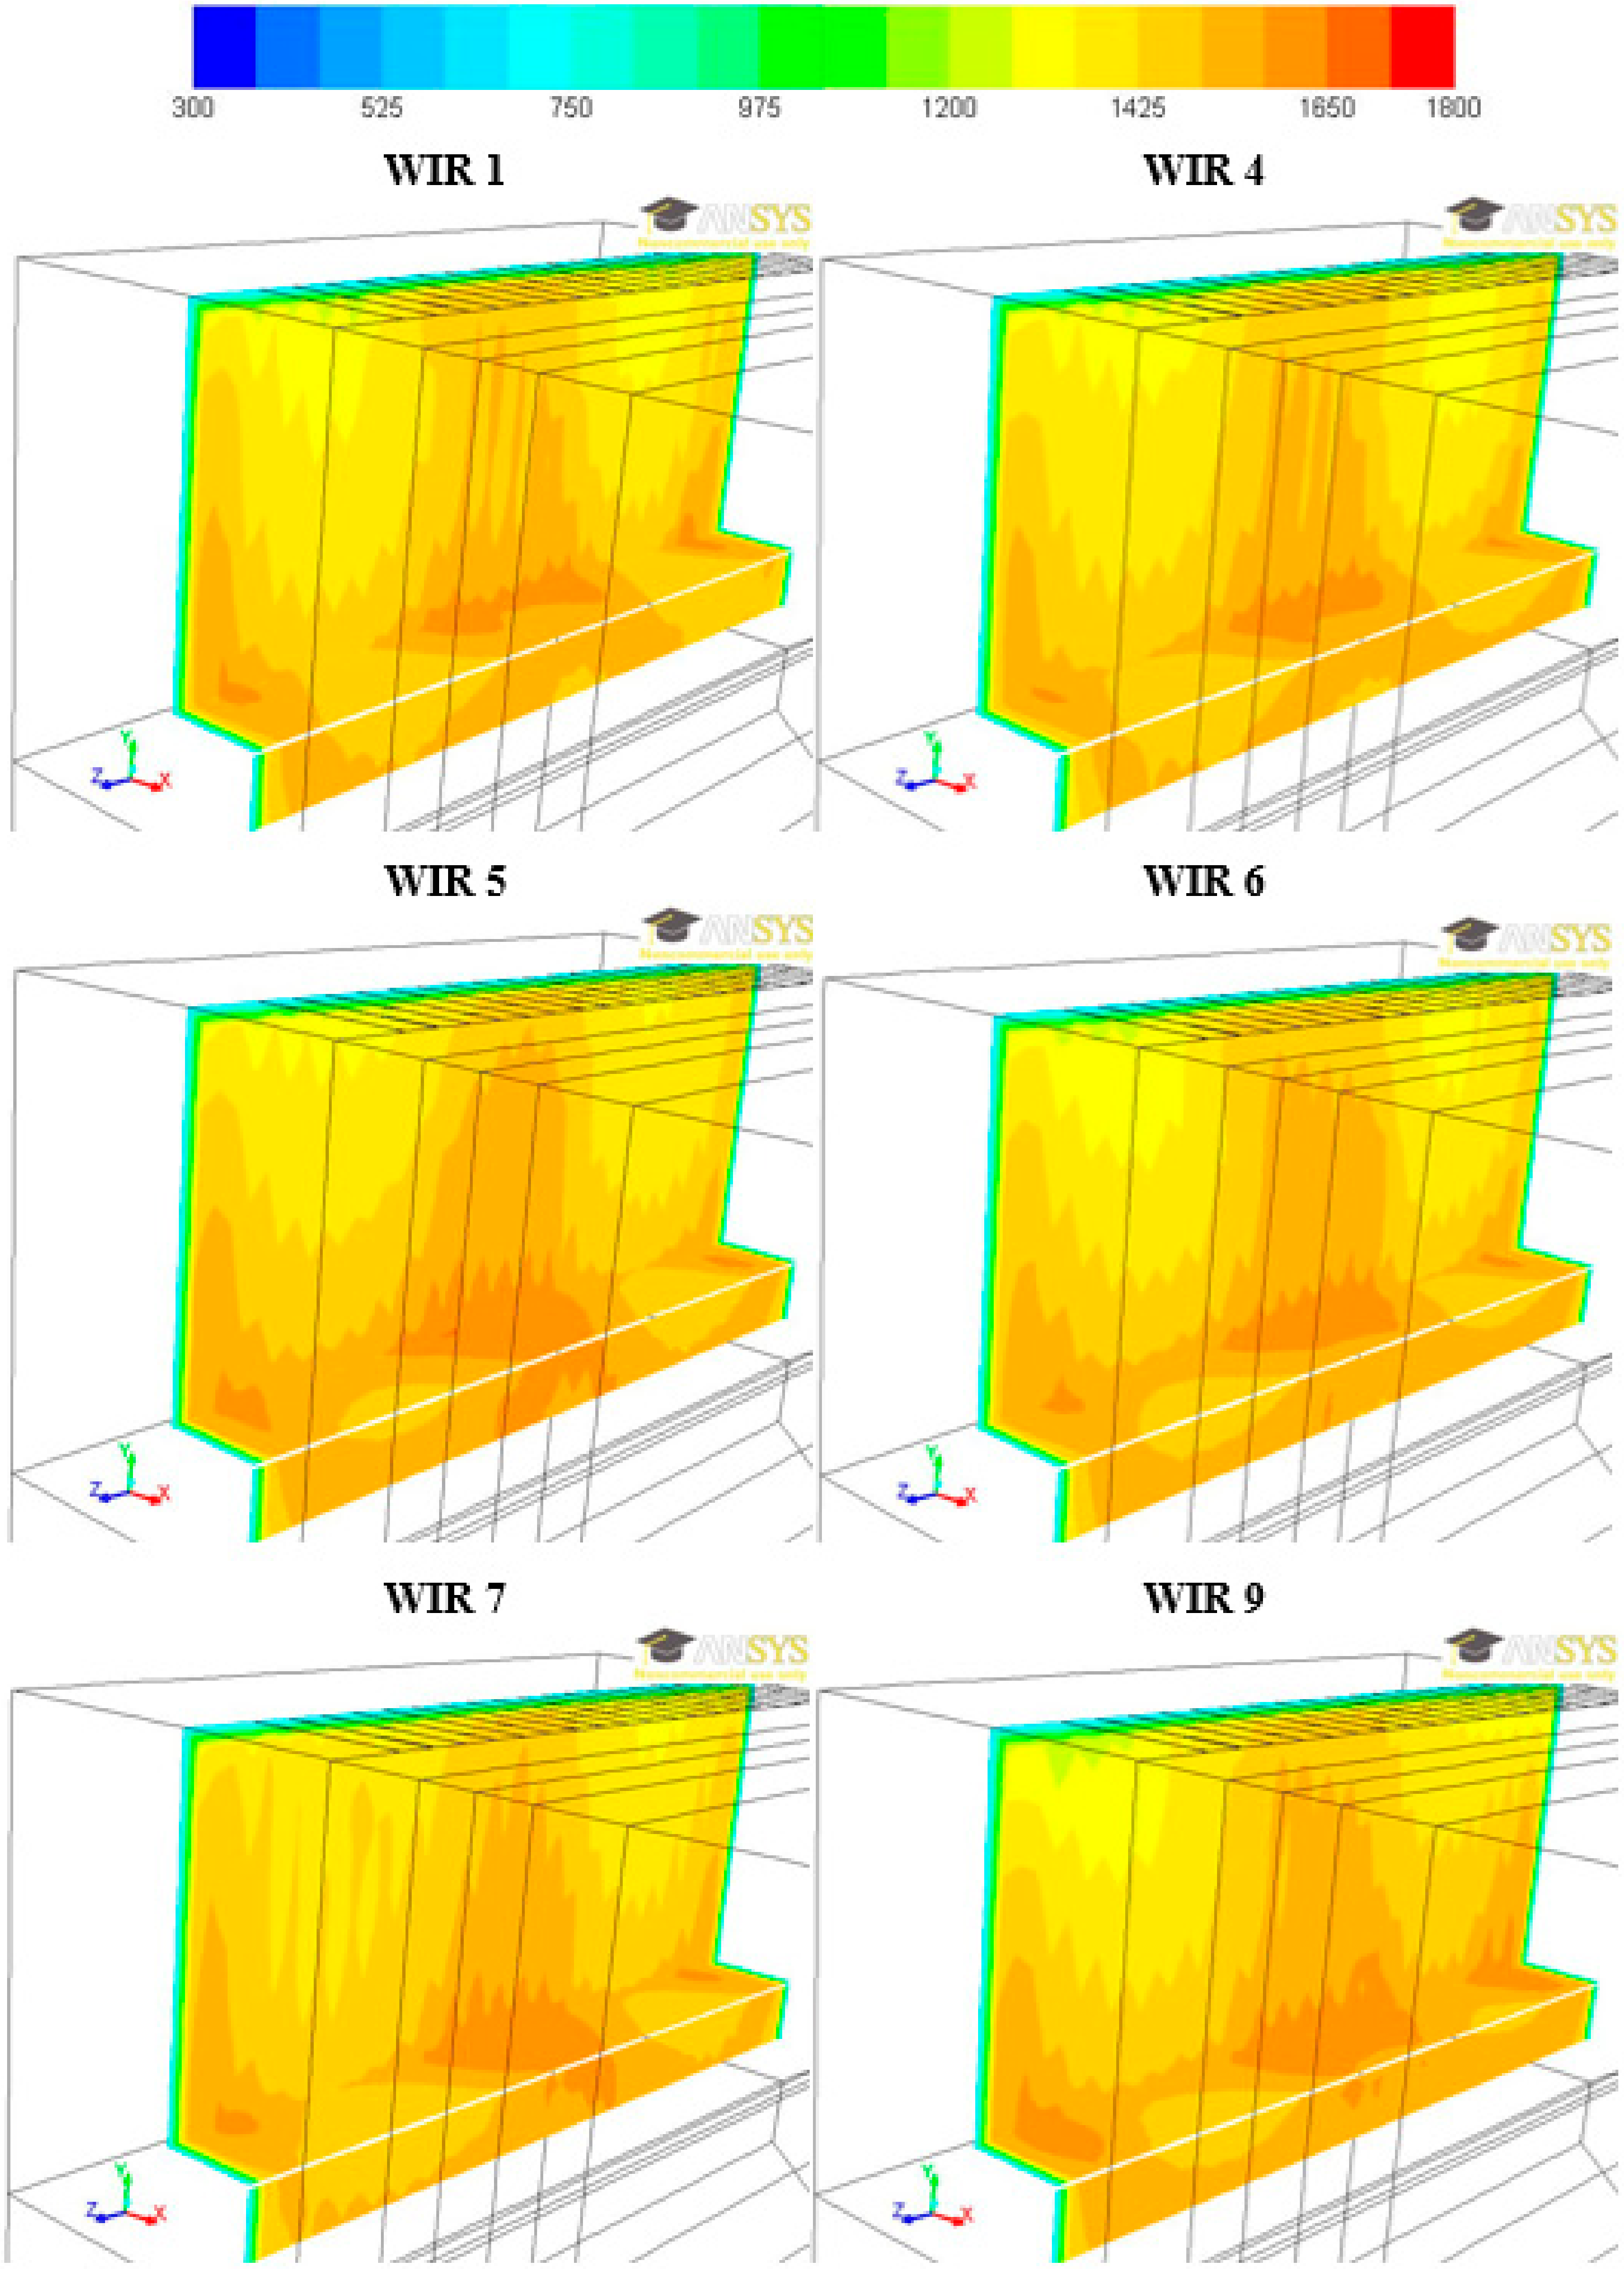
Figure 15.
Distribution of flue gas temperature (K) at the outlet of the chamber for OFA cases.

Figure 16.
The mass fraction of O2 in the vertical plane of the boiler for the swirl and OFA cases.
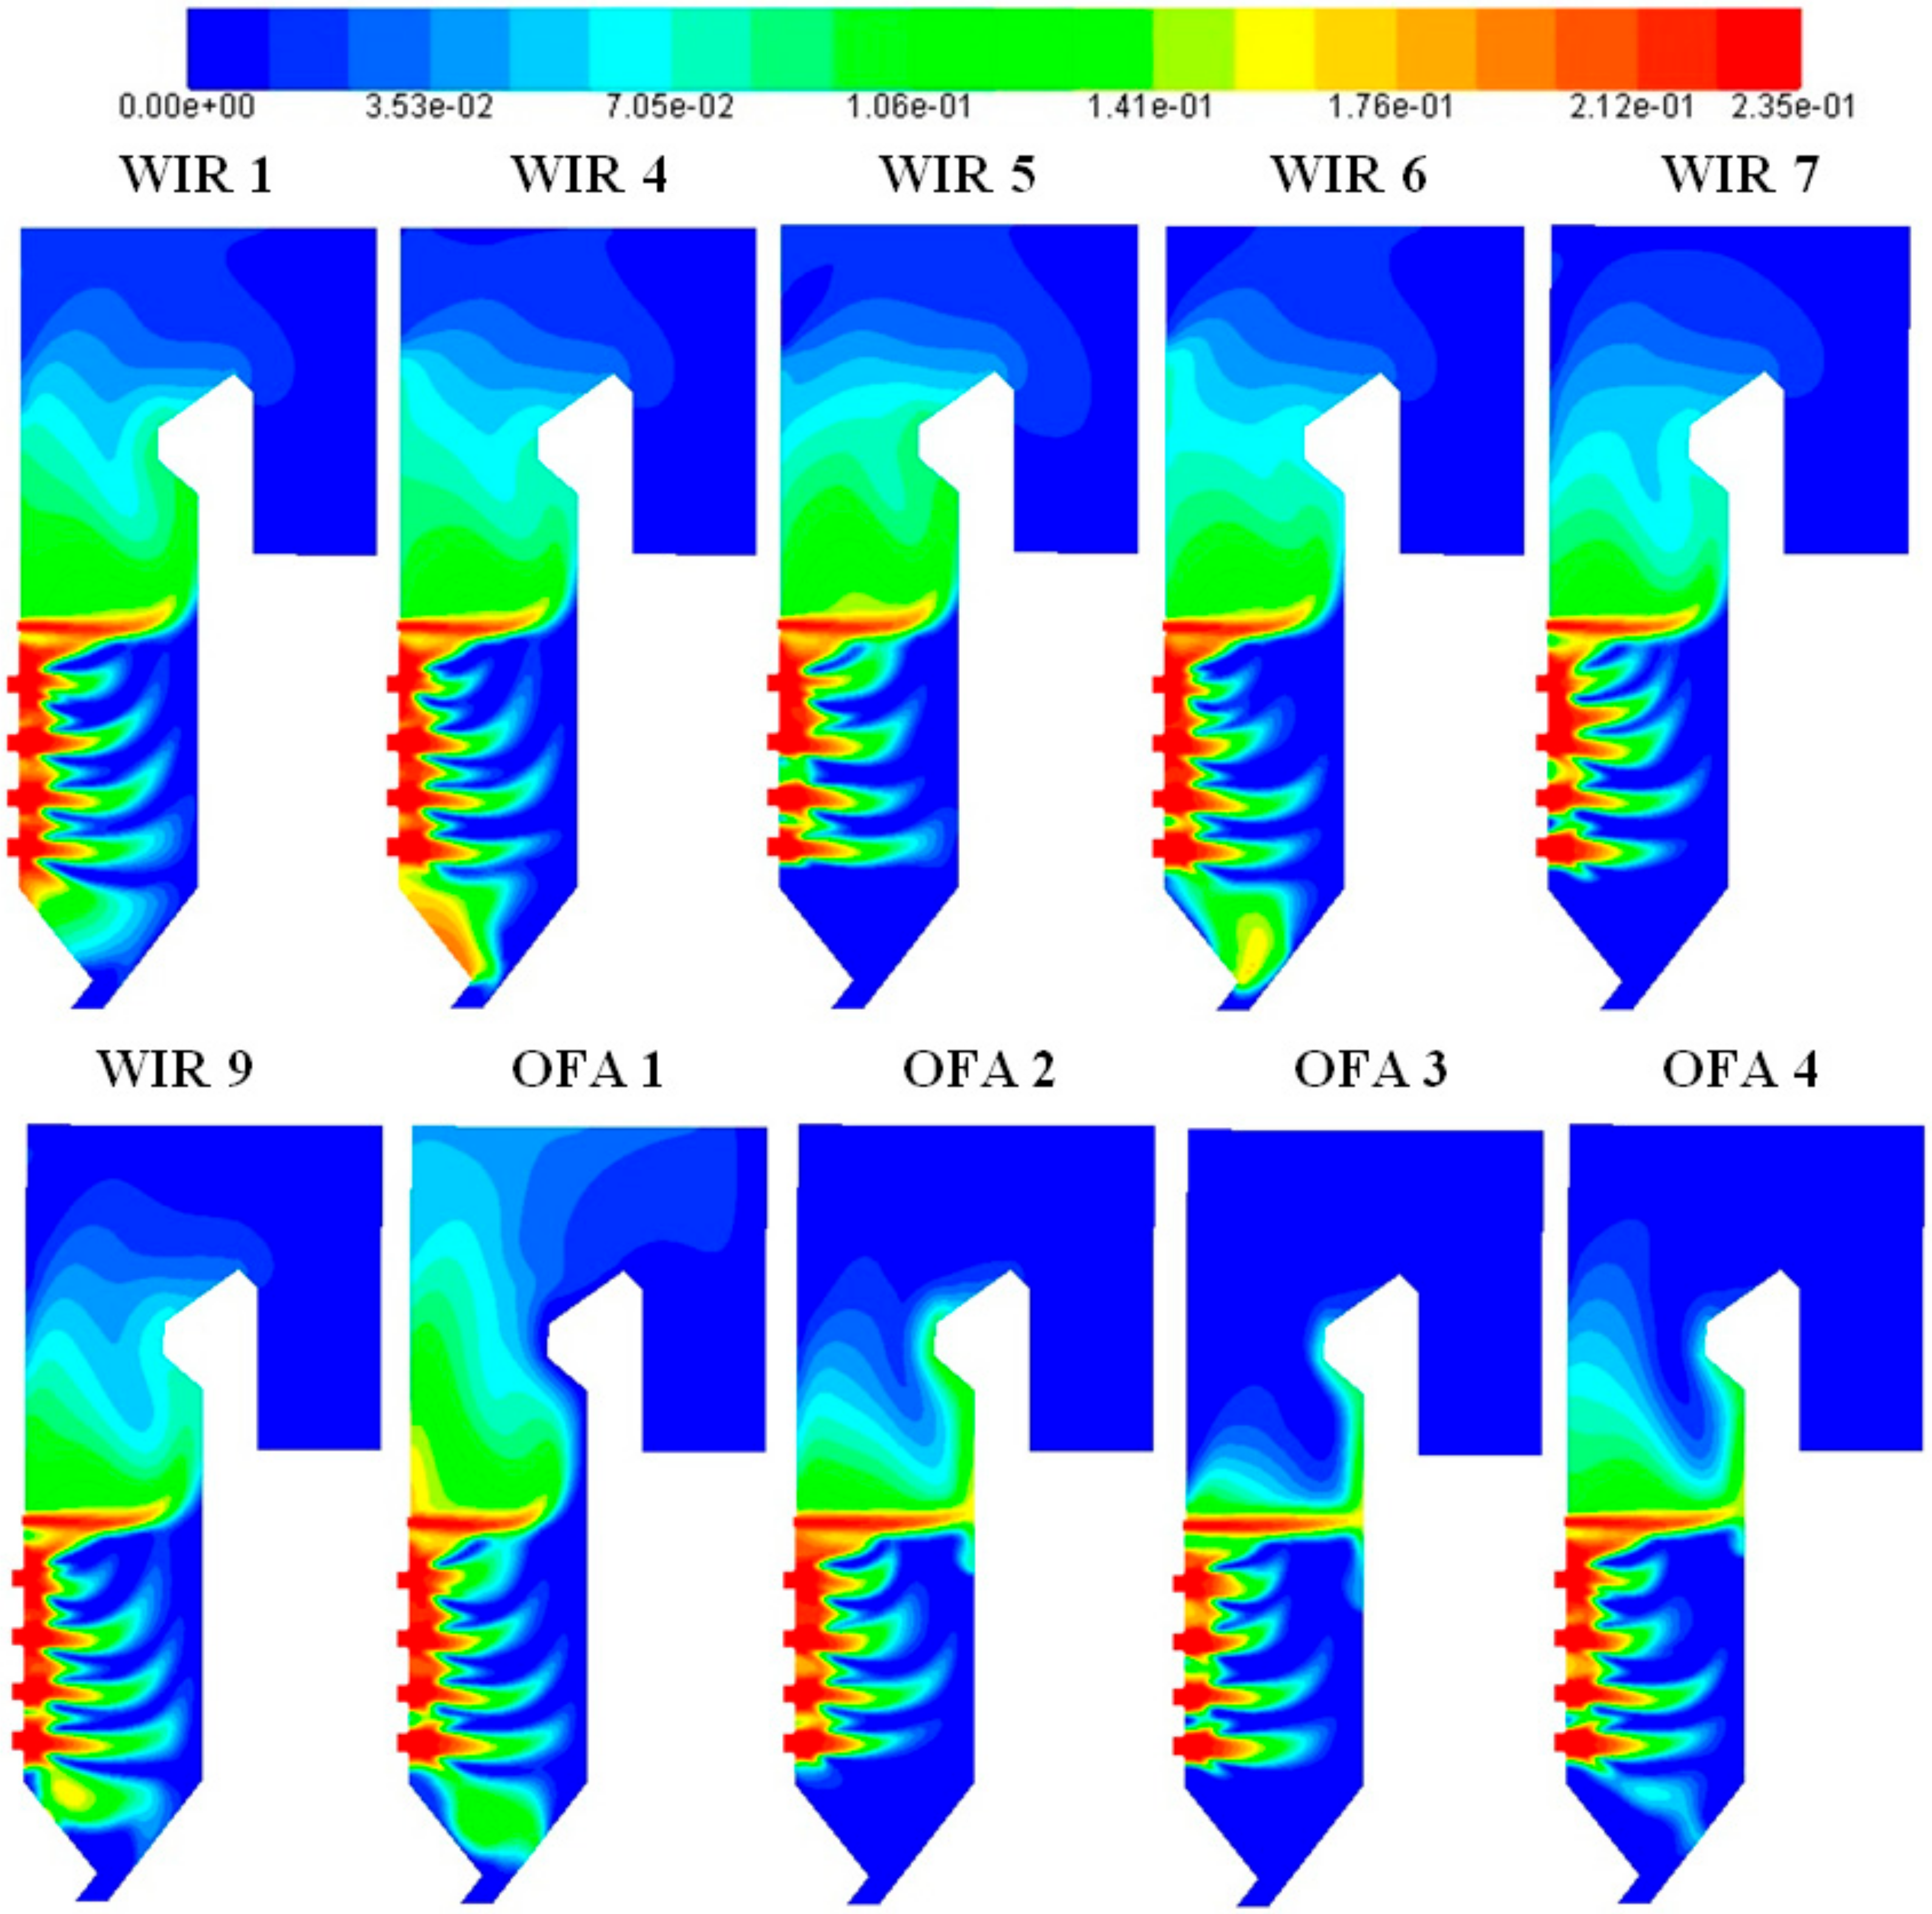
Figure 17.
The mass fraction of CO in the vertical plane of the boiler for swirl and OFA cases.

Figure 18.
Change of the fuel flow particles directed towards the slag hopper.

Table 1.
Operational parameters of the OP 650 boiler.
| Data | Unit | Value |
|---|---|---|
| Operating pressure | MPa | 15.1 |
| Live steam mass flow rate | t/h | 650 |
| Live steam pressure | MPa | 13.6 |
| Live steam temperature | °C | 540 |
| Reheated steam mass flow rate | t/h | 565 |
| Reheated steam pressure | MPa | 2.43 |
| Reheated steam temperature | °C | 540 |
| Steam pressure at the reheated inlet | MPa | 2.62 |
| Steam temperature at the reheated inlet | °C | 330 |
| Feed water pressure | MPa | 15.4 |
| Feed water temperature | °C | 242 |
Table 2.
Air and fuel distribution supplied to burners.
| Data | Unit | Mill | ||||
|---|---|---|---|---|---|---|
| A | B | C | D | E | ||
| Coal Mass Flow | kg/s | 6.90 | 6.90 | 6.90 | 6.90 | - |
| Core air mass flow | kg/s | 0.94 | 0.94 | 0.94 | 0.94 | - |
| Primary air mass flow | kg/s | 16.83 | 16.83 | 16.83 | 16.83 | - |
| Secondary air mass flow II | kg/s | 6.30 | 6.30 | 6.30 | 6.30 | 2.52 |
| Secondary air mass flow III | kg/s | 18.90 | 18.90 | 18.90 | 18.90 | 7.56 |
| OFA_l air mass flow to OFA | kg/s | 35.59 | ||||
| OFA_u air mass flow to OFA | kg/s | 11.02 | ||||
| Mixture temperature | °C/K | 100/373 | ||||
| Secondary air temperature | °C/K | 280/553 | ||||
Table 3.
Coal grain size.
| Data | Value | Unit |
|---|---|---|
| Residue on 88 (90) µm sieve | % | 31.2 |
| Residue on 150 µm sieve | % | 12.9 |
| Residue on 200 µm sieve | % | 3.6 |
| The average diameter | µm | 78.1 |
| Polydispersity number | - | 1.28 |
Table 4.
Fuel analysis (as received).
| Data | Value | Unit |
|---|---|---|
| Calorific value | 20,800 | kJ/kg |
| Ash content | 24.8 | % |
| Moisture content | 10.9 | % |
| Sulfur | 0.9 | % |
| Carbon | 54.3 | % |
| Hydrogen | 3.3 | % |
| Oxygen | 4.9 | % |
| Nitrogen | 0.9 | % |
Table 5.
Kinetics parameters for the char and devolatilization models and homogenous reactions.
| Combustion Model of Volatile | Reaction k1 | Reaction k2 |
|---|---|---|
| A = 2.119 × 10¹¹ E = 2.027 × 10⁸ J/kmol | A = 2.239 × 10¹² E = 1.92 × 10⁸ J/kmol | |
| For the coal particle | ||
| Devolatilization | Single-rate model A = 382,000 E = 6.7 × 10⁷ J/kmol | |
| Combustion of char | Kinetic-diffusion model C1 = 5 × 10⁻¹¹, C2 = 0.1 EA = 7.2 × 10⁷ J/kmol | |
Table 6.
Variants of Over-Fire Air (OFA) air distribution changes.
| Data | OFA 1 | OFA 2 | OFA 3 | OFA 4 |
|---|---|---|---|---|
| Air mass flow III, kg/s | 18.9 | 18.9 | 18.9 | 17.01 |
| Air mass flow to OFA_l, kg/s | 38.3 | 26.7 | 17.8 | 35.6 |
| Air mass flow to OFA_u, kg/s | 8.3 | 19.9 | 28.8 | 18.6 |
Table 7.
Summary of verification parameters.
| Case | O2, % | TCCO, K | TPSO, K | HAww, MWth | HAps, MWth | HA5th, MWth | HA2nd, MWth | HAchs, MWth |
|---|---|---|---|---|---|---|---|---|
| 0D model | 2.57 | 1482 | 1292 | 265 | 47.7 | 25.2 | 88.4 | 76.9 |
| Base | 1.96 | 1489 | 1306 | 285 | 53.5 | 31.3 | 85.7 | 82.9 |
Table 8.
Comparison of simulation results.
| Case | O2, % | CO, mg/m3n | NOx, mg/m3n | TCCO, K | TPSO, K | TOUT, K |
|---|---|---|---|---|---|---|
| Base | 1.76 | 216.4 | 489.5 | 1490.8 | 1306.5 | 600.2 |
| WIR 1 | 1.93 | 192.8 | 431.5 | 1471.6 | 1296.6 | 596.2 |
| WIR 2 | 2.17 | 367 | 516.5 | 1479.1 | 1302.2 | 601.2 |
| WIR 3 | 1.99 | 264.8 | 571.2 | 1482.1 | 1300.4 | 605.8 |
| WIR 4 | 1.91 | 220.6 | 462.3 | 1468.2 | 1293.4 | 595.9 |
| WIR 5 | 1.87 | 234 | 507 | 1491.2 | 1311.7 | 602.4 |
| WIR 6 | 1.73 | 297.2 | 455.7 | 1481.3 | 1301.1 | 597.1 |
| WIR 7 | 1.95 | 418.8 | 483.7 | 1487.6 | 1303.7 | 596 |
| WIR 8 | 1.9 | 795 | 531.3 | 1486.3 | 1302.9 | 594.8 |
| WIR 9 | 1.54 | 204.9 | 464 | 1493 | 1307.4 | 594 |
| OFA 1 | 2.41 | 402.9 | 549 | 1472.9 | 1299.9 | 620.7 |
| OFA 2 | 1.25 | 85.9 | 420.1 | 1544.6 | 1343.5 | 600.3 |
| OFA 3 | 1.21 | 6.6 | 388.7 | 1533.3 | 1324.2 | 572.5 |
| OFA 4 | 1.52 | 123.6 | 401.5 | 1534.5 | 1338.8 | 604.3 |
© 2020 by the author. Licensee MDPI, Basel, Switzerland. This article is an open access article distributed under the terms and conditions of the Creative Commons Attribution (CC BY) license (http://creativecommons.org/licenses/by/4.0/).
Share and Cite
MDPI and ACS Style
Hernik, B. Numerical Research of the Modification of the Combustion System in the OP 650 Boiler. Energies 2020, 13, 725. https://doi.org/10.3390/en13030725
AMA Style
Hernik B. Numerical Research of the Modification of the Combustion System in the OP 650 Boiler. Energies. 2020; 13(3):725. https://doi.org/10.3390/en13030725
Chicago/Turabian StyleHernik, Bartłomiej. 2020. "Numerical Research of the Modification of the Combustion System in the OP 650 Boiler" Energies 13, no. 3: 725. https://doi.org/10.3390/en13030725
Note that from the first issue of 2016, this journal uses article numbers instead of page numbers. See further details here.