Article

Quantification of the Energy Storage Contribution to Security of Supply through the F-Factor Methodology

Department of Electrical and Electronic Engineering, Imperial College London, London SW7 2AZ, UK
*
Author to whom correspondence should be addressed.
Energies 2020, 13(4), 826; https://doi.org/10.3390/en13040826
Submission received: 2 December 2019 / Revised: 4 February 2020 / Accepted: 7 February 2020 / Published: 14 February 2020
(This article belongs to the Special Issue Modelling and Analysis of Distributed Energy Storage)

Abstract

:
The ongoing electrification of the heat and transport sectors is expected to lead to a substantial increase in peak electricity demand over the coming decades, which may drive significant investment in network reinforcement in order to maintain a secure supply of electricity to consumers. The traditional way of security provision has been based on conventional investments such as the upgrade of the capacity of electricity transmission or distribution lines. However, energy storage can also provide security of supply. In this context, the current paper presents a methodology for the quantification of the security contribution of energy storage, based on the use of mathematical optimization for the calculation of the F-factor metric, which reflects the optimal amount of peak demand reduction that can be achieved as compared to the power capability of the corresponding energy storage asset. In this context, case studies underline that the F-factors decrease with greater storage power capability and increase with greater storage efficiency and energy capacity as well as peakiness of the load profile. Furthermore, it is shown that increased investment in energy storage per system bus does not increase the overall contribution to security of supply.

1. Introduction

The transition towards a low-carbon electricity supply will necessitate high degrees of security of supply in order to successfully address challenges related to load growth and the increased integration of renewable sources of energy. In this context, energy storage (ES) can constitute a technology option that can provide the required security of supply as well as a wide range of benefits to the electricity system operation and investment. Such benefits include strategic investment flexibility for the network planner to hedge against exogenous and endogenous uncertainty [1,2], support for the real-time balancing of electricity supply and demand [3] through the provision of ancillary services [4], power quality improvement [5], decentralized coordination of distributed energy resources within microgrids [6] and provision of security of supply through reduction of peak demand [7,8,9] via temporal arbitrage [10]. Such benefits can enable greater penetration of low-carbon generation resources, which can have environmental benefits as well as economic ones [11] given that low-carbon generation is characterized by lower operating costs than conventional generation based on fossil fuels. Hence, ES is uniquely positioned to provide a wide variety of services to the grid and contribute to the delivery of a future-proof energy infrastructure that can accommodate increased capacity of renewable generation technologies in a seamless manner [12]. In this regard, there are optimistic estimates about the future capacity of energy storage, such as in the annual Energy Futures report of National Grid which has assessed that the capacity of ES connected to distribution networks could exceed 13GW by the year 2040 [13].
Despite the significant benefits of ES, the presence of market and regulatory barriers may pose an obstacle in the realization of a future power system that reliably accommodates large amounts of renewables. In other words, despite the considerable potential of ES technology to transform the energy outlook, the regulatory and policy frameworks are still not sufficiently mature to enable this transition [14]. Specifically, current network planning standards do not yet provide an explicit formal framework for the assessment of the ES security contribution. This is the case, for example, with Engineering Recommendation P2/6 [15], which is the distribution network planning standard followed by Distribution Network Operators in Great Britain. Although this planning standard explicitly recognizes the contribution of distributed generation to the security of supply, it does not include formal recognition of the contribution of ES. Hence, an update of the planning standards is necessary so that the security contribution of non-network solutions can be taken into consideration, as part of the overall benefit that investment technologies can have, thereby contributing to the establishment of a level-playing field for all technologies.
In this context, the present paper presents an approach to quantify the security contribution of ES through the calculation of the F-factor metric. Overall, this methodology can be used in the context of distribution network planning to assess how much extra peak demand can be accommodated while maintaining the same reliability/risk performance as that before the installation of the ES unit. Note that this approach does not involve conducting an economic cost-benefit analysis. Rather, it entails solving optimization studies that model the operation of ES units with the objective of minimizing the peak demand over a specified period of time.
In this context, the contributions of the present paper are as follows.
  • Presentation of F-factors as a methodology for the quantification of the security contribution of ES.
  • Demonstration of the mathematical formulation for the optimization problem that is solved for the evaluation of the F-factor metric.
  • Sensitivity analysis of the security contribution of ES as a function of multiple quantities such as energy storage power capability, efficiency, energy capacity and characteristics of load patterns.
The paper is structured as follows. Section 2 presents the literature review on methodologies to quantify the security contribution of ES. In Section 3, the methodology of F-factors is explained, and the associated mathematical formulation is presented. Section 4 presents a case study that showcases the proposed methodology of F-factors and explains their dependence on technical characteristics of energy storage as well as on the load pattern. Section 5 discusses the findings, while Section 6 presents future work pathways and concludes.

2. Literature Review

Traditionally, network security has been provided through investment in conventional assets, such as transformers and electricity transmission and distribution lines. With the advent of smart grid technologies, such as demand-side response and ES, the concept of security of supply can be updated to include such non-network solutions. Remarkably, thus far relevant research has mainly been focused on conventional and renewable distributed generation (DG) assets with various methodologies of evaluating their contribution to security of supply, as in [16,17,18]. The ability of ES to provide security of supply was first recognized in a study conducted by the Electric Power Research Institute (EPRI) in 1976 [18,19] that dealt with the potential of pumped hydroelectric storage to ensure electricity supply while reducing investment in expensive conventional generation units. This report underlined the fact that utilities treat long-duration storage devices (such as pumped hydro) as sources of reliable capacity as they can be relied upon to discharge during periods of peak demand.
Authors in [20] make use of dynamic programming to approximate the security contribution of energy storage connected to the transmission system; the dynamic program models the effect of power system outages on system operation and is combined with loss of load probabilities to eventually compute a probability distribution for the state of charge of storage in each period. Then, this probability distribution is used for the evaluation of the capacity value of the ES asset. Authors in [21] use a probabilistic methodology based on chronological Monte Carlo simulations for computing the Effective Load Carrying Capability (ELCC) of an ES plant taking also into account the ability of ES to charge during partial outage conditions such as when only some of the substation transformers are online. Note that ELCC has also found application in investigating the capacity value of demand side resources, as presented in [22,23]. In addition, reference [24] computes the ES security contribution when it is utilized for smoothing the output of a wind farm and minimizes the mismatch between load and generation; the contribution to security of supply is evaluated based on the use of ELCC and the forced outage rate of an ES unit during charging and discharging cycles. In addition, the capacity value of a transmission-connected ES has been evaluated in [25] where the authors monetize the ability of a storage plant to be relied upon during periods of peak demand using a large range of price estimates depending on location and market structure. Authors in [26,27] propose a capacity value approximation technique that first determines an optimal dispatch of the storage plant subject to technical constraints and then determines, based on the dispatch, the maximum amount of energy that the storage device could feasibly generate in each time period. This maximum potential generation is used to estimate the plant’s capacity value. In addition, reference [28] evaluates the capacity value based on chronological simulations using a set of algorithms based on the concepts of equivalent firm capacity and equivalent conventional capacity. Authors in [29] compute the ES security contribution through the evaluation of ELCC but the focus is on ES assets installed at islanded microgrids rather than connections on main grids.
Note that, in most of the published work the capacity value of energy storage has been estimated based on the use of reliability parameters and from an economic viewpoint based on the benefit offered by each MW of installed capacity of energy storage, as in [30,31,32,33]. However, as opposed to such approaches, the F-factor methodology does not take into consideration reliability parameters of grid assets such as mean time to repair or mean time before failure. Rather, F-factors focus on the maximum peak reduction achieved by a specific storage device. Thus, peak reduction constitutes a fundamental aspect of providing security of supply. The problem of optimal storage sizing for achieving cost-optimal peak shaving has been addressed in [34]; a novel cycle nonhomogeneous Markov chain steady-state analysis method is proposed for modelling the stored power under diurnal variation of wind power and load. Authors in [35] present a decision-tree based algorithm for the reduction of the peak load in residential distribution networks through the coordinated control of electric vehicles, photovoltaic units and battery energy storage systems. Finally, reference [36] presents an algorithm that uses demand profile information and a minimal set of energy storage system parameters is formulated in this study for obtaining ESS operation schedules to achieve peak demand shaving and load-levelling.

3. The F-Factor Methodology

In the previous section, it was mentioned that ES technology can bring various benefits to the electricity system including the provision of security of supply, which can be evaluated using F-factor methodology [37].

3.1. Definition of the Metric

ES units can operate in such a way that can lead to peak reduction. Specifically, by discharging their stored energy, they can supply electricity to nearby demand centres, thereby alleviating the congestion on network assets across the grid and reducing peak demand. According to Figure 1, during periods when the system demand is low, the ES plant is charged; this charge is subsequently released during periods of peak or near-peak demand, consequently leading to reduction of the peak. By shaving off the peak demand, the ES can trigger deferral of conventional network reinforcement that would otherwise be required to be deployed for the safe accommodation of power flows. Such ES operation can contribute to the security of supply because during periods of peak demand a sudden loss of a critical network asset may lead to interruptions in the supply of electricity to consumers. Hence, peak reduction through energy storage operation contributes to the security of supply.
The current paper presents the application, for the first time, of the F-factor metric for the evaluation of the energy storage security contribution. Specifically, the F-factor metric is defined as the ratio of P, which stands for the optimal reduction in peak demand (kW), over C, which stands for the power capability (kW) of the ES plant, as in Equation (1). In this regard, this metric is dimensionless and is expressed in percentage terms.
F = P C
From Equation (1), it becomes obvious that to calculate the F-factor it is important to conduct an optimization study so as to obtain the maximum peak demand reduction P. The mathematical formulation for the corresponding optimization problem is provided in Section 3.2. It is also evident that the F-factor metric depends on the characteristics of the energy storage unit. Hence, it is important to perform sensitivity analysis and examine how the F-factor measure is affected by the load characteristics, such as the shape of the demand profile, and characteristics of the energy storage, such as the efficiency and the time required for a full charge/discharge of the ES plant.

3.2. Optimization Problem

The modelling approach for calculating the ES security contribution is based on solving a deterministic linear and continuous optimization problem, where the objective is to minimize the peak demand (kW) through optimal storage operation.
m i n i m i z e   P m a x
P m a x D t + P t i n P t o u t   t T
E t = E t 1 + δ · η · P t i n δ · P t o u t ,       t T { 1 }
E t = I · E ˜ + δ · η P t i n δ · P t o u t ,   t = 1
E 1 E T = 0 , d
E m i n ˜ E t E m a x ˜ ,     t T
P t i n P ˜ ,     t T
P t o u t P ˜ ,     t T
The objective function (2) aims to minimize the maximum net demand, represented by variable P m a x , which by default is greater than the net demand across all time periods (3). Net demand is defined as the summation of the initial demand (i.e., prior to the operation of storage), represented by input parameter D t (kW), with the power that charges the ES plant P t i n (kW), minus the power that is discharged from the ES, P t o u t (kW); both P t i n ,   P t o u t are decision variables. As can be seen, there is no cost involved in the objective function. Rather, for the calculation of the F-factors, the objective is to achieve minimization of peak demand through optimal storage operation.
Constraint (4) models the operation of the ES device. Essentially, the state of charge (SOC) E t (kWh) at period t is equal to that at period t-1 plus the energy that charges the ES plant at period t minus the energy which gets discharged at the same period, where η is the efficiency of charging (p.u.). Furthermore, parameter δ (hours) represents the time-granularity of the load data. For example, it is δ = 0.5 for load-data where each period corresponds to half an hour or δ = 1 for hourly granularity. Essentially, this constraint models the fact that the ES operates as a load during off-peak periods (i.e., charging with energy) and as a generator (i.e., discharging) during peak times.
Constraint (5) is the application of (4) to the first time period. Notice that I . (p.u.) is a decision variable that specifies the initial SOC of the ES and E ˜ is the storage capacity (kWh). Constraint (6) states the assumption that the SOC at the last period of the horizon is equal to the SOC in the first period. Constraint (7) specifies the upper and lower bounds for the SOC, where E m i n ˜ ,   E m a x ˜ are typically expressed as a percentage of the energy capacity E ˜ . Limitations apply also to the power capability; specifically, the power that charges ES, as in (8), and that which is discharged (9), at time period t , must be less than or equal to the power capability of ES as represented by input parameter P ˜ . Note that the quantities E ˜ and P ˜ are linked to each other via the equation E ˜ = μ P ˜ , where μ is the number of hours required for a complete charging or discharging of the ES unit.

4. Case Study: Evaluation of the ES Security Contribution via F-factors

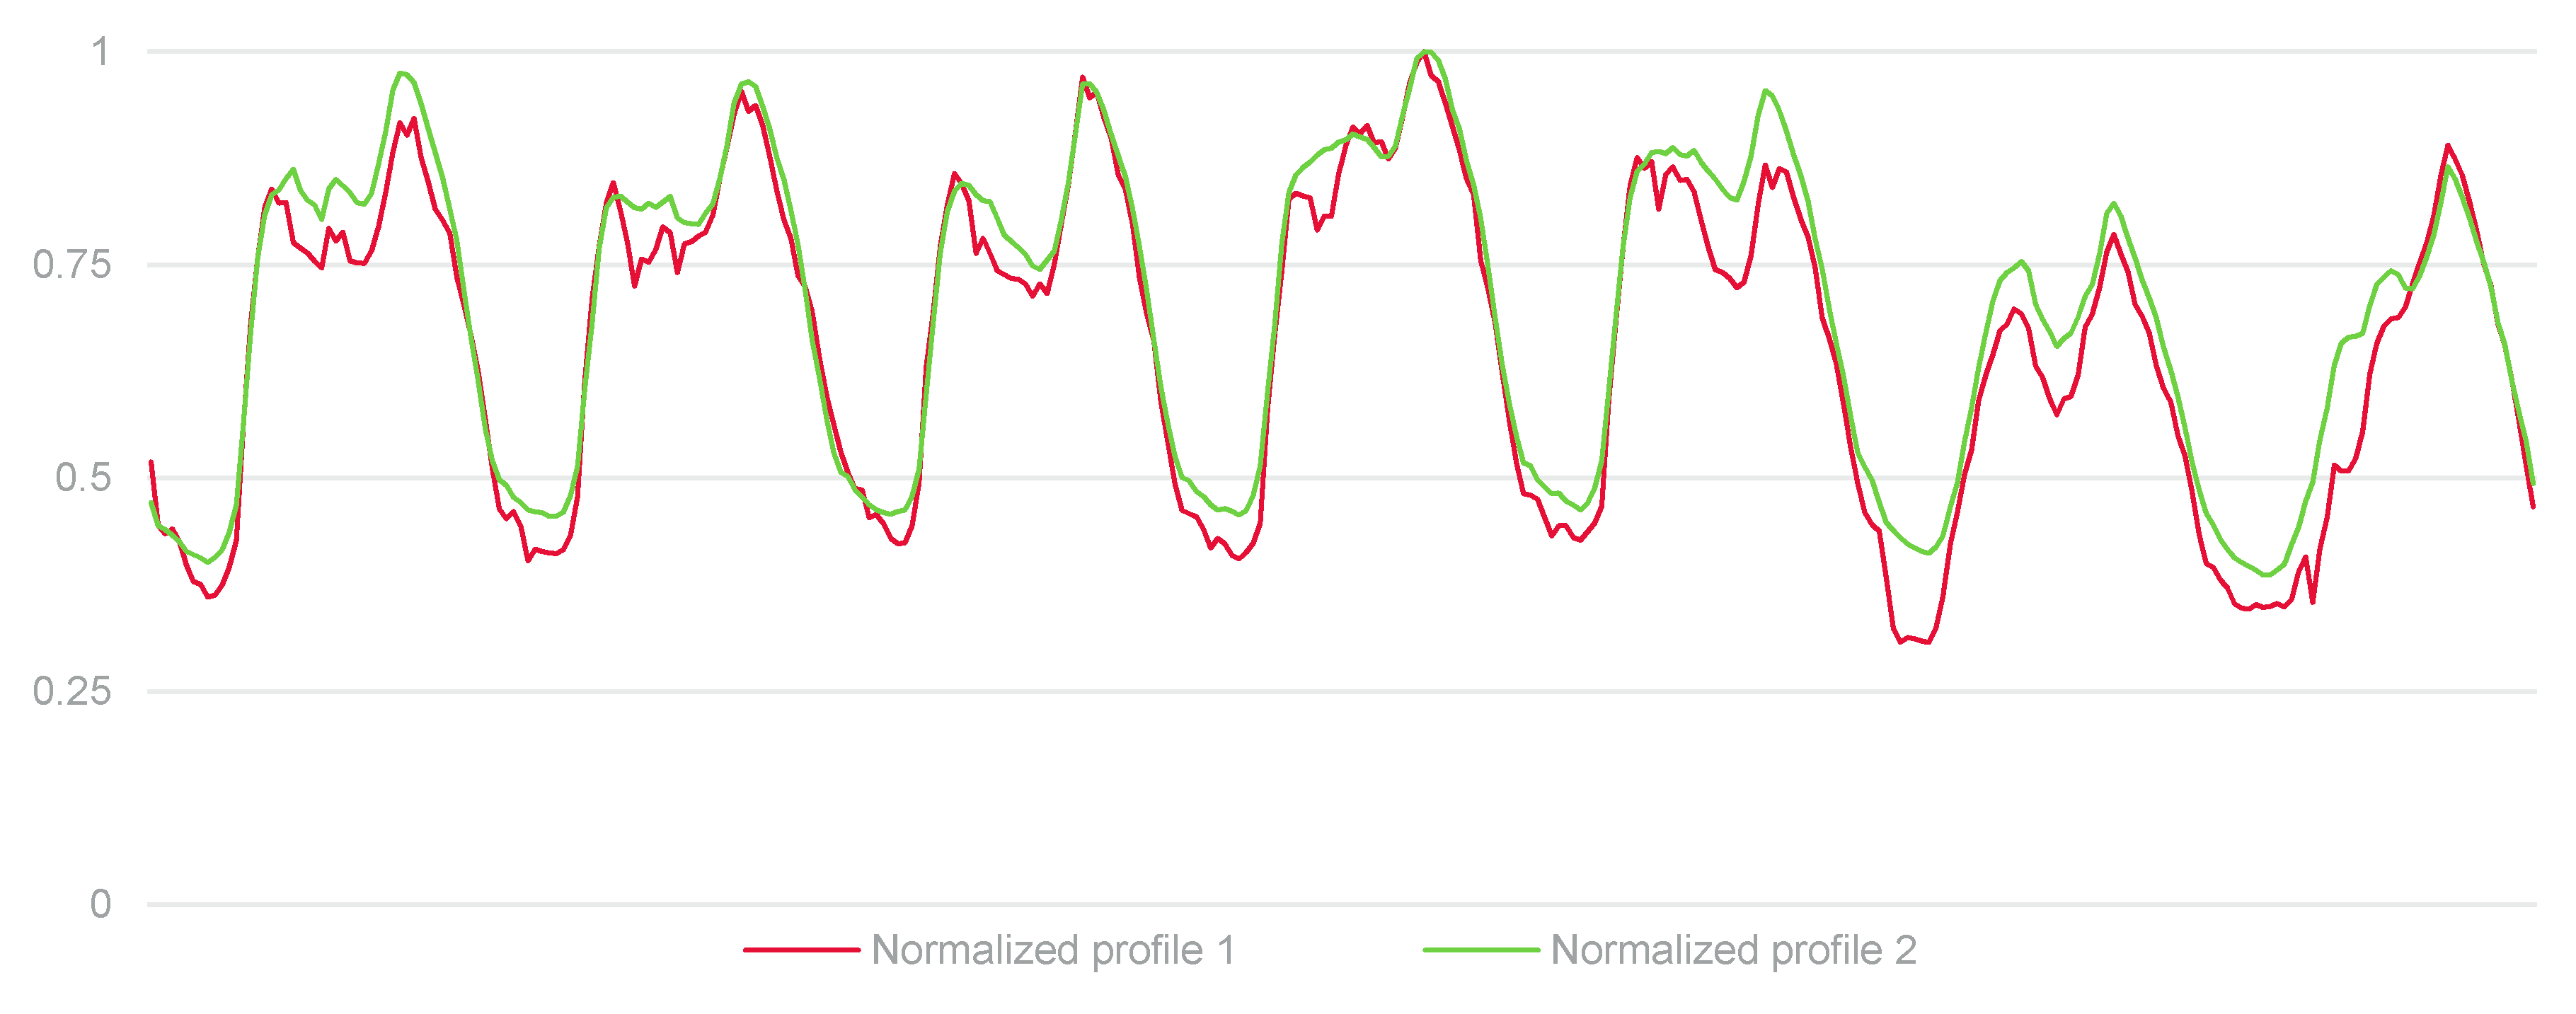
This section presents an analysis of the security contribution of ES via the methodology of F-factors. The schematic diagram of Figure 2 shows two substations, each of which is equipped with two transformers and serves a load that has a profile depicted in normalized form in Figure 3. Specifically, profile 1, which corresponds to the primary substation, has a peak demand of 7036 kW, while profile 2, which corresponds to the bulk supply point (BSP) substation, has a peak of 170,363 kW. Both of these profiles cover the seven-day period from 23rd of January 2017 until 29th of January 2017 [38]. Furrthermore, in Figure 3, it is possible to identify that profile 1 is peakier because the difference between the peak and through levels is greater than that for profile 2. As we will see below, this has a profound impact on the F-factor values.
Sensitivity analysis is performed by running a series of studies, each of which involves solving the aforementioned optimization problem each time for a different combination of the following ES parameters: charging efficiency η , power capability P ˜ . and energy capacity E ˜ . The sensitivity analysis is performed by assuming two different study horizons. The first is when only the peak day (fourth day in Figure 3) is considered, while the second is when the entire 7-day period, as shown in Figure 3, is considered. This way it is possible to evaluate how the length of the horizon can affect the values for the F-factors. Note that the actual load profile for every hour of the respective period is evaluated by multiplying the normalized time series with the peak demand for the primary substation and the BSP respectively. Finally, sensitivity analysis is performed for the values E m i n ˜ ,   E m a x ˜ that appear in constraint (7), which in the first case are taken to be 0% and 100% of E ˜ respectively, and in the second case they are taken to be 20% and 80% of E ˜ respectively.
The results are shown in Table 1, Table 2, Table 3 and Table 4 below. Table 1 and Table 2 correspond to the case where E m i n ˜ ,   E m a x ˜ are 0% and 100% of E ˜ , while in Table 3 and Table 4 the two limits are equal to 20% and 80% of E ˜ . In addition, Table 1 and Table 3 correspond to load profile 1, while Table 3 and Table 4 correspond to profile 2. In each table, grey-coloured cells contain two F-factor values. At the top, the value for the F-factor corresponds to the case in which only the peak day is considered, while the bottom value, shown in parentheses, corresponds to the entire 7-day period. White-coloured cells contain only one value for the F-factor, as it is the same regardless of whether the peak day or the entire 7-day period is considered. Note that the sensitivity analysis has been conducted by selecting values for the efficiency η equal to 60%, 80% and 100%, for the power capability P ˜ equal to 10%, 20%, 30% and 50% of the peak demand of the corresponding load profile, and for parameter μ equal to 1 hour up to 8 h. Note again that E ˜ = μ P ˜ . The studies are conducted through the use of the FICO Xpress optimization platform on a Xeon 3.46 GHz computer.
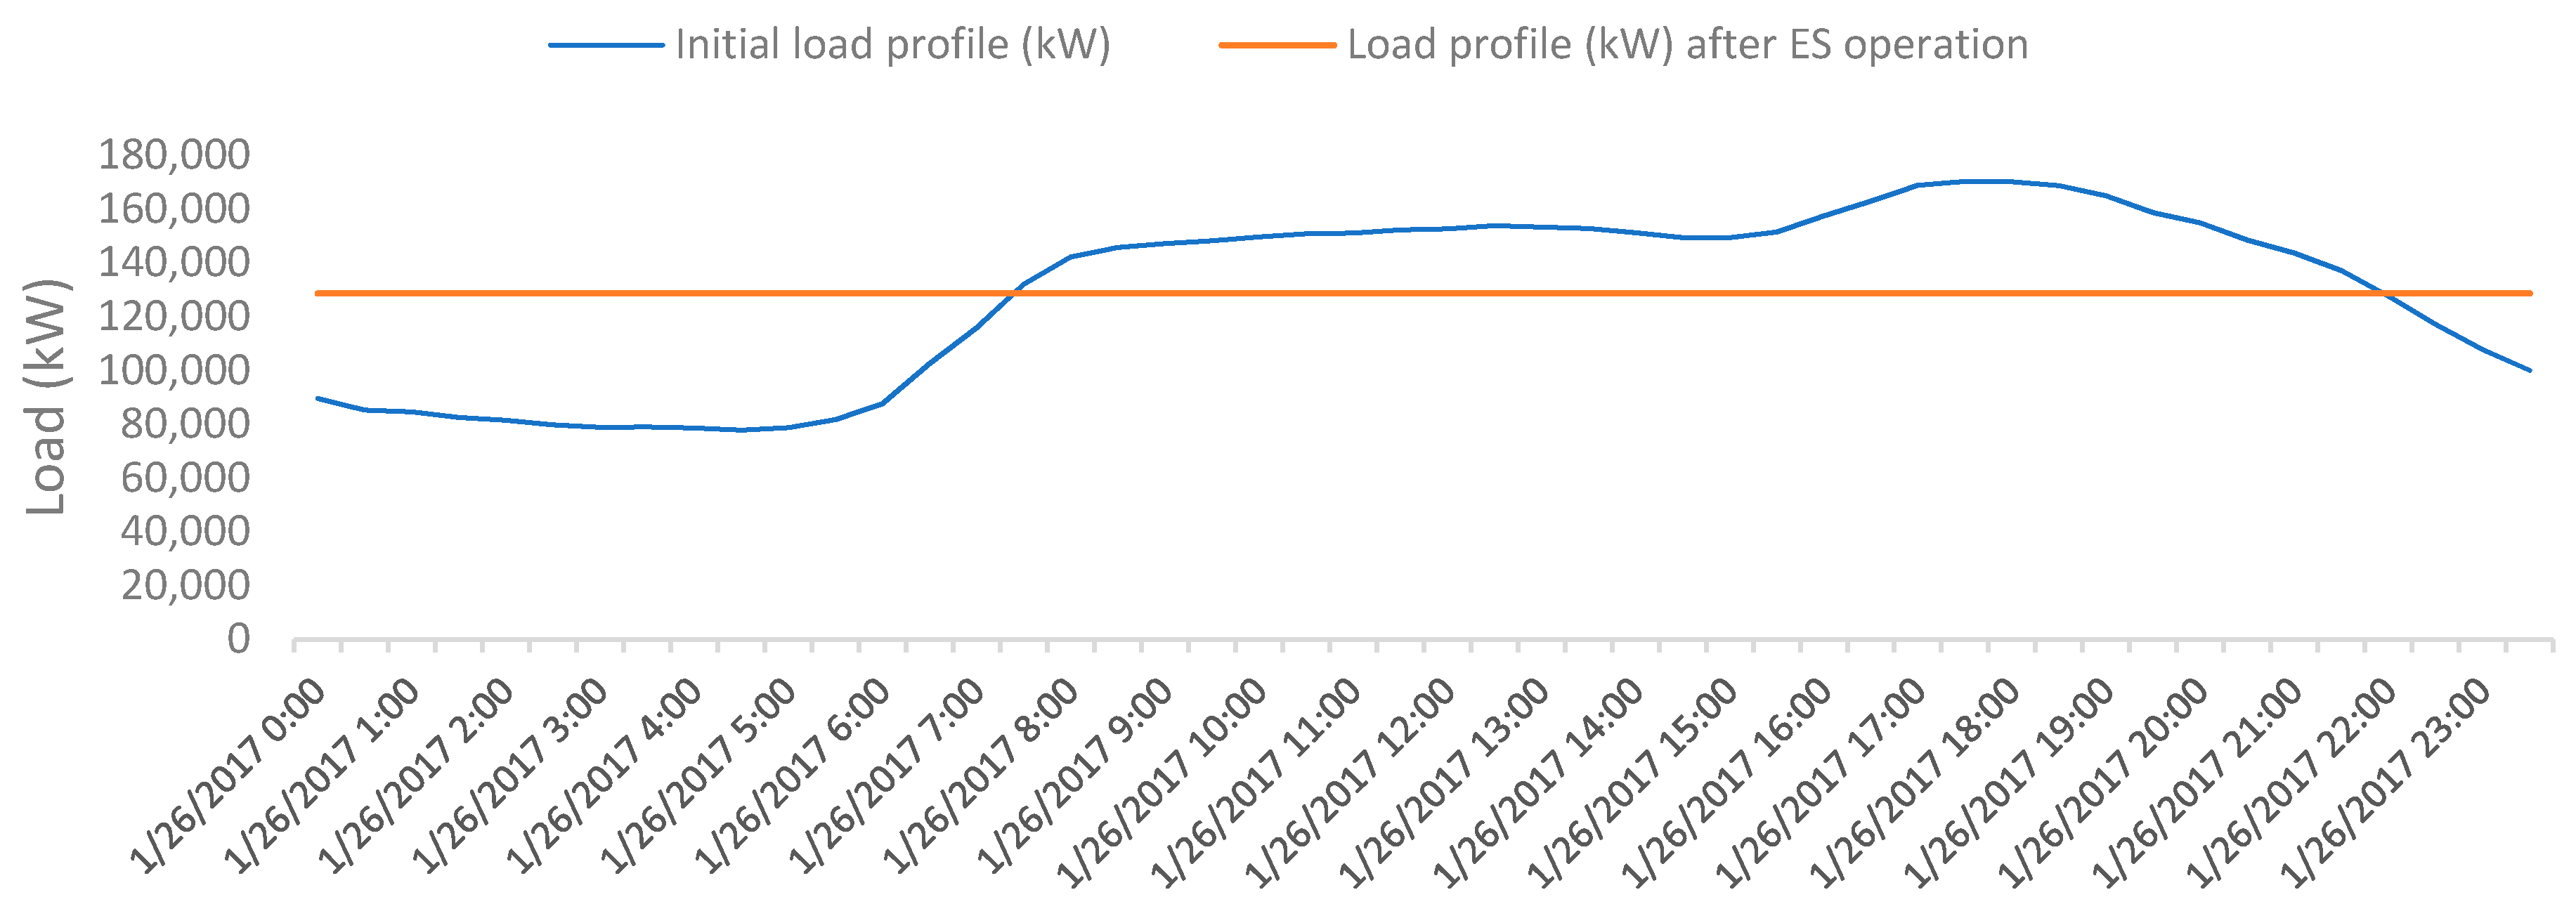
Figure 4 shows an example of storage operation aimed at peak minimization with application to load profile 2 during the peak day. The initial time series, shown in blue colour, which has a peak of 170,363 kW, is minimized in terms of its peak through ES operation. The resulting time series is shown in red colour and has a peak of 128,695 kW, thereby achieving a 41,668 kW peak reduction. This case corresponds to an ES plant with power capability equal to 50% of the peak demand of the initial profile, i.e., 85,181.5 kW, and 100% efficiency while requiring 8 h for a full charge. Hence, the calculated F-factor is equal to 41,668/85,181.5 = 49% (see Table 2).
Figure 5 presents the net power inflow in the ES unit for the example presented in Figure 4. It can be seen that during periods when the initial load profile is relatively low the ES unit charges with energy (i.e., draws power acting as a load), while during peak periods the ES plant discharges the stored energy (shown in negative values).

5. Discussion

The results obtained in the previous section allow us to make key observations about the F-factors.
First of all, the F-factors do not increase as the energy storage power capability increases. This can be witnessed by observing the values of the F-factors from left to right across any row of the above tables, where it can be seen that they do not increase. The reason for such reduction in F-factors is based on the definition of the F-factor metric as the ratio of the achieved peak demand reduction divided by the storage power capability. For example, regarding the first row of Table 1, for a storage asset connected to the primary substation characterized by load profile 1 (peak: 7036 kW), when the storage power capability is 10% of the peak (i.e., 703.6 kW), the achieved peak reduction is evaluated via solving the minimization problem at 437.5 kW; hence, the corresponding F-factor stands at 437.5/703.6 = 62%. However, when the storage power capability becomes three times larger, i.e., 30% of the peak (i.e., 2110.8 kW), the achieved peak reduction, for the same efficiency, becomes 778.75 kW, thereby yielding an F-factor value equal to 37%. In other words, the increase in the achieved peak reduction is typically less than the increase in power capability. Hence, using a storage device with greater power capability does not entail greater security contribution, in percentage terms. Rather, the security contribution, expressed in the F-factor value, reduces. Furthermore, it is noticeable from within the tables that F-factors may stay the same as power capability increases. For example, for a duration µ of 6–8 h in Table 1, the F-factor 100% does not reduce when moving from a 10% to 20% storage power capability. The reason for this lies in the fact that such high values for µ entail high energy storage capacity that allows the device to significantly contribute to peak reduction and utilize effectively its increased power capability.
A further observation that can be made is that F-factors increase as the full charge/discharge duration µ increases, until the storage unit has sufficient capacity after which additional capacity has no effect. This can be witnessed by observing each of the columns in the above tables and moving from the top downwards towards increasing values for µ. The reason for this is that greater duration µ essentially translates to greater storage energy capacity (kWh), leading to greater potential for energy storage to contribute towards peak minimization and, as a result, corresponding to greater F-Factor values.
Additionally, by comparing the values in Table 1, which corresponds to the peaky profile, with those in Table 2 (or similarly, comparing the values in Table 3 with those in Table 4), it can be seen that the F-factors of the peaky profile 1 are higher than the corresponding ones of the less peaky profile 2. That is, the values in Table 1 are higher (or equal in the case of 100%) with the corresponding ones in Table 2. One of the main reasons for this is based on the shape of the load profiles and mainly on the shape of the peaks. For example, for a ‘peaky’ profile with a narrow peak of high magnitude, the peak can be reduced even with a small output from the storage unit, thereby providing significant security contribution. On the other hand, a ‘flatter’ profile that is characterized by a long period of high values for load and a small peak requires a storage unit with a significant amount of energy capacity in order to make significant security contribution. Such contribution largely depends on the difference in the height of the peak demand with the subsequent largest peaks; if a load profile has a peak that is much higher than the second-highest peak, then reducing the highest peak will provide considerable security contribution leading to a high value for the F-factor. Hence, there is more scope for the provision of security contribution on a peaky load profile than on a flatter one, like profile 2.
Notice that the F-factors for the peak day are equal to those for the 7-day period for most of the cases; this is shown in the white-coloured cells that in any Table are more numerous than the grey cells. However, there are cases, as shown in grey-coloured cells, in which these two values are different from each other. The difference can be observed for storage units characterized by increased values for µ (i.e., increased storage capacity) and storage power capabilities. In these cases, the F-factors corresponding to the 7-day period are higher than those corresponding to the peak day only. The reason for this difference lies in the fact that as the storage capacity and power capability increase, the storage unit can charge with more energy, which can be drawn across a longer period of time, i.e., from a week rather than from the peak day only, thereby allowing for greater reduction of peak demand, which contributes to enhanced security of supply.
It is also evident that the F-factors tend to rise with the increase in energy storage efficiency. This can be witnessed by observing each of the rows of the above tables for a particular storage power capability. However, notice that the efficiency affects the F-factor values for relatively high values of µ and of power capability, whereas, when the values of µ are relatively low (i.e., storage unit with low energy capacity) and the power capability is small, the storage unit has limited ability to reduce the peak demand regardless of its efficiency; low charging efficiency simply means that it will need to draw some small amount of extra power to charge its limited capacity. On the other hand, when the storage capacity increases (high value of µ), as well as its power capability, the efficiency starts playing a role because the storage unit has significant ability to reduce the peak demand, and this ability can be affected at low efficiencies, since in such cases, it would draw extra amount of power to charge, which could lead to extra peaks in the load profile.
Moreover, by comparing Table 1 and Table 2 with Table 3 and Table 4, we can observe that the F-factor values for the former pair are greater than those for the latter pair. The reason for this lies in Equation (7) of the formulation. Particularly, when the upper and lower bounds on SOC are more distant from each other, as is the case for Table 1 and Table 2, the storage unit has a greater potential for charging and discharging, thereby affecting the corresponding F-factor value.
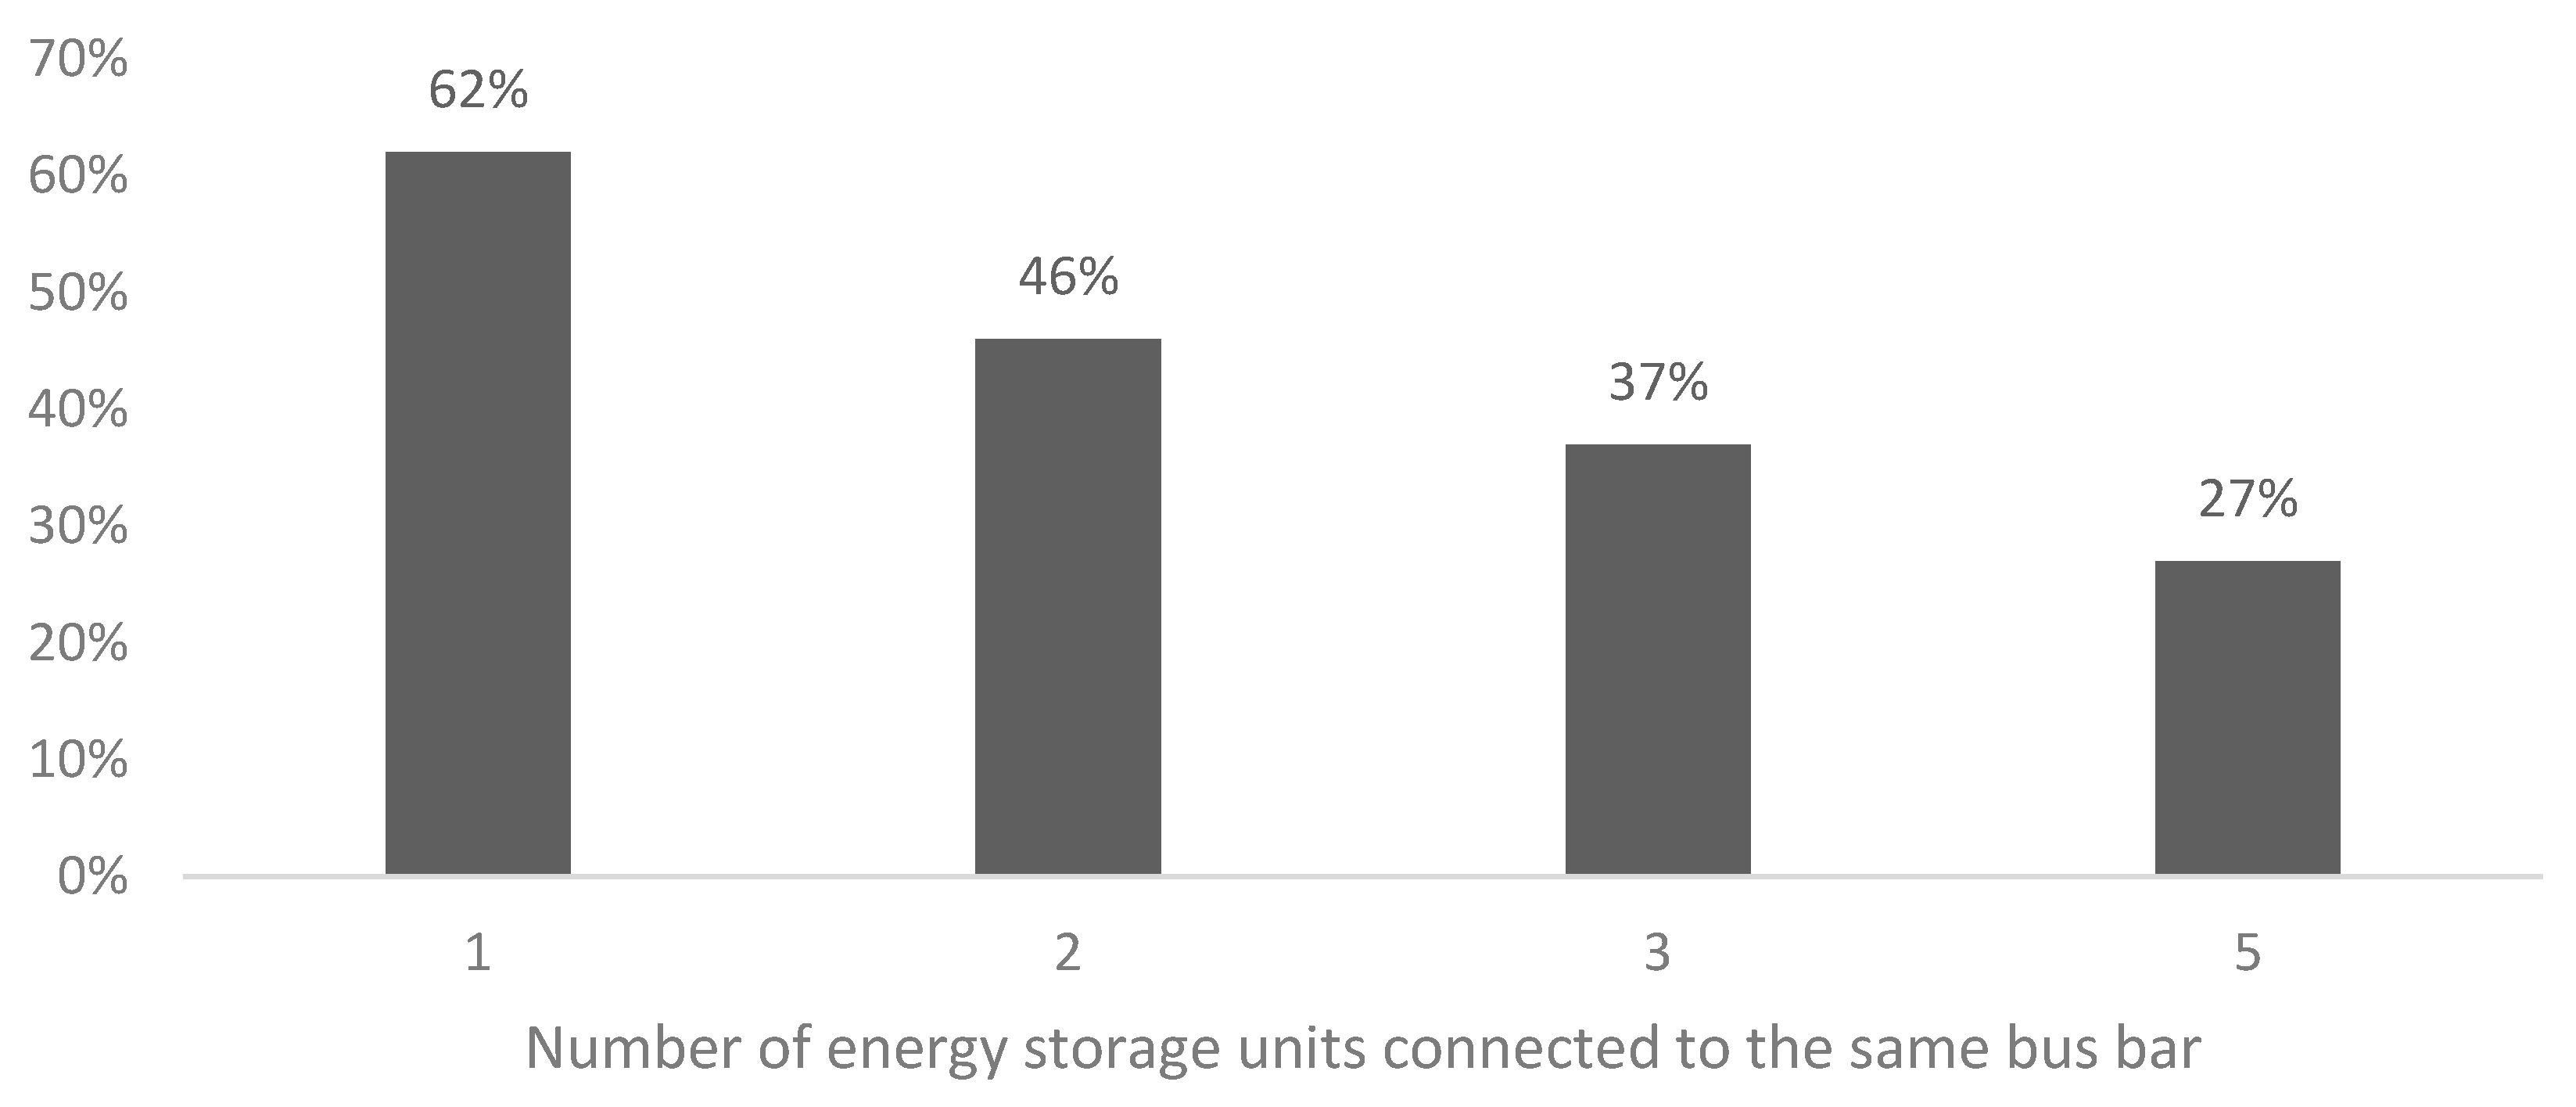
Finally, it is interesting to note that when more than one storage unit is connected to the same bus, the F-factor of the total storage capacity is a non-increasing function of the number of these connected ES units. This, as shown in Figure 6, essentially means that increased investment in storage per bus does not increase the contribution to the security of supply provided by the combined investment capacity. This can be shown by selecting any type of storage unit from the above tables. For instance, it is found in Table 1 that a 100% efficient storage unit with power capability equal to 10% of the peak demand and with 1 h duration has an F-factor equal to 62% (see row 1 and column 1 in Table 1). That is, when only such a storage unit is connected to the primary substation, its F-factor is 62%. On the other hand, when two storage units of this type are connected to the primary substation, their combined power capability is equal to 10% + 10% of the peak demand, which means that it is equivalent to having connected one unit of the same type but with twice the power capability. Such a unit provides an F-factor value equal to 46%, as can be observed in Table 1 (row 1, column 4). In the same vein, when three such units are connected to the same bus, the F-factor for the combined storage capacity is equal to 37% (row1, column 7 in Table 1), and with five such units, the combined F-factor is equal to 27% (row 1, column 10 in Table 1). Hence, investing in increased storage capacity for a bus leads to reduced F-factor for the combined storage system, because according to equation (1), the achieved peak demand reduction is less than the increase in the total storage power capability.
It is also interesting to note that any of the Table 1, Table 2, Table 3 and Table 4 can be used to observe the phenomenon of degradation [39] of the energy storage unit, as shown in Figure 7. That is, with time and as the utilization of the asset increases, there is typically some loss of energy retention capability. The rate at which degradation occurs is asset-specific and can depend on a range of factors including the degree of asset utilization and charging and discharging patterns. For example, assume a 100% efficient storage asset with power capability P ˜ equal to 20% of the peak and corresponding to load profile 2 as in Table 2. Assume also that the unit has µ = 5 h, yielding an F-factor value of 84%. Then, the same table can be used to inform about the F-factor value after the degradation has occurred, leading to reduction of µ to 4 h. In that case, the F-factor will reduce to 76%. In other words, degradation has the tendency to reduce the security contribution of an energy storage unit, which is reflected in the reduction of the F-factor values.

6. Conclusions and Future Work

This paper presents the F-factor methodology for the evaluation of the security contribution of energy storage units. Note that economic analysis is not in the scope of this paper and the presented methodology does not depend on economic quantities. Specifically, the F-factor metric is defined as the ratio of the maximum reduction in peak demand divided by the power capability of the ES plant. A mathematical optimization problem is presented for obtaining the maximum peak reduction, thereby allowing for the estimation of the F-factor values. The value of the F-factor is shown to be dependent on the ES power rating, its energy capacity, its ES efficiency of charging, the upper and lower bounds on the SOC, as well as on how peaky the demand curve is. Notably, F-factors tend to increase with an increase in ES efficiency, with less stringent bounds on SOC, with an increase in the full charge/discharge duration of the ES asset and with the peakiness of the load profile. In addition, F-factors are shown to not increase as the energy storage power capability increases.
The present paper can have implications for a range of stakeholders. First, this research can inform distribution system operators (DSOs) about a way by which the contribution of energy storage to security of supply can be quantified in non-economic terms, thereby constituting a measure, independent of economic quantities, of the ‘security’ performance of an energy storage asset. Thus, DSOs, which are entities responsible for security of supply, can have extra tools at their disposal for the assessment of whether or not deploying an energy storage asset is beneficial from a security-provision perspective so as to meet the security standards’ requirements. In addition, energy storage investors are stakeholders whose aim is to maximize the financial return from their investment in an energy storage asset. This return depends on the revenue that is generated from the services that can be sold, one of which services may well be the security provision. Therefore, the present research can have implications on the decision-making process taken by energy storage investors and can help them to arrive at efficient designs (for example determining the magnitude of power capability as a percentage of peak demand) in order to maximize the value provided to the grid. Furthermore, the present research can be particularly important for regulators, as it can constitute a methodology for the quantification of the security provision from energy storage assets. In this context, this research may contribute to regulators updating the existing security standards so as to include the F-factor methodology.
In addition, the presented research has significant links to energy policy concepts. Specifically, the quantification of the security provision of energy storage can assist in gaining a more complete perspective of the benefits generated from investing in energy storage. Gaining such a perspective can be particularly helpful in enabling energy storage to compete on a level playing field with other candidate technologies such as demand-side response and the construction of new lines. Establishing a level playing field across all investment technologies is fundamental for achieving efficient levels of investment for all technologies in the system. In addition, security standards can be updated to formally recognize the contribution of energy storage to security of supply. Finally, this research can have implications for the energy systems of the future that will be characterized by the presence of increased renewable capacity. In this context, energy storage can be a technology with the potential to assist with the integration of renewables while ensuring security of supply; numerous studies have underlined the interplay between storage and variable renewables, emphasizing that ES can provide flexibility to facilitate large renewable integration [40,41,42,43,44].
Future work includes the study of the F-factor metric within a larger network consisting of many buses and lines and different voltage levels as well as a range of smart technologies such as demand-side response and soft open points [45]. In addition, it is of interest to the authors to investigate the security contribution of different types of ES technologies, including thermal energy storage, pumped hydroelectric storage and flywheel [46] energy storage. This way, sensitivity analysis on F-factor values can be extended to include comparison among different types of energy storage technologies. Finally, a comparison to other means of security provision, such as standby generation capacity, is part of the future research plans of the authors in order to provide insights into how F-factor values change across different types of security provision.

Author Contributions

Data curation, P.D.; Formal analysis, S.G.; Investigation, P.G. and G.S.; Methodology, P.G.; Project administration, D.P.; Resources, D.P.; Supervision, D.P. and G.S.; Validation, G.S.; Visualization, G.S.; Writing—original draft, G.S.; Writing—review & editing, G.S., P.G. and D.P. All authors have read and agreed to the published version of the manuscript.

Funding

This research was funded by the UK EPSRC IDLES project (reference: EP/R045518/1) and from the EU-SysFlex project (European Union’s Horizon 2020 research and innovation programme under grant agreement No 773505). All contents and views expressed in this paper are the sole responsibility of the authors and do not necessarily express the views of the project consortia.

Conflicts of Interest

The authors declare that there are no conflict of interest.

References

  1. Giannelos, S.; Konstantelos, I.; Strbac, G. Option value of dynamic line rating and storage. In Proceedings of the 2018 IEEE International Energy Conference (ENERGYCON), Limassol, Cyprus, 3–7 June 2018; pp. 1–6. [Google Scholar]
  2. Giannelos, S.; Konstantelos, I.; Strbac, G. Option Value of Demand-Side Response Schemes Under Decision-Dependent Uncertainty. IEEE Trans. Power Syst. 2018, 33, 5103–5113. [Google Scholar] [CrossRef]
  3. Pudjianto, D.; Aunedi, M.; Djapic, P.; Strbac, G. Whole-Systems Assessment of the Value of Energy Storage in Low-Carbon Electricity Systems. IEEE Trans. Smart Grid 2014, 5, 1098–1109. [Google Scholar] [CrossRef]
  4. Moreno, R.; Moreira, R.; Strbac, G. A MILP model for optimizing multi-service portfolios of distributed energy storage. Appl. Energy 2015, 137, 554–566. [Google Scholar] [CrossRef] [Green Version]
  5. Nieto, A.; Vita, V.; Maris, T.I. Power quality improvement in power grids with the integration of energy storage systems. Int. J. Eng. Res. Technol. 2016, 5, 438–443. [Google Scholar]
  6. Papadaskalopoulos, D.; Pudjianto, D.; Strbac, G. Decentralized Coordination of Microgrids With Flexible Demand and Energy Storage. IEEE Trans. Sustain. Energy 2014, 5, 1406–1414. [Google Scholar] [CrossRef]
  7. Agamah, S.; Ekonomou, L. Energy storage system scheduling for peak demand reduction using evolutionary combinatorial optimization. Sustain. Energy Technol. Assess. 2017, 23, 73–82. [Google Scholar]
  8. Strbac, G.; Konstantelos, I.; Djapic, P. Analysis of Integrated Energy Storage Contribution to Security of Supply: Report for Smarter Network Storage Project. Available online: http://innovation.ukpowernetworks.co.uk/innovation/en/Projects/tier-2-projects/Smarter-Network-Storage-(SNS)/Project-Documents/SNS_P2_6_SDRC9.6v1.pdf (accessed on 30 January 2020).
  9. Konstantelos, I.; Djapic, P.; Strbac, G.; Papadopoulos, P.; Laguna, A. Contribution of Energy Storage and Demand-Side Response to Security of Distribution Network. In Proceedings of the CIRED, Glasgow, Scotland, 12–15 June 2017. [Google Scholar]
  10. Agamah, S.; Ekonomou, L. A heuristic combinatorial optimization algorithm for load-levelling and peak demand reduction using energy storage systems. Electr. Power Compon. Syst. 2018, 45, 2093–2103. [Google Scholar] [CrossRef]
  11. Strbac, G.; Aunedi, M.; Konstantelos, I.; Moreira, R.; Teng, F.; Moreno, R.; Pudjianto, D.; Laguna, A.; Papadopoulos, P. Opportunities for Energy Storage: Assessing Whole-System Economic Benefits of Energy Storage in Future Electricity Systems. IEEE Power Energy Mag. 2017, 15, 32–41. [Google Scholar] [CrossRef]
  12. Strbac, G.; Konstantelos, I.; Pollitt, M.; Green, R. Report for the UK National Infrastructure Commission: Delivering Future-Proof Energy Infrastructure. Available online: https://assets.publishing.service.gov.uk/government/uploads/system/uploads/attachment_data/file/507256/Future-proof_energy_infrastructure_Imp_Cam_Feb_2016.pdf (accessed on 30 January 2020).
  13. National Grid, Future Energy Scenarios 2016. Available online: http://fes.nationalgrid.com/ (accessed on 30 January 2020).
  14. European Smart Grids Task Force. Regulatory Recommendations for the Deployment of Flexibility; European Smart Grids Task Force: Brussels, Belgium, 2015; Available online: https://ec.europa.eu/energy/sites/ener/files/documents/EG3%20Final%20-%20January%202015.pdf (accessed on 30 January 2020).
  15. Electricity Networks Association. Engineering Recommendation P2/6: Security of Supply; Electricity Networks Association: London, UK, 2006; Available online: http://www.dcode.org.uk/assets/uploads/ENA_ER_P2_Issue_6__2006_-1.pdf (accessed on 30 January 2020).
  16. Milligan, M.; Porter, K. Determining the capacity value of wind: An updated survey of methods and implementation. In Proceedings of the Wind-Power, Houston, TX, USA, 1–4 June 2008. [Google Scholar]
  17. Keane, A.; Milligan, M.; Dent, C.J.; Hasche, B.; D’Annunzio, C.; Dragoon, K.; Holttinen, H.; Samaan, N.; Soder, L.; O’Malley, M. Capacity Value of Wind Power. IEEE Trans. Power Syst. 2010, 26, 564–572. [Google Scholar] [CrossRef] [Green Version]
  18. Amelin, M. Comparison of Capacity Credit Calculation Methods for Conventional Power Plants and Wind Power. IEEE Trans. Power Syst. 2009, 24, 685–691. [Google Scholar] [CrossRef]
  19. Public Service Electric and Gas Company, Electric Power Research Institute. An Assessment of Energy Storage Systems Suitable for Use by Electric Utilities; Final Report; Public Service Electric and Gas Co.: Newark, NJ, USA, 1979. [Google Scholar]
  20. Sioshansi, R.; Madaeni, S.H.; Denholm, P. A dynamic programming approach to estimate the capacity value of energy storage. IEEE Trans. Power Syst. 2014, 29, 395–403. [Google Scholar] [CrossRef]
  21. Konstantelos, I.; Strbac, G. Capacity value of energy storage in distribution networks. J. Energy Storage 2018, 18, 389–401. [Google Scholar] [CrossRef]
  22. Nolan, S.; O’Malley, M.; Hummon, M.; Kiliccote, S.; Ma, O. A methodology for estimating the capacity value of demand response. In Proceedings of the 2014 IEEE PES General Meeting|Conference & Exposition, National Harbor, MD, USA, 27–31 July 2014; pp. 1–5. [Google Scholar]
  23. Earle, R.; Kahn, E.P.; Macan, E. Measuring the Capacity Impacts of Demand Response. Electr. J. 2009, 22, 47–58. [Google Scholar] [CrossRef]
  24. Abdullah, M.A.; Muttaqi, K.M.; Agalgaonkar, A.P.; Sutanto, D. Estimating the capacity value of energy storage integrated in wind power generation. In Proceedings of the 2013 IEEE Power and Energy Society General Meeting, Vancouver, BC, Canada, 21–25 July 2013. [Google Scholar]
  25. National Renewable Energy Laboratory (NREL). The Value of Energy Storage for Grid Applications; Technical Report; NREL: Boulder, CO, USA, 2013.
  26. Tuohy, A.; O’Malley, M. Impact of pumped storage on power systems with increasing wind penetration. In Proceedings of the IEEE Power & Energy Society General Meeting, Calgary, AB, Canada, 26–30 July 2009; pp. 1–8. [Google Scholar]
  27. Tuohy, A.; O’Malley, M. Pumped storage in systems with very high wind penetration. Energy Policy 2011, 39, 1965–1974. [Google Scholar] [CrossRef]
  28. Zhou, Y.; Mancarella, P.; Mutale, J. A framework for capacity credit assessment of electrical energy storage and demand response. IET Gener. Transm. Distrib. 2016, 10, 2267–2276. [Google Scholar] [CrossRef] [Green Version]
  29. Da Silva, A.M.L.; Cassula, A.M.; Nascimento, L.C.; Freire, J.C.; Sacramento, C.E.; Guimarães, A.C.R. Chronological Monte Carlo-Based Assessment of Distribution System Reliability. In Proceedings of the 2006 International Conference on Probabilistic Methods Applied to Power Systems, Stockholm, Sweden, 11–15 June 2006; pp. 1–7. [Google Scholar]
  30. Black, M.; Strbac, G. Value of Bulk Energy Storage for Managing Wind Power Fluctuations. IEEE Trans. Energy Convers. 2007, 22, 197–205. [Google Scholar] [CrossRef]
  31. Thatte, A.A.; Xie, L. Towards a Unified Operational Value Index of Energy Storage in Smart Grid Environment. IEEE Trans. Smart Grid 2012, 3, 1418–1426. [Google Scholar] [CrossRef]
  32. Denholm, P.; Sioshansi, R. The value of compressed air energy storage with wind in transmission-constrained electric power systems. Energy Policy 2009, 37, 3149–3158. [Google Scholar] [CrossRef]
  33. Drury, E.; Denholm, P.; Sioshansi, R. The Value of Compressed Air Energy Storage in Energy and Reserve Markets. Energy 2011, 36, 4959–4973. [Google Scholar] [CrossRef]
  34. Dong, J.; Gao, F.; Guan, X.; Zhai, Q.; Wu, J. Storage Sizing With Peak-Shaving Policy for Wind Farm Based on Cyclic Markov Chain Model. IEEE Trans. Sustain. Energy 2017, 8, 978–989. [Google Scholar] [CrossRef]
  35. Mahmud, K.; Hossain, M.J.; Town, G.E. Peak-Load Reduction by Coordinated Response of Photovoltaics, Battery Storage, and Electric Vehicles. IEEE Access 2018, 6, 29353–29365. [Google Scholar] [CrossRef]
  36. Agamah, S.U.; Ekonomou, L. Peak demand shaving and load-levelling using a combination of bin packing and subset sum algorithms for electrical energy storage system scheduling. IET Sci. Meas. Technol. 2016, 10, 477–484. [Google Scholar] [CrossRef]
  37. Allan, R.; Strbac, G.; Djapic, P.; Jarrett, K. Developing the P2/6 Methodology; University of Manchester: Manchester, UK, 2004. Available online: https://webarchive.nationalarchives.gov.uk/20100919182336/http://www.ensg.gov.uk/assets/methodology.pdf (accessed on 30 January 2020).
  38. Energy Networks Association, Engineering Report 130, Working Group. Substation Demand Profiles, London. 2018. Available online: http://www.energynetworks.org/assets/files/news/publications/Reports/ENA%20HVWG%20Report%20Final.pdf (accessed on 30 January 2020).
  39. Koller, M.; Borsche, T.; Ulbig, A.; Andersson, G. Defining a degradation cost function for optimal control of a battery energy storage system. In Proceedings of the 2013 IEEE Grenoble Conference, Grenoble, France, 16–20 June 2013; pp. 1–6. [Google Scholar]
  40. Castronuovo, E.D.; Lopes, J. On the Optimization of the Daily Operation of a Wind-Hydro Power Plant. IEEE Trans. Power Syst. 2004, 19, 1599–1606. [Google Scholar] [CrossRef] [Green Version]
  41. Swider, D.J. Compressed Air Energy Storage in an Electricity System With Significant Wind Power Generation. IEEE Trans. Energy Convers. 2007, 22, 95–102. [Google Scholar] [CrossRef]
  42. Garcia-Gonzalez, J.; De La Muela, R.M.R.; Santos, L.M.; Gonzalez, A.M. Stochastic Joint Optimization of Wind Generation and Pumped-Storage Units in an Electricity Market. IEEE Trans. Power Syst. 2008, 23, 460–468. [Google Scholar] [CrossRef]
  43. Brown, P.; Lopes, J.A.P.; Matos, M. Optimization of Pumped Storage Capacity in an Isolated Power System With Large Renewable Penetration. IEEE Trans. Power Syst. 2008, 23, 523–531. [Google Scholar] [CrossRef]
  44. Zhang, N.; Kang, C.; Kirschen, D.S.; Xia, Q.; Xi, W.; Huang, J.; Zhang, Q. Planning Pumped Storage Capacity for Wind Power Integration. IEEE Trans. Sustain. Energy 2012, 4, 393–401. [Google Scholar] [CrossRef]
  45. Giannelos, S.; Konstantelos, I.; Strbac, G. Option Value of Soft Open Points in Distribution Networks. 2015, pp. 1–6. Available online: https://core.ac.uk/download/pdf/77010954.pdf (accessed on 30 January 2020).
  46. Abdeltawab, H.H.; Mohamed, Y.A.-R.I. Robust Energy Management of a Hybrid Wind and Flywheel Energy Storage System Considering Flywheel Power Losses Minimization and Grid-Code Constraints. IEEE Trans. Ind. Electron. 2016, 63, 4242–4254. [Google Scholar] [CrossRef]
Figure 1. Illustration of an electricity load profile where its peak demand is reduced through the use of energy storage (ES), which discharges during peak hours (i.e., acts as a generator of electricity) and charges during off-peak hours (i.e., acts as a load).
Energies 13 00826 g001
Figure 2. Diagrams of two substations: a bulk supply point substation (e.g., 132/33 kV) and a primary substation (e.g., 33/11 kV), each of which supplies a load.
Energies 13 00826 g002
Figure 3. Normalized time-series for load profiles 1 and 2. The profiles span a period of seven days, with the fourth day being the one that exhibits the peak demand.
Energies 13 00826 g003
Figure 4. Initial demand profile (in blue) and optimal demand profile (in red) following ES operation across the peak day for load profile 2.
Energies 13 00826 g004
Figure 5. Net power inflow (kW) in the ES unit presented in Figure 4.
Energies 13 00826 g005
Figure 6. The values on the horizontal axis indicate the number of identical ES units connected to the same bus. The height of the bars illustrates the corresponding F-factor value.
Energies 13 00826 g006
Figure 7. The graph illustrates the effect of degradation on the F-factors assuming that initially the unit has µ = 8 h and this value reduces through time, leading to a reduction of F-factor values. The horizontal axis indicates parameter µ, i.e., the number of hours required for a complete charging or discharging of the ES unit. The values on the vertical axis illustrate the corresponding F-factor value. The storage unit is 100% efficient with power capability P ˜ equal to 20% of the peak and corresponding to load profile 2 as in Table 2.
Energies 13 00826 g007
Table 1. F-factors for an ES unit connected to the primary substation (load profile 1) and assuming that the state of charge (SOC) of the unit is within 0% and 100% of its energy capacity. Grey-coloured cells contain, at the top, the F-factor when the horizon is only the peak day, while the bottom value, shown in parentheses, corresponds to the case where the horizon is the entire 7-day period. White-coloured cells contain only one value for the F-factor, and this value is the same for the peak day and for the entire 7-day period.
μ P ˜ at 10% of Peak P ˜ at 20% of Peak P ˜ at 30% of Peak P ˜ at 50% of Peak
EfficiencyEfficiencyEfficiencyEfficiency
100%80%60%100%80%60%100% 80% 60% 100% 80% 60%
1 h62%62%62%46%46%46%37%37%37%27%27%27%
2 h92%92%92%61%61%61%49%49%49%37%37%37%
3 h100%100%100%73%73%73%59%59%59%45%45%45%
4 h100%100%100%84%84%84%67%67%67%52%50% (52%)46% (52%)
5 h100%100%100%93%93%93%74%74%73% (74%)54% (59%)50% (58%)46% (55%)
6 h100%100%100%100%100%96% (100%)82%82%73% (82%)54% (62%)50% (59%)46% (56%)
7 h100%100%100%100%100%96% (100%)89%82% (89%)73% (89%)54% (63%)50% (60%)46% (57%)
8 h100%100%100%100%100%96% (100%)90% (96%)82% (96%)73% (92%)54% (64%)50% (61%)46% (57%)
Table 2. F-factors for an ES unit that is connected to the bulk supply point substation characterized by load profile 2 and assuming that the SOC of the unit is within 0% and 100% of its energy capacity.
μ P ˜ at 10% of Peak P ˜   at   20 %   of   Peak   P ˜   at   30 %   of   Peak P ˜   at   50 %   of   Peak
EfficiencyEfficiencyEfficiencyEfficiency
100%80%60%100%80%60%100% 80% 60% 100% 80% 60%
1 h49%49%49%40%40%40%34%34%34%25%25%25%
2 h80%80%80%58%58%58%45%45%45%33%33%33%
3 h100%100%100%68%68%68%53%53%53%41%41%41%
4 h100%100%100%76%76%76%61%61%61%48%45% (48%)41% (46%)
5 h100%100%100%84%84%84%68%68%66% (68%)49%(53%)45% (51%)41% (49%)
6 h100%100%100%91%91%87% (91%)75%75%66% (75%)49% (56%)45% (53%)41% (49%)
7 h100%100%100%98%98%87% (98%)82%75% (82%)66% (78%)49% (57%)45% (53%)41% (49%)
8 h100%100%100%100%98% (100%)87% (100%)82% (88%)75% (85%)66% (79%)49% (57%)45% (53%)41% (49%)
Table 3. F-factors for an ES unit connected to the primary substation (load profile 1) and assuming that the SOC of the unit is within 20% and 80% of its energy capacity.
μ P ˜   at   10 %   of   Peak P ˜   at   20 %   of   Peak   P ˜   at   30 %   of   Peak P ˜   at   50 %   of   Peak
EfficiencyEfficiencyEfficiencyEfficiency
100%80%60%100%80%60%100% 80% 60% 100% 80% 60%
1 h47%47%47%34%34%34%29%29%29%22%22%22%
2 h69%69%69%51%51%51%39%39%39%29%29%29%
3 h87%87%87%59%59%59%46%46%46%35%35%35%
4 h100%100%100%66%66%66%53%53%53%40%40%40%
5 h100%100%100%73%73%73%59%59%59%45%45%45%
6 h100%100%100%80%80%80%64%64%64%49%49%46% (49%)
7 h100%100%100%86%86%86%68%68%68%53%50% (53%)46% (53%)
8 h100%100%100%92%91%91%73%73%73%54% (57%)50% (57%)46% (55%)
Table 4. F-factors for an ES unit that is connected to the BSP substation characterized by load profile 2 and assuming that the SOC of the unit is within 20% and 80% of its energy capacity.
μ P ˜   at   10 %   of   Peak P ˜   at   20 %   of   Peak   P ˜   at   30 %   of   Peak P ˜   at   50 %   of   Peak
EfficiencyEfficiencyEfficiencyEfficiency
100%80%60%100%80%60%100% 80% 60% 100% 80% 60%
1 h34%34%34%28%28%28%25%25%25%21%21%21%
2 h56%56%56%45%45%45%38%37%37%27%27%27%
3 h75%75%75%56%56%56%43%43%43%32%32%32%
4 h90%90%90%62%62%62%48%48%48%36%36%36%
5 h100%100%100%68%68%68%53%53%53%41%41%41%
6 h100%100%100%73%73%73%58%58%58%45%45% 41% (45%)
7 h100%100%100%77%77%77%62%62%62%49%45% (49%)41% (47%)
8 h100%100%100%82%82%82%67%67%67%49% (53%)45% (51%)41% (49%)