Article

Optimization and Extended Applicability of Simplified Slug Flow Model for Liquid-Gas Flow in Horizontal and Near Horizontal Pipes

Resources Engineering Plant Research Department, Korea Institute of Geoscience and Mineral Resources, 905, Yeongilman-daero, Buk-gu, Pohang-si, Gyeongsangbuk-do 37559, Korea
*
Author to whom correspondence should be addressed.
Energies 2020, 13(4), 842; https://doi.org/10.3390/en13040842
Submission received: 14 January 2020 / Revised: 2 February 2020 / Accepted: 12 February 2020 / Published: 14 February 2020
(This article belongs to the Special Issue Fluid Flow and Heat Transfer Ⅱ)

Abstract

:
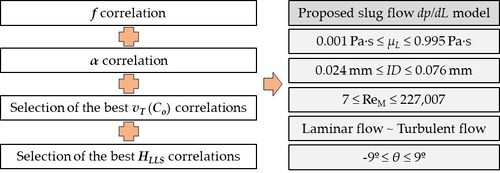
The accurate prediction of pressure loss for two-phase slug flow in pipes with a simple and powerful methodology has been desired. The calculation of pressure loss has generally been performed by complicated mechanistic models, most of which require the iteration of many variables. The objective of this study is to optimize the previously proposed simplified slug flow model for horizontal pipes, extending the applicability to turbulent flow conditions, i.e., high mixture Reynolds number and near horizontal pipes. The velocity field previously measured by particle image velocimetry further supports the suggested slug flow model which neglects the pressure loss in the liquid film region. A suitable prediction of slug characteristics such as slug liquid holdup and translational velocity (or flow coefficient) is required to advance the accuracy of calculated pressure loss. Therefore, the proper correlations of slug liquid holdup, flow coefficient, and friction factor are identified and utilized to calculate the pressure gradient for horizontal and near horizontal pipes. The optimized model presents a fair agreement with 2191 existing experimental data (0.001 ≤ μL ≤ 0.995 Pa∙s, 7 ≤ ReM ≤ 227,007 and −9 ≤ θ ≤ 9), showing −3% and 0.991 as values of the average relative error and the coefficient of determination, respectively.

Graphical Abstract

1. Introduction

Gas-liquid, two-phase slug flow in pipes is a commonly observed flow pattern in many industries such as petroleum, chemical, nuclear, ocean engineering, power plant, etc. The slug flow pattern has a repeating cycle of liquid slug body and liquid film region, coming with the fluctuation of pressure loss (see Figure 1). Based on the visual observations by Dukler and Hubbard [1], the slug has higher kinetic energy than that of the liquid film [2]. This intermittency can cause mechanical vibrations in the pipe with high structural loads threatening the stability of the system. Therefore, the understanding and prediction of pressure loss have great importance, while it is usually complicated since the calculation process requires the iteration of many variables.
In slug flow modeling for horizontal pipes, several pioneering models such as Wallis [3], Dukler and Hubbard [1], as well as Taitel and Barnea [4] were developed. These models commonly adopt the unit-cell concept. The unit-cell is an approximation based on the concept of an ideal slug unit, with a sharp change between slug and bubble regions. After Wallis [3], who introduced the equivalent unit-cell concept, Dukler and Hubbard [1] proposed the unit-cell model for horizontal flow. The balance equations are written in a frame of reference moving with the cell, so the flow appears steady [5]. Fully developed flow is assumed in both bubble and slug regions within the unit cell [6]. The unit-cell slug flow model constitutes nine parameters, which describe a slug unit moving with the translational velocity, vT. The sub-models in each region are often based on the two-fluid model for the bubble region, and the mixture model for the liquid slug section. In addition to the closure relations required for each sub-model, expressions for the bubble front velocity, the void fraction in the slug region, and a length scale (slug length or slug frequency) are necessary [7].
As Shoham [8] enumerated, Taitel and Barnea [4] suggested two methods for the pressure loss calculation. The first method consists of a global force balance on the entire slug unit, as formulated by Equation (1).
Δ p U = ρ U g sin θ L U + τ S π d A P L S + 0 L F τ F S F + τ G S G A P d z
ρ U = H L A v g . ρ L + ( 1 H L A v g . ) ρ G
where HL Avg. is the average liquid holdup of the slug unit. When the uniform equilibrium thickness in the liquid film is assumed, Equation (1) can be approximated and reformulated to Equation (3).
Δ p U = ρ S g sin θ L S + τ S π d A P L S + ρ F g sin θ L F + τ F S F A P L F + τ G S G A P L F
ρ S = H L L S ρ L + ( 1 H L L S ) ρ G
ρ F = H L T B ρ L + ( 1 H L T B ) ρ G
where HLLS and HLTB is the slug liquid holdup and the liquid film holdup, respectively.
The second method neglects the pressure loss in the liquid film (and gas pocket) region to calculate pressure loss in the slug unit, as written by Equation (6).
Δ p U = ρ S g sin θ L S + τ S π d A P L S Δ p M I X
where ∆pMIX is the pressure loss in the mixing region at the front of the liquid slug body. To be more exact, the term ∆pMIX includes variations of both kinetic and potential energy as the upstream liquid film is picked up by the following slug body. However, this term generally represents the effect of acceleration (kinetic).
More recently, Brito et al. [9] proposed a model to predict pressure gradient, simplifying Taitel & Barnea [4]. One of the main achievements of their model is the simple, fast, and convenient calculation of dp/dL with accuracy. In general, many mechanistic models developed for several decades require complex numerical calculations, including iteration. Furthermore, those calculations necessitate computational techniques to proceed with each step. The utilization of commercial software may provide the most reliable prediction of dp/dL, while it needs significant economic availability to use it. Meanwhile, Brito et al. [9] only targeted medium and high viscosity liquids (0.039 Pa∙s ≤ μL ≤ 0.601 Pa∙s), neglecting the pressure loss in the liquid film region (vLTB ≈ 0 and τF,G ≈ 0). From the visual observation with a high-speed video, Brito et al. [9] argued that most of the liquid is transported in the liquid slug. Their model is verified by experimental data obtained by Gokcal [10] and Brito [11] for the laminar flow condition, namely mixture Reynolds number up to 2000, while applying to the turbulent flow condition is not presented. As the authors limited the applicability of the model to relatively highly viscous liquids with laminar flow conditions, they simplified the friction factor as fS = 16/ReM, the flow coefficient as Co = 2.0, and utilized the correlation of Kora [12] for the slug liquid holdup, HLLS.
It should be noted that the suitable prediction of slug liquid holdup, HLLS, is essential for the proper calculation of dp/dL. The slug liquid holdup means the entrained gas void fraction in the liquid slug body. More entrained bubbles can reduce both mixture density and viscosity of liquid slug body, possibly decreasing the friction between the slug body and the inner pipe wall.
The understanding of HLLS should be started from the comprehension of entrainment at the slug front and deformation in the slug body. As reported by Kim [13], the main forces affecting the shape of entering bubble at the slug front are the shear of the surrounding liquid phase, buoyancy force, and the surface tension force. The entrainment mechanisms were observed to follow the plunging jet effect described by Kiger and Duncan [14]. The entering bubbles become sharpened as an increase in the shear, making an easy pass through the liquid slug front, simultaneously encountering higher resistance at higher surface tension. Unfortunately, a single unified model to predict HLLS has not been proposed appropriately, forcing to select the best correlations for different experimental and industrial conditions.
A single bubble rising in a quiescent (or stagnant) liquid pool has been characterized by a number of previous studies. For instance, Luther et al. [15], Cieslinski and Mosdorf [16], Ohta et al. [17], and Wu et al. [18] investigated the behavior of single bubble in the airlift reactor. Bunner and Tryggvason [19], Lu and Tryggvason [20], and Ziegenhein and Lucas [21] observed the characters of bubbles in vertical bubbly flow. As Bunner and Tryggvason [19] commented, these studies are valuable for many industrial processes, such as boiling heat transfer, cloud cavitation in hydraulic systems, stirring of reactors, aeration in water purification, bubble columns and centrifuges in the petrochemical industry, cooling devices of nuclear reactors, and scavenging of dissolved gases in separation process. However, the bubble entrainment phenomena in liquid-gas two-phase slug flow have not been analyzed correctly as this pattern has a transient behavior of repeating liquid slug body and film region.
Most of the existing HLLS correlations are only applicable to a specific range of fluid properties and operational conditions, limiting their applications. The correlations of HLLS, in general, are empirical considering the utilized pipe diameter, fluid properties, and pipe inclination angle in each experimental study, i.e., Gregory et al. [22]; light oil-air, μL = 0.007 Pa∙s, 0°, 25.4- and 50.8-mm-ID, Andreussi and Bendiksen [23]; water-air, μL = 0.001 Pa∙s, −3°~0.5°, 50.8- and 90-mm-ID, Felizola [24]; kerosene-air, μL = 0.001 Pa∙s, 0°~90°, 50.8-mm-ID, Abdul-Majeed [25]; light oil-air, μL = 0.02 Pa∙s, 0°, 50.8-mm-ID, Marcano [26]; kerosene, μL = 0.002 Pa∙s, 0°, 78-mm-ID, Kora [12]; heavy oil-air, 0.179 Pa∙s ≤ μL ≤ 0.601 Pa∙s, 0°, 50.8-mm-ID. The most usual empirical method is to find the trend-line that has the highest coefficient of determination (R2). The application of these correlations to other conditions typically presents a large discrepancy. As a result, the understanding of each HLLS correlation is obligatory.
In this study, the simplified model proposed by Brito et al. [9] is modified and optimized to extend its applicability to turbulent flow conditions for horizontal and near horizontal pipes. The main postulation of neglecting the pressure gradient in the liquid film region is further supported by velocity fields measured by particle image velocimetry (PIV) in the previous study. The calculation of the wall shear stress of liquid slug body is advanced by adopting a suitable correlation of friction factor. The optimal correlations of slug liquid holdup, HLLS, and flow coefficient, Co, are identified and utilized to calculate the pressure gradient. The proposed pressure gradient model is verified by 2191 previously obtained experimental data of Gokcal [10], Brito [11], Kim [27] and [13], Ekinci [28], Mukherjee [29], and Kokal [30] with 0.001 Pa∙s ≤ μL ≤ 0.995 Pa∙s, 0.024 mm ≤ ID ≤ 0.076 mm, 7 ≤ ReM ≤ 227,007, and −9° ≤ θ ≤ 9°.

2. Methodology

Brito et al. [9] proposed a simplified pressure gradient model derived from Equation (7) (or Equation (3)) developed by Taitel and Barnea [4] as follows:
d p d L | U = ρ S g sin θ L S L U + τ S π d A P L S L U + ρ F g sin θ L F L U + τ F S F A P L F L U + τ G S G A P L F L U
where the ratio LS/LU is determined from the mass balance for the case of equilibrium liquid film as follows:
W L = v L L S ρ L A P H L L S L S L U + 1 L U 0 L F v L T B ρ L A P H L T B d L
W L ρ L A P = v S L = v L L S H L L S L S L U + v L T B H L T B L F L U
L S L U = ( v S L v L T B H L T B ) ( v L L S H L L S v L T B H L T B )
where WL is the input liquid mass-flow rate, vLLS is the average liquid velocity in the slug body, and vLTB is the velocity in the liquid film.
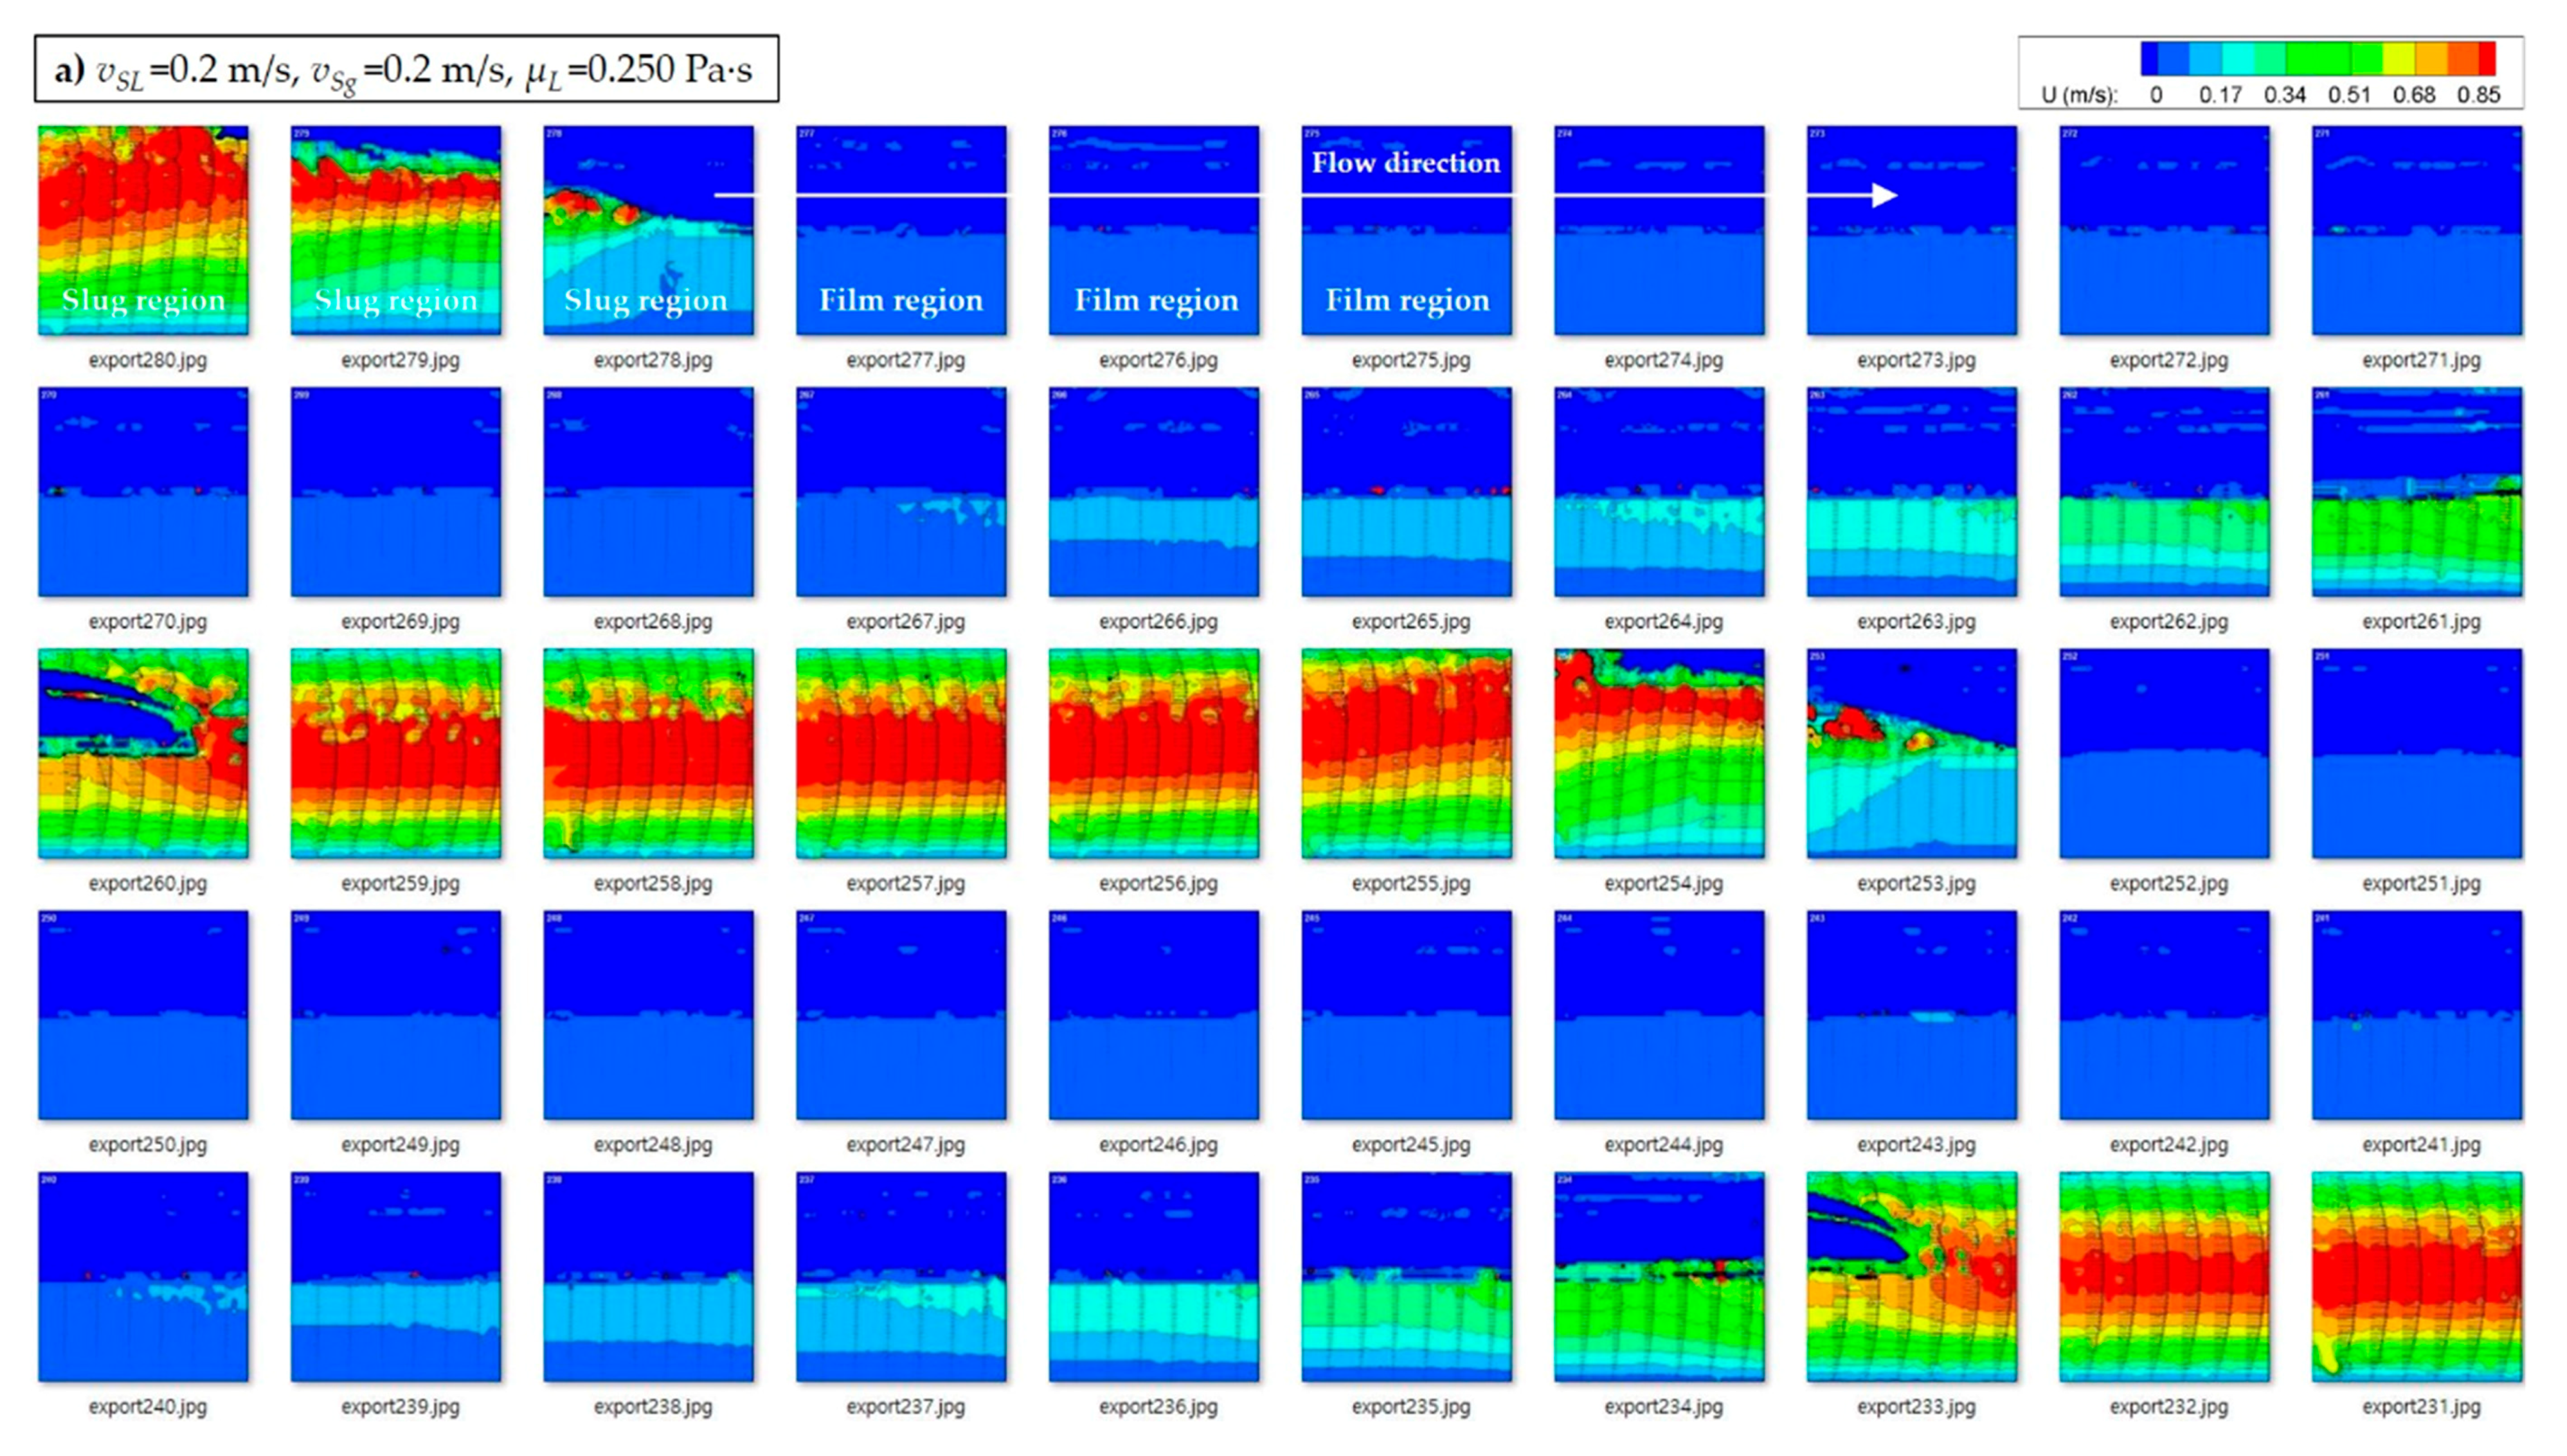
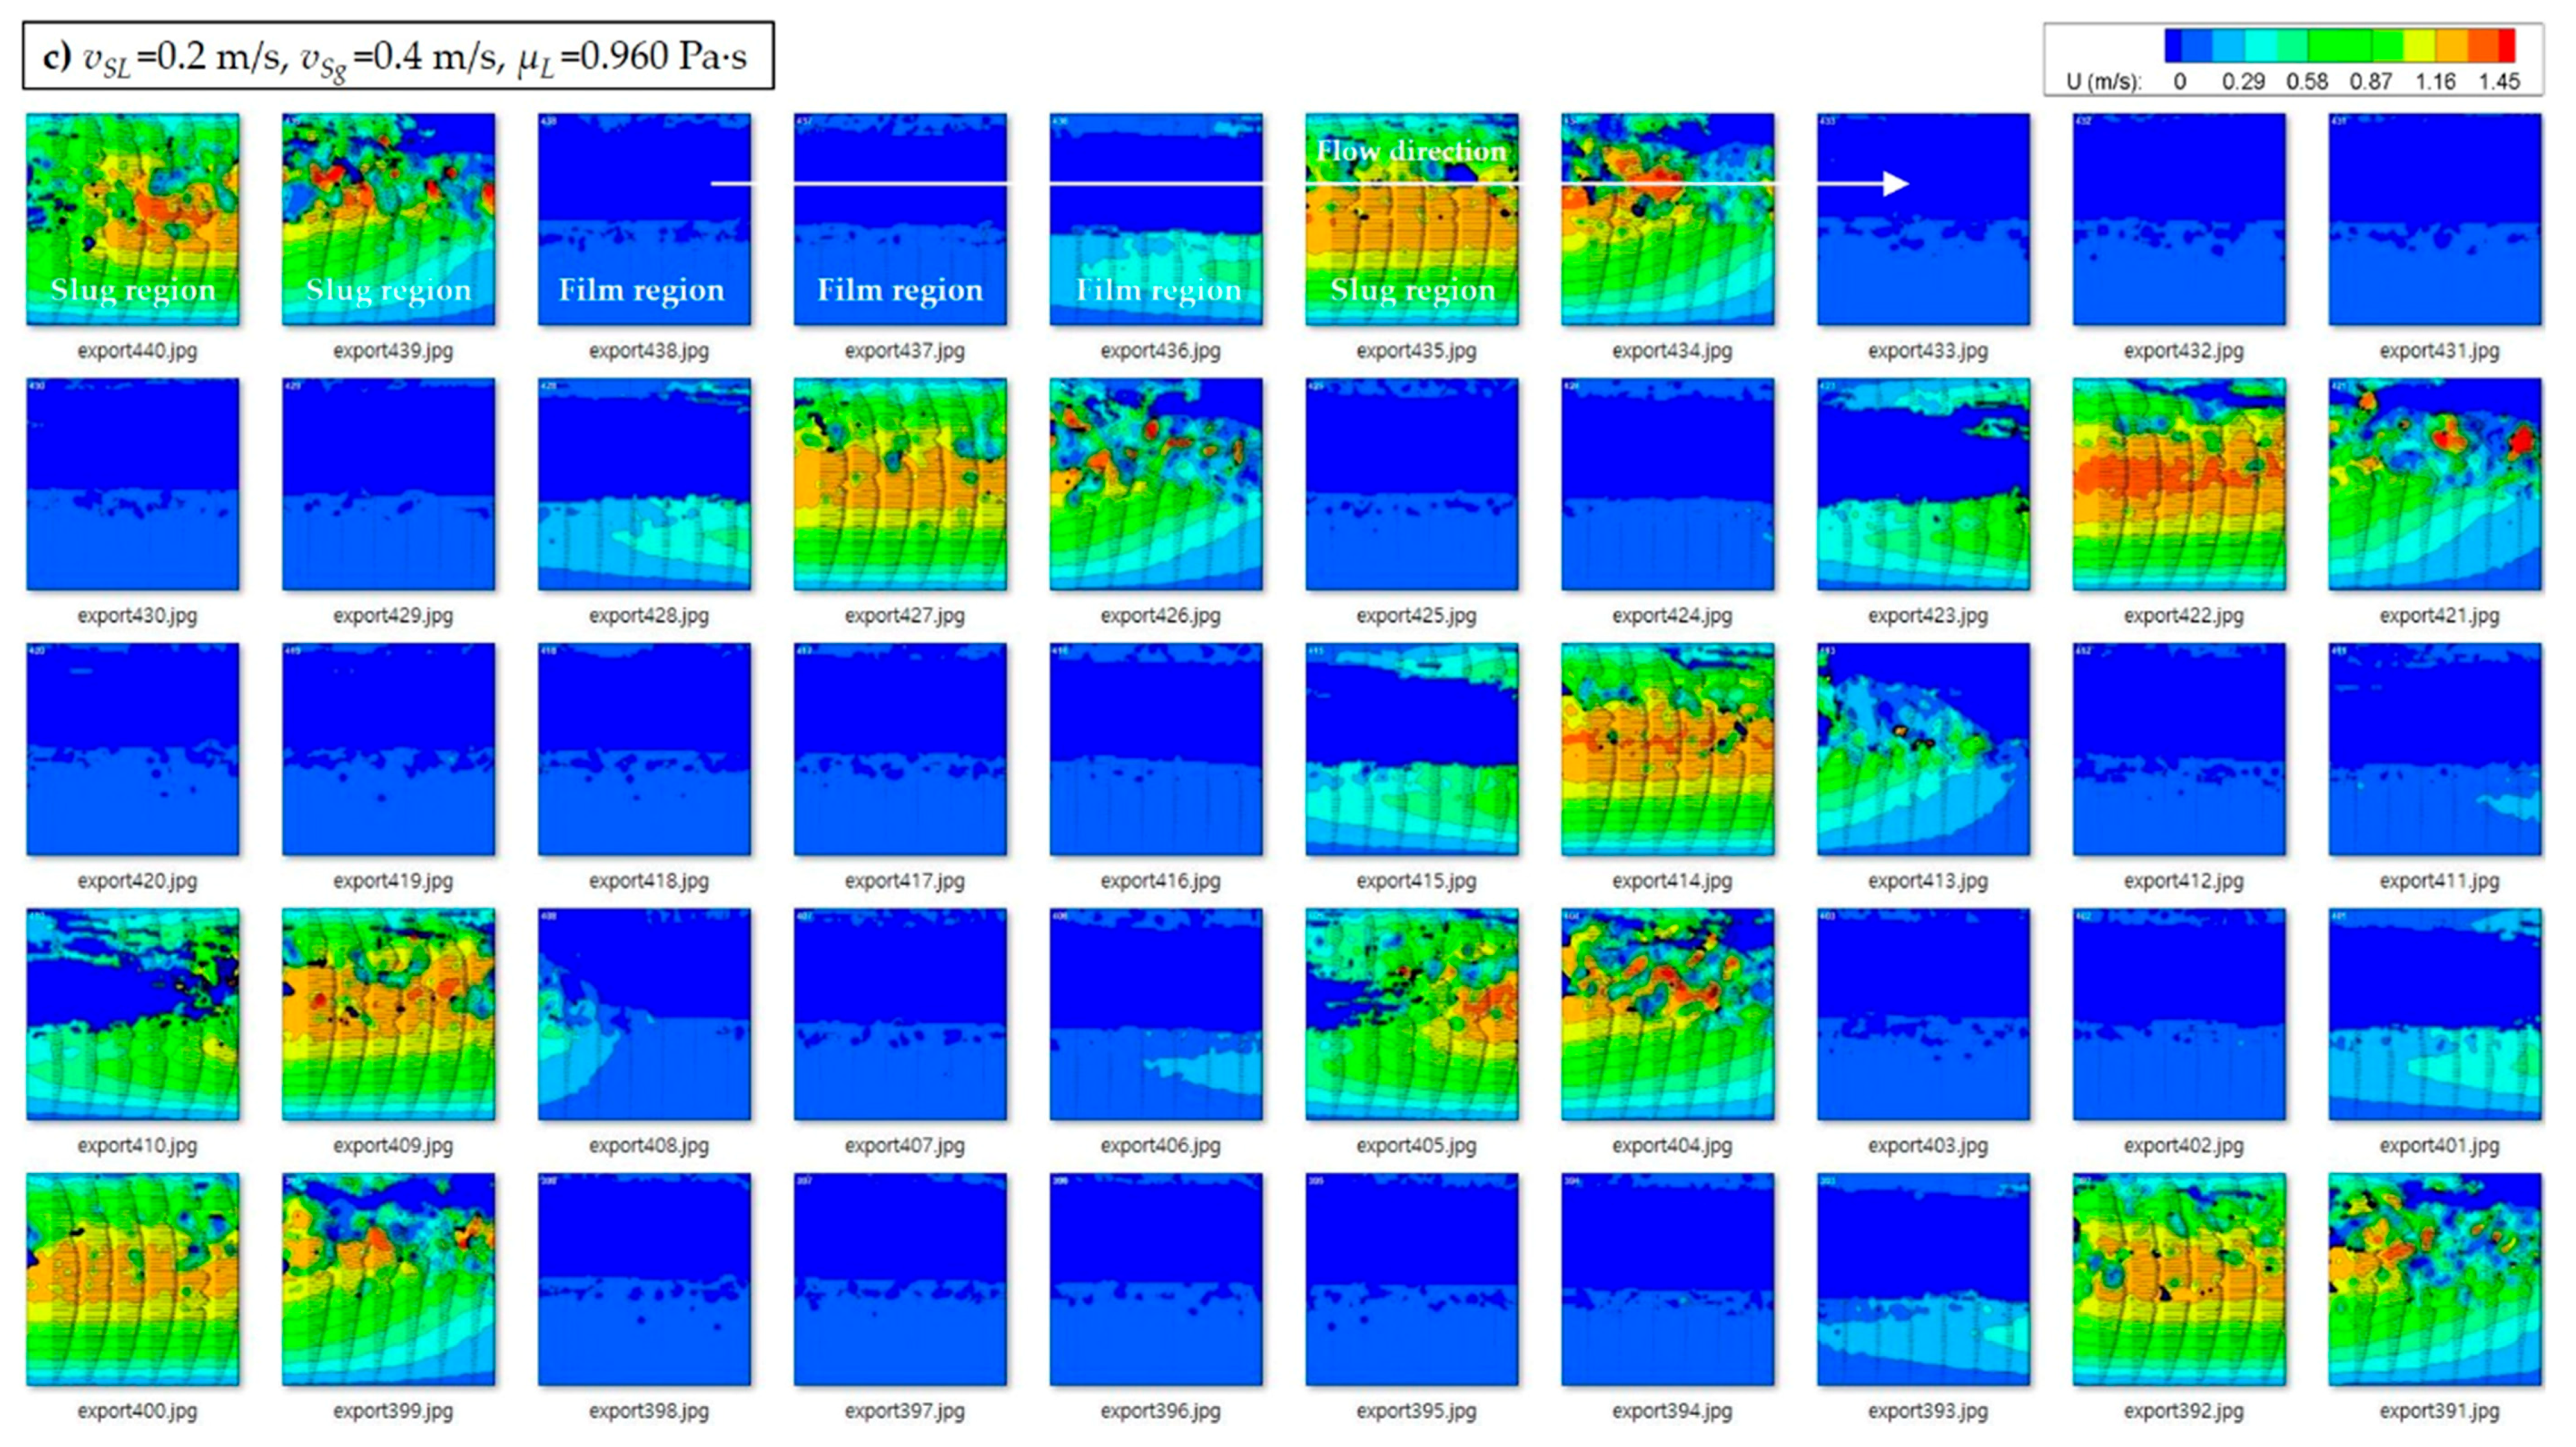
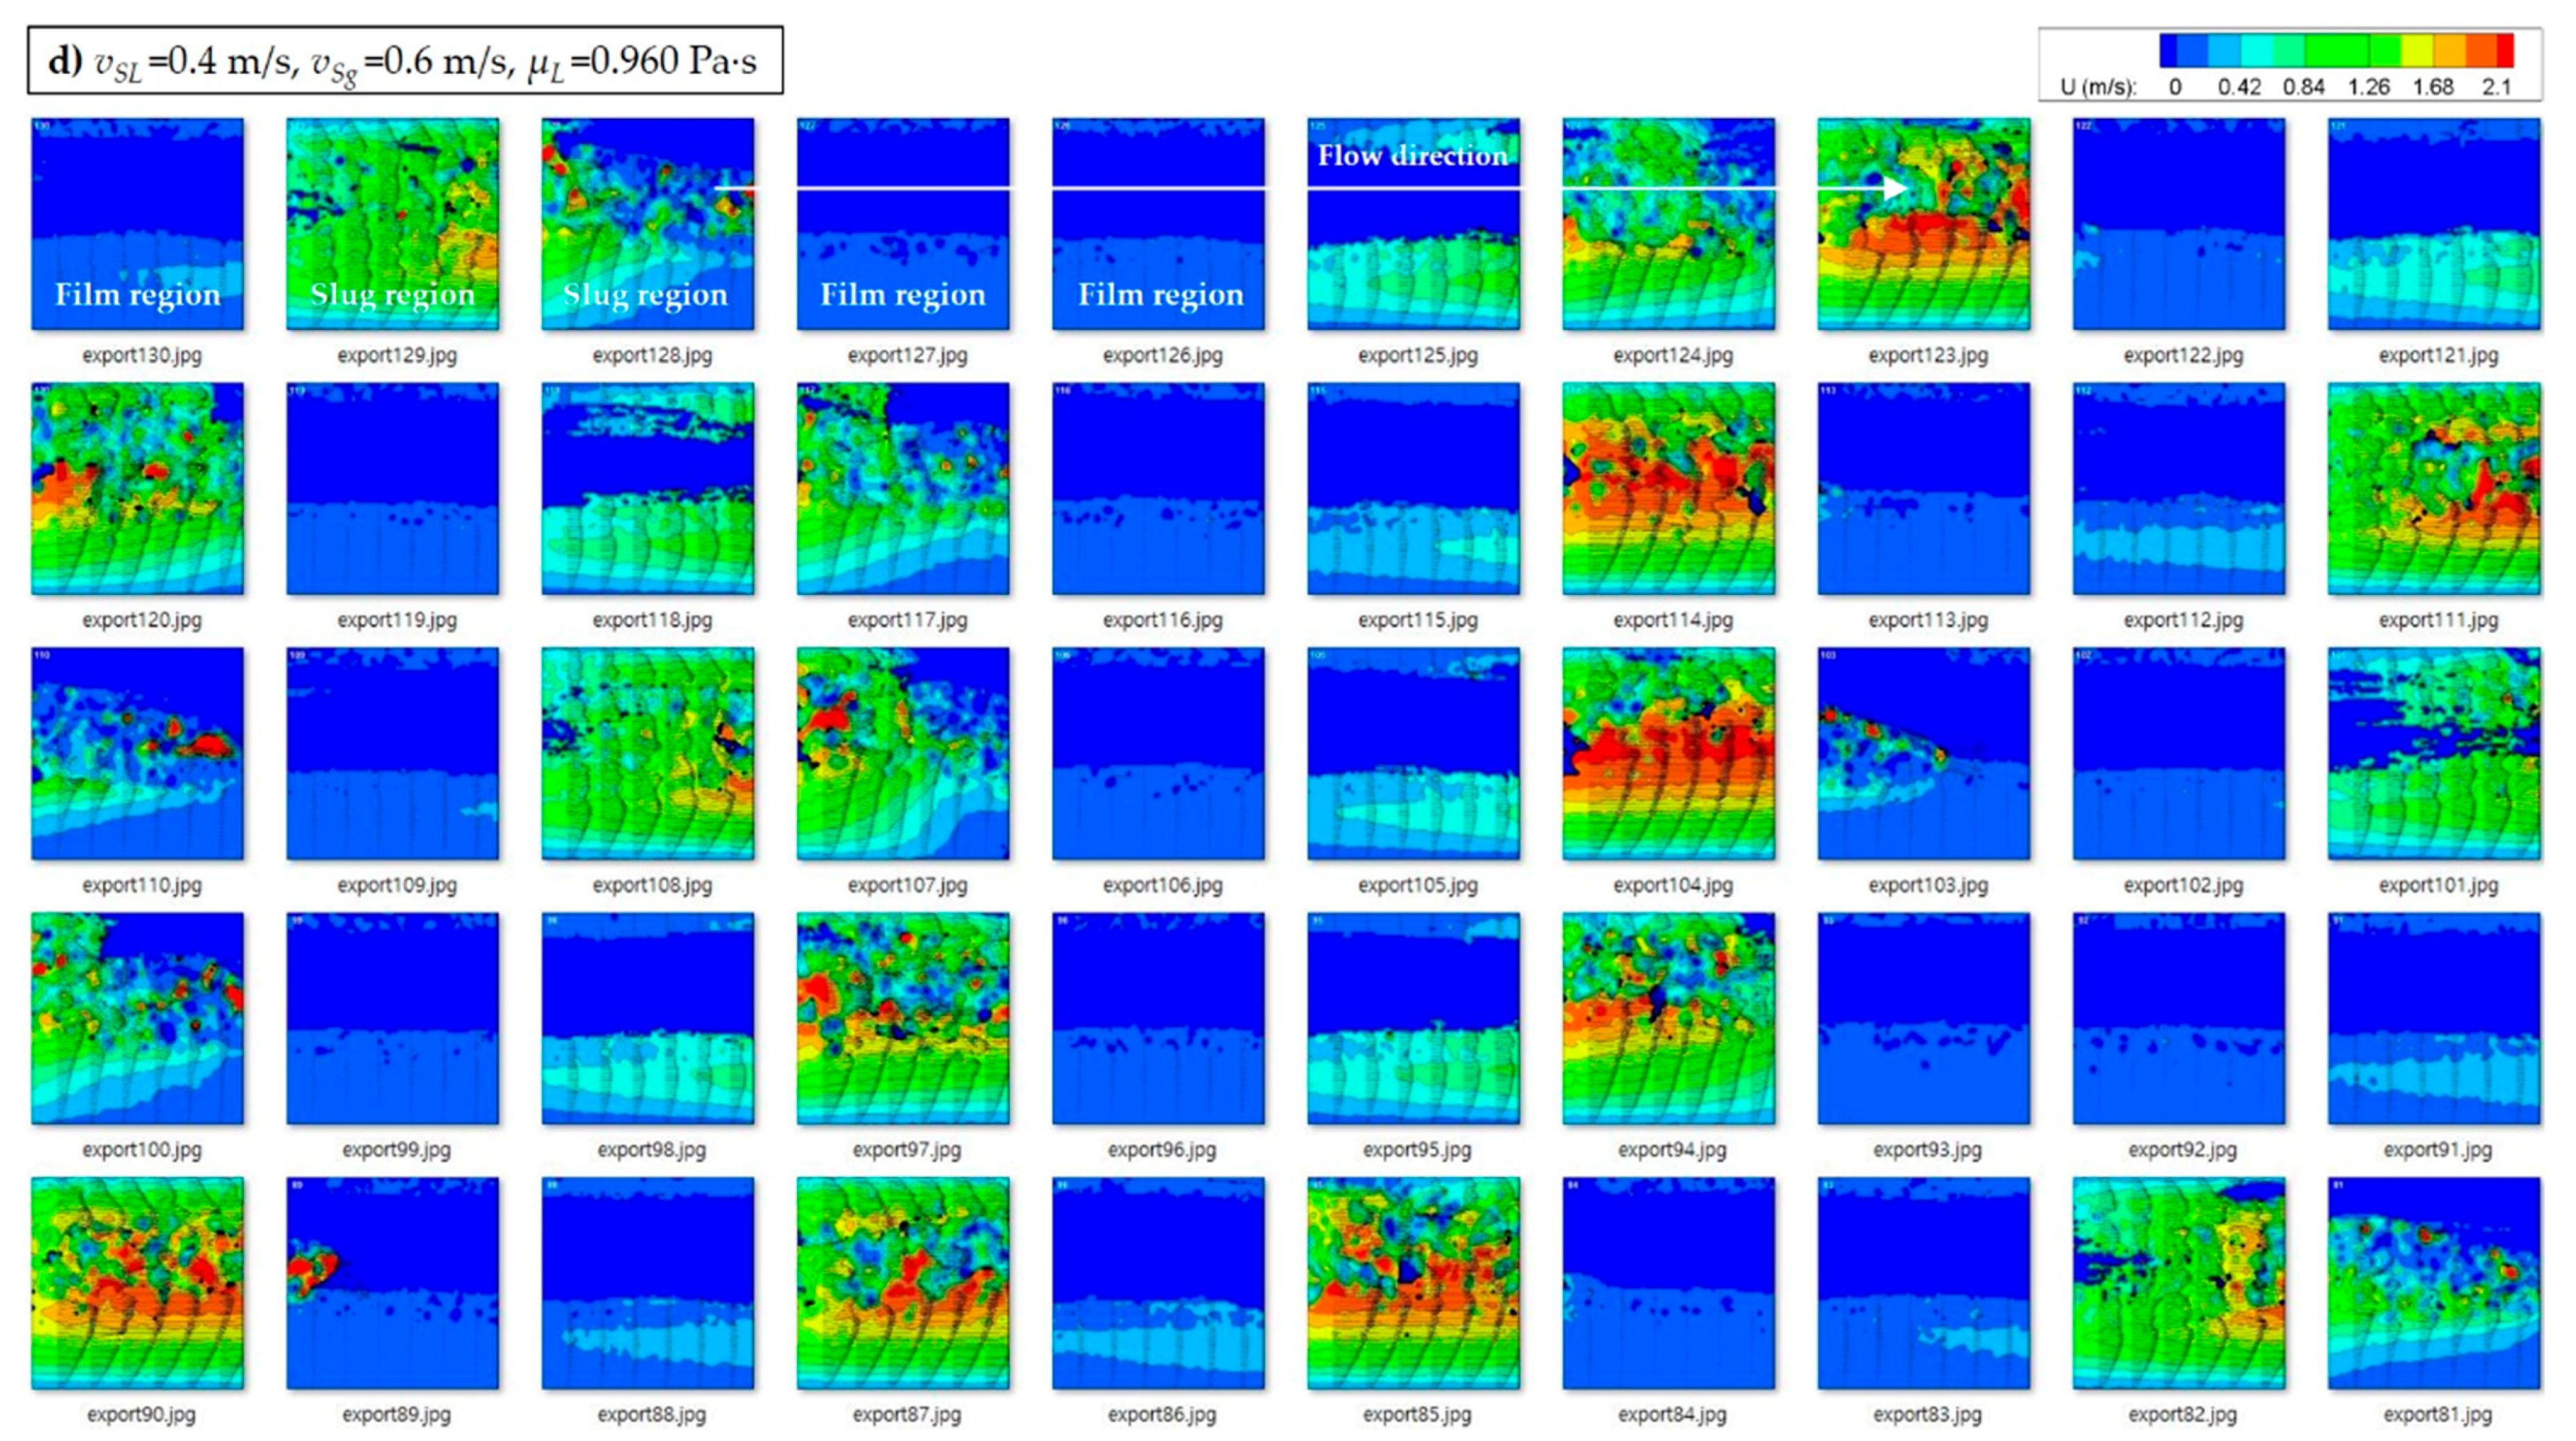
The authors argued low velocity of the liquid film (vLTB ≈ 0 and τF,G ≈ 0) with negligible accelerational pressure gradient (∆pMIX ≈ 0). The inner velocity field measured by Kim et al. [2] utilizing particle image velocimetry (PIV) also supports the postulation of low velocity of the liquid film, neglecting the pressure loss of liquid film. Kim et al. [2] performed the experimental study with 0.250 Pa∙s ≤ μL ≤ 0.960 Pa∙s for horizontal 50.8-mm (2-in.) ID pipe and laminar flow conditions. The in-situ velocity profiles at the center of pipe cross-section were measured and analyzed in liquid phase only. The measured velocity fields illustrate that the velocity of the liquid film is close to zero (or much slower than the liquid slug body), especially near the inner pipe wall (see Figure 2). It should be noted that the consecutive images of slug bodies in Figure 2 have some discontinuities caused by the limited laser frequency of the PIV system.
The illustrated results in Figure 2 were obtained with highly viscous flow conditions. This may be posed the question of “Is the low velocity of liquid film also valid for low liquid viscosity?” The recent experimental results by Gokcal [10,31] Kora [12], Al-safran et al. [32], Brito [11], and Kim [27] elucidated that slug length increases and slug frequency decreases as the liquid viscosity decreases. Gokcal [10] described that an increase in liquid viscosity caused a decrease in Reynolds number and the turbulence in the mixing zone at the front of the slug. Accordingly, the slug length decreases with the decrease of mixing length for increasing liquid viscosity. Experimental results of Brito [11] with relatively medium and high liquid viscosity (0.039–0.166 Pa·s) also indicated shorter slug lengths as liquid viscosity increases. These results may indicate that the effects of liquid film region on the total pressure loss becomes more negligible as liquid viscosity decreases. This conclusion might still be a rough postulation to support the neglect of the film region in a simplified slug flow model even with low viscosity conditions. A more rigorous experimental measurement may be required in the future study, although the application of the simplified model embraces all of the fluid conditions in this study.
Substituting Equation (10) into Equation (7), the largest pressure loss within the slug unit in horizontal and near horizontal flow can be approximated by Equation (11). Unlike the model suggested by Brito et al. [9], the first term remains for the near horizontal flow condition. In this study, the inclination range of near horizontal condition is chosen as −9 ≤ θ ≤ 9, arbitrarily.
d p d L | U ρ S g sin θ ( v S L v L T B H L T B ) ( v L L S H L L S v L T B H L T B ) + τ S π d A P ( v S L v L T B H L T B ) ( v L L S H L L S v L T B H L T B ) + ρ F g sin θ L F L U + τ F S F A P L F L U + τ G S G A P L F L U ρ S g sin θ v S L v L L S H L L S + τ S π d A P v S L v L L S H L L S
where vLLS can be formulated using the mass balance equation of the liquid and gas phase.
H L A v g . = v T H L L S v L L S H L L S + v S L v T = v T H L L S + v G L S ( 1 H L L S ) v S g v T
The entrained gas-bubble velocity in liquid slug body, vGLS, has different values depending on its location in the slug. As visually observed by Kim [13], the vortices generated at the mixing zone in the front of the liquid slug body induce shear on the air phase as the air is further entrained into the slug body. The entrained bubbles are squeezed owing to the induced shear (see Figure 3). From the middle of the liquid slug body, the velocity of entrained bubbles is assimilated to the one of the liquid slug. Therefore, vGLS is postulated to be the contribution of the mixture velocity, vGLSCovM in this study.
Based on the above assumption, Equation (12) can be reformulated to calculate the average liquid velocity in the slug body, vLLS, as follows:
v L L S = v M 1 C o ( 1 H L L S ) H L L S
As a result, the final form of the simplified slug flow model for the horizontal and near horizontal condition can be expressed by Equation (14).
d p d L | U v S L v M ( 1 C o ( 1 H L L S ) ) ( τ S π d A P + ρ S g sin θ ) or d p d L | U v S L v L L S H L L S ( τ S π d A P + ρ S g sin θ )
There is no term of slug length, LS, in the suggested model as the possible effects of liquid film region on dp/dL are neglected. This might limit the applicability of the currently proposed model to the case, such as boiling of water. For instance, the non-equilibrium slug flow model (NESM) for vertically upward flow described by Barbosa and Hewitt [33] emphasizes the generation of large Taylor bubbles. This phenomenon might be caused by the abrupt vapor growth in the sub-cooled near zero quality regions. As a result, the slug length could be a key factor when it comes to the heat and phase exchange. In this study, as Kim [13] experimentally observed, the amount of entrained bubbles in the liquid slug body is in a steady-state condition. On the other hand, this is only possible when the pipe is fully insulated which indicates negligible heat flux as the fluid (particularly water) temperature is equal to the ambient or pipe wall temperature.
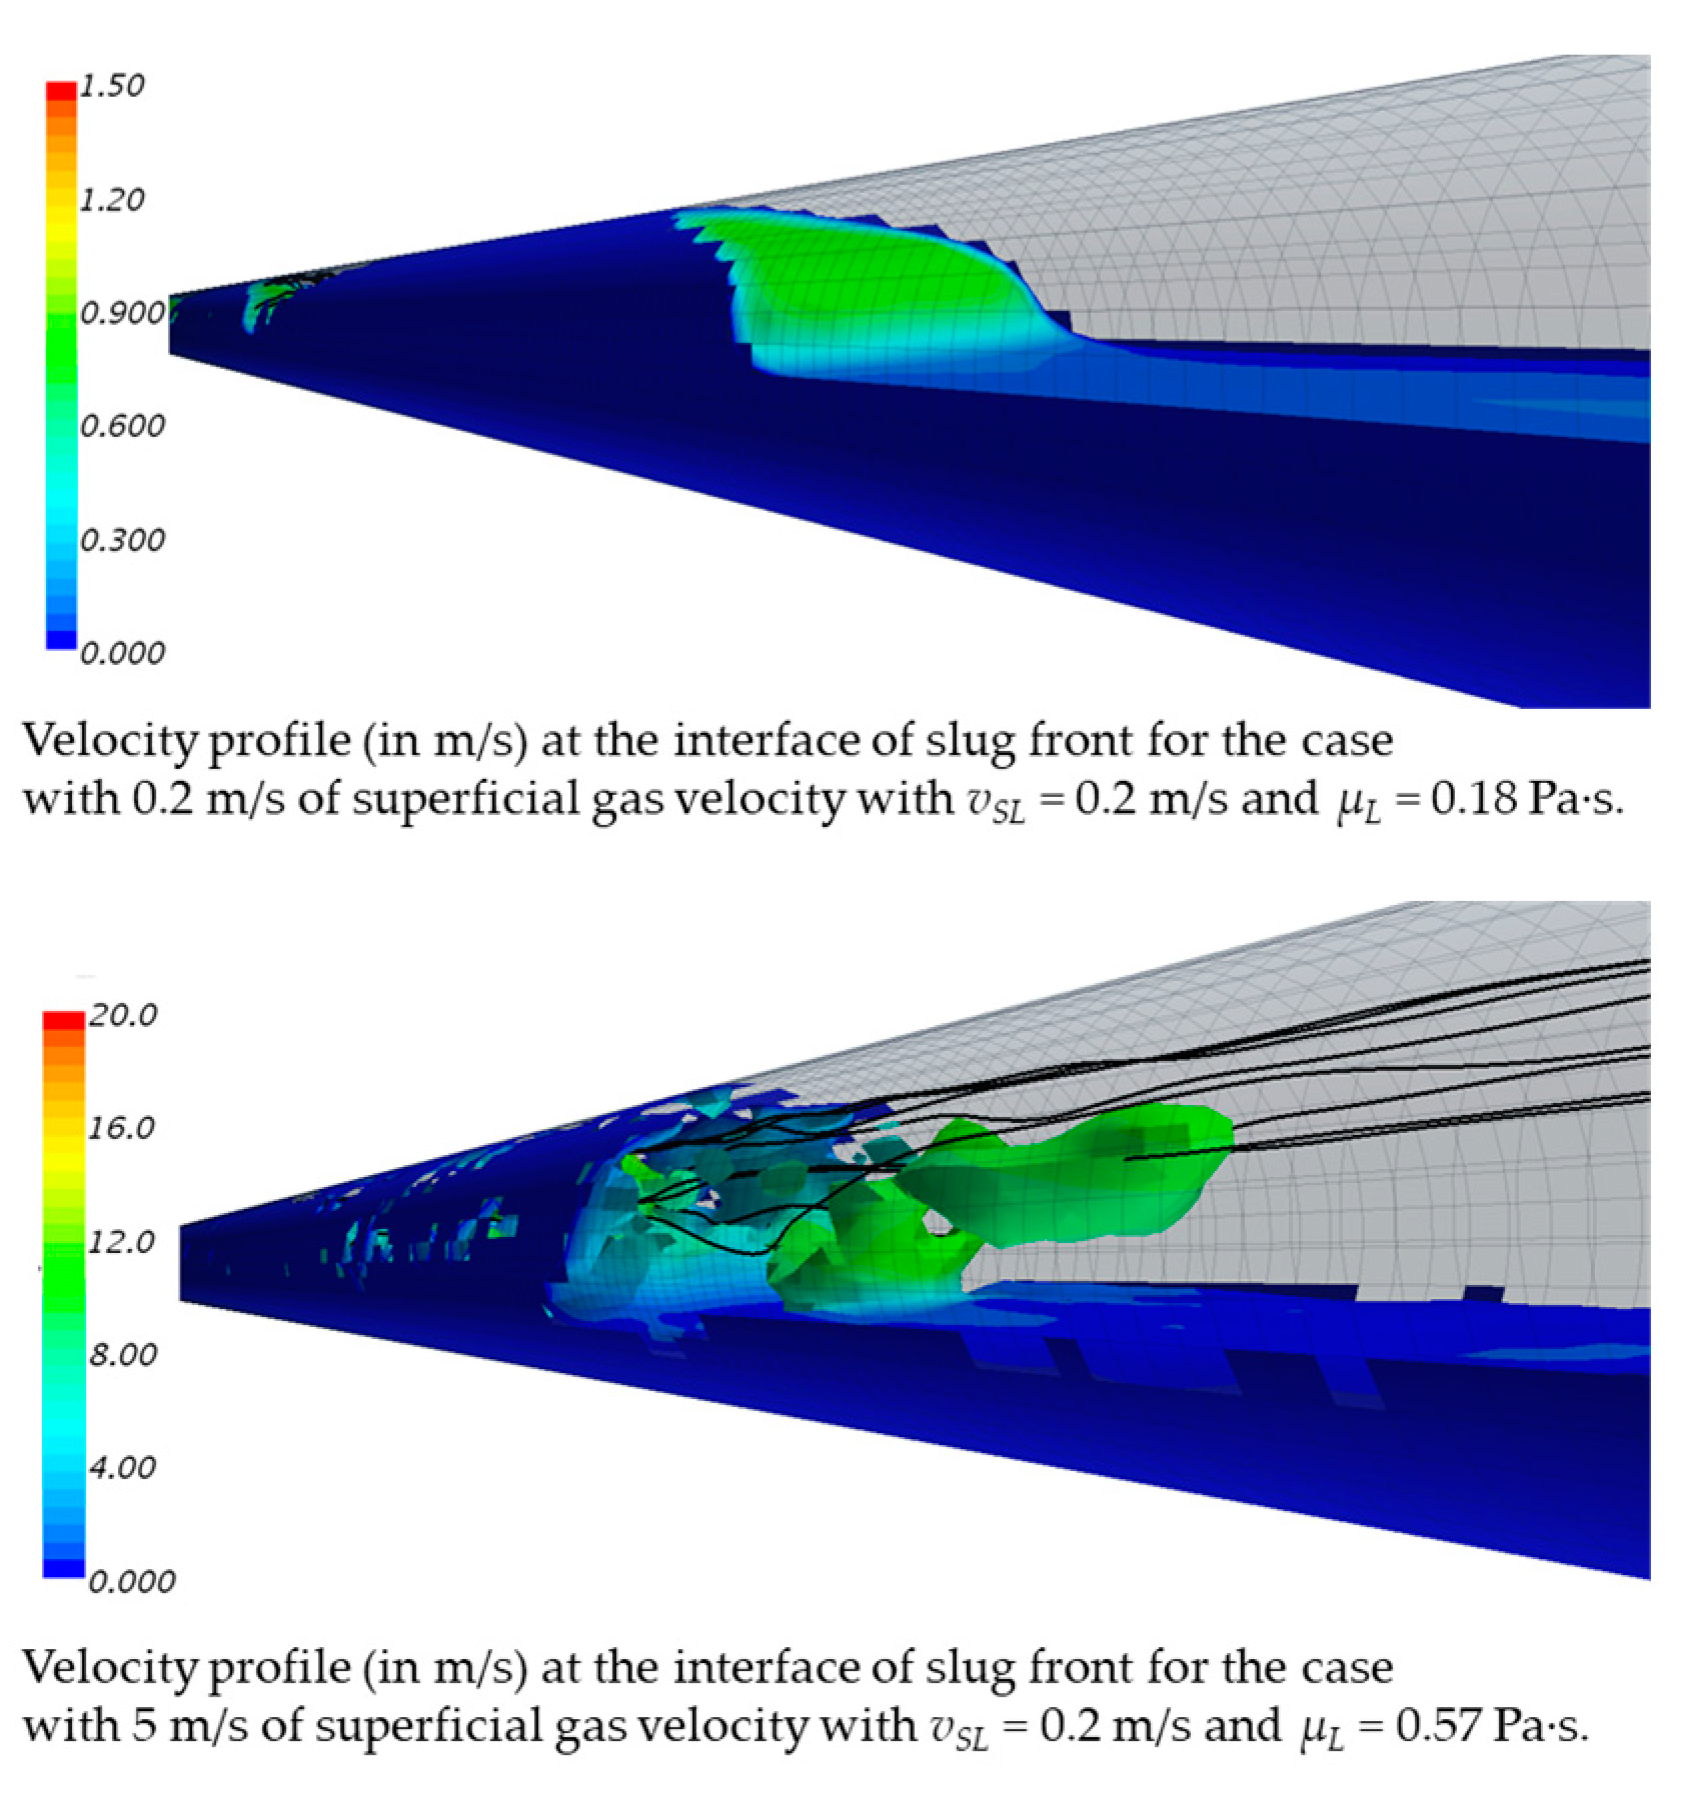
Recently, Kim [13] reported that shorter slug length might cause the pseudo-slug flow at relatively lower mixture velocity conditions as liquid viscosity increases. The author presented the computational fluid dynamic (CFD) result of Pineda et al. [34], indicating that the gas is blowing in the upper part of the slug body. Then, the liquid does not generate a hydraulic sealing between the tail and the front of the slug, generating unstable slug body or so-called the pseudo-slug flow (see Figure 4). In the current study, the data sources of pressure gradient include the pseudo-slug flow (typically when vM ≥ 5 m/s), and the proposed model shows suitable agreements with them as will be presented in Section 3. However, a more rigorous analysis and modeling study will be required in future studies to understand the pseudo-slug flow mechanistically, considering its length scale. It should be noted that the proposed model postulates that the system temperature is constant following the axial direction of pipe, so the viscosities of each phase are constant.
The originally simplified model only focuses on the laminar flow condition, i.e., ReM < 2000. In Brito et al. [9], the shear stress in the liquid slug was simplified using f = 16/ReM and τS = 8 μSvS/d. In addition, as the only highly viscous liquid was targeted, the slug liquid holdup correlation of Kora [12] was utilized. The application of the original model to the turbulent flow condition was inappropriate owing to the limited ReM range of HLLS correlation of Kora [12] and Fanning friction factor, and constant value of flow coefficient, Co = 2.0.
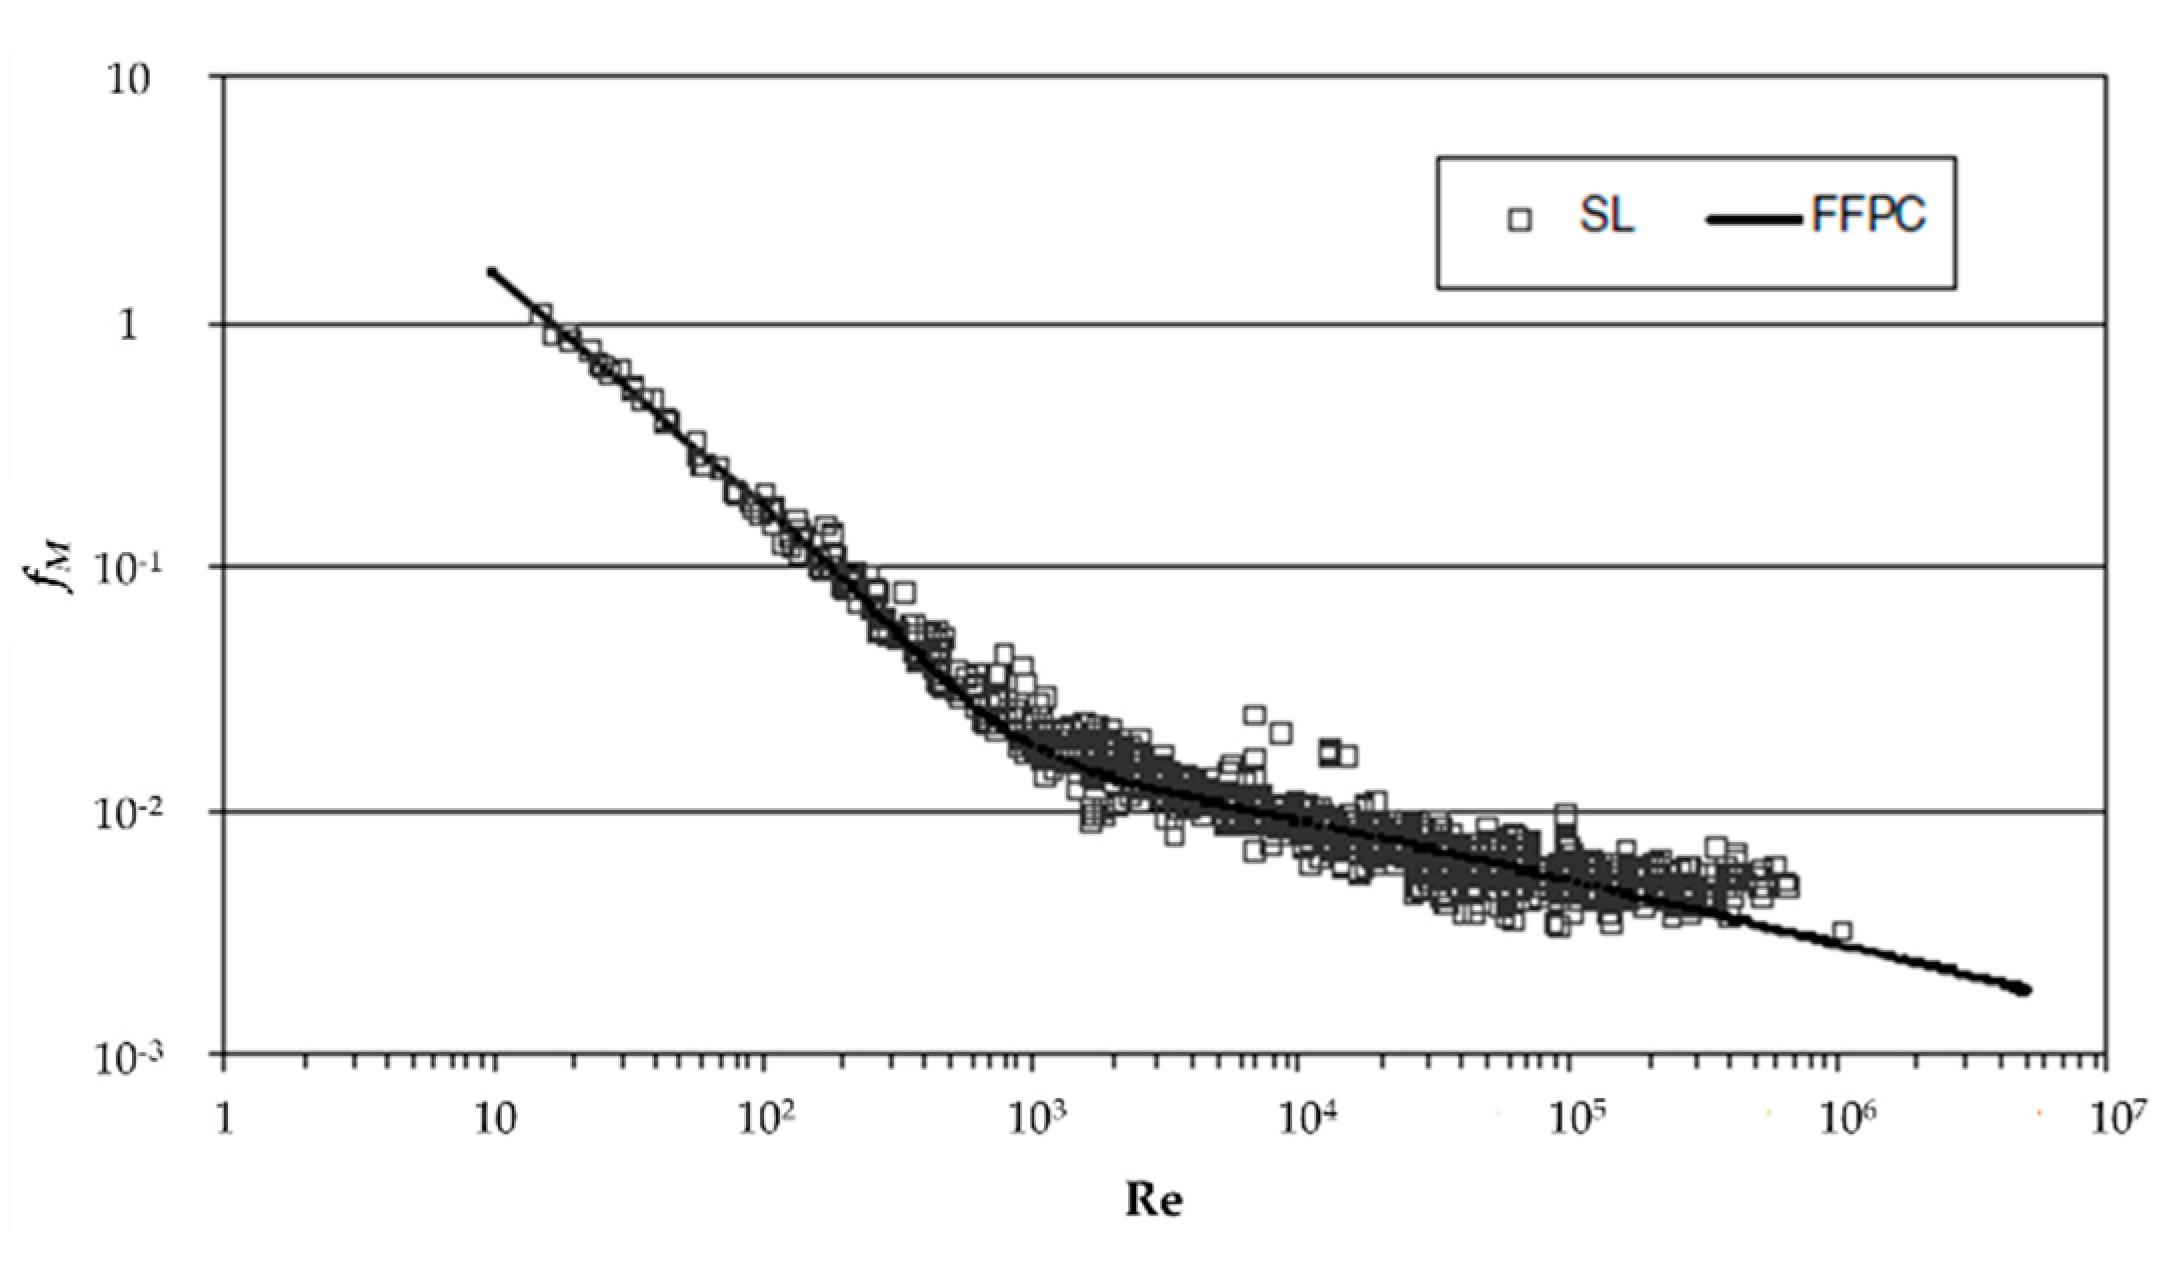
In this study, the improved composite correlation for the two-phase slug flow friction factor developed by Garcia et al. [35] is adopted to overcome the previous limitation. The proposed correlation includes a wide range of ReM that is applicable to both laminar and turbulent flow conditions (see Figure 5 and Equation (15)).
f S = 0.1067 R e M 0.2629 + 13.98 R e M 0.9501 0.1067 R e M 0.2629 ( 1 + ( R e M 293 ) 3.577 ) 0.2029
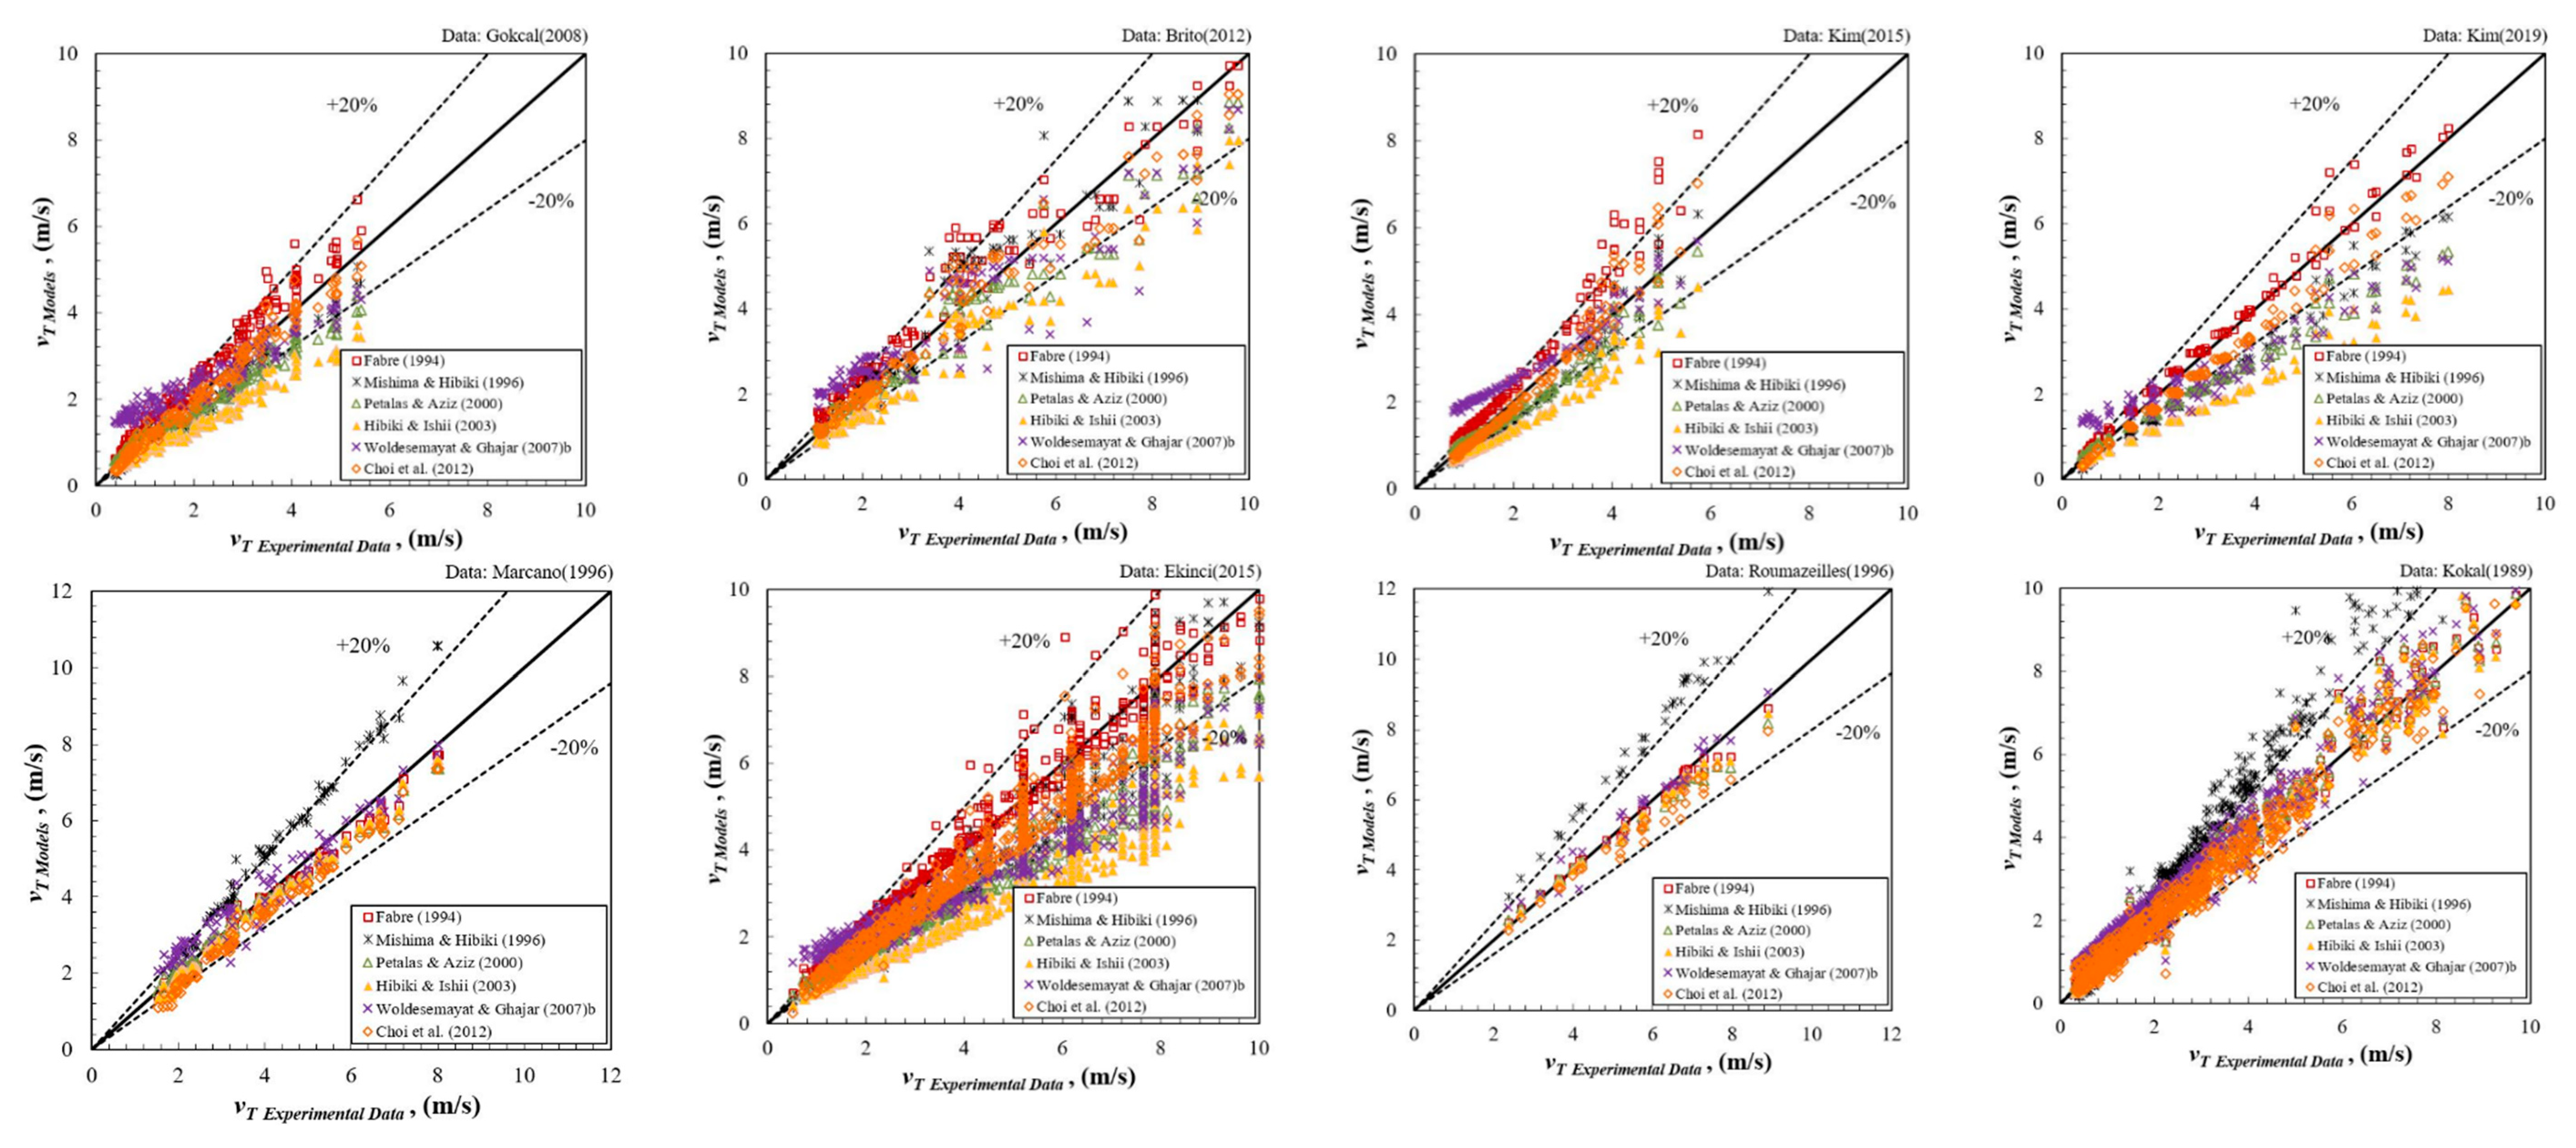
In the case of the flow coefficient, Co, which needs to be optimized to calculate vLLS in Equation (14), several different correlations of translational velocity are compared to the previously obtained experimental data. Table 1 and Table 2 summarize the experimental dataset and the compared correlations, respectively, to optimize the proper value of Co. The model of Choi et al. [36] requires the proper correlation of gas void fraction. Woldesemayat and Ghajar [37] improved the correlation of gas void fraction by Dix (Coddington & Macian [38]), validating it with a very extensive number of data, i.e., 2845 experimental points, as given in Equation (16). This model shows a good match, | ε 1 | < 8%, with the measured average liquid holdup (HL Avg.) data obtained by Brito [11], Mukherjee [29], and Kokal [30] (see Figure 6). These data were not verified by Woldesemayat and Ghajar [37], previously. Therefore, their correlation is utilized to calculate the average gas void fraction in this study.
α = v S g v S g ( 1 + v S L v S g ( ρ G ρ L ) 0.1 ) + 2.9 [ g d σ ( 1 + cos θ ) ( ρ L ρ G ) ρ L 2 ] 0.25 ( 1.22 + 1.22 sin θ ) p a t m p s y s t e m
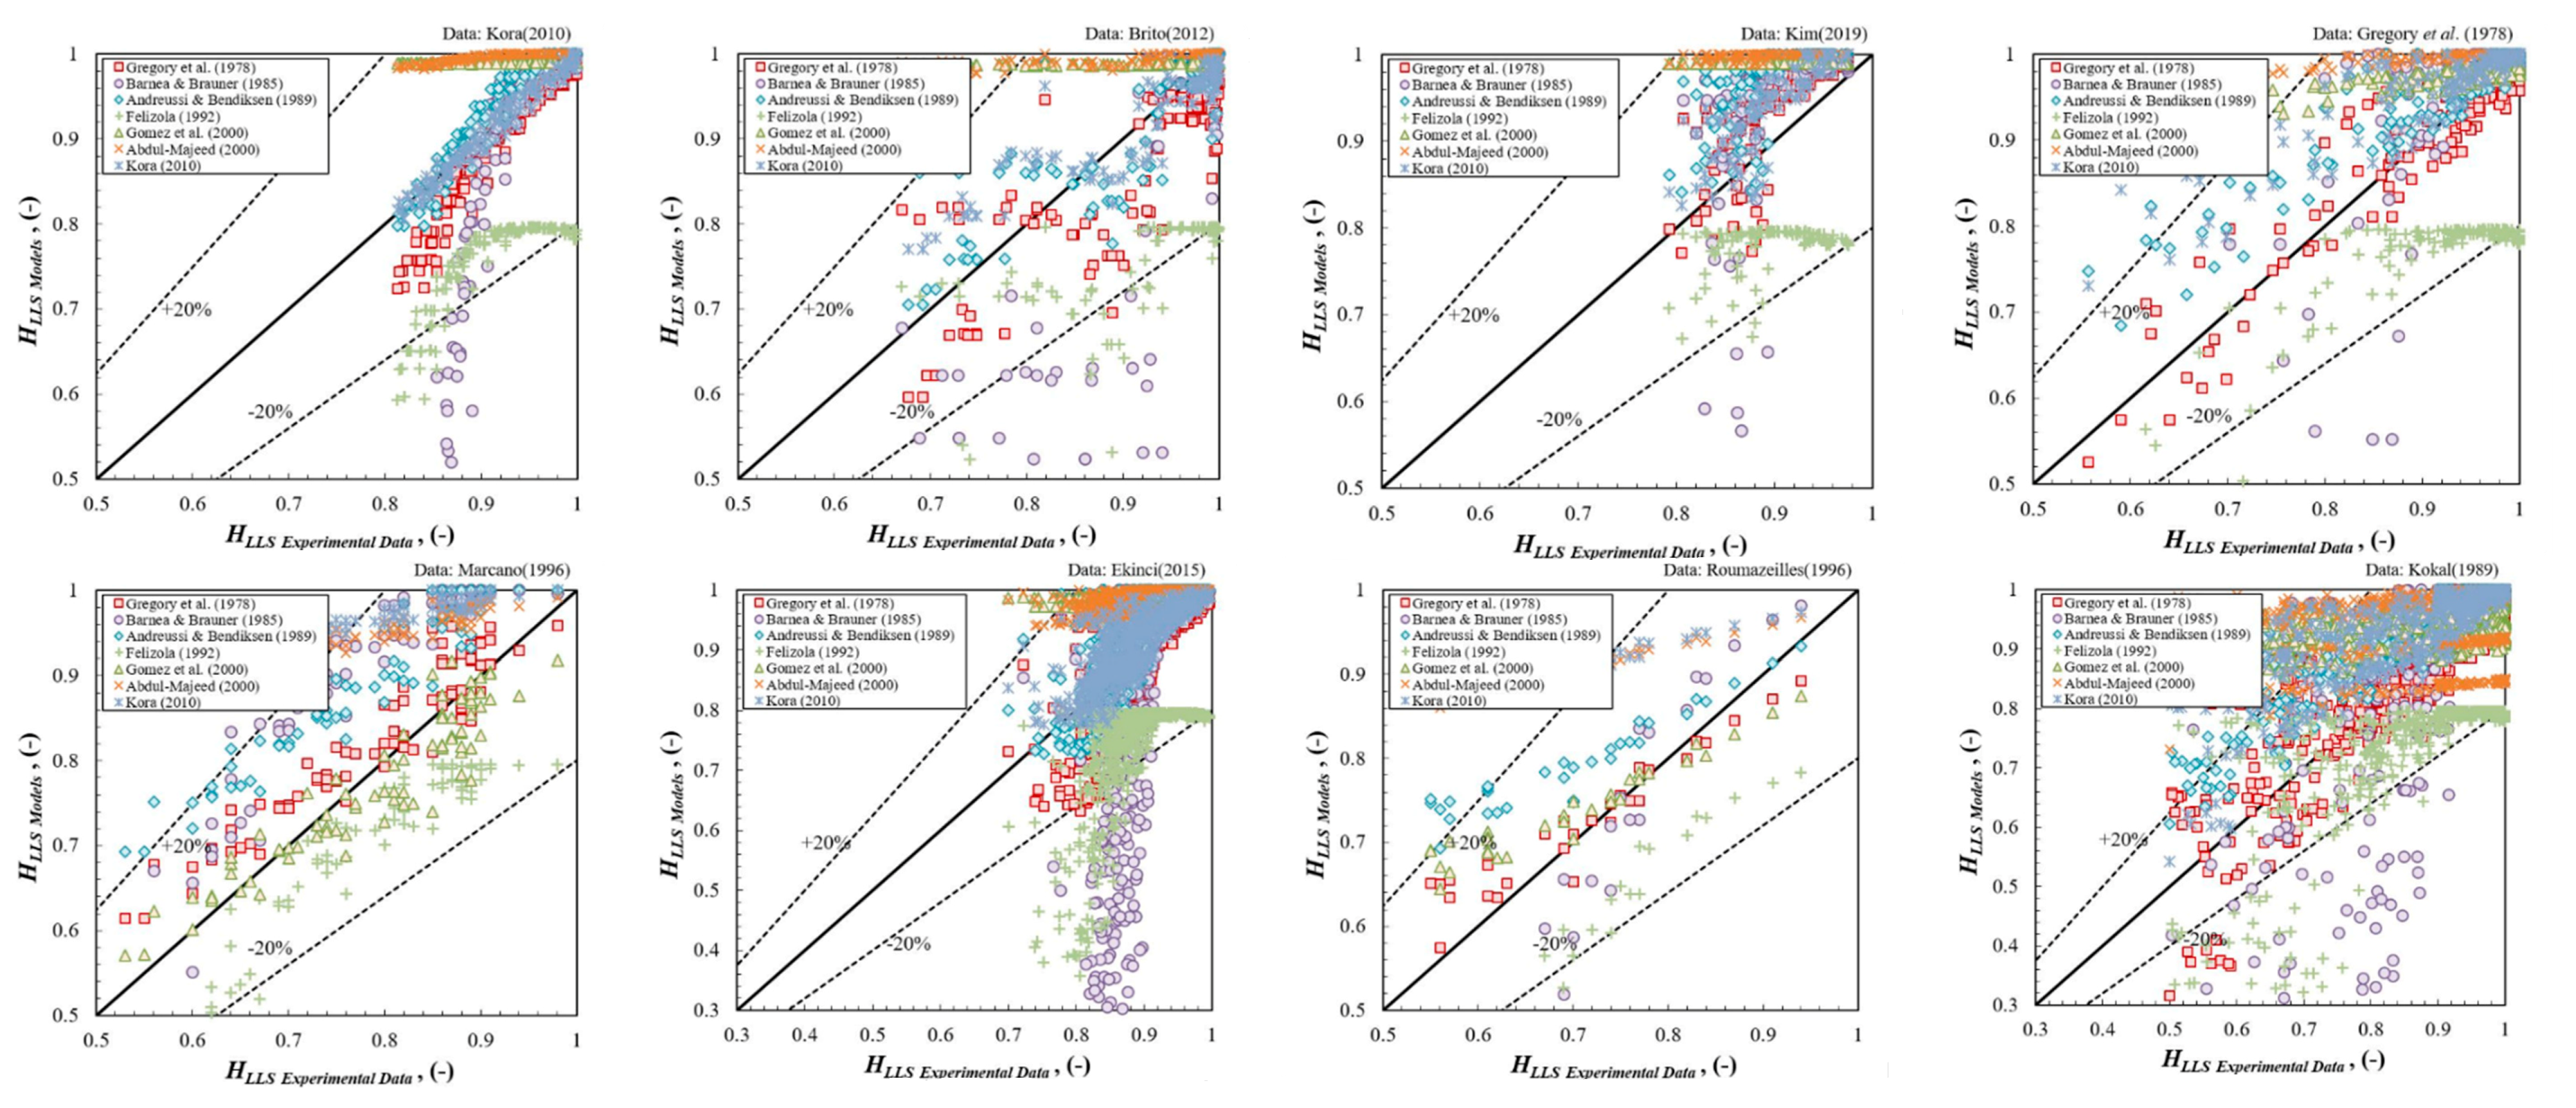
Likewise, the experimental data of slug liquid holdup, HLLS, and some correlations are listed in Table 3 and Table 4, respectively. The best models of vT and HLLS for each experimental dataset, evaluated by six statistical parameters, relative performance factor, Frp, and the coefficient of determination, R2, are utilized to calculate the pressure gradient with Equation (14).
Six statistical parameters are used to evaluate the performance of the models, namely, the average relative error (ε1), absolute average relative error (ε2), standard deviation of relative error (ε3), average actual error (ε4), absolute average actual error (ε5), and standard deviation of actual error (ε6). Actual error (ei) and relative error (ej) expressed in Equations (17) and (18) are used to calculate the statistical parameters defined in Equations (19)–(24).
e i = ( H L L S ( C a l c u l a t e d ) H L L S ( M e a s u r e d ) H L L S ( M e a s u r e d ) ) × 100 e i = ( v T ( C a l c u l a t e d ) v T ( M e a s u r e d ) v T ( M e a s u r e d ) ) × 100
ej = HLLS (Calculated)HLLS (Measured), ej = vT (Calculated)vT (Measured)
The average relative error, ε1, indicates how large the relative errors are on the average.
ε 1 = 1 N i = 1 N ( e i )
The absolute average relative error, ε2, indicates how large the absolute relative errors are on the average.
ε 2 = 1 N i = 1 N ( | e i | )
The standard deviation of relative error, ε3, indicates the degree of scattering of the relative errors around their average value.
ε 3 = i = 1 N ( e i ε 1 ) 2 N 1
The average actual error, ε4, indicates the overall trend of the measured values.
ε 4 = 1 N i = 1 N ( e j )
The absolute average actual error, ε5, indicates the magnitude of the average absolute error.
ε 5 = 1 N i = 1 N ( | e j | )
The standard deviation of actual error, ε6, indicates the dispersion of the results around their average.
ε 6 = i = 1 N ( e j ε 4 ) 2 N 1
Table 5 and Table 6 summarize the evaluation results of the best correlations in different experimental datasets. Figure 7 and Figure 8 illustrate the comparisons between experimental data and predicted values calculated by the correlations.
In addition to the six statistical parameters, Al-safran [44] suggested to use the relative performance factor (Frp) given in Equation (25) and the coefficient of determination (R2) given in Equation (26), as listed in Table 5 and Table 6.
F rp = | ε 1 | | ε 1 | min | ε 1 | max | ε 1 | min + ε 2 ε 2 ( min ) ε 2 ( max ) ε 2 ( min ) + ε 3 ε 3 ( min ) ε 3 ( max ) ε 3 ( min ) + | ε 4 | | ε 4 | min | ε 4 | max | ε 4 | min + ε 5 ε 5 ( min ) ε 5 ( max ) ε 5 ( min ) + ε 6 ε 6 ( min ) ε 6 ( max ) ε 6 ( min )
R 2 = i = 1 n ( H L L S i H ¯ L L S ) 2 i = 1 n ( H L L S i H ¯ L L S ) 2 ,   R 2 = i = 1 n ( v T i v ¯ T ) 2 i = 1 n ( v T i v ¯ T ) 2
where the numerator of Equation (26) is the sum of the squares of the deviations between the calculated values and the average of all the experimental data. The denominator is the sum of the squares of the deviations between the measured values and the average of all the measured values. The correlation that has the lowest value of performance factor compared to other correlations with the coefficient of determination close to 1 represents the best agreement with the experimental data.

3. Results

This section presents the performance of a modified and optimized slug flow model. The dp/dL experimental data measured by Gokcal [10], Brito [11], Kim [27] and [13], Ekinci [28], Mukherjee [29], and Kokal [30] are utilized to evaluate the performance of the model. The suitable correlations of Co (vT) and HLLS that are statistically selected in Section 2 are used to calculate dp/dL with Equation (14). The slug liquid holdup data were not measured by Gokcal [10] and Kim [27]. Therefore, the correlation of Gregory et al. [22] which shows the best agreement with the data of Brito [11] and Kim [13] is adopted for Gokcal [10] and Kim [27]. In the case of Mukherjee [29], both measurements of vT and HLLS were missed. Alternatively, the correlations of Fabre [6] and Gomez et al. [43] that present a good agreement with the data of Marcano [26] are used to calculate dp/dL. The fluid properties of Mukherjee [29] and Marcano [26] are similar as both of them used Kerosene for the liquid phase. Table 7 summarizes the pressure gradient dataset with chosen correlations for Co and HLLS.
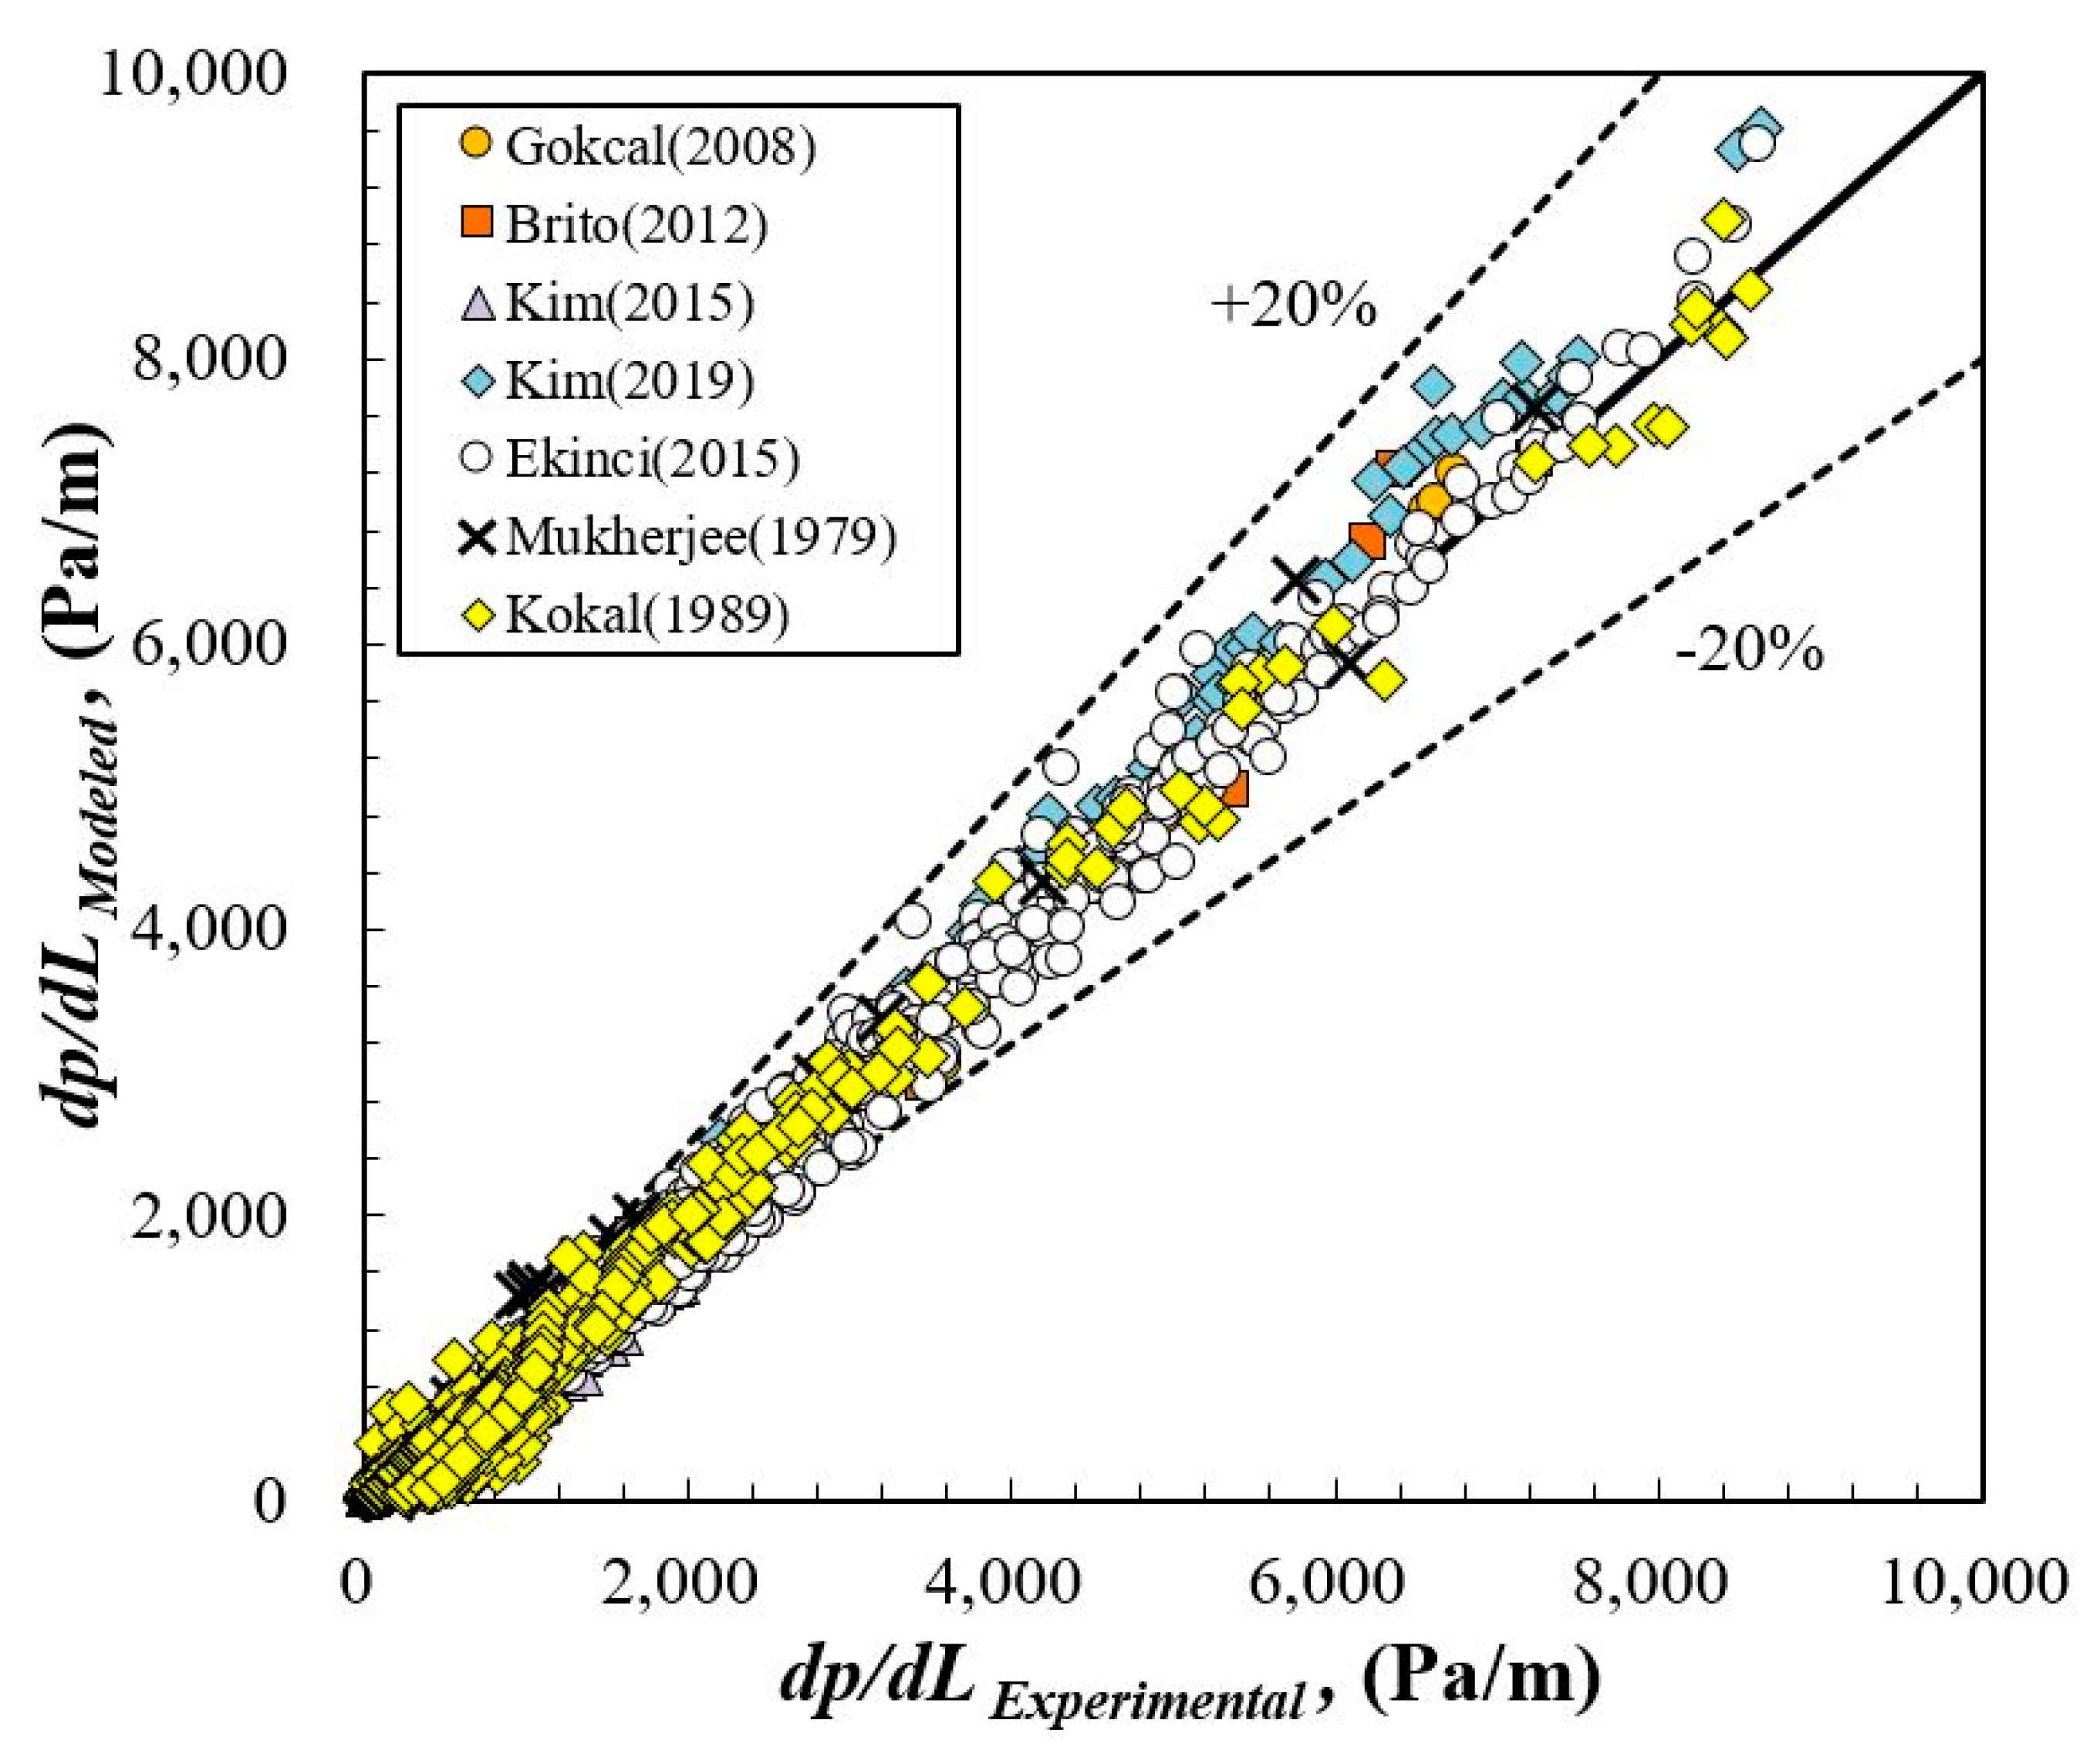
As visualized in Figure 9 and evaluated in Table 8, the suggested model shows suitable agreement with experimental data from various conditions (0.001 ≤ μL ≤ 0.995 Pa∙s, 7 ≤ ReM ≤ 227,007 and −9 ≤ θ ≤ 9). All of experimental data coincide with the calculated values lower than 10% of average relative error, ε1, except the data obtained by Brito [11] (ε1 Brito [11] = −16%). The coefficient of determination, R2, presents appropriate performance with values higher than 0.97, except with the data from Kim [27] (R2Kim [27] = 0.880).

4. Conclusions and Discussion

In this study, the previously simplified model is modified and optimized to predict the pressure gradient of slug flow in horizontal and near horizontal pipe conditions. The proper utilization of friction factor, slug liquid holdup, and flow coefficient, modifying the balance equation, enables the proposed model to be applicable to turbulent flow, i.e., high mixture Reynolds number, and near horizontal conditions. The suggested model presents suitable agreements with 2191 previously obtained experimental data of Gokcal [10], Brito [11], Kim [27] and [13], Ekinci [28], Mukherjee [29], and Kokal [30] including 0.001 Pa∙s ≤ μL ≤ 0.995 Pa∙s, 0.024 mm ≤ ID ≤ 0.076 mm, 7 ≤ ReM ≤ 227,007, and −9° ≤ θ ≤ 9°. Whereas, the suggested methodology still requires the knowledge or the experimental data to select the proper correlations of slug characteristics such as the slug liquid holdup and the flow coefficient. A numerous number of data have been obtained during several decades from various experimental conditions. The intelligent optimization methodology employing the existing data sets, such as machine learning, might be a suitable route to exclude the subjective utilization of correlation unless the experimental data for necessary slug characteristics are provided.

Author Contributions

Conceptualization, N.-S.W.; Data curation, T.-W.K.; Formal analysis, S.-M.H.; Investigation, T.-W.K.; Methodology, T.-W.K.; Project administration, Y.-J.K.; Resources, T.-W.K.; Supervision, Y.-J.K.; Validation, T.-W.K. and N.-S.W.; Visualization, T.-W.K.; Writing—original draft, T.-W.K.; Writing—review & editing, S.-M.H. All authors have read and agreed to the published version of the manuscript.

Funding

This research was funded by [Korea Agency for Infrastructure Technology Advancement grant funded by Ministry of Land, Infrastructure and Transport] grant number [19IFIP-B133618-03].

Acknowledgments

This work is supported by Korea Agency for Infrastructure Technology Advancement grant funded by Ministry of Land, Infrastructure and Transport (19IFIP-B133618-03, Mud circulation system integration and pilot field verification).

Conflicts of Interest

The authors declare no conflict of interest.

Nomenclature

APPipe cross-sectional area, (m2)
BoBond number, (-)
CoFlow coefficient, (-)
d, I.D.Pipe diameter, (m)
FrpRelative performance factor, (-)
fSFriction factor, (-)
gGravitational acceleration, (m/s2)
HL Avg.Average liquid holdup of slug unit, (-)
HLLSSlug liquid holdup, (-)
HLTBFilm liquid holdup, (-)
LFLiquid film length, (m)
LMMixing length at liquid slug front, (m)
LSSlug length, (m)
LUSlug unit length, (m)
µLLiquid viscosity, (Pa·s)
µGGas viscosity, (Pa·s)
NFrFroude number, (-)
NμViscosity number, (-)
R2Coefficient of determination, (-)
ReMMixture Reynolds number, (-)
ρLLiquid density, (kg/m3)
ρGGas density, (kg/m3)
ρSLiquid slug body density, (kg/m3)
ρUSlug unit density, (kg/m3)
σSurface tension, (N/m)
SFWetted perimeter of liquid phase (film region), (m)
SGWetted perimeter of gas phase (film region), (m)
τFLiquid film wall shear stress, (Pa)
τSSlug wall shear stress, (Pa)
τGGas (long bubble) wall shear stress, (Pa)
θPipe inclination angle, (°)
vDDrift velocity, (m/s)
vGLSGas bubble velocity in liquid slug body, (m/s)
vLLSLiquid slug velocity, (m/s)
vLTBLiquid film velocity, (m/s)
vMMixture velocity, (m/s)
vSLSuperficial liquid velocity, (m/s)
vSgSuperficial gas velocity, (m/s)
vTTranslational velocity, (m/s)
WLInput liquid mass-flow rate, (kg/s)

References

  1. Dukler, A.E.; Hubbard, M.G. A model for gas-liquid slug flow in horizontal and near horizontal tubes. Ind. Eng. Chem. Fundam. 1975, 14, 337–347. [Google Scholar] [CrossRef]
  2. Kim, T.W.; Aydin, T.B.; Pereyra, E.; Sarica, C. Detailed flow filed measurements and analysis in highly viscous slug flow in horizontal pipes. Int. J. Multiph. Flow 2018, 106, 75–94. [Google Scholar] [CrossRef]
  3. Wallis, G.B. One-Dimensional Two-Phase Flow; McGraw-Hill: New York, NY, USA, 1969. [Google Scholar]
  4. Taitel, Y.; Barnea, D. Two-phase slug flow. Adv. Heat Transf. 1990, 20, 83–112. [Google Scholar]
  5. Fabre, J.; Line, A. Modeling of two-phase slug flow. Annu. Rev. Fluid Mech. 1992, 24, 21–46. [Google Scholar] [CrossRef]
  6. Fabre, J. Advancements of Two-Phase Slug Flow Modeling. In Proceedings of the University of Tulsa Centennial Petroleum Engineering Symposium, Tulsa, OK, USA, 29–31 August 1994. [Google Scholar]
  7. Diaz, M.J.C. Two-Phase Slug Flow Experiments with Viscous Liquids. Ph.D. Thesis, Norwegian University of Science and Technology, Trondheim, Norway, 2016. [Google Scholar]
  8. Shoham, O. Mechanistic Modeling of Gas-Liquid Two-Phase Flow in Pipes; SPE Publications: Richardson, TX, USA, 2006. [Google Scholar]
  9. Brito, R.; Pereyra, E.; Sarica, C.; Torres, C. A simplified slug flow model for highly viscous oil-gas flow in horizontal pipes. In Proceedings of the SPE Annual Technical Conference and Exhibition, New Orleans, LA, USA, 30 September–2 October 2013. [Google Scholar]
  10. Gokcal, B. An Experimental and Theoretical Investigation of Slug Flow for High Oil Viscosity in Horizontal Pipes. Ph.D. Thesis, The University of Tulsa, Tulsa, OK, USA, 2008. [Google Scholar]
  11. Brito, R. Effect of Medium Oil Viscosity on Two-Phase Oil-Gas Flow Behavior in Horizontal Pipes. Master’s Thesis, The University of Tulsa, Tulsa, OK, USA, 2012. [Google Scholar]
  12. Kora, C. Effects of High Oil Viscosity on Slug Liquid Holdup in Horizontal Pipes. Master’s Thesis, University of Tulsa, Tulsa, OK, USA, 2010. [Google Scholar]
  13. Kim, T. Detailed Flow Field Analysis of Air and Highly Viscous Liquid Slug Flow in Horizontal Pipes. Ph.D. Thesis, The University of Tulsa, Tulsa, OK, USA, 2019. [Google Scholar]
  14. Kiger, K.T.; Duncan, J.H. Air-Entrainment Mechanisms in Plunging Jets and Breaking Waves. Annu. Rev. Fluid Mech. 2012, 44, 563–596. [Google Scholar] [CrossRef]
  15. Luther, S.; Rensen, J.; Guet, S. Bubble Aspect Ratio and Velocity Measurement Using a Four-Point Fiber-Optical Probe. Exp. Fluids 2004, 36, 326–333. [Google Scholar]
  16. Cieslinski, J.T.; Mosdorf, R. Gas Bubble Dynamics-Experiment and Fractal Analysis. Int. J. Heat Mass Trans. 2005, 48, 1808–1818. [Google Scholar] [CrossRef]
  17. Ohta, M.; Onodera, K.; Yoshida, Y.; Sussman, M. Three-Dimensional Numerical Simulations of a Rising Bubble in a Viscoelastic FENE-CR Model Fluid. AIP Conf. Proc. 2008, 1027, 896. [Google Scholar] [CrossRef]
  18. Wu, Q.; Wang, X.; Wang, T.; Han, M.; Sha, Z.; Wang, J. Effect of Liquid Viscosity on Hydrodynamics and Bubble Behaviour of an External-Loop Airlift Reactor. Can. J. Chem. Eng. 2013, 91, 1957–1964. [Google Scholar] [CrossRef]
  19. Bunner, B.; Tryggvason, G. Effect of Bubble Deformation on the Properties of Bubbly Flows. J. Fluid Mech. 2003, 495, 77–118. [Google Scholar] [CrossRef]
  20. Lu, J.; Tryggvason, G. Effect of Bubble Deformability in Turbulent Bubbly Upflow in a Vertical Channel. Phys. Fluids 2008, 20, 040701. [Google Scholar] [CrossRef] [Green Version]
  21. Ziegenhein, T.; Lucas, D. Observations on Bubble Shapes in Bubble Columns under Different Flow Conditions. Exp. Therm. Fluid Sci. 2017, 85, 248–256. [Google Scholar] [CrossRef]
  22. Gregory, G.A.; Nicholson, M.K.; Aziz, K. Correlation of the liquid volume fraction in the slug for horizontal gas-liquid slug flow. Int. J. Multiph. Flow 1978, 4, 33–39. [Google Scholar] [CrossRef]
  23. Andreussi, P.; Bendiksen, K. An investigation of void fraction in liquid slugs for horizontal and inclined gas-liquid pipe flow. Int. J. Multiph. Flow 1989, 15, 937–946. [Google Scholar] [CrossRef]
  24. Felizola, H. Slug Flow in Extended Reach Directional Wells. Master’s Thesis, The University of Tulsa, Tulsa, OK, USA, 1992. [Google Scholar]
  25. Abdul-Majeed, G.H. Liquid slug holdup in horizontal and slightly inclined two-phase slug flow. J. Petrol. Sci. Eng. 2000, 27, 27–32. [Google Scholar] [CrossRef]
  26. Marcano, R. Slug Characteristics for Two-Phase Horizontal Flow. Master’s Thesis, The University of Tulsa, Tulsa, OK, USA, 1996. [Google Scholar]
  27. Kim, T. On the Analysis of High Viscous Horizontal Slug Flow Characteristics by Changing Pipe Diameter. Master’s Thesis, Seoul National University, Seoul, Korea, 2015. [Google Scholar]
  28. Ekinci, S. Pipe Inclination Effects on Slug Flow Characteristics of High Viscosity Oil-Gas Two-Phase Flow. Master’s Thesis, The University of Tulsa, Tulsa, OK, USA, 2015. [Google Scholar]
  29. Mukherjee, H. An Experiments Study of Inclined Two-Phase Flow. Ph.D. Thesis, The University of Tulsa, Tulsa, OK, USA, 1979. [Google Scholar]
  30. Kokal, S.S. An Experimental Study of Two Phase Flow in Inclined Pipes. Ph.D. Thesis, University of Calgary, Calgary, AB, Canada, 1989. [Google Scholar]
  31. Gokcal, B. Effects of High Oil Viscosity on Two-Phase Oil-Gas Flow Behavior in Horizontal Pipes. Master’s Thesis, The University of Tulsa, Tulsa, OK, USA, 2005. [Google Scholar]
  32. Al-safran, E.; Gokcal, B.; Sarica, C. Analysis and prediction of heavy oil two-phase slug length in horizontal pipes. In Proceedings of the SPE Heavy Oil Conference and Exhibition, Kuwait City, Kuwait, 12–14 December 2011. [Google Scholar]
  33. Barbosa, J.R.; Hewitt, G.F. A Thermodynamic Non-Equilibrium Slug Flow Model. J. Heat Transf. 2005, 127, 323–331. [Google Scholar] [CrossRef]
  34. Pineda-Perez, H.; Kim, T.W.; Pereyra, E.; Ratkovich, N. CFD Modeling of Air and Highly Viscous Liquid Two-Phase Slug Flow in Horizontal Pipes. Chem. Eng. Res. Des. 2018, 136, 638–653. [Google Scholar] [CrossRef]
  35. Garcia, F.; Garcia, R.; Padrino, J.C.; Mata, C.; Trallero, J.L.; Joseph, D.D. Power law and composite power law friction factor correlations for laminar and turbulent gas-liquid flow in horizontal pipelines. Int. J. Multiph. Flow 2003, 29, 1605–1624. [Google Scholar] [CrossRef]
  36. Choi, J.; Pereyra, E.; Sarica, C.; Park, C.; Kang, J.M. An efficient drift flux closure relationship to estimate liquid holdups of gas-liquid two phase flow in pipes. Energies 2012, 5, 5294–5306. [Google Scholar] [CrossRef] [Green Version]
  37. Woldesemayat, M.A.; Ghajar, A.J. Comparison of void fraction correlations for different flow patterns in horizontal and upward inclined pipes. Int. J. Multiph. Flow 2007, 33, 347–370. [Google Scholar] [CrossRef]
  38. Coddington, P.; Macian, R. A study of the performance of void fraction correlations used in the context of drift-flux two-phase flow model. Nucl. Eng. Des. 2002, 215, 199–216. [Google Scholar] [CrossRef]
  39. Roumazeilles, P. An Experimental Study of Downward Slug Flow in Inclined Pipes. Master’s Thesis, The University of Tulsa, Tulsa, OK, USA, 1994. [Google Scholar]
  40. Mishima, K.; Hibiki, T. Some characteristics of air-water two-phase flow in small diameter vertical tubes. Int. J. Multiph. Flow 1996, 22, 703–712. [Google Scholar] [CrossRef]
  41. Petalas, N.; Aziz, K. A mechanistic model for multiphase flow in pipes. J. Can. Petrol. Technol. 2000, 39, 43–55. [Google Scholar] [CrossRef]
  42. Hibiki, T.; Ishii, M. One-dimensional drift-flux model for two-phase flow in a large diameter pipe. Int. J. Heat Mass Transf. 2003, 46, 1773–1790. [Google Scholar] [CrossRef]
  43. Gomez, L.E.; Shoham, O.; Schmidt, Z.; Chokshi, R.N.; Northug, T. Unified mechanistic model for steady-state two-phase flow: Horizontal to vertical upward flow. SPE J. 2000, 5, 339–350. [Google Scholar] [CrossRef]
  44. Al-Safran, E. Prediction of slug liquid holdup in horizontal pipes. J. Energ. Resour. ASME 2009, 131, 1–8. [Google Scholar] [CrossRef]
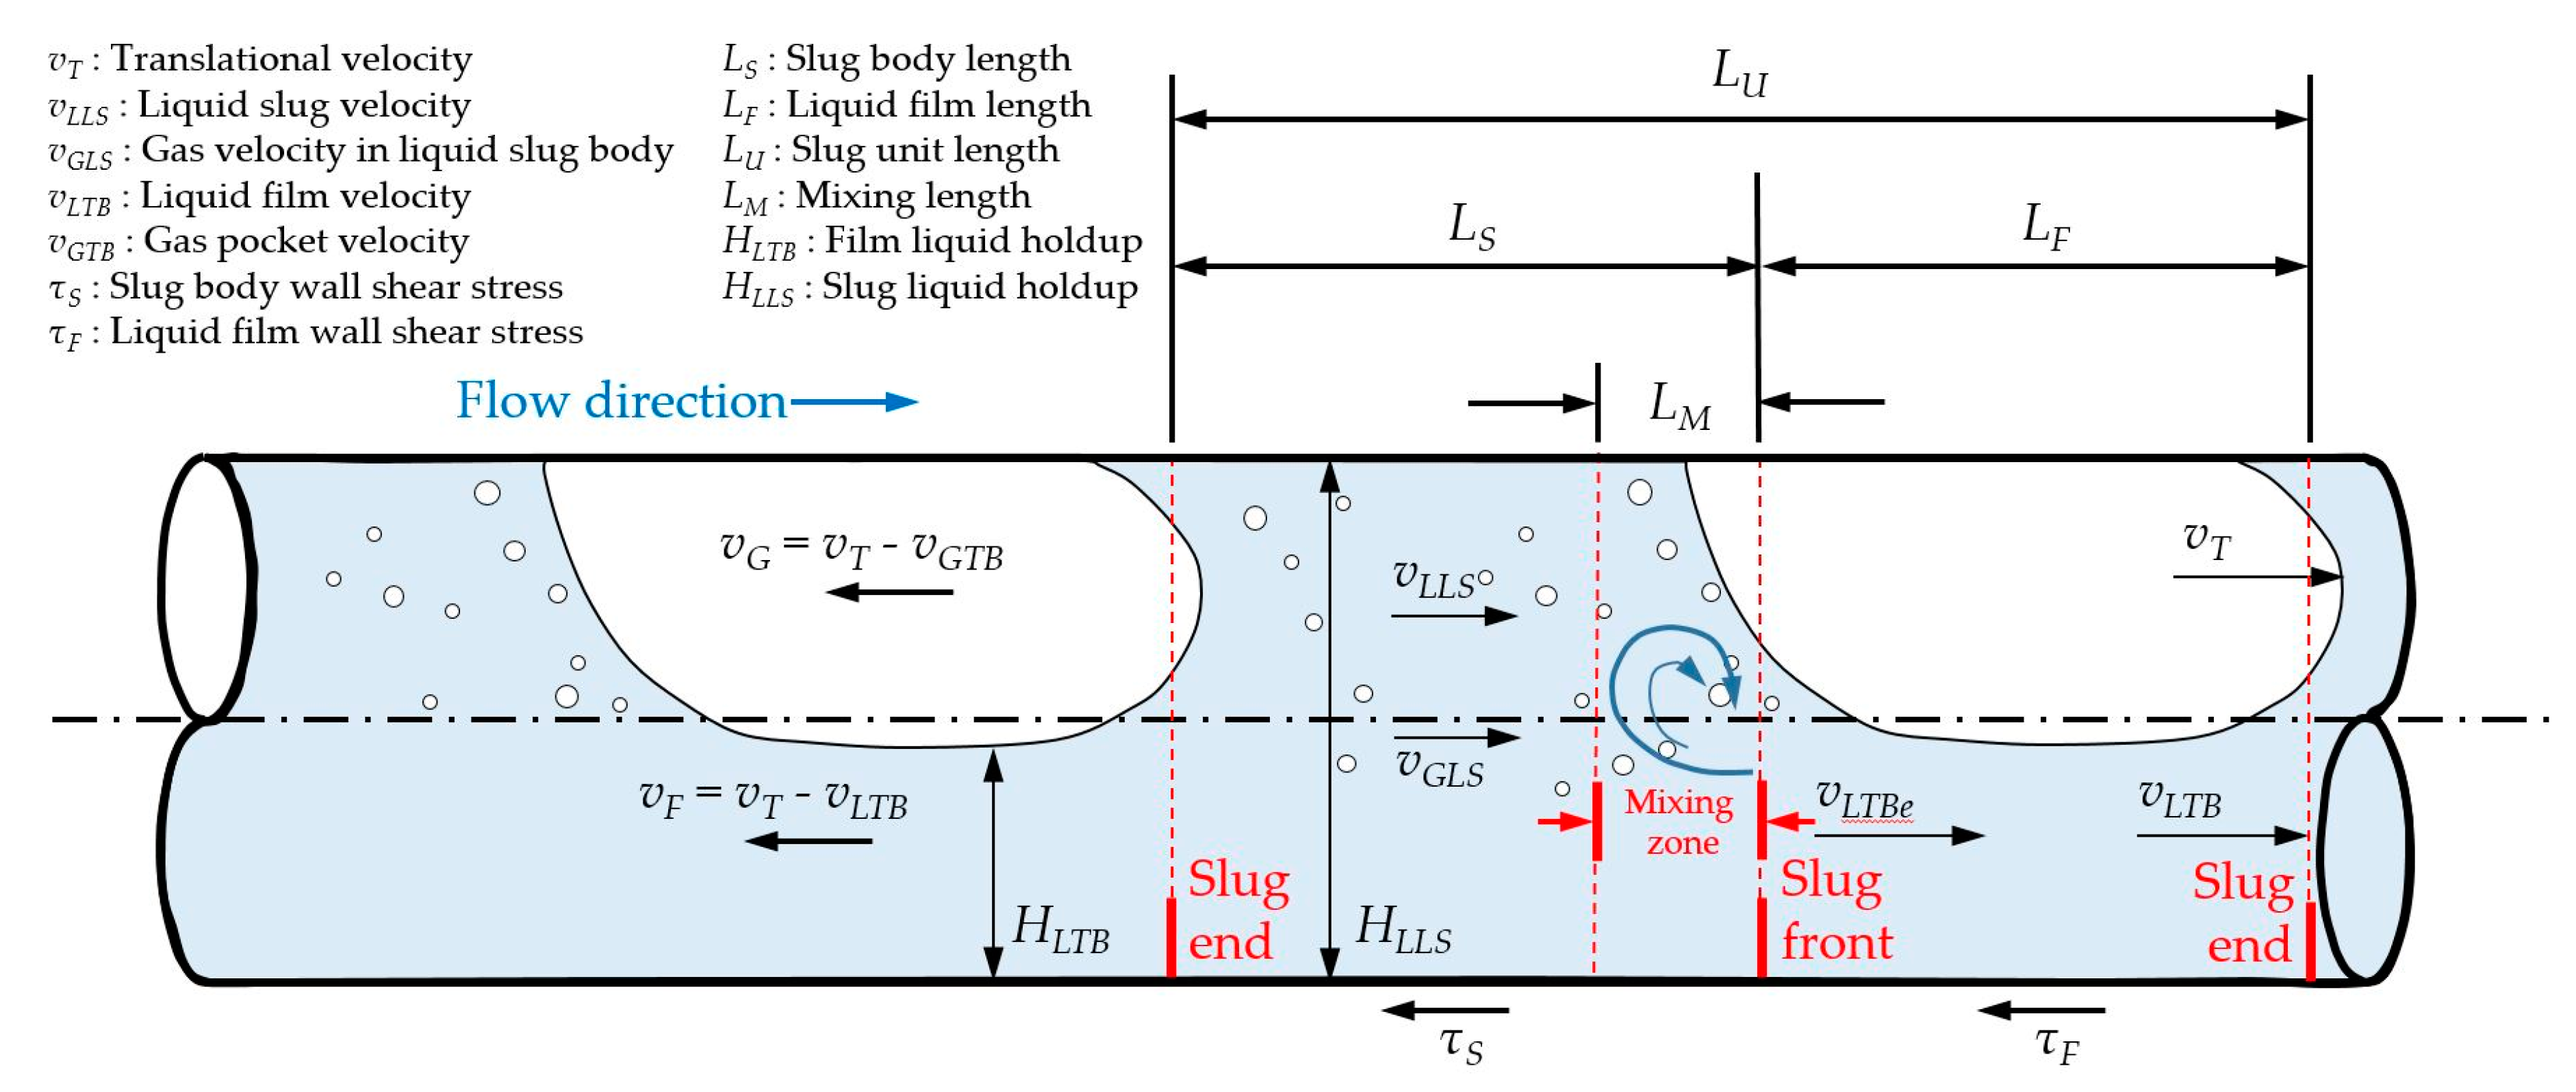
Figure 1. Illustration of slug flow.
Energies 13 00842 g001
Figure 2. Velocity vector fields in axial direction with different operating conditions; (a) vSL = 0.2 m/s, vSg = 0.2 m/s, μL = 0.250 Pa∙s, (b) vSL = 0.4 m/s, vSg = 0.6 m/s, μL = 0.510 Pa∙s, (c) vSL = 0.2 m/s, vSg = 0.4 m/s, μL = 0.960 Pa∙s, and (d) vSL = 0.4 m/s, vSg = 0.6 m/s, μL = 0.960 Pa∙s [2].
Energies 13 00842 g002aEnergies 13 00842 g002bEnergies 13 00842 g002cEnergies 13 00842 g002d
Figure 3. Deformation of entrained air by induced shear at slug front [16].
Energies 13 00842 g003
Figure 4. Simulated three-dimensional velocity profiles (in m/s) at the interface [33].
Energies 13 00842 g004
Figure 5. Composite correlation for slug flow [17].
Energies 13 00842 g005
Figure 6. Relationship of measured average liquid holdup data and the predicted value from Woldesemayat & Ghajar [37] correlation.
Energies 13 00842 g006
Figure 7. Translational velocity models comparison.
Energies 13 00842 g007
Figure 8. Slug liquid holdup models comparison.
Energies 13 00842 g008
Figure 9. Comparison between the current dp/dL model and experimental data.
Energies 13 00842 g009
Table 1. Summary of translational velocity, vT, dataset.
Data SourceFluid TypesNo. of DataI.D.θvSLvSgρLρGμLμGσReM
[m][º][m/s][m/s][kg/m3][kg/m3][Pa∙s][Pa∙s][N/m][-]
Gokcal [10]Liquid phase: Synthetic (heavy) oil
Gas phase: Air
1700.050800.05~0.800.10~2.17872~8851.12~2.080.178~0.6010.0000180.03111~671
Brito [11]Liquid phase: Synthetic (medium and heavy) oil
Gas phase: Air
1260.050800.05~2.960.10~6.23857~8701.20~2.500.039~0.1660.0000100.031148~1866
Kim [27]Liquid phase: Synthetic (heavy) oil
Gas phase: Air
4850.072000.02~0.360.11~3.62871~ 8841.12~1.350.147~0.6190.0000100.03330~1159
Kim [13]Liquid phase: Synthetic (heavy) oil
Gas phase: Air
1070.050800.10~1.000.03~3.01838~8541.25~3.040.245~0.9950.0000100.0337~312
Marcano [26]Liquid phase: Kerosene
Gas phase: Air
830.078000.14~2.070.45~6.00808~8192.07~6.380.0020.0000190.03030,182~217,598
Ekinci [28]Liquid phase: Synthetic (heavy) oil
Gas phase: Air
5840.0508−2, +20.10~0.800.10~5.14871~8841.21~2.780.153~0.6140.0000100.03021~1742
Roumazeilles [39]Liquid phase: Kerosene
Gas phase: Air
330.0508−10~00.88~2.440.98~6.10802~8101.94~2.580.00150.0000190.02849,595~169,117
Kokal [30]Liquid phase: Light oil
Gas phase: Air
6900.0258,
0.0512,
0.0763
−9~+90.03~3.050.05~14.208583.000.0070.0000180.031364~70,419
Table 2. Summary of translational velocity, vT, correlations.
CorrelationYr.Flow Coefficient, Co, CorrelationDrift Velocity, vD, Correlation
Fabre [6]1994 C o = 2.27 1 + ( R e M 1000 ) 2 + 1.2 1 + ( 1000 R e M ) 2 v D = 0.35 g d Δ ρ ρ L
Mishima & Hibiki [40]1996 C o = 1.2 + 0.51 e ( 0.691 ( d 1000 ) ) v D = 0
Petalas & Aziz [41]2000 C o = ( 1.64 + 0.12 sin θ ) R e M 0.031 v D = [ 0.54 1.76 B o 0.56 ] g d ( ρ L ρ G ) ρ L ; B o = ( ρ L ρ G ) σ g d 2
Hibiki & Ishii [42]2003 C o = 1.2 0.2 ρ G ρ L v D = 0.35 g d Δ ρ ρ L
Woldesemayat & Ghajar [37]2007b C o = ( v S g v M ) [ 1 + ( v S L v S g ) ( ρ G ρ L ) 0.1 ] v D = 2.9 ( g d σ ( 1 + cos θ ) Δ ρ ρ G 2 ) 0.25 ( 1.22 + 1.22 sin θ ) p a t m p s y s t e m
Choi et al. [36]2012 C o = 2 1 + ( R e M 1000 ) 2 + 1.2 0.2 ρ G ρ L ( 1 e ( 18 α ) ) 1 + ( 1000 R e M ) 2 v D = 0.0246 cos θ + 1.606 ( g σ Δ ρ ρ G 2 ) 0.25 sin θ
Table 3. Summary of slug liquid holdup, HLLS, dataset.
Data SourceFluid TypesNo. of DataI.D.θvSLvSgρLρGμLμGσReM
[m][º][m/s][m/s][kg/m3][kg/m3][Pa∙s][Pa∙s][N/m][-]
Kora [12]Liquid phase: Synthetic (heavy) oil
Gas phase: Air
1440.050800.10~0.820.10~3.51880~8881.28~3.490.179~0.6010.0000180.03116~1047
Brito [11]Liquid phase: Synthetic (medium and heavy) oil
Gas phase: Air
1260.050800.05~2.960.10~6.23857~8701.20~2.500.039~0.1660.0000100.031148~1,866
Kim [13]Liquid phase: Synthetic (heavy) oil
Gas phase: Air
1070.050800.10~1.000.03~3.01838~8541.25~3.040.245~0.9950.0000100.0337~312
Gregory et al. [22]Liquid phase: Light oil
Gas phase: Air
1490.0258, 0.051200.03~2.320.05~6.058581.250.0070.0000100.030387~45,342
Marcano [26]Liquid phase: Kerosene
Gas phase: Air
830.078000.14~2.070.45~6.00808~8192.07~6.380.0020.0000190.03030,182~217,598
Ekinci [28]Liquid phase: Synthetic (heavy) oil
Gas phase: Air
5840.0508−2, +20.10~0.800.10~5.14871~8841.21~2.780.153~0.6140.0000100.03021~1,742
Roumazeilles [39]Liquid phase: Kerosene
Gas phase: Air
330.0508−10~00.88~2.440.98~6.10802~8101.94~2.580.00150.0000190.02849,595~169,117
Kokal [30]Liquid phase: Light oil
Gas phase: Air
6900.0258,
0.0512,
0.0763
−9~+90.03~3.050.05~14.208583.000.0070.0000180.031364~70,419
Table 4. Summary of slug liquid holdup, HLLS, correlations.
CorrelationYr.Slug Liquid Holdup, HLLS, Correlation
Gregory et al. [22]1978 H L L S = 1 1 + ( v M 8.66 ) 1.39
Andreussi & Bendiksen [23]1989 H L L S = F 0 + F 1 F r M + F 1 ; F r M = v M g d ; F 0 = max [ 0 ; 2.6 ( 1 2 ( 2.5 d ) 2 ) ] , F 1 = 2400 [ 1 sin ( β ) 3 ] Bo 3 4
Felizola [24]1992 H L L S = 0.775 + 0.041 v M 0.019 v M 2
Gomez et al. [43]2000 H L L S = e ( 0.45 θ + 2.4810 × 10 6 R e M ) ; R e M = ρ L v M d μ L ; θ in radians
Abdul-Majeed [25]2000 H L L S = ( 1.009 C v M ) A ; C = 0.006 + 1.3377 μ G μ L ; A = { 1 if β 0 1 sin ( β ) if β > 0
Kora [12]2010 H L L S = 1 f o r N F r N μ 0.2 < 0.15 H L L S = 1.0120 e ( 0.085 N F r N μ 0.2 ) f o r 0.15 < N F r N μ 0.2 < 0.15 H L L S = 0.9473 e ( 0.041 N F r N μ 0.2 ) f o r N F r N μ 0.2 < 0.15 ; N F r = v M g d ρ L ρ L ρ G ; N μ = v M μ L g d 2 ( ρ L ρ G )
Table 5. Summary of the best performing correlations of translational velocity, vT.
Data SourceYr.No. of DataBest Correlationε1ε2ε3ε4ε5ε6FrpR2
(%)(%)(%)(m/s)(m/s)(m/s)(-)(-)
Gokcal [10]2008170Choi et al. [36]−0.407.9611.05−0.03730.14530.19820.080.975
Brito [11]2012126Mishima & Hibiki [40]1.6512.3015.030.16010.44480.60491.090.947
Kim [27]2015485Choi et al. [36]−5.129.6810.17−0.05190.23930.32650.480.951
Kim [13]2019107Choi et al. [36]11.3911.7411.540.19780.21860.24850.560.974
Marcano [26]199683Fabre [6]−4.555.425.00−0.18150.20700.18860.390.974
Ekinci [28]2015584Fabre [6]7.179.4710.590.16640.33550.45300.490.959
Roumazeilles [39]199633Fabre [6]−1.213.303.87−0.11310.18800.21890.190.972
Kokal [30]1989690Choi et al. [36]4.5415.8025.350.01330.26390.38551.210.974
Table 6. Summary of the best performing correlations of slug liquid holdup, HLLS.
Data SourceYr.No. of DataBest Correlationε1ε2ε3ε4ε5ε6FrpR2
(%)(%)(%)(-)(-)(-)(-)(-)
Kora [12]2010144Kora [12]−0.070.821.03−0.00070.00750.00940.000.971
Brito [11]2012126Gregory et al. [22]−4.356.346.65−0.04070.05540.05410.650.728
Kim [13]2019107Gregory et al. [22]3.765.124.420.03360.04550.03820.570.637
Gregory et al. [22]1978149Gregory et al. [22]0.533.525.270.00260.02870.04030.000.872
Marcano [26]199683Gomez et al. [43]−1.984.144.82−0.01860.03300.03770.120.826
Ekinci [28]2015584Gregory et al. [22]−1.315.387.20−0.01060.04590.06030.420.681
Roumazeilles [39]199633Gregory et al. [22]3.535.827.150.01860.03690.04390.000.734
Kokal [30]1989690Gregory et al. [22]1.075.369.880.00490.03960.06380.000.780
Table 7. Summary of pressure gradient, dp/dL, dataset and utilized correlations of Co and HLLS.
Data SourceFluid TypesNo. of DataI.D.θvSLvSgρLμLReMCo
Correlation
HLLS
Correlation
[m][º][m/s][m/s][kg/m3][Pa∙s][-]
Gokcal [10]Liquid phase: Synthetic (heavy) oil
Gas phase: Air
1700.050800.05~0.800.10~2.17872~8850.178~0.60111~671Choi et al. [36]Gregory et al. [22]
Brito [11]Liquid phase: Synthetic (medium and heavy) oil
Gas phase: Air
1260.050800.05~2.960.10~6.23857~8700.039~0.166148~1866Mishima &
Hibiki [40]
Gregory et al. [22]
Kim [27]Liquid phase: Synthetic (heavy) oil
Gas phase: Air
4850.072000.02~0.360.11~3.62871~8840.147~0.61930~1159Choi et al. [36]Gregory et al. [22]
Kim [13]Liquid phase: Synthetic (heavy) oil
Gas phase: Air
1070.050800.10~1.000.03~3.01838~8540.245~0.9957~312Choi et al. [36]Gregory et al. [22]
Ekinci [28]Liquid phase: Synthetic (heavy) oil
Gas phase: Air
5840.0508−2, +20.10~0.800.10~5.14871~8840.153~0.61421~1742Fabre [6]Gregory et al. [22]
Mukherjee [29]Liquid phase: Kerosene
Gas phase: Air
290.0240,
0.0350
00.03~3.400.28~6.76786~8580.001~0.045351~227007Fabre [6]Gomez et al. [43]
Kokal [30]Liquid phase: Light oil
Gas phase: Air
6900.0258,
0.0512,
0.0763
−9~+90.03~3.050.05~14.208580.007364~70,419Choi et al. [36]Gregory et al. [22]
Table 8. Summary of the performance of current dp/dL model.
Data SourceYr.No. of Dataε1ε2ε3ε4ε5ε6R2
(%)(%)(%)(Pa/m)(Pa/m)(Pa/m)(-)
Gokcal [10]2008170−3.415.497.01−27.660674.2059122.94320.992
Brito [11]2012126−16.0817.0811.48−86.0896118.3163158.44600.982
Kim [27]2015485−9.2816.8320.82−77.796581.585793.76740.880
Kim [13]20191077.377.385.27270.9229271.1362259.44840.976
Ekinci [28]2015584−3.147.429.54−53.5043146.2949194.34850.988
Mukherjee [29]1979294.9021.7429.21136.8585214.8965238.65540.981
Kokal [30]19896902.0513.0625.79−15.285061.535496.91820.994
Total2191−3.0111.8719.64−28.3507105.0804165.02220.991