3.1. OFMSW Characterization and Inoculum
Table 1 shows the characterization and OFMSW percentages of components. Moisture content was 79.3 ± 0.7% and total solids 20.7 ± 0.7%, which 99.4 ± 0.0% corresponds to volatile solids from total solids (VS 209.6 g per kg OFMSW), thus, indicating the biodegradable organic matter content that can be transformed into biogas. Wang et al. [
27] worked with food waste in anaerobic digestion obtained values of 24% TS and 23% VS, which were similar to those obtained in this work [
27]. As for TS content in the OFMSW used in this work, more than 99% correspond to VS, therefore, it represents the organic components that can theoretically be oxidized forming methane, carbon dioxide, and water; thus, be used in biodegradation process.
OFMSW pH had an average of 6.9 ± 0.5, this value is similar to that reported by Forster-Carneiro et al. [
28] (pH 7.5), but different from that reported by Garcia-Peña et al. [
29] (pH 4.2). This variation in pH may be due to the state of putrefaction or the state of maturity of the residues [
29], as well as the proportion of fruits and vegetables, since they are easily degradable residues, they can favor the accumulation of VFAs and lower the pH, which leads to a deficient anaerobic digestion in the methanogenic phase [
3]. With respect to nutrients, the total amount of phosphorus in the OFMSW was 37 ± 0.5 g/kg, it is higher than that reported by Campuzano and González-Martínez [
30], who performed an analysis at a global level found results of 13 g/kg phosphorus and Alibardi and Cossu [
4], who obtained 4.8 g/kg in OFMSW. Therefore, it is not necessary to add nutrient during the process, because C/N ratio was 24.5 ± 5.5/1 within the optimal ratio (20/1–30/1) in anaerobic digestion [
3]. With respect to the pH measured in the different preparations of the OFMSW, variations were found, including the same preparation (pH 6.4), these variations were due to the time during which it was stored. Although it was kept at low temperature, and the enzymatic activity was carried out at a lower speed; that it caused a decrease in pH, which was observed from the obtained the measurements. In addition, the stage in which the residues of fruits and vegetables are found at the time of collection, either in an advanced state of maturity or lack of development, it influences the pH value, therefor the acidic pH values correspond to the fermentation phase. Moreover, it is important to consider these variables for control process. Regarding the physicochemical characteristics of the inoculum we found 4.62 ± 0.1% TS, 2.1 ± 0.1% VS, 1,652 mg/L alkalinity, and neutral pH, which indicates that it can supply buffer capacity in the process.
3.2. PBR
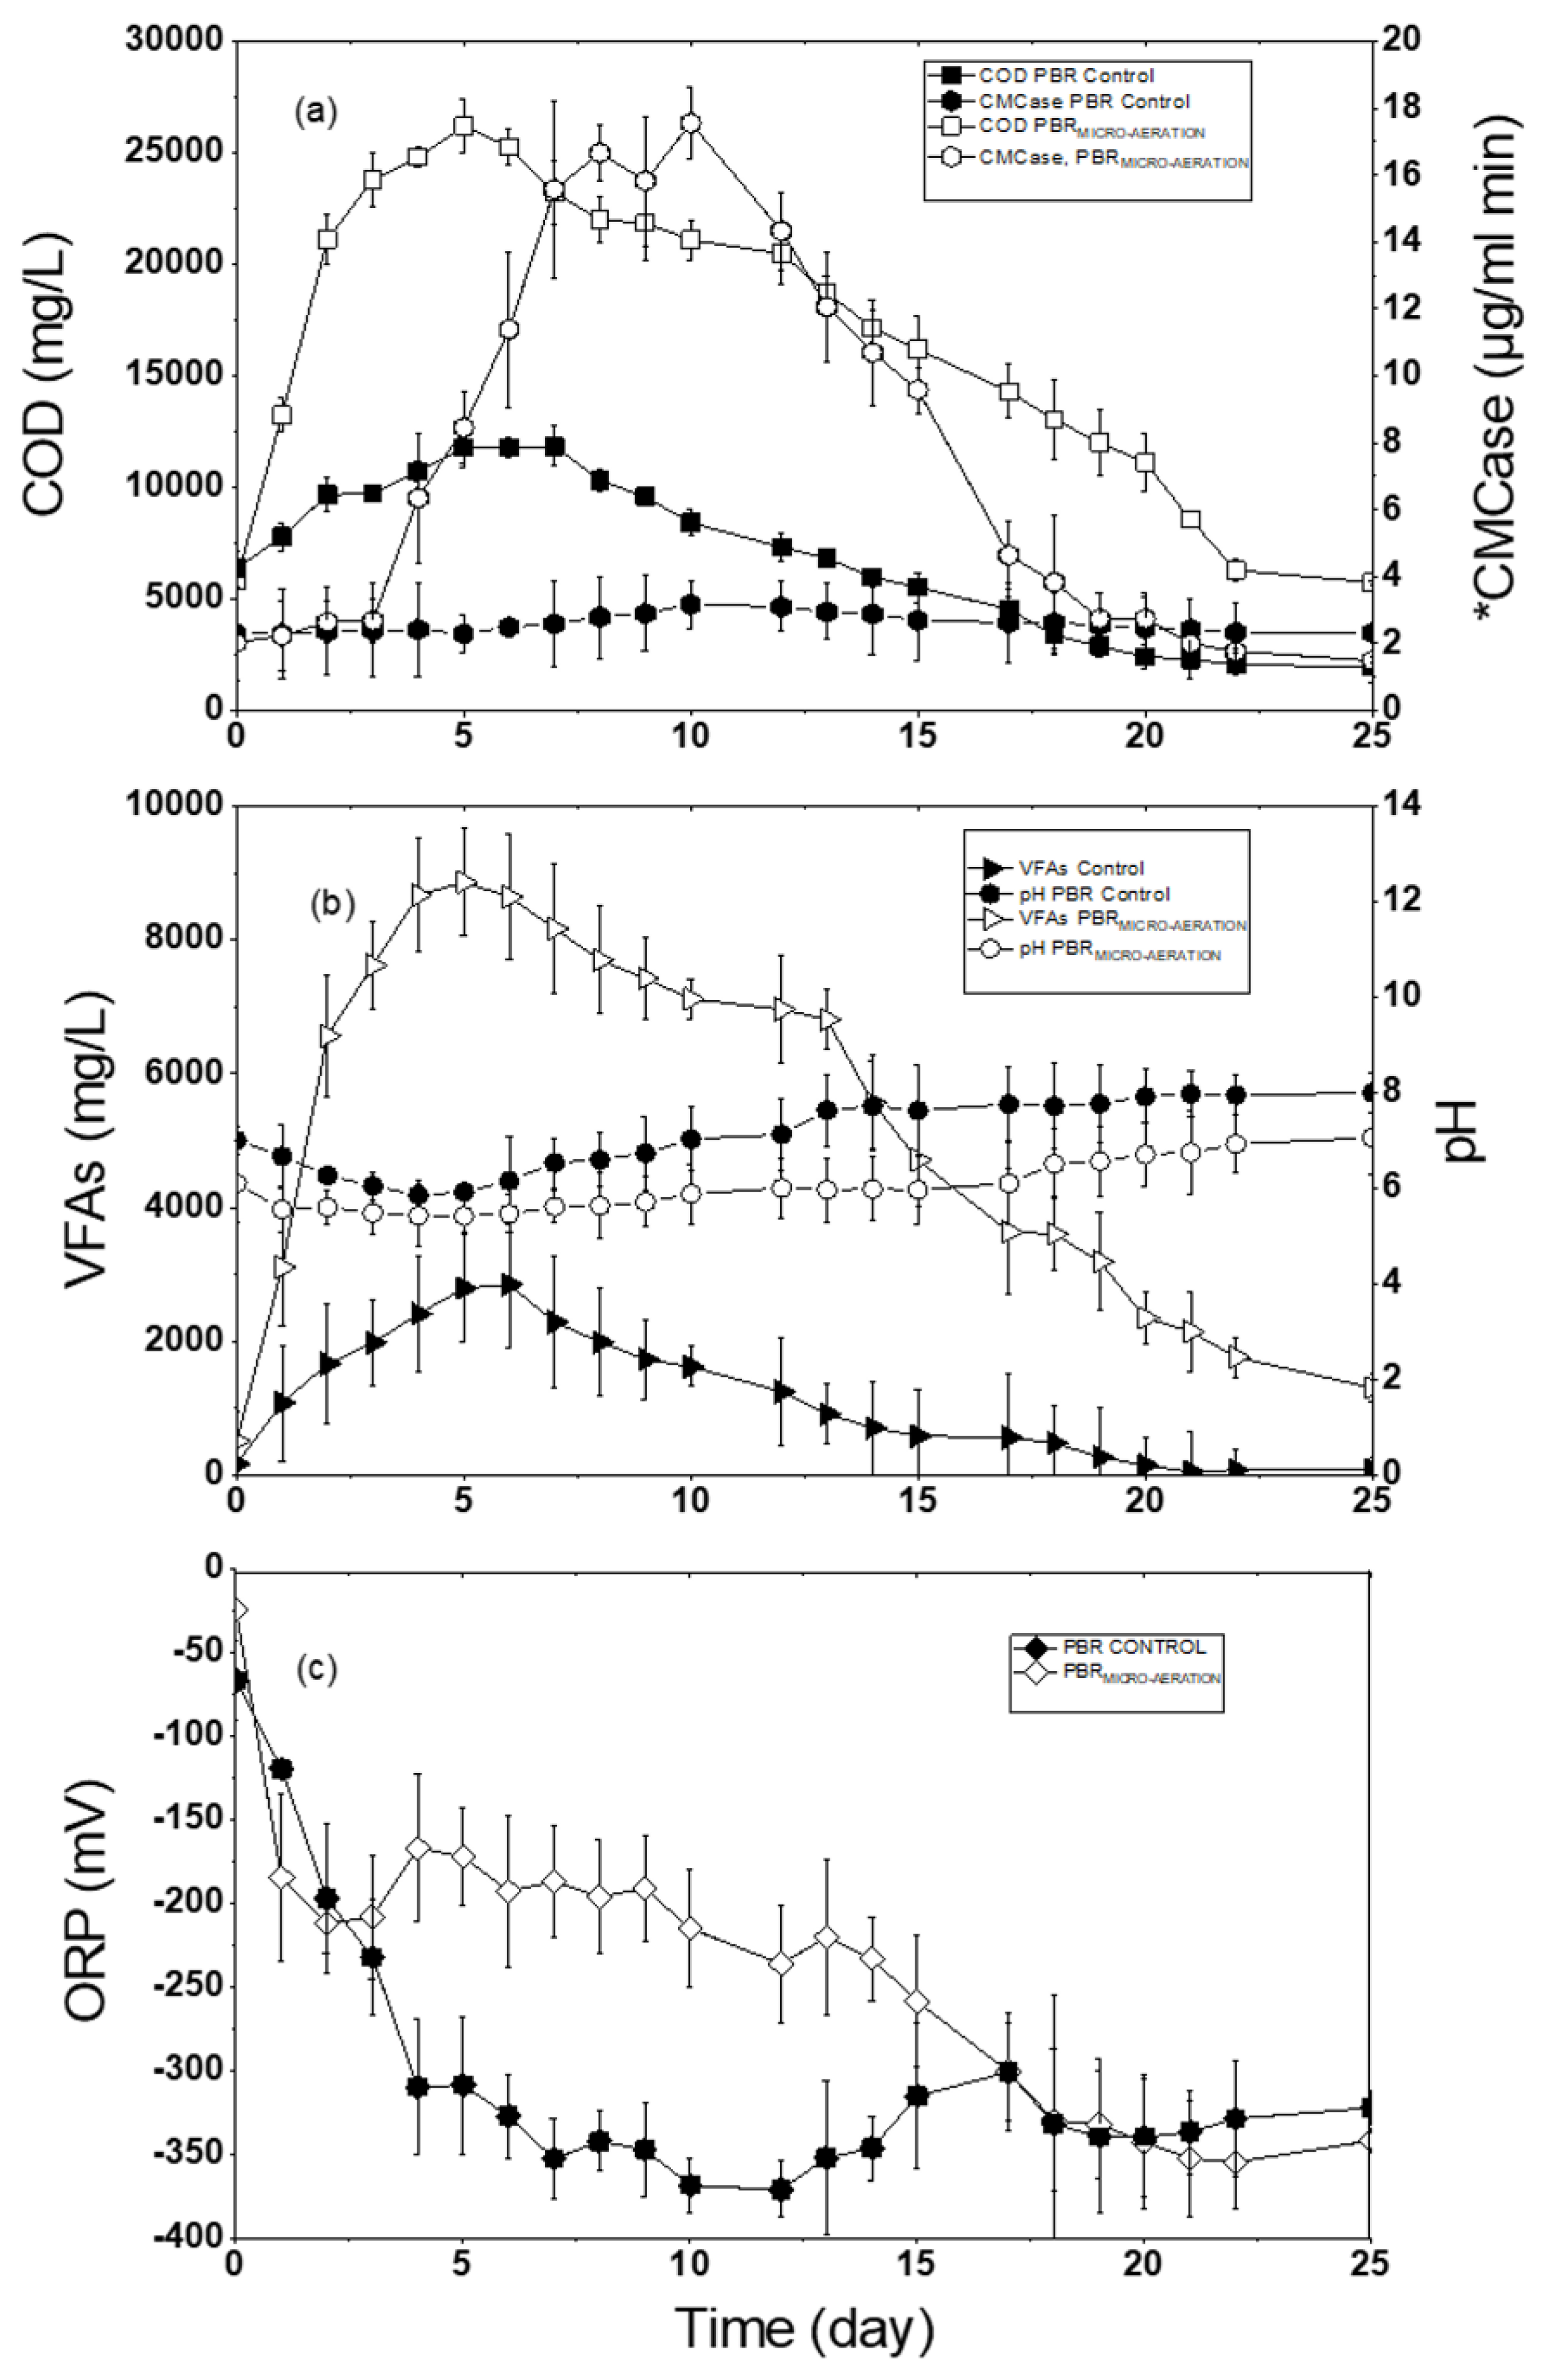
Figure 2a shows the COD and the enzymatic activity of CMCase in PBR control reactor. The organic matter solubilization started on the first day of the experiment, as shown in
Figure 2a, the initial COD value was 6375 mg/L. On day 4, this parameter was 10,800 mg/L and the highest value in the leachate was 11,800 mg/L reached on day 7. However, after day 12, the COD concentration decreased to 7000 mg/L, reaching 3500 mg/L on day 18, and maintaining this tendency to decrease until the end of the experiment. In a period of 18 days the COD decreased 6800 mg/L, which is a shorter time than reported by Dogan et al. [
31], who reported a time of 40 days for COD reduction using OFMSW as substrate. These results indicated that COD maximum rate of solubilization takes place in the first 10 days, as mentioned by Jiang et al. [
32], who with food waste obtained a maximum COD concentration at 80 hours after the AD process had started. With respect to the CMCase enzymatic activity, from day 1 to 5, the concentration recorded was 2 μg/mL min. On day 6, the concentration increased to 3.18 μg/mL min on day 12, similar values were reported by Zhu, Li, Hao, He, and Shao [
25], using vegetable wastes.
Figure 2 Packed bed reactor control reactor or with micro-aereation (a) chemical oxygen demand and enzymatic activity, (b) volatile fatty acids and pH, (c) oxide-reduction potential.
The enzymatic activity of CMCase has an important function in the degradation of the cellulose to carbohydrates, therefore influencing the efficiency of the hydrolytic phase. Carrying out a comparative analysis of the results obtained in the control and registered in the literature, the highest solubility of the organic matter measured as COD was observed 7 days after the start the test and reached stability on day 18. Therefore, the process had greater operational efficiency by reducing treatment time to 18 days and costs would decrease. However, the enzymatic activity behaved similarly to that recorded by Zhu, Li, Hao, He, and Shao [
25] with a slight increase on day 10 and decrease on day 17, therefore, cellulose degradation was very low.
Figure 2b, shows VFAs and pH during the experiment. In this test, the initial concentration of VFAs was 91 mg/L, increasing from day 1 to 6 until reaching a maximum value of 2850 mg/L with a pH of 5.9 on day 6. Jiang et al. [
32] mentioned that hydrolysis condition occurred in a range of 5 to 6 pH units. From day 7 to 15, the concentration of VFAs decreased to 600 mg/L, on day 20 a value of 300 mg/L with a pH of 7.7 caused by the decrease in VFAs, indicating that the reactor had changed to another phase. However, the work done by Angelidaki et al. [
33], using OFMSW, indicated that the highest concentration of VFAs was 3500 mg/L on day 28 by using DA in a single stage, which represented a time greater than the one required in this work to reach the highest concentration of VFAs.
The efficiency of an anaerobic digestion process depends on pH control in all its phases, to allow microorganisms to perform their metabolic activities, otherwise, it can cause problems in these processes [
34]. The pH has a direct relation with the VFAs. Throughout the first 5 days of the experiment, a decrease in pH was observed in the hydrolytic reactor, caused by an increase in VFAs, reaching pH value of 5.7. This transformation was previously described by Cysneiros et al. [
35], the decrease in pH is the result of the conversion of macromolecules from the substrate into acidic metabolites such as acetic, butyric, pyruvic, and capric, among others [
36], when these acids transformed into acetate are consumed by methanogenic microorganisms. In this sense, an optimal pH control was not applied in the PBR to establish the ideal conditions as mentioned above. As for the pH results obtained in the test, no values below 5.5 were found, however, variations of 5.8 to 7 pH were found in the first 10 days. Therefore, the pH values and the concentration of recorded VFAs determined that it was the time in which the hydrolysis was carried out. Although the VFAs registered a maximum concentration of 2850 mg/L, which was lower than that of Angelidaki, Chen, Cui, Kaparaju, and Ellegaard [
33] who obtained a concentration of 3500 mg/L in 28 days and Dogan et al. [
31] who reported 3200 mg/L in 16 days, we considered that the test performed is more efficient because the maximum concentration was reached at 6 days.
As shown in
Figure 2c, the ORP initially had a value of −60 mV and gradually decreased to −310 mV on day 5. Xu, Selvam, and W.C.Wong [
5], performed ORP tests on different times (days), described similar behavior and mentioned situations where the ORP gradually decreased to −120 mV. Similarly, Zhu, Li, Hao, He, and Shao [
25], performed tests in which they measured the behavior of the ORP, describing variations in the first 5 days; these authors also mentioned that the value of the ORP is function of pH. As shown in
Figure 2c, the highest variation of the ORP occurred during the first 7 days. The ORP varies from −300 to −370 from day 6 to day 25. In a review of different investigations, developed by Guang et al. [
37], described the importance of the different ORP intervals and their impact on gene expression, protein biosynthesis and control strategies for higher efficient production of by-products of interest. Zhu, Li, Hao, He, and Shao [
25], performed a recirculation of the leachate from the methanogenic reactor every 5 days, indicated that the ORP values vary periodically thus, its tendency and effect during the tests cannot be predicted.
3.3. PBRMICRO-AERATION
As shown
Figure 2a, the system started with a COD of 6000 mg/L. During the first 5 days, it increased to a maximum value of 25,600 mg/L, which represents an increase of more than 100% compared to the PBR control.
Afterwards, the COD decreased to 21,850 mg/L on day 10, from day 11 to day 22 decreased to 8550 mg/L, until reaching 5350 mg/L COD on day 25. This increase in COD was attributed to the presence of supplied oxygen, which favored the development of facultative microorganisms resulting in an increase in the secretion of external enzymes by bacteria under microaerobic conditions [
25]. These secreted external enzymes increased the solubilization of the solid particles of the substrate resulting in an increase in the rate of hydrolysis of organic matter, which was noticeably higher compared to the control PBR reactor. The increase in COD was caused by the solubilization of the solid particles from the substrate, resulting in an increase in the rate of hydrolysis of organic matter [
5]. These results indicated that hydrolysis occurred through the first days (5 days), as was mentioned by Xu, Selvam, and W.C.Wong [
5], who found values of 61.3 g/L of COD in the second and third days using a micro-aeration rate of 258 L-air/kg-TS-day. However, in their tests they used 1 kg of substrate with a TS content of 38%, VS of 97.1%, and 0.2 kg of wood chips, which represents a greater amount of organic matter and lignocellulosic waste, therefore a higher COD concentration.
The hydrolytic efficiency in the reactor was correlated with changes in CMCase activity in the OFMSW, which reflects the coordination mechanism of multiple enzymes produced by microorganisms that degrade complex lignocellulosic matter. Thus, with micro-aeration the enzymatic activity increases, as shown in
Figure 2a, the exponential increase in CMCase enzyme activity was observed from day 3, reaching a maximum value of 17.5 μg/mL per min on day 10. However, a decrease was observed on day 11, where the concentration decreased to 13 μg/mL min, and on day 20 declined to 2.7 μg/mL min. During the micro-aeration, the increase in enzymatic activity indicated a higher concentration of CMCase in the hydrolysis of cellulose contained in vegetable waste compared with the PBR control reactor. The enzymatic activity lasted until day 15, further favoring the solubilization of the more complex solid particles contained in the substrate, which manifested itself as an inability to realize your metabolic needs under certain environmental conditions. Similar behavior was described by Zhu, Li, Hao, He, and Shao [
25], who observed an increase in the enzymatic activity of CMCase with micro-aeration on day 5. This confirms that facultative microorganisms found favorable conditions to secrete enzymes that degrade complex materials. Similar results were reported by Charles et al. [
38], they used micro-aeration as pretreatment, achieving an increase in the enzymatic activity of cellulase during the first 5 days. These values indicated that the micro-aeration applied to the hydrolysis in the PBR had a positive effect on the enzymatic activity of the cellulase, causing greater degradation of the macromolecules and reflecting an increase in COD in the first 5 days. Therefore, this enzyme is highly specific for depolymerize cellulose into glucose and other monosaccharides [
39]. Lynd et al. [
40] described the mechanism of action of the enzyme cellulase and mention that to break the β-1, 4 glycoside bonds of cellulose, requires acid hydrolysis using a proton donor and a nucleophile or one base. Likewise, Dollhofer et al. [
41] describes that anaerobic microorganisms lack the enzymatic capacity to catabolize lignin, for this reason, the presence of oxygen favors the reaction to break aromatic rings of the cellulose, which does not occur in a completely oxygen free environment. This study demonstrated that when comparing the results obtained in the PBR
MICRO-AERATION, a greater enzymatic activity is observed in comparison with the PBR control. In the PBR
MICRO-AERATION, the conditions were given for cellulose to have a higher degradation (acidic and medium), which was favored by the addition of oxygen in the process. As can be seen in
Figure 2a, there is greater activity on days 9–11, comparing this behavior with what by Zhang and Lynd [
42] describe, they mention that cellulose hydrolysis is carried out slowly and in a longer time. Therefore, we consider that the behavior of the CMCase in PBR
MICRO-AERATION was likely due to the mechanism by which the reactions are carried out. At the beginning of the test, the endogluconase star being into contact with lignocellulosic materials to initially break the cellulose chains, releasing oligosaccharides. Subsequently, the exo-gluconase enzyme attacks the ends of the chains releasing cellobiose and finally the enzyme β-glucosidase reacts with the cellobiose to form glucose. Due to the link structure of the lignocellulosic biomass, these transformations are carried out in an enhanced manner, therefore, the hydrolysis phase time increases, making it more efficient.
Figure 2b shows the VFAs concentration and pH values during the experiment. The initial VFAs concentration on day zero was 516 mg/L, subsequently on days 2 and 3 an increase was recorded continuously until day 5, wherein the maximum VFAs value of 8800 mg/L was recorded. This increase was due to the transformation of macromolecules to reducing sugars and these to VFAs, which caused the pH decrease to 5.4 [
29]. The VFAs concentration applying micro-aeration was higher compared to other studies. Agdag and Sponza [
43] obtained a VFAs production of 6000 mg/L by using OFMS as substrate, similarly, Sarkar and Mohan [
36] obtained maximum values of VFAs of 5087 mg/L by applying micro-aeration at the OFMSW. In this work, the VFAs production was greater than the PBR control reactor by 300%, which is evidence that micro-aeration favored hydrolysis and the production of organic acids during the first 5 days and on day 10, the concentration decreased to 7100 mg/L. After this time, on day 25 the VFAs decreased reaching similar value to the initial one of 1500 mg/L. The micro-aeration was applied for 25 days in the reactor. On the other hand, although the energy consumption is low, it could be further optimized using the micro-aeration for a shorter time. The maximum concentration of VFAs was found during the first 5 days and the enzymatic activity lasted until 10 days after the start of the test in the micro-aerated reactors. Therefore, the micro-aeration can be improved, reducing the operating time in the hydrolytic reactor, using micro-aeration only in the first 15 days, and in turn, saving energy [
5].
As shown in
Figure 2b, the pH had an inverse relationship with VFAs. At the beginning, the pH value was 6.11, on days 2 and 3 values of 5.61 and 5.4 were recorded. This decrease in pH is caused by conversion of macromolecules into VFAs, which when transformed into acetate and consumed by the methanogens, it leads to an increase in pH. During the biodegradation of the waste, the pH showed variations, on day 10 the pH was 5.88, which showed that PBR
MICRO-AERATION was still in the hydrolysis stage. On day 12, there was slight increase reaching a pH value 6, maintaining this trend until reaching 6.5 on day 18, and on day 25, the pH increased to 7.06. Xu et al. [
44], who reported similar behavior with food waste, found a pH decrease of up to 4 on day 5 and 6 caused by the accumulation of VFAs when the experiment began and then an increase to 6 on day 8. Likewise Cysneiros, J.Banks, Heaven, and G.Karatzas [
35], who studied the hydraulic flow effect and pH control on the VFAs production and described pH drops up to 4, therefore, it was necessary to add a buffer solution. In this case, we had pH conditions inside the reactor for hydrolysis to take place, therefore, no reagent was added.
The ORP values are observed in
Figure 2c. At the beginning of the experiment, on day 0, the ORP had a value of −25 mV, but on the first day, the ORP decreased to −185 mV, and from day 2 to day 9, the ORP varies from −167 to −215 mV, and finally decreased to −352 mV on day 20. At the beginning the ORP decreases; this was attributed to the production of metabolite such as hydrogen, lactate, VFAs among others, as mentioned by Nguyen and Khanal [
6] and Liu et al. [
45], who mentioned that during the hydrophilic phase, reduced compounds are generated promoting the decrease in ORP to negative values of up to −420 mV. On the other hand, the addition of oxygen due to micro-aeration in the AD system modified ORP values (reduction in reducing power) due to oxygen consumption by reducing metabolites, as mentioned by Xu, Selvam, and W.C.Wong [
5].
In addition, changes in redox potential caused changes in the nutrition and physiology of microorganisms, which in turn influences the redox state of essential nutrients such as phosphorus and nitrogen facilitating their absorption by microorganisms. In this test, the addition of air results in an increase of ORP (decrease in reducing power) due to oxygen consumption by reducing metabolites, in addition, the micro-aeration rate of 254 L-air/kg-TS-day maintained a range of −150 to −215 mV inside the PBR
MICRO-AERATION, this range is considered suitable for hydrolytic microorganisms [
9]. At this ORP range, microorganisms such as
firmicutes,
proteobacteria, and
bacteriodes were developed, finding the conditions to perform their metabolic activities, thus we assume that they found the conditions in the environment required for their development. Therefore, the production of VFAs was improved, which was verified with the PBR control by obtaining a higher yield in the first 5 days without the addition of chemical reagent to regulate the pH or that inhibits methanogenic activity. The range of −150 to −215 mV is considered within a microaerobic zone [
6], where degradation of the substrate is promoted and transformed into by-products such as volatile fatty acids, among others.
3.4. UASB (Acclimatization)
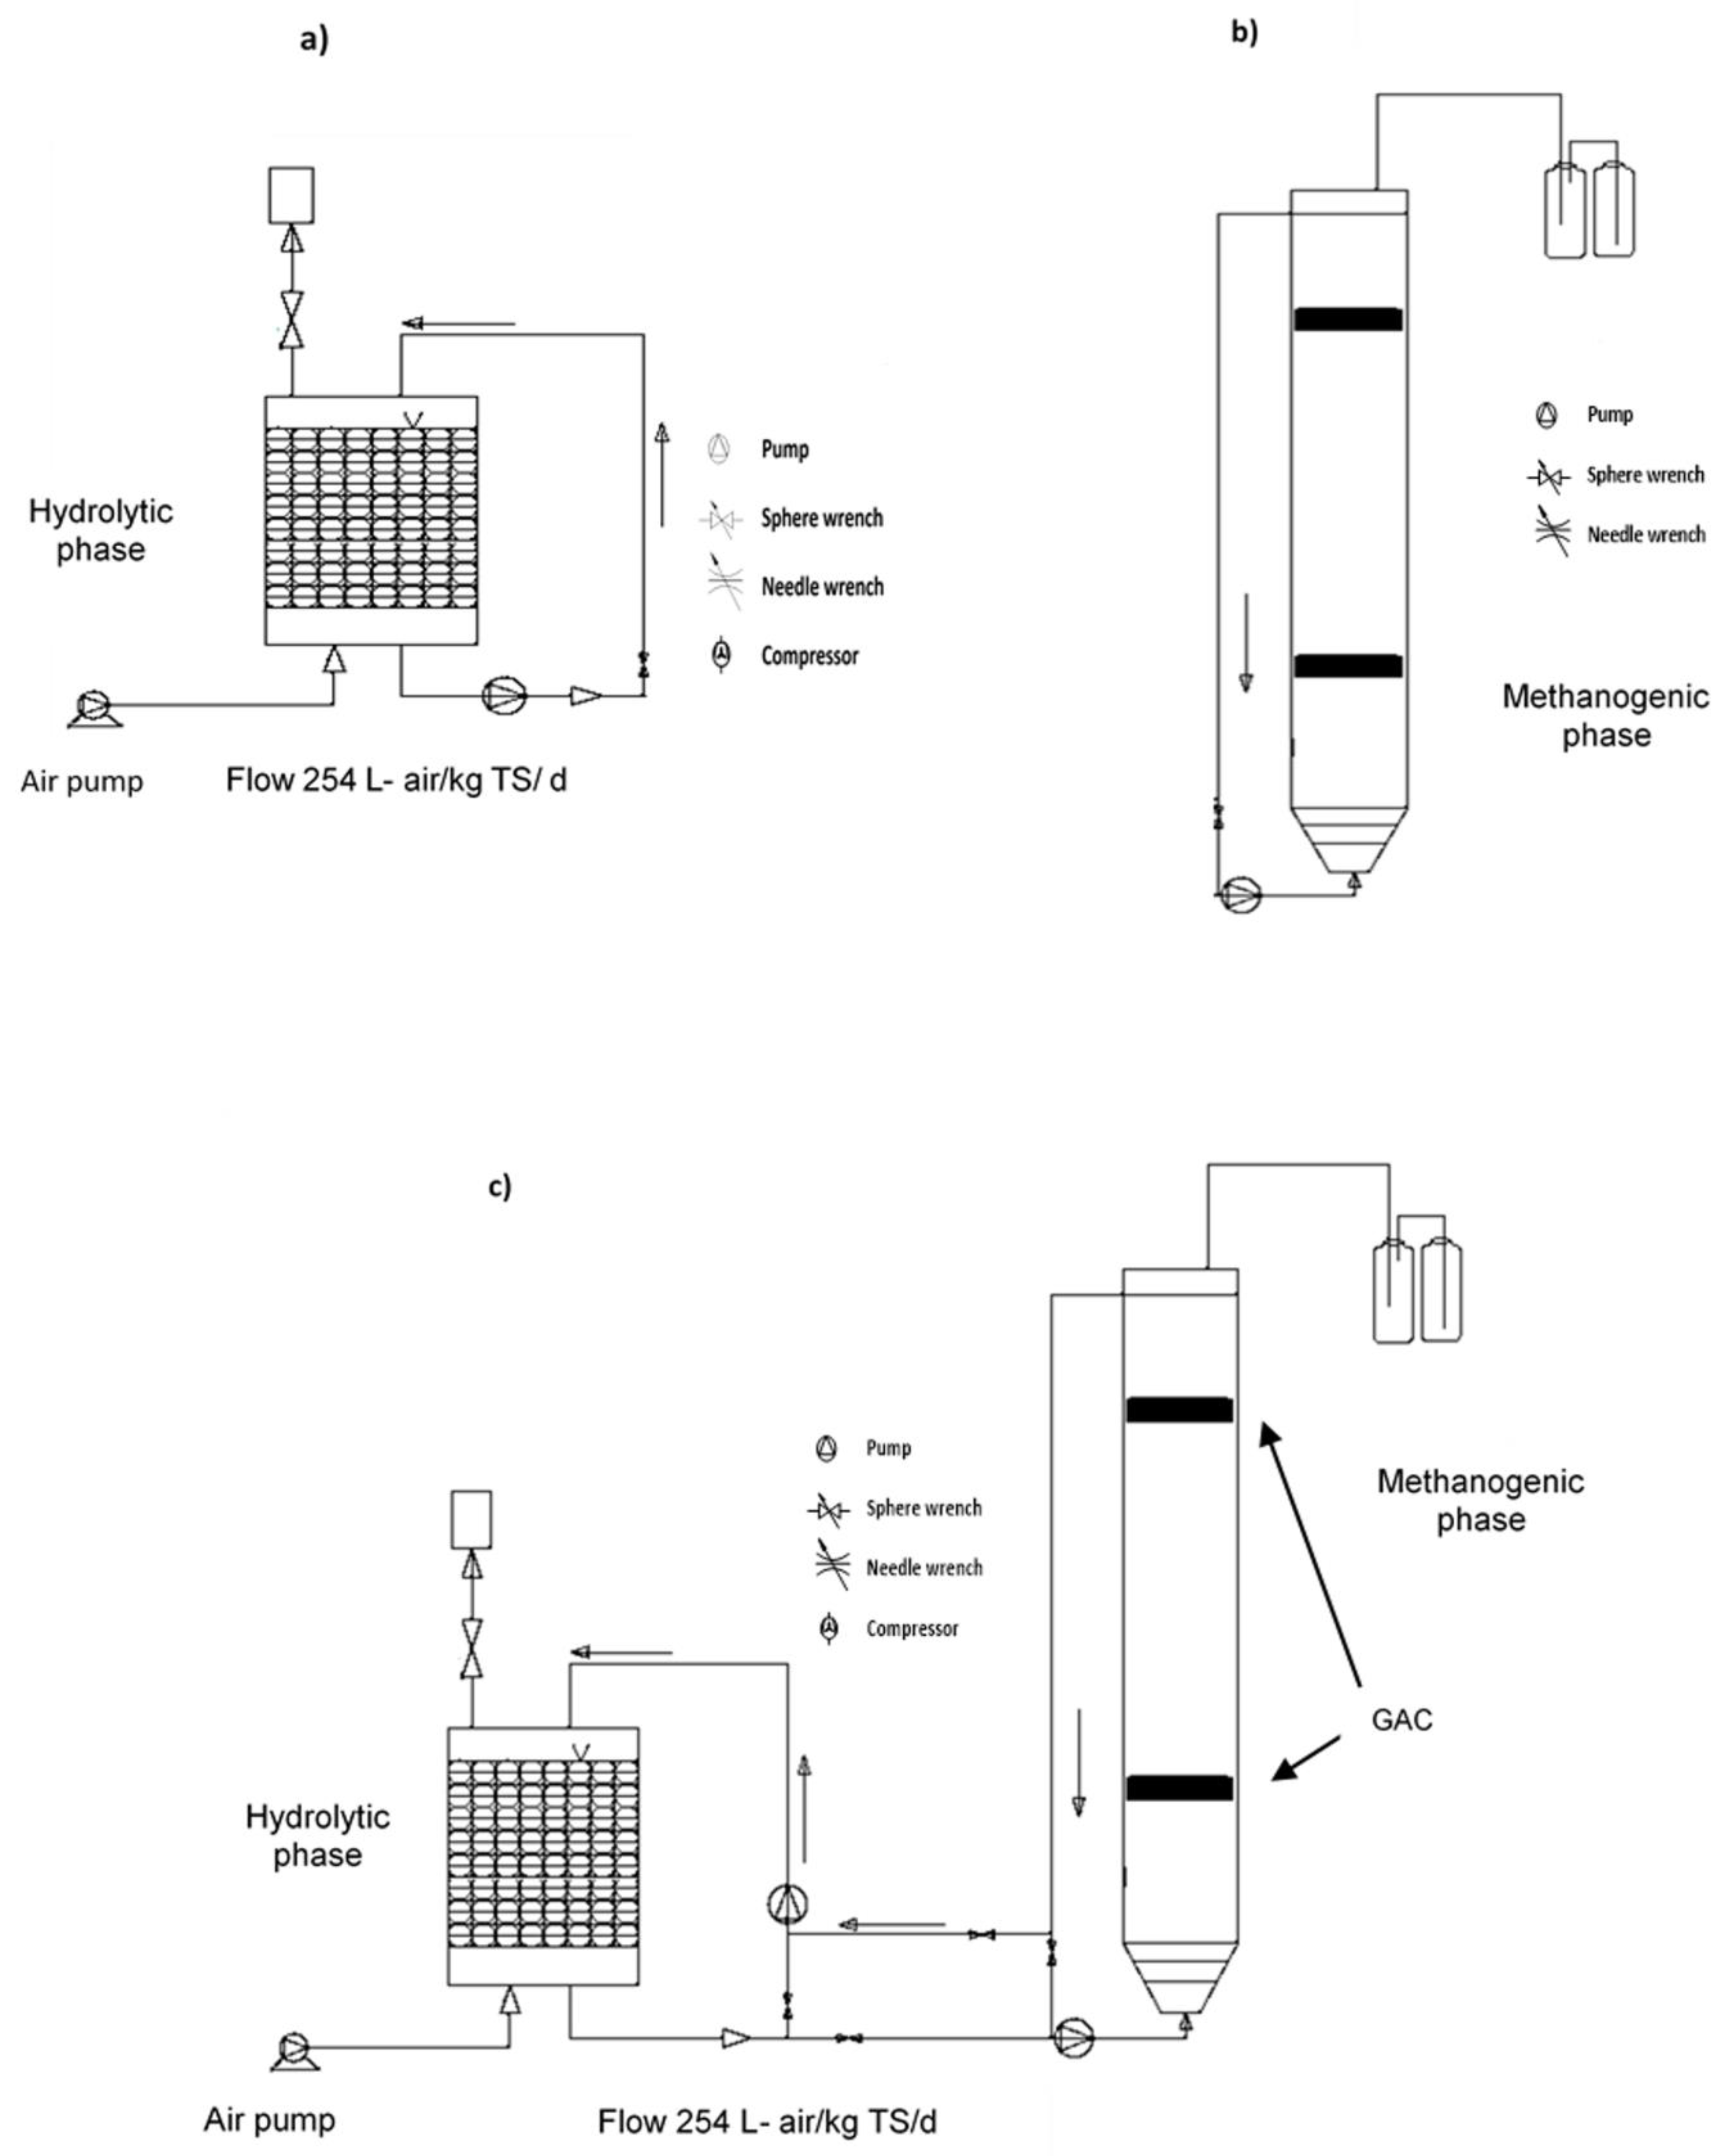
UASB reactor acclimatization was done by adding a mixture of 50% inoculum and 50% synthetic wastewater in volume (ratio 1:1), see
Figure 3. VFAs, total alkalinity (data not shown), and pH measurements were carried out to verify the behavior of the alpha and buffer indexes, as described by Martín-González, Font, and Vicent [
18], these authors mentioned the importance of alkalinity when the VFAs overcome bicarbonated, the system undergoes pH drops, therefore methane production decreases. On the other hand, Jun et al. [
46] mentioned that alkalinity is necessary to maintain a pH range of 6.8–7.2 at OFMSW, which is the range where the biological activity of methanogenic bacteria is carried out and the lack of bicarbonate alkalinity allows VFAs accumulation, as well as a decrease in methane production.
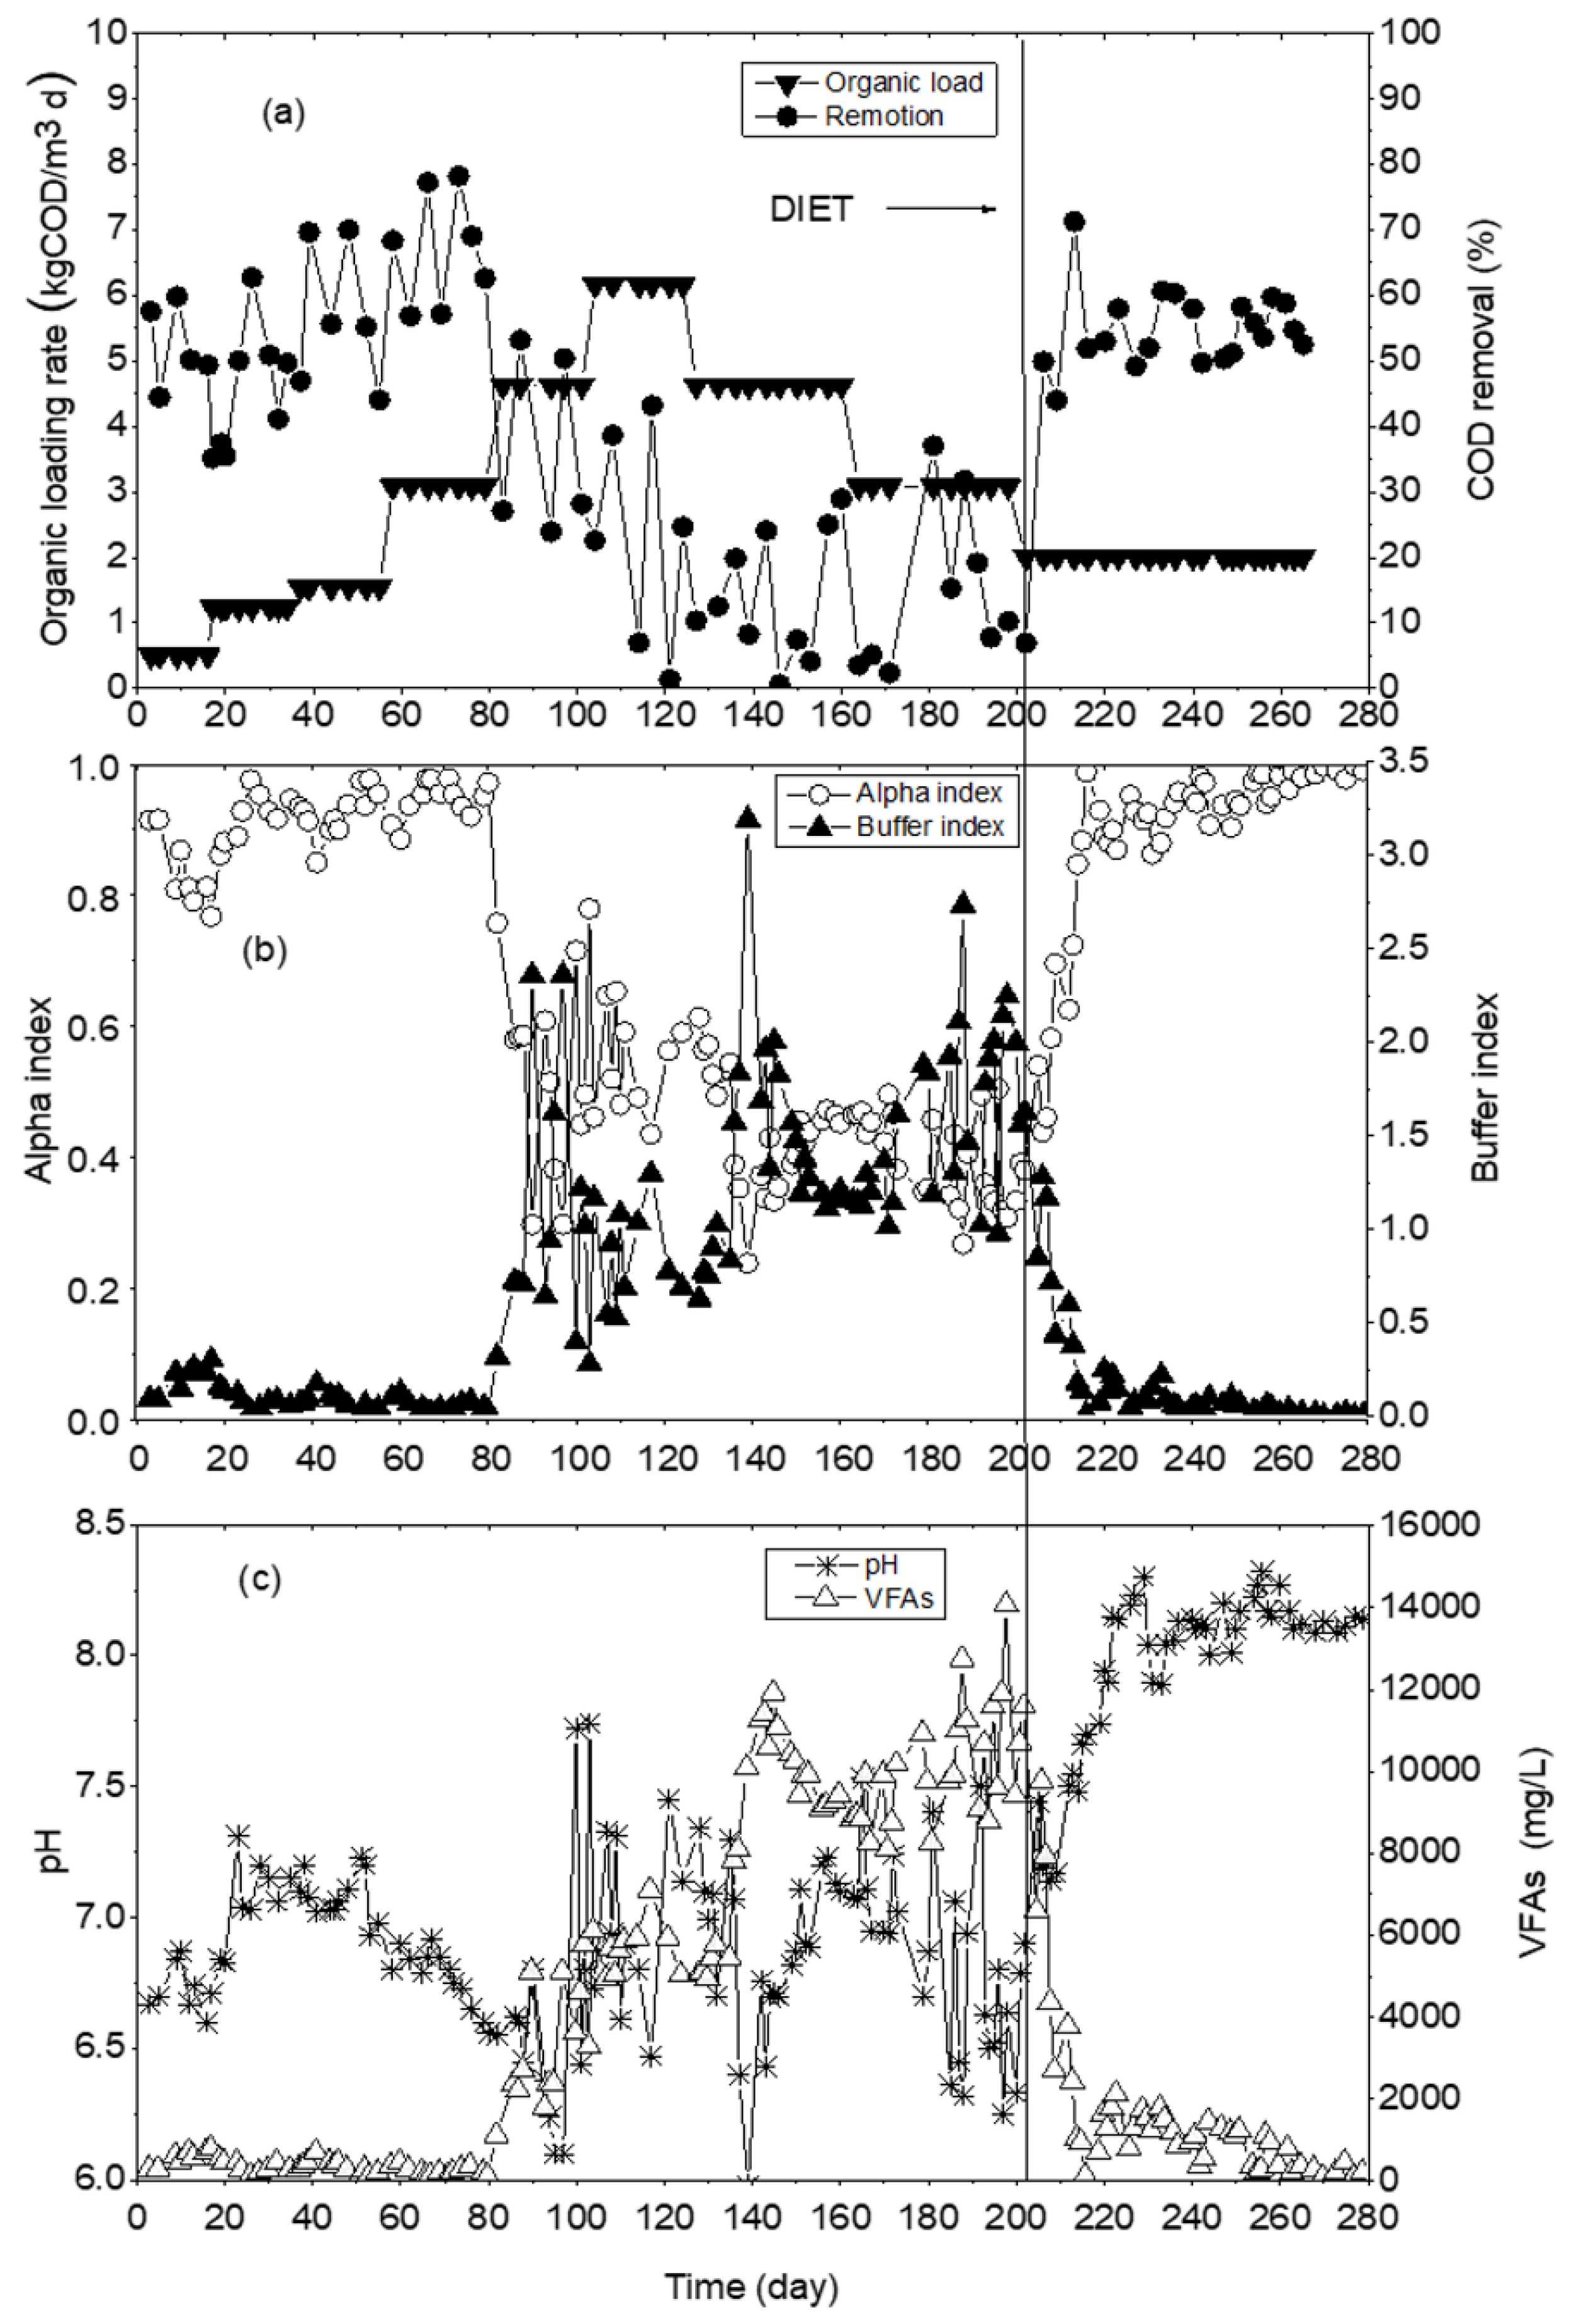
Figure 3. Upflow anaerobic sludge blanket acclimatization: (a) organic loading rate and chemical oxygen demand removal, (b) alpha and buffer indices, (c) volatile fatty acids and pH.
The acclimatization phase allowed to establish the organic loading rate in the reactor, which was gradually increased from 0.5, 1, 1.5, 2, 3, 4, and 6 as kg COD/m
3 d until the reactor collapsed. Ahring [
47], mentioned that substrates with moderate concentrations of TS (12%), require using organic load rates of less than 5 kg COD/m
3d in order to avoid imbalances in the process. In our study, the TS concentration in the OFMSW was 20.7 ± 0.7%, therefore, was necessary to determine the operational load of the UASB considering the characteristics of the substrate. The COD removal results are shown in
Figure 3a. In the beginning, a 0.5 kg COD/m
3d load was established with rising removal up to 60%, later, it was increased to 1.5 kg COD/m
3d, remained for 20 days with a removal of 70% to 80%. Therefore, loading organic rate continued to increase in the UASB reactor until it reached 6 kg COD/m
3d, where remained for 25 days more, with variable removals until finally collapsing on day 125.
From day 1 to day 80 of the start of the test, the alpha index showed variations in a range of 0.8 to 0.97, and buffer index of 0.05 to 0.2. During this time, the UASB presented an imbalance, the alpha index decreased to 0.3, the buffer index increased to 0.7 (
Figure 3b), and the methane in the biogas registered a decrease of up to 30%. In order to stabilize the process, on day 125 the organic load was reduced to 4.5 kg COD/m
3d during 40 days, subsequently it was reduced to 3 kg COD/m
3d for a period of 40 days without the reactor reaching stability. Gao et al. [
48], who used OFMSW as a substrate, evaluated the effect of the increased organic load, described that greater than 2.5 gVS/Ld (equivalent to COD 3 g/Ld) causes VFA accumulation and generates an imbalance between the acidogenesis and methanogenesis phases in microbial community. From day 1 to 80, the amount of VFAs was maintained at 200 mg/L (
Figure 3c); the COD removal was greater than 50% and the methane in the biogas was 70%. On day 104, the organic load was increased to 6 kg COD/m
3d and maintained until day 124. During the 20 days when the organic load was maintained at 6 kg COD/m
3d, the reactor presented instability, showed a decrease in pH and accumulation of VFAs. Therefore, inhibition of methanogenic microorganisms caused an increase in VFAs concentration to 13,000 mg/L (
Figure 3c).
To correct the accumulation of VFAs, decrease in pH and decrease in the percentage of methane in biogas, on day 200 the organic loading rate was reduced to 2 kg COD/m
3d. Two stainless steel mesh bags with granular activated carbon were placed inside the reactor [
49]. Dang et al. [
17], who studied the DIET using different types of carbon in OFMSW to improve the methanogenic phase, in their studies have revealed the enrichment of microorganisms such as
Sporanaerobacter and
Methanosarcin present on the carbon surface. These results and the known ability of
Sporanaerobacter species to transfer electrons suggest that they can participate in direct electronic transfer between species with
methanesarcin, when an inorganic conductor is used as an electron transfer mediator. Therefore, the use of GAC inside the UASB reactor favors recovery and stability in a shorter time when existing VFA accumulates. In addition, the use of DIET between species increased the amount of methane in the biogas and decreased the VFAs concentration.
After making these modifications, the total alkalinity was determined, and it was observed that the alpha and buffer indexes returned to the values within the operating range (alpha 0.7–0.9 and buffer 0.2–0.4). After the coal addition in the reactor, the stabilization time required was 13 days, from day 200, the UASB reactor reached balance with 2 kg COD/m
3 d organic loading rate, and reaching a removal up to 70% removal, an ascending flow velocity of 0.5 m/h, taking as reference Latif et al. [
15]. In addition, the biomass was prevented from reaching the top of the reactor and is favorable for the development of mesophilic granules. The alpha index had an average of 0.9, buffer index 0.2, COD removal more than 50%, and VFA less than 2000 mg/L, therefore, we considered that the microorganisms adapted to medium characteristics, thus achieving the start and stabilization of the UASB again.
During the time in which the reactor presented acid-base imbalance due to the increase in the organic loading rate, washing of the biomass was observed in bulky granules. This condition negatively affected the retention of sludge inside the reactor. Several authors, Ahring [
47], indicated that for substrates with high TS concentrations (greater than 12%), and Parawira et al. [
50], the maximum organic load that a UASB reactor supported was 6 kg COD/m
3d. In order to make methanogenic activity more efficient, DIET was used in the UASB, therefore, we consider that mutual interaction (syntrophic) between hydrolytic bacteria and methanogenic archaea was favored, and the conversion of reduced organic compounds from short chain to methane was accelerated. The addition of a no-biological conductive material such as GAC favored electron transfer. The GAC apart from serving as a support for the microorganisms had the capacity to absorb toxic compounds and increase the pH; therefore, it favored the conditions of the medium and increased methanogenic activity [
12].
3.5. Coupling Reactors (PBRMICRO-AERATION and UASBDIET)
Coupling reactors operations were determined by maximum COD concentration, and an amount of VFAs t in the micro-aerated packed bed reactor (PBR
MICRO-AERATION). The coupling experiment ended at 14 days when both reactors obtained similar results for COD, VFAs, and pH, as mentioned by Cirne et al. [
20], in which they used energy crops as raw material in a two-phase system; they described that the coupling time of both reactors ends when their leachates register similar values.
Figure 4 illustrates the profiles of the parameters determined to evaluate the behavior of the system. In
Figure 4a, COD behavior is observed in the PBR
MICRO-AERATION; on day 5 its maximum concentration of 24,750 mg/L was found, therefore, we decided to couple the reactors at that time, due to the evidence recorded in previous tests, where the maximum concentration of COD was found at this time. To determine the amount of leachate from the PBR
MICRO-AERATION to feed the UASB per day, the useful volume of the methanogenic reactor and the organic load per day were considered as the total mass to be added. This mass was divided by the COD concentration of the PBR
MICRO-AERATION leachate expressed in g/L, resulting in the amount to be dosed in liters per day. In order to maintain a constant organic load rate (2 kg COD/m
3d) in the UASB and due to COD variations in the PBR
MICRO-AERATION, each feeding requires its own calculation. The record of the maximum COD concentration on day 5 was observed in other works, as reported by Xu et al. [
5], with OFMSW, where they described that the highest organic matter solubilization occurred in the first 5 days in a PBR
MICRO-AERATION. In the same way, Stabnikova et al. [
51] using OFMSW also obtained COD concentrations close to 18,000 mg/L over a period of time of 6 days. However, these authors mentioned the use of greater amounts of substrate, in order to avoid acid stress and increase the solubility of organic matter; moreover, they described the addition of basic chemicals to the acidogenic reactor and the replacement of a proportion of hydrolytic leachates with methanogenic effluents. In our test, no means were used to regulate the pH, the experiments were carried out according to the surrounding conditions and in 5 days the highest COD concentrations were recorded in the PBR
MICRO-AERATION. In consequence, the solubilization of the OFMSW is more efficient. Subsequently, on day 13 there was a COD decrease of up to 5500 mg/L, where it remained unchanged until the end of the experiment. This decrease was due to consumption of VFAs by methanogenic microorganisms for the generation of biogas in UASB reactor.
In
Figure 4b, the behavior of bicarbonate alkalinity before and after the coupling reactors is illustrated. In the PBR
MICRO-AERATION reactor, it shows an initial concentration of 716 mgCaCO
3/L, later in the following days, a decrease was shown until a zero, caused by the VFAs formation in the first 5 days, since bicarbonate alkalinity consumption caused a decrease in pH before coupling. These results were similar to those reported by Martín-González, Font, and Vicent [
18], in OFMSW, who conducted an analysis of the imbalance that occurs in the reactors due to the VFAs accumulation and mention that this process occurs when bicarbonate alkalinity is consumed by the acidity generated within the system and produced a decrease in pH. In the same way, Li et al. [
52] carried out an analysis with different control parameters to monitor failures in an AD process in OFMSW. They mention the importance of total alkalinity control, the bicarbonate alkalinity, and total alkalinity (AP/AT) ratio, which is an early warning parameter on the equilibrium of the buffer capacity of the system, and even reflects the metabolism of the AD system [
18].
After coupling reactors, the PBR
MICRO-AERATION recorded an increase in the bicarbonate alkalinity concentration until reaching a maximum average value of 15,475 mg CaCO
3/L. On day 13, and reaching 16,600 mg CaCO
3/L on day 14, with a concentration similar of the UASB reactor at that time. This alkalinity increases within PBR
MICRO-AERATION due to the exchange of leachate between both reactors as mentioned by España-Gamboa et al. [
22], who described that the recirculation effluent from a methanogenic reactor in a two-phase process increases the alkalinity in the acidogenic reactor.
Figure 4c shows the pH behavior over time within PBR
MICRO-AERATION–UASB
DIET reactors, at the beginning of the experiment, the hydrogen potential decreased in the first 4 days to 5.03. This value was within the range in which hydrolysis is properly performed, similar results were obtained by Wang et al. [
27] in their work carried out with OFMSW using different inoculum types. They evaluated the pH effect and the production of VFAs, their results indicated that the range of the highest acidity concentrations was reached at pH of 5 to 6, in a time of 20 days. In the same way, Jiang et al. [
32], evaluated the pH effect on OFMSW, they described that the higher VFAs productions was reached at pH 6. After coupling reactors, the pH increase was gradually rising to 8.12 on 12 days; this increase was due to the leachate recirculation from PBR
MICRO-AERATION to UASB reactor, and from the UASB to the hydrolytic reactor, because effluent from UASB reactor contained high bicarbonate alkalinity, with an average of 18,000 mg CaCO
3/L. Therefore, a high buffer capacity caused an increase in pH due to the neutralization by VFAs, as mentioned by Xu, Selvam, and W.C.Wong [
5], who worked with kitchen waste and which they mentioned that the bicarbonate alkalinity is consumed by the acidity. Therefore, when you have the alkalinity concentration required to neutralize the VFAs, it acts as a buffer solution, therefore, the system does not show imbalance and the concentration did not increase.
Effluent from UASB reactor remained pH constant, with a maximum value of 8.2, which reflects the buffer capacity despite the concentration of VFAs in the leachate from PBR
MICRO-AERATE. After 11 days similar pH values (8.05) were reached in both reactors, and in the next 2 days, the variations decreased.
Figure 4d shows the behavior of VFAs over time. At the beginning of the experiment, VFAs concentration was 85.13 mg/L, and on day 5, the PBR
MICRO-AERATION reached a maximum concentration of 7146 mg/L indicating that it was the optimal time to couple both reactors. After coupling of both reactors, a reduction in the VFAs concentration was observed, mainly in the PBR
MICRO-AERATION, see
Figure 4d; and reached minimum values of 350 mg/L on day 14, which is a lower time than that described by Michele et al. [
53]. In their work with OFMSW, they required more than 20 days to consume the VFAs and stabilize the waste. As observed in
Figure 4d, the high VFAs concentration coming from the PBR
MICRO-AERATION reactor did not cause any troubles to UASB reactor and maintained similar concentrations from day 1 to 14. This stability presented by UASB reactor was due to acclimatization during the start-up and in which the microorganisms were adapted to the process conditions.
In
Figure 4e the methane production profile of the UASB is shown before and after coupling. The generation was 4520 mL/d on average, with a percentage of methane in the biogas of 90% and a constant organic loading rate of 2 kg of COD/m
3d. This same load rate was maintained during the time of the experiment. After the coupling of PBR
MICRO-AERATION-UASB reactors, methane generation decreased continuously from day 5 until day 13, with a minimum volume of 800 mL per day. Despite the concentration of 5500 mg/L of COD recorded in the PBR
MICRO-AERATION, this result is due to residues of recalcitrant materials such as; seed particles, fruit or vegetable husks, and lignocellulosic materials found in the OFMSW, which were not readily biodegradable, therefore, did not favor methane production. In a review by Li et al. [
54], where different treatments and substrates were used, they mentioned that wastes with high solid concentrations require pre-treatment to increase their biodegradation and transformation into methane. In the same way, Shahriari et al. [
55], who worked with FORSU, used different percentages of leachate recirculation in BMP tests. They describe how the high COD concentration in the leachate is due to the accumulation of recalcitrant or less biodegradable material, therefore, influences the production of methane, however, they only described accumulation of biogas production up to 550 mL in 14 days. Due to the similarity in the concentrations of the VFAs, COD, bicarbonate alkalinity, and pH in both reactors on day 14, they were disconnected. After the biodegradation process, the hydrolytic reactors were emptied and the amount of TS and VS were determined, reporting the removal results of TS and VS 67.5 ± 4 and 69.4 ± 3. Forster-Carneiro, Pérez, and Romero [
28], who used OFMSW substrate, reported a reduction of TS of 34.7% and VS of 44.2% in a time of 60 days, in the same way, Fantozzi and Buratti [
56], who also worked with OFMSW, registered a VS reduction of 55% in a time of 39 days. Therefore, we consider that in our study the removal efficiency was more efficient.
The methane yield after coupling was 400.2 LCH
4/kgVS removed, and with a biogas methane content of up to 90%. Forster-Carneiro, Pérez, and Romero [
28], who conducted ss in one phase tests using OFMSW as substrate, recorded yields of 0.18 LCH
4/gVS, Similarly Angelidaki et al. [
33], those who worked with OFMSW in a phase of an AD process reported a methane yield of 320 LCH
4/kgVS. In another work using OFMSW in a single phase conducted by Nguyen et al. [
57], they reported a methane yield of 260 LCH
4/kg VS. According to these comparisons, the methane yield of 400.2 LCH
4/kgVS removed that was obtained in 2 phases was higher compared to a single phase and the OFMSW degradation through the AD system in two phases is more efficient than that of one phase. Finally, as shown in
Figure 4, the behavior of pH, acid-base balance, the concentration of VFAs in values below 1500 mg/L and the percentage of methane in the biogas in a range of 80 to 90%. The application of DIET in the methanogenic phase helped to reestablish the UASB after intoxication, in this sense, during the coupling in the PBR
MICRO-AERATION balance was reached, without affecting the consumption of the VFAs present in the hydrolytic reactor.

 ,
, 


