Abstract
Hydropower is an important renewable energy, and Construction Diversion Risk (CDR) should be highlighted and assessed during hydropower development. Since sediment-rich rivers are widely existing around the world and have great hydro-energy potential, assessing CDR for hydropower development on sediment-rich rivers in terms of engineering feasibility is of significance. This paper proposes a CDR assessment method for the sediment-rich hydropower development environment. The method is concise and practical, reflects diversion uncertainties and correlation, and mainly adopts the Gumbel–Hougaard Copula and the Monte Carlo Simulation. Through simulating flood evolution and sediment impact during diversion, the method can assess CDR basing on the cofferdam overtopping probability. Case results show that the proposed method can achieve CDR assessment on a sediment-rich river and highlights sediment impact on the diversion risk. Through results discussion, the risk feature of construction diversion on sediment-rich rivers is revealed, that sediment impact causes the dynamic and yearly-risen CDR. Hence, our conclusions are: (1) the proposed method is feasible, effective and has industrial potential, and (2) a diversion scheme on sediment-rich rivers is suggested that adopts the design with high or yearly-heightening cofferdams, based on the advanced CDR assessment to cope with the risk features of sediment-rich diversion environments.
1. Introduction
Hydropower is an important part of global renewable energy [1,2,3], which not only supports regional power supply but also helps to achieve decarburization targets [4,5]. Hydropower contributes to balance the power production variability of other kinds of renewable energy, like wind or solar power, because hydropower supply is relatively steadier and has good adaptability [6,7,8]. Thus, hydropower development is of significance and has great potential worldwide [9,10,11,12]. Construction diversion is a necessary step in hydropower development, which provides a construction worksite free from river interference through diverting rivers [13,14,15,16]. As hydropower construction requires larger amounts of investment and receives more public and governmental concerns than common civil engineering projects, Construction Diversion Risk (CDR) should be highlighted [17,18]. CDR degree reflects diversion failure possibility, and diversion failure can cause schedule delay, building damage, or even casualties during hydropower construction. These failure consequences bring huge loss to the local society and pose negative political impacts [19,20,21]. Hence, assessing CDR before carrying out hydropower construction is necessary, which forecasts the failure possibility for project contractors and contributes to the process control of overall hydropower development. Besides hydropower development, CDR is closely related to other river related engineering as construction diversion has been applied in rehabilitation transformation or removal of aging hydropower infrastructures [22,23,24], and can be connected with all types of constructions implemented in the rivers.
Existing literatures show that CDR is closely related to the diversion environment especially river conditions [21,25]. Current studies about CDR are mostly carried out under the condition of clear-water river [13,17,18,19,20,26,27,28,29], but actual hydropower development is not limited to clear-water watersheds [9]. Many rivers in Asia, Africa, North America and other regions possess high sediment concentration [30,31,32,33,34,35], and these sediment-rich watersheds have great hydro-energy storage and promising development prospect [1,36,37,38,39]. Case studies about CDR assessment on a specific sediment-rich river exist [15], but they only provide limited reference as sediment-rich rivers vary in types. Existing sediment researches can cope with different sediment-rich river types, and specific studies in terms of reservoir sedimentation [40] or sediment transportation [41,42] provide references for solving CDR assessment on sediment-rich rivers. However, sediment researches are mostly based on scenarios of natural rivers [43] or built permanent structures like dams [44], which are different in condition and scale from the temporary diversion system under the changing construction environment with multiple uncertainties influence [21]. Thus, the applicability of commonly-used sediment research methods on diversion related research under the engineering scenario should be analyzed. Among sediment research approaches: (1) numerical simulation can comprehensively predict the sediment accumulation basing on parameters in terms of sediment and flow [40,45,46,47], but it generally requires detailed data, specific models for specific conditions [46,48,49,50], and has application restrictions of computation and application [47,51,52]; (2) physical model experiments have advantages in customization and credibility, but have time and economic costs that are adaptable to the specific project [53]; and (3) empirical formulas are fundamental descriptions about sediment based on observed data and experiments [42,43,54,55], which are convenient in application, as only primary data in terms of hydrology and sediment are required.
From the literature review, the current gap in research is revealed: “risk assessment for construction diversion on the overall sediment-rich rivers is in need, but practical studies specifically for this topic are lacking.” There exist researches related to diversion and sediment respectively and combing them not only should consider the characteristics of diversion on sediment-rich rivers but also the method applicability in terms of effectiveness, data availability, and broad applicability. Hence, the objectives of the paper are: highlighting the characteristics of diversion engineering to provide the concise and practical means of assessing Construction Diversion Risk (CDR) for hydropower development on overall sediment-rich rivers, and highlighting the CDR assessment methodology references from sediment researches, with placed emphasis on efficiently solving the engineering problem with appropriate data acquisition and computation effort.
This study, at a macro level, is of significance to the sustainability of renewable energy development. Providing specific and practical means of CDR assessment for hydropower development on overall sediment-rich rivers narrows the current gap in diversion research, benefits the engineering industry in elevating river-related construction reliability, and contributes to expanding the area of possible hydropower development.
2. Construction Diversion Risk Assessment on Sediment-Rich Rivers
Before proposing the main work of the paper, the CDR definition should be explained and characteristics of diversion on sediment-rich rivers should be analyzed, then the theoretical framework of CDR assessment on sediment-rich rivers can be come up with.
Generally, the term risk involves two components: the probability of exceedance of the risk event, and the consequence of the risk event. In this paper, the diversion risk is defined regarding the exceedance probability of diversion risk event as the research objective is to assess the diversion risk in terms of probability. According to the international standard, risk is derived from uncertainties [56], and for construction diversion, diversion uncertainties mainly come from the environment and the diversion system itself, and the risk event is diversion interruption or failure caused by uncertainties. Under general clear-water conditions, river derived flood uncertainty and diversion system derived discharge uncertainty are the main diversion uncertainties [13,19,21,26,57], while under the sediment-rich diversion environment, the sediment uncertainty should also be considered because sediment impact is evident [15]. Meanwhile, as construction diversion systems generally involve temporary water retaining works of cofferdams and temporary water discharge works of tunnels [14,28], cofferdam overtopping can be seen as the CDR indicator, because when the flood volume exceeds the tunnel discharge volume the water level of the upstream cofferdam reservoir will rise, causing cofferdam overtopping. Overtopping results in worksite submergence and can cause interruption or failure of the ongoing hydropower construction [26,58]. Hence, the degree of CDR can be defined as the probability that the flood load exceeds the diversion system resistance [59], i.e., the cofferdam overtopping probability.
In regarding to diversion engineering, the flood load is determined by the Diversion Flood Course (DFC), the diversion resistance is together determined by the Diversion Discharge Ability (DDA) and the upstream Cofferdam Reservoir Capacity (CRC). DFC is naturally time-varying, and can be simulated basing on flood uncertainty and basic hydrological data [20]. DDA can adopt diversion discharge calculations to determine, which relate to diversion design, discharge hydraulic head and the discharge uncertainty [25,27,60]. As the discharge hydraulic head changes rapidly during diversion and uncertainty causes variation, DDA is also time-varying. Moreover, some literatures reported that river sediment could influence the diversion discharge volume, but they were only limited to the condition of hyper-concentrated flow with fine sediment and the effect on discharge was not evident [30,43], thus, sediment effect on DDA is not considered in this paper.
Determining CRC should consider the characteristics of construction diversion on sediment-rich rivers, because CRC is evidently influenced by sediment on sediment-rich rivers compared to general clear-water rivers, as Figure 1 shows.
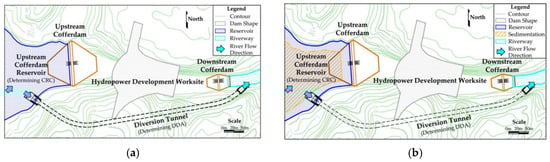
Figure 1.
Typical construction diversion system under two conditions. (a) The clear-water river condition case; (b) the sediment-rich river condition case.
It is evident in the figure that as the sediment impacts sedimentation occupies room of the CRC in the cofferdam reservoir. Thus, during diversion the CRC is time-varying as it changes rapidly due to the sediment accumulation and sluicing along with the time on sediment-rich rivers. CRC determination should involve knowledge about sediment research, as sediment yield of the river determines the sediment accumulation rate, sediment discharge determines the sediment sluicing rate. Sediment yield is naturally uncertain in time and amount [61], and correlated with flood production [44], thus it is changeable and related to both sediment and flood uncertainty. Sediment discharge is determined by diversion discharge volume and flow sediment-transport capacity, thus it is changeable and related to DDA. Types of sediment-rich river should also be considered as different types of sediment-rich rivers have different sediment parameters of particle size and dominated load type [37,43,53]. Since sediment parameters relate closely to sediment-transport capacity [55], sediment parameter differences should be considered in determining CRC so as to cope with different types of sediment-rich rivers.
In the aspect of methodology, diversion uncertainties can adopt Probability Density Functions (PDFs) to describe according to the observed data [13,60]. Uncertainty correlation can be reflected by the Copula Function [62,63,64] and the Gumbel–Hougaard Copula (GH Copula) is suitable for river-related peak parameters coupling [65,66]. Uncertainty based simulation showed good applicability in flood risk related studies, and Monte Carlo Simulation (MCS) is one of the most commonly applied methods [67,68,69,70]; water balance calculation as a basic hydrological approach is feasible in determining reservoir water levels [59,71]. Reservoir sedimentation volume can be determined through ways of sediment researches like empirical formulas or trap efficiency curves based sediment calculation [41,42,51,54,55,72], numerical simulation [46,48], or instruments based methods of remote sensing [73], laser radar or ultrasound detection [40]. Considering the adaptability, efficiency, and feasibility in terms of construction diversion characteristics and engineering practice, the empirical formulas based sediment calculation emerges, as it meets the sedimentation calculation need of diversion engineering, requires less data and computation effort than numerical simulation, fits different sediment-rich river types than trap efficiency curves, and does not need extra equipment or devices. Thus, this paper adopts region code recommended uncertainty PDFs, GH Copula for uncertainty coupling, MCS combing water balance calculation for risk simulation, and empirical formulas to calculate sedimentation volume.
Hence, the theoretical framework of CDR assessment for hydropower development on sediment-rich rivers in general is generated, which include following steps: (1) considering diversion uncertainties; sediment parameter differences effects; correlation between flood and sediment production to form the basis of determining diversion load and resistance; (2) adopting simulation to obtain possible CRC, DDA, and DFC in a time-varying manner, and calculates the cofferdam overtopping probability basing on simulated indexes; and (3) obtaining the cofferdam overtopping probability and cofferdam elevation relation to assess the CDR under sediment-rich river conditions. This theoretical framework is shown in Figure 2.
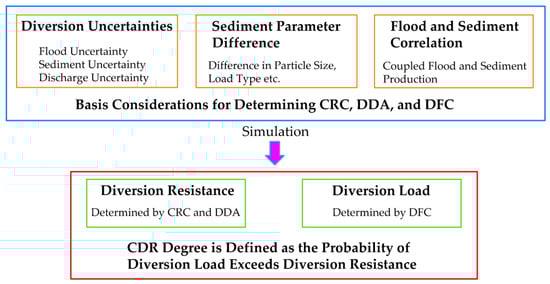
Figure 2.
Theoretical framework of Construction Diversion Risk (CDR) assessment on sediment-rich rivers.
The main contributions of this paper are:
- An engineering practice oriented CDR assessment method for overall sediment-rich river conditions is provided, which facilitates global hydropower development in process control and area expansion, and contributes to the energy industry;
- Time-varying indexes of CRC, DDA, and DFC, as key in determining the resistance and load of diversion systems, are fully described and reflected under the sediment-rich river condition through the uncertainties based simulation.
In the following sections, the proposed CDR assessment method as well as its related descriptions are presented in Materials and Methods; a case that adopts the proposed method and its results are presented in Results; evaluation and discussion about the case application are presented in Discussion; and finally, conclusions about the study are drawn.
3. Materials and Methods
3.1. CDR Assessment Method
On sediment-rich rivers, the degree of CDR equals to the probability of cofferdam overtopping during hydropower development, thus CDR is assessed in Formula (1).
where, R is the degree of CDR, is the possible highest water level distribution of upstream cofferdam reservoir, is the designed crest elevation of the upstream cofferdam, is the probability of within .
Formula (1) shows that, the possible highest water level distribution is the basis for CDR assessment, thus water level in the cofferdam reservoir H should be obtained. In this paper, the water balance calculation is adopted, which is conducted basing on diversion system’s resistance and load. Hence, time-varying indexes of CRC, DDA, and DFC should be generated, and explanation of them are as follows:
- CRC is based on origin storage capacity and sedimentation conditions of the cofferdam reservoir. Origin storage capacity presents in volume V and water level H relation i.e., “V-H”, and water level changes with time t in “H-t” relation. During the diversion, working cofferdam reservoir capacity C can be calculated by subtracting sedimentation volume S from V, and S changes with time t. Hence, CRC presents in a relation among working capacity C, water level H and time t, i.e., “C-H-t”, and is determined by in Formula (2):where, describes the relation among “C-H-t”, describes the relation between “V-H”, describes the relation between “S-t”, describes the relation between “H-t”.
Notably, sedimentation volume S is controlled by sediment yield Win and discharge Wout, and determination of should reflect diversion uncertainties and consider sediment parameters difference as well as flood and sediment correlation. Hence, determination of is complex and needs further description in Section 3.3.
- DDA is based on the design of diversion discharge works, relates to discharge hydraulic head and considers the discharge uncertainty. The discharge hydraulic head is the difference between changing water level at cofferdam reservoir H and the constant outlet base level of the discharge work. As H changes with time t, DDA presents in a relation among diversion discharge ability D, water level H and time t, i.e., “D-H-t”. For general diversion tunnel cases, DDA is determined by in Formula (3) basing on the tunnel flow calculation [59,74]:where, describes the relation among “D-H-t”, describes the relation between “D-H”; is the PDF of discharge uncertainty (DPDF); is the discharge coefficient, A is the section area of the diversion tunnel; is the gravitational acceleration; i is the gradient of the tunnel; L is the length of the tunnel, is the elevation of tunnel outlet base.
- DFC presents in the flood volume F and time t relation i.e., “F-t”, and should reflect local hydrological feature as well as flood uncertainty. Hence, “F-t” is determined by basing on local typical hydrograph i.e., “G-t” relation and PDF of flood uncertainty (FPDF). Actual practice steps include generating flood peak p according to FPDF, and scaling G with p to obtain F. The determination of DFC is shown in Formula (4).where, describes the relation between “F-t”, describes the flood volume and time relation of the typical hydrograph. is the FPDF, is the max volume within the typical hydrograph. The typical hydrograph can be collected from hydrological stations.
Clearly, water level H is determined by time-varying indexes of CRC, DDA, and DFC, and determination of CRC and DDA are also related to H, thus iteration is needed in determining H. Meanwhile, diversion uncertainties as well as flood and sediment correlation should be reflected. Hence, in this paper, MCS and GH Copula are adopted so that H and three indexes can be determined by simulation, flood and sediment coupling, and iteration. With H, water level distribution is obtained and CDR can be assessed. Since the applicability of MCS assumes complete independence between events, in this paper, only the flood peaks are simulated by MCS as they are hydrological independent, while sediment yields are generated according to the flood and sediment correlation by GH Copula. Thus, the applicable requirement of MCS is followed, the stochastic nature of flood and sediment production is simulated, and the correlation between flood and sediment is reflected. The CDR assessment method for hydropower development on sediment-rich rivers is proposed following the above description, and its process is shown in Figure 3.
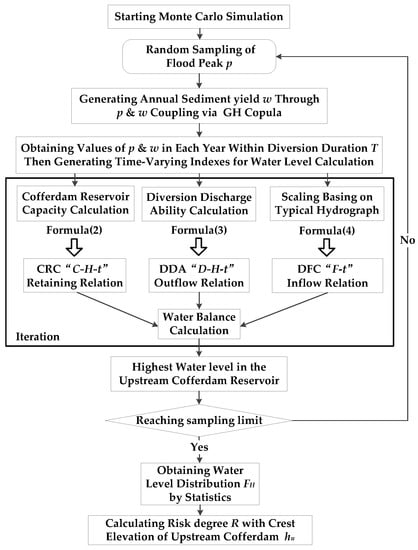
Figure 3.
Working process of the CDR assessment method.
Further descriptions about the method steps are:
- Flood peak p as the flood parameter, is randomly sampled by MCS according to FPDF. The value of p should be resampled in each year within diversion duration T as hydropower developing can span years and simulated parameters are independent in each year.
- Annual sediment yield w as the sediment parameter, is generated by substituting values of p into the GH Copula Function. The GH Copula Function is based on flood and sediment production correlation, and uses FPDF as well as PDF of sediment uncertainty (SPDF) for marginal description of coupled p and w (described in Section 3.2).
- Flood parameter p is used for generating DFC “F-t” within T, which is described in Formula (4), and with p, flood uncertainty is reflected in DFC; sediment parameter w is used for generating sediment yield course “Win-t” (described in Section 3.3), which is the basis for calculation sedimentation volume S, and with w, flood and sediment correlation can be reflected in “S-t”.
- Sediment discharge course “Wout-t” within T, is determined basing on sedimentation calculation considering sediment parameter differences, water level H and DDA at the determination point. Then with “Win-t” and “Wout-t” “S-t” is calculated (described in Section 3.3). “S-t” is used for generating CRC, which is described in Formula (2).
- DDA is generated by discharge calculation, which is described in Formula (3). Since CRC, DDA both relate to “H-t” reaction and determination of “S-t” involves DDA, iteration is adopted here, i.e., using values of CRC, DDA, and water level H at this time point to determine CRC, DDA, and water level H in the next time point.
- Through enough iterations, the highest water level for a pair of simulated p and w can be obtained, which is one element in . With and the cofferdam design crest elevation , the CDR degree is calculated according to Formula (1).
Details about diversion uncertainties, GH Copula Function of sediment and flood coupling, and determination of sedimentation volume are provided in Section 3.2 and Section 3.3.
Notably, the proposed method is applicable to hydropower development and other kinds of in-river construction activities under the nature sediment-rich river conditions that without regulation requirements of flood or sediment. Because the proposed method adopts the uncertainty description of natural flood and sediment production and involves the consideration about flood and sediment correlation, any kind of water/sediment management or regulation requirement may alter these uncertainties or correlation and make the method invalid in reflecting the actual CDR. Hence, in terms of applicable types of hydropower projects, the method is mainly suitable for run-of-river types in natural rivers, and is not suitable for types with additional water/sediment management or regulation requirement like the basin types.
3.2. PDFs of Diversion Uncertainties and the GH Copula Function
3.2.1. Flood Uncertainty
Flood uncertainty is hydrology-based, so its PDF can be extracted from historical hydrologic data. Literatures showed that various distributions were adopted to describe FPDF, like, Lognormal distribution, Logarithmic Pearson III distribution, Pearson III distribution etc. [60]. Among them, Pearson III distribution has been widely adopted in China and received industrial recognition as is suggested by the Chinese code [74]. Hence, this paper chooses Pearson III distribution to describe flood uncertainty and its PDF is shown in Formula (A1) in Appendix A.
3.2.2. Sediment Uncertainty
Since flood and sediment production are correlated, river sediment yield uncertainty can also adopt the Pearson III distribution, and literatures support this view [75,76]. Hence, in this paper, sediment uncertainty also adopts the Pearson III distribution to describe.
3.2.3. Discharge Uncertainty
Discharge uncertainty relates to diversion system itself, i.e., the flow discharge ability uncertainty of the diversion tunnel [20,21]. Literatures showed that discharge uncertainty of tunnels, river bed and sewers can use triangular distribution to describe, and is suggested by the Chinese code [60,77]. Hence, this paper adopts the triangular distribution to describe the discharge uncertainty, which also received industrial recognition in China [74]. The PDF of triangular distribution is in Formula (A3) in Appendix A.
3.2.4. GH Copula Function
The GH Copula Function for p & w coupling is presented in Formula (5).
where, is the marginal distribution function of flood peak p, complying with FPDF. is the marginal distribution function of annual sediment yield w, complying with SPDF. θ is controlled by Kendall correlation coefficient as , is determined by formula (A4) in Appendix A.
3.3. Sedimentation Volume Calculation
3.3.1. General Determination Method
Under the construction diversion condition, sediment accumulation in the cofferdam reservoir changes rapidly with time and can have low or high deposition elevation with large or small volume of sedimentation. Correspondingly, cofferdam reservoir capacity changes along with the time-varying sedimentation volume S in large or small capacity. As the sedimentation will not increase unlimited in the cofferdam reservoir, a max equilibrium sedimentation condition exists, i.e., the possible maximal sedimentation volume in the cofferdam reservoir. Typical conditions of time-varying sedimentation and corresponding cofferdam reservoir capacity are shown in Figure 4.
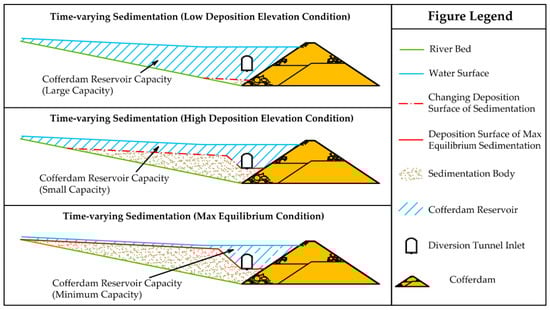
Figure 4.
Conditions of time-varying sedimentation and Cofferdam Reservoir Capacity.
In terms of determining sedimentation volume S at a certain time point, time integration is adopted as Formula (6) basing on the sediment yield relation “Win-t” and sediment discharge relation “Wout-t”. With Formula (6), relation can be determined.
where, Td is a time point within the diversion duration T; is the porosity of sediment; is the density of sediment; is the max volume of sedimentation.
is the possible max volume of sedimentation i.e., the max equilibrium condition. For tunnel based diversion, when the sediment accumulate to its extreme condition, the high flow rate near the tunnel entrance can flush out nearby sediment, while sediment in the further place can accumulate and form a sedimentation body with slopes until a state of equilibrium sedimentation is formed [55]. Generally, the accurate volume of the equilibrium sedimentation is hard to determine, however according to engineering experience the approximate volume can be estimated basing on a typical body shape considering the cofferdam reservoir condition and the tunnel design [55,78]. In this paper, is estimated according to the expert experience based on the typical body shape.
3.3.2. Determination of “Win-t” Considering Sediment and Flood Correlation
Sediment yield course during diversion “Win-t” is determined by scaling the local typical sediment yield course “Y-t” basing on annul sediment yield w in Formula (7). As w is generated by GH Copula basing on p & w coupling, the sediment and flood correlation is reflected.
where, is the relation between “Win-t”, is the weight and time relation of the local typical sediment yield course, is the sum of typical sediment yield in one year.
The typical sediment yield course can be either collected from hydrological stations or generated basing on the typical hydrograph and sediment data [61]. For typical hydrograph based typical sediment yield course, determining the approximate exponential relation between flow sediment-carrying ability and flood volume is crucial [55] as the two parameters are correlated [44]. This approximate exponential relation can be determined basing on statistical sediment yield proportions in flood season and non-flood seasons along with the typical hydrograph, and with the exponential relation “Y-t” can be determined.
3.3.3. Determination of “Wout-t” Considering Sediment Parameter Difference
Sediment discharge course “Wout-t” relates to changing water level H, DDA and flow sediment-transport capacity, “Wout-t” is determined in Formula (8).
where, is the flow sediment-transport capacity; is the relation between “Wout-t”.
As flow sediment-transport capacity generally can adopt empirical formulas or models to determine, and sediment parameters like particle size and load type are the basis for choosing suitable empirical methods, sediment parameter difference should be considered. As a result, different sediment-rich rivers may adopt different sediment-transport determinations. Hence, to facilitate the application of proposed CDR assessment method, this paper presents a reference for sediment-rich river classification, and gives suggested empirical methods for determining of each types of rivers.
The classification reference is in Table 1 and explained in bulleted lists.

Table 1.
River classification reference considering sediment parameter difference.
- Type 1: Sediment-rich rivers that have very fine particle (particle mean diameter less than 0.2 mm) generally are suspended-load dominated like the Yellow River [43]. For this type of sediment-rich rivers, Zhang’s Formula, is suggested for sediment transport calculation as it suits fine particle scenario, and methods like Vain Rijin Model etc., can also be applied [41,55].
- Type 2: Sediment-rich rivers that have small size particle (particle mean diameter between 0.2 mm and 1.0 mm), can have both suspended-load and bed-load, like the Blue Nile River [32]. For this type of sediment-rich rivers, Engelund-Hansen Formula is suggested for sediment transport calculation as it is a total load formula, and methods like Yang’s Model, Ackers–White Formula etc., can also be applied [42].
- Type 3: Sediment-rich rivers that have large size particle like pebble or gravel (particle mean diameter larger than 1.0 mm), generally are bed-load dominated, like some rivers in Nepal [31,53]. For this type of sediment-rich rivers, Meyer–Peter and Müller model is suitable for sediment transport calculation, as it is based on gravel transport experiment [54].
With the reference in Table 1, the sediment parameter difference in particle size and load type can be reflected and coped with in determining “S-t”.
4. Results
To demonstrate the proposed CDR assessment method, a case based on certain hydropower development project on a sediment-rich river is presented.
4.1. Case Profile
The case diversion system has a pair of cut-off earth-rock cofferdams (upstream cofferdam elevation is 645 m), one diversion tunnel, and its diversion service period will span two years. The case river is suspended-load dominated and mainly has fine sediment less than 0.2 mm, its average flood sediment concentration is about 144 kg/m3, the density of sediment is 1300 kg/m3, the porosity of sediment is 0.3. The slope of river channel is 2.47‰. The river runoff and sediment transport all central on flood season (July to October), and the proportions of flood season production is 62% for water and 91% for sediment. The max volume of sedimentation in the cofferdam reservoir is estimated as 5.5 million m3 according to the expert experience based on the typical body shape.
Key parameters for CDR assessment are provided based on diversion design, local hydrology and sediment data. The diversion tunnel design is in Table 2, other are in the supplementary materials as uncertainty parameters about flood and sediment (Table S1), coupling parameters (Table S2), origin cofferdam reservoir storage capacity, in “V-H” relation (Table S3), calculated diversion discharge ability, in “D-H” relation (Table S4), local typical hydrograph, in “G-t” relation (Table S5), local typical sediment yield, in “Y-t” relation (Table S6).
Table 2.
Diversion Tunnel Design.
4.2. Method Choosing for Sediment-Transport Capacity Calculation
As the sediment-rich river of the case is suspended-load dominated and has fine sediment less than 0.2 mm, it can be classified as the Type 1 river in Table 1. Hence, as is suggested for Type 1 rivers, Zhang’s Formula as the method of sediment-transport capacity calculation is adopted in the case, which denotes the sediment carrying capacity of flow. Details about the Zhang’s Formula is explained in Appendix B.
4.3. CDR Assessment Results
With all the data for CDR assessment ready, time-varying CRC, DDA, and DFC can be simulated and the highest water level at the upstream cofferdam in once simulation can be obtained. In this case, 160,000 times of MCSs are conducted, so that the CDR can be well-assessed and the risk feature can be revealed. As the diversion service period spans two years, three possible diversion risk conditions i.e., cofferdam overtopping in the 1st year; cofferdam overtopping in the 2nd year, and safe in all two years may occur. Here, three typical sets of simulated data corresponding to the risk conditions are extracted from the all 160,000 data sets, and are depicted in the Figure 5.
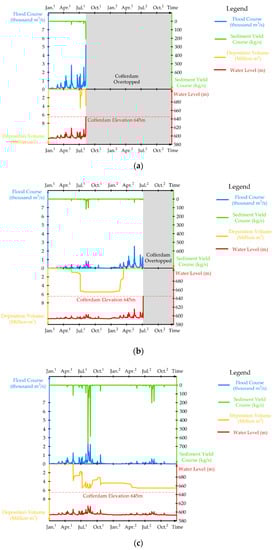
Figure 5.
Diversion Risk Conditions (superscript on time denote the diversion year). (a) Cofferdam overtopping in the 1st year; (b) cofferdam overtopping in the 2nd year; (c) safe diversion in all two years.
In the figure, simulated flood course (“F-t”) and sediment yield course (“Win-t”), deposition condition (“S-t”), and the water level in the cofferdam reservoir during the diversion (“H-t”) are simultaneously shown, thus the risk feature can be analyzed. It is evident that water level both relates to the flood course and the deposition condition, and the sedimentation conditions is related to sediment yield and flood course as well.
In each MCS, a highest water level in one diversion service year was obtained, and with 160,000 times of simulation, the highest cofferdam reservoir water level distribution of each diversion service year can be generated. By substituting objective cofferdam elevation into the water level distribution, corresponding cofferdam overtopping probability can be obtained, i.e., the CDR degree of the objective cofferdam elevation. Here, in all two diversion years, several typical risk degrees and their corresponding cofferdam elevation are presented in Table 3, and as the case adopts the 645 m upstream cofferdam the corresponding CDR degree in each diversion year are also shown.
Table 3.
Construction Diversion Risk assessment results.
It can be seen from the table that the proposed method can assess the CDR for hydropower development on a sediment-rich river, and for the case, the 645 m cofferdam design has a CDR degree of 8.6% in the 1st diversion year and 8.7% in the 2nd diversion year. For different CDR degree reference, the corresponding cofferdam elevations are different in the two diversion years, and generally the 2nd diversion year has higher corresponding elevation than the 1st diversion year. Thus, the CDR results of the case show an irregular increase tendency along with diversion year passes. According to the previous case study [15], construction diversion risk under the sediment-rich diversion environment is higher than its clear-water environment contrast, and no clue shows that diversion risk has evident increase or decrease tendency along with diversion year passes under the clear-water diversion environment. Because, without sediment impact, cofferdam reservoir capacity can be considered as changeless during the whole diversion process, and flood uncertainty mainly control the risk level thus the diversion risk will not change along with time. Hence, the increase tendency of CDR on sediment-rich rivers shown by this case can be considered as the unique feature of construction diversion on sediment-rich rivers, and thus the sediment impact is reflected by the proposed method.
5. Discussion
From case results, it can be interpreted that the proposed CDR assessment method can comply and implement the working hypotheses and fulfill the research goal.
For CDR assessment on sediment-rich rivers, the sediment impact i.e., the sediment deposition in the cofferdam reservoir should be highlighted, the flood and sediment correlation in production should be considered, the diversion uncertainties should be reflected, and the sediment parameter difference should be considered. Thus, the proposed method adopts the GH Copula and the MCS to comply and implement these working hypotheses by simulating coupled flood and sediment production and evolution in a time-varying manner, and adjusting the sediment calculation according to the sediment parameter so as to cope with different river types. As Figure 5a–c shows, the flood and sediment production and sedimentation conditions all change with time, thus the time-varying manner is reflected; the flood course and the sediment yield course in the same diversion year have the same tendency but a different ratio, which reflects the adopting of GH Copula based flood and sediment coupling; for different diversion years, the flood course or the sediment yield course have different scales, which reflects the randomness of MCS; in each diversion year, the sedimentation conditions are different and changes rapidly through time, which expresses the sediment impact; and the overall CDR on sediment-rich rivers is dynamic and shows an irregular increase tendency, which is different from the overall steady CDR on general clear-water rivers. Hence the proposed CDR assessment method can simulate the flood and sediment yield course during diversion on sediment-rich rivers, and highlights the sediment impact on simulation and risk results. As Table 3 shows, the CDR assessment results are obtained and in the relation between risk degrees and corresponding cofferdam elevations, and the CDR degree of 645 m cofferdam elevation is around 8.6% which accords with the general engineering cognition. Hence the proposed method can be considered as achieving the function of CDR assessment on a sediment-rich river.
By analyzing the CDR assessment results, further discussion can be draw on the risk feature of construction diversion under the sediment-rich condition.
Figure 5 shows the three diversion risk conditions, and when analyzing risk conditions of Figure 5a,b, it can be seen that flood and sedimentation together determine the water level, but extreme flood is the main factor that triggers cofferdam overtopping. Because flood peak and sediment yield peak are synchronous, high flood volume can also flush out sediment in the cofferdam reservoir, thus reducing the sedimentation and making the flood influence on water level more evident. Proof of this view can be found in July to August of the 1st diversion year in Figure 5a, and in April to July of the 2nd diversion year in Figure 5b. Meanwhile, when analyzing the safety conditions in Figure 5c, it can be seen that when flood course is relatively small, and the cofferdam reservoir can keep a high sedimentation level for a long time because the sediment outlet is simultaneously small. However, though sedimentation is at a high level, as the flood magnitude is small, the water level still keeps a low level. Proof of this view can be found in November of the 1st diversion year, and December of the 2nd diversion year in Figure 5c. Hence, it can be concluded that in the diversion cofferdam reservoir on sediment-rich rivers, water level changing is still mainly controlled by the flood course, which is consistent with the general clear-water conditions. Moreover, a large magnitude of flood can cause overtopping and reduce sediment impact by flushing out sediment in the cofferdam reservoir, while a small magnitude of flood brings low water level and less sediment output.
Table 3 shows the CDR assessment results, and it can be seen that the CDR of the 2nd diversion year is influenced by the 1st diversion year’s diversion, because under the same CDR degree reference, a higher cofferdam is needed in the 2nd diversion year. This phenomenon can be explained as the sediment impact, because in the end of the 1st diversion year, sedimentation in the cofferdam reservoir can continue to influence the risk condition in the 2nd diversion year. When the CDR degree reference adopts 5.0%, a cofferdam elevation difference of 0.8 m exists (656.92 m to 657.72 m), which is large enough to arouse enough attention in terms of engineering practice and construction safety. Hence, on sediment-rich rivers, because of sediment impact, CDR is dynamic and rises along with diversion year passes, risk differences among the 1st diversion year and the following diversion years should be paid attention to, and CDR assessment in advance is necessary. This finding of dynamic CDR is a distinct risk feature of diversion on sediment-rich rivers, and can bring new considerations to the diversion system design in overall hydropower development. In the current standard mode of project designing, the system risk is normally considered as stable within the whole service time as most existing projects are under the clear-water environment, while this study reveals the dynamic and cumulative effects of sediment impact on risk among diversion years. Thus, to cope with the dynamic CDR and yearly risen corresponding cofferdam elevation demand, designing a higher cofferdam in the first place is suggested as a practical solution.
In summary, through discussion, these points can be concluded:
- The proposed GH Copula and MCS based risk assessment method is feasible, as it can simulate the time-varying diversion indexes under sediment-rich conditions, reflect the flood and sediment correlation, consider the sediment parameter difference, and achieve CDR assessment. Needed data includes only primary hydrology and sediment data and the computation effort is appropriate. Hence, the proposed method is practical, has potential to be applied in future hydropower development on sediment-rich rivers, and contributes to the energy industry.
- On sediment-rich rivers, cofferdam reservoir water level during diversion is determined both by flood and sediment deposition in the cofferdam reservoir. Sediment impact causes a dynamic risk change with the irregular increase tendency during diversion, and the extreme flood can trigger the diversion risk event. The dynamic and increasing CDR on sediment-rich rivers is different from the overall steady CDR on clear-water rivers, and thus CDR assessment before the diversion implementation is necessary.
- For diversion service time that spans years, the CDR degree tends to rise in later diversion years because of sediment impact, and this sediment impact can be evident. Hence, on sediment-rich rivers, division design can adopt the high cofferdam design in the first place or heightening the cofferdam after the first diversion year basing on CDR assessment so as to cope with the yearly-risen CDR.
6. Conclusions
This paper proposes a feasible risk assessment method for construction diversion under the sediment-rich hydropower development environment. The proposed method can give CDR degree results according to the type of the sediment-rich rivers, highlight the sediment impact of deposition, and reflect diversion uncertainties and uncertainty correlation. The method uses code and literature supported PDFs to describe diversion uncertainties, adopts the GH Copula function to couple sediment yield with flood peak for uncertainty correlation reflection, and simulates the flood evolution during diversion through MCS. With flood evolution simulation the method calculates the cofferdam overtopping probability so as to assess the CDR. In the application case, the proposed method achieves CDR assessment on a sediment-rich river, and the sediment impact is highlighted in the case results as sediment deposition can be evident during the diversion and CDR results shows a dynamic and yearly-risen manner that different from clear-water diversion environment. Thus, the method is feasible and effective, because it achieves the CDR assessment goal with appropriate data acquisition and computation effort, and its CDR results is valid as the sediment impact is reflected and risk results accords with general engineering cognition. Through case results discussion, risk features of construction diversion on sediment-rich rivers are revealed: that apart from the extreme flood, the sediment also evidently influences the diversion risk, as CDR is dynamic with time and rises along with diversion year passes. The risk feature indicates that when facing construction diversion on sediment-rich rivers, diversion scheme design with a high cofferdam in the first place or yearly-heightening of the cofferdam based on the advance CDR assessment should be adopted to cope with diversion risk features under the sediment-rich diversion environment.
7. Patents
Chinese invention patent (FMZL), authorized announcement number CN 109137817 B.
Supplementary Materials
The following are available online at https://www.mdpi.com/1996-1073/13/4/938/s1, Table S1: Parameters about Flood and Sediment Uncertainties, Table S2: Parameters for p & w GH Copula Function, Table S3: Origin Cofferdam Reservoir Storage Capacity and Water Level Relation (V-H), Table S4: Calculated Discharge Ability of the Diversion Tunnel (D-H), Table S5: Local Typical Hydrograph (G-t), Table S6: Local Typical Sediment Yield Course (Y-t).
Author Contributions
Conceptualization, Z.S., Q.L. and Z.H.; methodology, Z.S., Q.L. and Z.H.; software, Q.L.; validation, Z.S., Q.L. and Z.H.; resources, C.Z., J.R., Z.W., J.T.; writing—original draft preparation, Z.S.; writing—review and editing, Q.L., Z.H.; visualization, Z.S., Q.L.; supervision, Z.H.; funding acquisition, Z.H., Q.L. All authors have read and agreed to the published version of the manuscript.
Funding
This research was funded by the National Natural Science Foundation of China, grant number 51779195 and 51379164.
Acknowledgments
The assistances from the Yellow River Engineering Consulting Co., Ltd. are gratefully acknowledged.
Conflicts of Interest
The authors declare no conflict of interest.
Notation List
CDR: construction diversion risk
DFC: diversion flood course
DDA: diversion discharge ability
CRC: cofferdam reservoir capacity
PDF: probability density function
GH: Gumbel-Hougaard
MCS: Monte Carlo simulation
R: construction diversion risk degree
: designed crest elevation of the upstream cofferdam
V: origin storage capacity presents in volume
H: water level
t: time
C: working cofferdam reservoir capacity
S: sedimentation volume
D: diversion discharge ability
F: flood volume
: elevation of tunnel outlet base
T: diversion duration
G: volume within the typical hydrograph
p: flood peak
w: annual sediment yield
Win: sediment yield
Wout: sediment discharge
: possible highest water level distribution of upstream cofferdam reservoir
: probability of within
: PDF of discharge uncertainty
: PDF of flood uncertainty
: formula determines CRC
: formula determines DDA
: formula determines DFC
: GH Copula function
: formula determines Win
: formula determines Wout
: marginal distribution function of flood peak p, complying with FPDF
: marginal distribution function of annual sediment yield w, complying with SPDF
: relation between “V-H”
: relation between “S-t”
: relation between “H-t”
: relation between “D-H”
: flood volume and time relation of the typical hydrograph
: weight and time relation of the local typical sediment yield course
: relation among “C-H-t”
: relation among “D-H-t”
: relation between “F-t”
: relation between “Win-t”
: relation between “Wout-t”
: discharge coefficient
A: section area of the diversion tunnel
: gravitational acceleration
i: gradient of the tunnel
L: length of the tunnel
: Kendall correlation coefficient
: porosity of sediment
: density of sediment
: max volume of sedimentation
: max volume within the typical hydrograph
: sum of typical sediment yield in one year
: flow sediment-transport capacity
Appendix A
Appendix A.1. PDF of Pearson III Distribution
The PDF of Pearson III distribution is in Formula (A1).
where, x is the value of random variable that obeys Pearson III distribution; Γ(α) is the Gamma function of α; α, β, are the distribution parameters of the Pearson III distribution, and they are determined in Formula (A2);
where, , , are the coefficient of deviation, the coefficient of variation and the mean value respectively, which are determined by local hydrologic data.
Appendix A.2. PDF of Triangular Distribution
The PDF of triangular distribution is in Formula (A3).
Here, D is the discharge volume of the diversion outlet building; a, b, c are the lower limit, upper limit and mode of the diversion discharge ability respectively. The value of a, b, c can be determined by design parameters of the diversion outlet building.
for the GH Copula Function is determined in Formula (A4).
where, is the combinatorial number of 2 variables with a length of k, , , , is the sample data of flood peak and sediment yield peak; is the sign function.
Appendix B
The fitted form of Zhang’s Formula [51,79] is used in the paper, which is in Formula (A5).
where, is the critical sediment concentration of flow; adopts the flow approach velocity near the diversion tunnel entrance; is the hydraulic radius of the objective river section; is the settling velocity of fine sediment particle, which can be determined by the Stokes formula [51]:
where, is the density of sediment; is the density of water and sediment mixture; is the kinematic viscosity of water; is the mean diameter of the sediment particle.
The flow approach velocity near the diversion tunnel entrance is related to the ability of diversion tunnel discharge and is obtained as follows:
where, is the coefficient that describes the proportion between tunnel entrance approach velocity and tunnel discharge velocity. is the discharge volume of one diversion tunnel which is determined basing on DDA.
References
- Farfan, J.; Breyer, C. Structural changes of global power generation capacity towards sustainability and the risk of stranded investments supported by a sustainability indicator. J. Clean. Prod. 2017, 141, 370–384. [Google Scholar] [CrossRef]
- Gils, H.; Simon, S.; Soria, R. 100% Renewable Energy Supply for Brazil—The Role of Sector Coupling and Regional Development. Energies 2017, 10, 1859. [Google Scholar] [CrossRef]
- Operacz, A. The term effective hydropower potential based on sustainable development—An initial case study of the Raba river in Poland. Renew. Sustain. Energy Rev. 2017, 75, 1453–1463. [Google Scholar] [CrossRef]
- Härtel, P.; Korpås, M. Aggregation Methods for Modelling Hydropower and Its Implications for a Highly Decarbonised Energy System in Europe. Energies 2017, 10, 1841. [Google Scholar] [CrossRef]
- Bakken, T.H.; Killingtveit, Å.; Alfredsen, K. The Water Footprint of Hydropower Production-State of the Art and Methodological Challenges. Glob. Chall. 2017, 1, 1600018. [Google Scholar] [CrossRef] [PubMed]
- Wang, X.; Mei, Y.; Cai, H.; Cong, X. A New Fluctuation Index: Characteristics and Application to Hydro-Wind Systems. Energies 2016, 9, 114. [Google Scholar] [CrossRef]
- Graabak, I.; Jaehnert, S.; Korpås, M.; Mo, B. Norway as a Battery for the Future European Power System—Impacts on the Hydropower System. Energies 2017, 10, 2054. [Google Scholar] [CrossRef]
- Bain, D.; Acker, T. Hydropower Impacts on Electrical System Production Costs in the Southwest United States. Energies 2018, 11, 368. [Google Scholar] [CrossRef]
- Zarfl, C.; Lumsdon, A.E.; Berlekamp, J.; Tydecks, L.; Tockner, K. A global boom in hydropower dam construction. Aquat. Sci. 2015, 77, 161–170. [Google Scholar] [CrossRef]
- Zhou, H.; Pan, Z.; Liang, Z.; Zhao, C.; Zhou, Y.; Wang, F. Temperature Field Reconstruction of Concrete Dams based on Distributed Optical Fiber Monitoring Data. KSCE J. Civ. Eng. 2019, 23, 1911–1922. [Google Scholar] [CrossRef]
- Operacz, A.; Tomaszewska, B. The review of Polish formal and legal aspects related to hydropower plants. Environ. Sci. Pollut. Res. 2016, 23, 18953–18959. [Google Scholar] [CrossRef] [PubMed]
- Operacz, A.; Grahl-Madsen, M. Program of hydropower potential assessment as an effective possibilities in Upper Vistula water region in Poland. Acta Sci. Pol. Form. Circumiectus 2018, 4, 157–172. [Google Scholar] [CrossRef]
- Afshar, A.; Barkhordary, A.; Marino, M.A. Optimizing River Diversion under Hydraulic and Hydrologic Uncertainties. J. Water Resour. Plan. Manag. 1994, 120, 36–47. [Google Scholar] [CrossRef]
- Dai, H.C.; Cao, G.J.; Su, H.Z. Management and construction of the Three Gorges Project. J. Constr. Eng. Manag. 2006, 132, 615–619. [Google Scholar] [CrossRef]
- Song, Z.D.; Liu, Q.; Hu, Z.G.; Li, H.A.; Xiong, J.Q. Assessment of Sediment Impact on the Risk of River Diversion during Dam Construction: A Simulation-Based Project Study on the Jing River, China. Water 2018, 10, 217. [Google Scholar] [CrossRef]
- Liu, D.; Hu, Z.; Guo, W. Multi-Attribute Group-Decision on a Construction Diversion Scheme for Hydropower Projects Based on Perception Utility. Energies 2018, 11, 3027. [Google Scholar] [CrossRef]
- Karamouz, M.; Doroudi, S.; Ahmadi, A.; Moridi, A. Optimal Design of Water Diversion System: A Case Study. In Proceedings of the World Environmental and Water Resources Congress, Kansas City, MO, USA, 17–21 May 2009; pp. 1–10. [Google Scholar]
- Hu, Z.; Liu, Q.; He, C.; Xiao, H.; Zhou, Y.; Fu, Z.; Li, D. Multi-objective Risk Model of Optimal River Diversion Standards During Initial Stage Construction for Hydroelectric Project. Eng. Sci. 2001, 3, 58–63. [Google Scholar] [CrossRef]
- Rasekh, A.; Afshar, A.; Afshar, M.H. Risk-Cost Optimization of Hydraulic Structures: Methodology and Case Study. Water Resour. Manag. 2010, 24, 2833–2851. [Google Scholar] [CrossRef]
- Afshar, A.; Rasekh, A.; Afshar, M.H. Risk-based optimization of large flood-diversion systems using genetic algorithms. Eng. Optim. 2009, 41, 259–273. [Google Scholar] [CrossRef]
- Hu, Z.; Fan, X.-E.; Liu, Q.; Huang, H. Design of integrated risk distribution mechanism of construction diversion system. J. Hydraul. Eng. 2006, 37, 1270–1277. [Google Scholar] [CrossRef]
- Yang, M.; Qian, X.; Zhang, Y.; Sheng, J.; Shen, D.; Ge, Y. Spatial multicriteria decision analysis of flood risks in aging-dam management in China: A framework and case study. Int. J. Environ. Res. Public Health 2011, 8, 1368–1387. [Google Scholar] [CrossRef] [PubMed]
- Patsialis, T.; Kougias, I.; Kazakis, N.; Theodossiou, N.; Droege, P. Supporting Renewables’ Penetration in Remote Areas through the Transformation of Non-Powered Dams. Energies 2016, 9, 1054. [Google Scholar] [CrossRef]
- Pohl, M. Bringing down our dams: Trends in American dam removal rationales. J. Am. Water Resour. Assoc. 2002, 38, 1511–1519. [Google Scholar] [CrossRef]
- Bureau of Reclamation, U.S. Design of Small Dams; U.S. Dept. of the Interior, Bureau of Reclamation: Washington, DC, USA, 1987.
- Marengo, H.H.; Arreguin, F.I.; Aldama, A.A.; Morales, V. Case study: Risk analysis by overtopping of diversion works during dam construction: The La Yesca hydroelectric project, Mexico. Struct. Saf. 2013, 42, 26–34. [Google Scholar] [CrossRef]
- Quan, L.; Zhigen, H.; Zhijian, Q.; Rui, M. Risk Feature Analysis of River Diversion for Dam Reconstruction on the Original Site. Adv. Eng. Sci. 2017, 49, 35–41. [Google Scholar] [CrossRef]
- Sedighizadeh, S.; Mansoori, A.; Pirestani, M.R.; Sedighizadeh, D. A new model for economic optimization of water diversion system during dam construction using PSO algorithm. World Acad. Sci. Eng. Technol. 2011, 51, 992–999. [Google Scholar]
- Song, Z.; Liu, Q.; Hu, Z. Decision-Making Framework, Enhanced by Mutual Inspection for First-Stage Dam Construction Diversion Scheme Selection. Water Resour. Manag. 2020, 34, 563–577. [Google Scholar] [CrossRef]
- Bai, Y.C.; Xu, H.J. Hydrodynamic instability of hyperconcentrated flows of the Yellow River. J. Hydraul. Res. 2010, 48, 742–753. [Google Scholar] [CrossRef]
- Bhusal, J.K. Flow characteristic and sediment deposition at mountain plain junction of lothar river in nepal. In Proceedings of the International Symposium on River Sedimentation, Yichang, China, 18–21 October 2004; pp. 908–911. [Google Scholar]
- Billi, P.; Ali, O.E.B. Sediment transport of the Blue Nile at Khartoum. Quat. Int. 2010, 226, 12–22. [Google Scholar] [CrossRef]
- Islam, G.M.T.; Jaman, S.T. Modelling sediment loads in the Lower Ganges, Bangladesh. Water Manag. 2006, 159, 87–94. [Google Scholar] [CrossRef]
- Kostaschuk, R.A.; Stephan, B.A.; Luternauer, J.L. Suspended sediment concentration in a buoyant plume: Fraser River, Canada. Geo-Mar. Lett. 1993, 13, 165–171. [Google Scholar] [CrossRef]
- Kusimi, J.M.; Amisigo, B.A.; Banoeng-Yakubo, B.K. Sediment yield of a forest river basin in Ghana. Catena 2014, 123, 225–235. [Google Scholar] [CrossRef]
- Ogino, K.; Nakayama, M.; Sasaki, D. Domestic Socioeconomic Barriers to Hydropower Trading: Evidence from Bhutan and Nepal. Sustainability 2019, 11, 2062. [Google Scholar] [CrossRef]
- Bishwakarma, M.B.; Stole, H. Real-time sediment monitoring in hydropower plants. J. Hydraul. Res. 2008, 46, 282–288. [Google Scholar] [CrossRef]
- Chang, J.X.; Meng, X.J.; Wang, Z.Z.; Wang, X.B.; Huang, Q. Optimized cascade reservoir operation considering ice flood control and power generation. J. Hydrol. 2014, 519, 1042–1051. [Google Scholar] [CrossRef]
- Bartle, A. Hydropower potential and development activities. Energy Policy 2002, 30, 1231–1239. [Google Scholar] [CrossRef]
- Schleiss, A.; Franca, M.; Juez, C.; De Cesare, G. Reservoir sedimentation. J. Hydraul. Res. 2016, 54, 1–20. [Google Scholar] [CrossRef]
- Den Berg, J.H.V.; Van Gelder, A. Prediction of suspended bed material transport in flows over silt and very fine sand. Water Resour. Res. 1993, 29, 1393–1404. [Google Scholar] [CrossRef]
- Yang, C.T.; Wan, S.G. Comparisons of Selected Bed-Material Load Formulas. J. Hydraul. Eng. 1991, 117, 973–989. [Google Scholar] [CrossRef]
- He, L.; Duan, J.G.; Wang, G.Q.; Fu, X.D. Numerical Simulation of Unsteady Hyperconcentrated Sediment-Laden Flow in the Yellow River. J. Hydraul. Eng. 2012, 138, 958–969. [Google Scholar] [CrossRef]
- Peng, Y.; Ji, C.M.; Gu, R. A Multi-Objective Optimization Model for Coordinated Regulation of Flow and Sediment in Cascade Reservoirs. Water Resour. Manag. 2014, 28, 4019–4033. [Google Scholar] [CrossRef]
- Turowski, J.M.; Rickenmann, D.; Dadson, S. The partitioning of the total sediment load of a river into suspended load and bedload: A review of empirical data. Sedimentology 2010, 57, 1126–1146. [Google Scholar] [CrossRef]
- Khosronejad, A.; Rennie, C.D.; Neyshabouri, A.A.S.; Gholami, I. Three-dimensional numerical modeling of reservoir sediment release. J. Hydraul. Res. 2008, 46, 209–223. [Google Scholar] [CrossRef]
- Shen, H.W.; Hung, C.S. Remodified Einstein Procedure for Sediment Load. J. Hydraul. Eng. 1983, 109, 565–578. [Google Scholar] [CrossRef]
- Castillo, L.G.; Carrillo, J.M.; Alvarez, M.A. Complementary Methods for Determining the Sedimentation and Flushing in a Reservoir. J. Hydraul. Eng. 2015, 141, 05015004. [Google Scholar] [CrossRef]
- East, A.E.; Pess, G.R.; Bountry, J.A.; Magirl, C.S.; Ritchie, A.C.; Logan, J.B.; Randle, T.J.; Mastin, M.C.; Minear, J.T.; Duda, J.J.; et al. Large-scale dam removal on the Elwha River, Washington, USA: River channel and floodplain geomorphic change. Geomorphology 2015, 228, 765–786. [Google Scholar] [CrossRef]
- Cui, Y.; Parker, G. Numerical Model of Sediment Pulses and Sediment-Supply Disturbances in Mountain Rivers. J. Hydraul. Eng. 2005, 131, 646–656. [Google Scholar] [CrossRef]
- Wu, W. Computational River Dynamics; Taylor & Francis: London, UK, 2008; p. 494. [Google Scholar]
- Zhang, J.-X.; Liu, H. A Vertical 2-D Numerical Simulation of Suspended Sediment Transport. J. Hydrodyn. 2007, 19, 217–224. [Google Scholar] [CrossRef]
- Liu, B.; Yang, L.; Hongliang, X.U.; Zhang, Z.; Dai, C.; Zhan, Y. Experiment on water diversion and sediment prevention of Nepal Upper Madi Hydroelectric Station. Eng. J. Wuhan Univ. 2014, 184, 156–159. [Google Scholar] [CrossRef]
- Meyer-Perter, E.; Müller, R. Formulas for bed-load transport. In Proceedings of the IAHSR 2nd Meeting, Stockholm, Sweden, 7–9 June 1948; pp. 19–64. [Google Scholar]
- Zhang, R.; Xie, J. Sedimentation Research in China: Systematic Selections; Water and Power Press: Beijing, China, 1993. [Google Scholar]
- ISO. ISO 31000: 2009 Risk Management—Principles and Guidelines; ISO: Geneva, Switzerland, 2009. [Google Scholar]
- Bozorg-Haddad, O.; Orouji, H.; Mohammad-Azari, S.; Loáiciga, H.A.; Marino, M.A. Construction Risk Management of Irrigation Dams. J. Irrig. Drain. Eng. 2016, 142, 04016009. [Google Scholar] [CrossRef]
- Marengo, H. Case study: Dam safety during construction, lessons of the overtopping diversion works at Aguamilpa Dam. J. Hydraul. Eng. 2006, 132, 1121–1127. [Google Scholar] [CrossRef]
- Hu, Z.; Liu, Q.; Chen, Z.; Fan, X.-E. Risk Analysis of Construction Diversion; Science Press: Beijing, China, 2010. [Google Scholar]
- Tung, Y.K.; Yen, B.C.; Melching, C.S. Hydrosystems Engineering Reliability Assessment and Risk Analysis; McGraw-Hill: New York, NY, USA, 2006. [Google Scholar]
- Rosen, T.; Xu, Y.J. A Hydrograph-Based Sediment Availability Assessment: Implications for Mississippi River Sediment Diversion. Water 2014, 6, 564–583. [Google Scholar] [CrossRef]
- Azam, M.; Maeng, S.; Kim, H.; Murtazaev, A. Copula-Based Stochastic Simulation for Regional Drought Risk Assessment in South Korea. Water 2018, 10, 359. [Google Scholar] [CrossRef]
- Zhang, X.; Hu, H. Copula-Based Hazard Risk Assessment of Winter Extreme Cold Events in Beijing. Atmosphere 2018, 9, 263. [Google Scholar] [CrossRef]
- Lian, L.; Shu, L.; Chunju, Z.; Yihong, Z. Mid-term Diversion Risk Prediction from the Correlation between the Flood Peak and Volume during High Rockfill Dam Construction. Eng. Lett. 2019, 27, 593–600. [Google Scholar]
- Xu, Y.; Huang, G.; Fan, Y. Multivariate flood risk analysis for Wei River. Stoch. Environ. Res. Risk Assess. 2015, 31, 1–18. [Google Scholar] [CrossRef]
- Nelsen, B. An Introduction to Copulas, 2nd ed.; Springer: New York, NY, USA, 2006; p. 315. [Google Scholar]
- Diermanse, F.L.M.; Bruijn, K.M.D.; Beckers, J.V.L.; Kramer, N.L. Importance sampling for efficient modelling of hydraulic loads in the Rhine–Meuse delta. Stoch. Environ. Res. Risk Assess. 2015, 29, 637–652. [Google Scholar] [CrossRef]
- Kwon, H.H.; Moon, Y.I. Improvement of overtopping risk evaluations using probabilistic concepts for existing dams. Stoch. Environ. Res. Risk Assess. 2006, 20, 223–237. [Google Scholar] [CrossRef]
- Loveridge, M.; Rahman, A. Quantifying uncertainty in rainfall—Runoff models due to design losses using Monte Carlo simulation: A case study in New South Wales, Australia. Stoch. Environ. Res. Risk Assess. 2014, 28, 2149–2159. [Google Scholar] [CrossRef]
- Yu, J.J.; Qin, X.S.; Larsen, O. Joint Monte Carlo and possibilistic simulation for flood damage assessment. Stoch. Environ. Res. Risk Assess. 2013, 27, 725–735. [Google Scholar] [CrossRef]
- Guo, S.; Chen, J.; Li, Y.; Liu, P.; Li, T. Joint Operation of the Multi-Reservoir System of the Three Gorges and the Qingjiang Cascade Reservoirs. Energies 2011, 4, 1036–1050. [Google Scholar] [CrossRef]
- Heinemarm, H.G. A new sediment trap efficiency curve for small reservoirs. J. Am. Water Resour. Assoc. 1981, 17, 825–830. [Google Scholar] [CrossRef]
- Condé, R.; Martinez, J.-M.; Pessotto, M.; Villar, R.; Cochonneau, G.; Henry, R.; Lopes, W.; Nogueira, M. Indirect Assessment of Sedimentation in Hydropower Dams Using MODIS Remote Sensing Images. Remote Sens. 2019, 11, 314. [Google Scholar] [CrossRef]
- Ministry of Water Resources, P.R.C. SL 303-2017 Specifications for Construction Planning of Water Resources and Hydropower Projects; Water&Power Press: Beijing, China, 2017. [Google Scholar]
- Jin, X.; Hao, Z.C.; Zhang, J.L. Study on the relation of frequency between flood and sediment in the Middle Yellow River. J. Sediment Res. 2006, 7, 6–13. [Google Scholar] [CrossRef]
- Li, X.G.; Wei, X. Analysis of the Relationship between Soil Erosion Risk and Surplus Floodwater during Flood Season. J. Hydrol. Eng. 2014, 19, 1294–1311. [Google Scholar] [CrossRef]
- Nakhaei, N.; Etemad-Shahidi, A. Applying Monte Carlo and classification tree sensitivity analysis to the Zayandehrood River. J. Hydroinform. 2012, 14, 236–250. [Google Scholar] [CrossRef]
- Zhang, J.Y. Sediment Design of Water Conservancy and Hydropower Projects; Water and Power Press: Beijing, China, 2010; p. 362. [Google Scholar]
- Guo, J. Logarithmic matching and its applications in computational hydraulics and sediment transport. J. Hydraul. Res. 2002, 40, 555–565. [Google Scholar] [CrossRef]
© 2020 by the authors. Licensee MDPI, Basel, Switzerland. This article is an open access article distributed under the terms and conditions of the Creative Commons Attribution (CC BY) license (http://creativecommons.org/licenses/by/4.0/).