Abstract
In this paper, a model-based tuning method for a PID controller of excitation systems based on a simplified model that considers measurement delay is proposed. The conventional model-based tuning method, which has been studied previously, uses a simplified excitation system model that ignores all the delay components. However, since the rms voltage measurement can take hundreds of milliseconds to calculate depending on the system settings, this delay cannot be ignored when the required response needs to be as fast as the measurement delay. Furthermore, the linearity of the measurement method is not taken into account because the measurement delay has already been ignored. Therefore, in this paper, a simplified model that considers measurement delay and its linearity is proposed, and a model-based tuning method of PID controllers for two kinds of excitation systems is proposed and compared with the conventional method by analysis. To verify the analysis and proposed tuning method, experiments are conducted for both excitation systems.
1. Introduction
The excitation system of a synchronous generator is set to adjust the output voltage of the generator easily by controlling the field flux. However, operators spend much time tuning the Auto Voltage Regulator (AVR) systems of these generators, which are connected to the exciter, since the output voltage of the generators has to meet many requirements. Tuning an AVR properly with the PID controller can be challenging for those not familiar with excitation systems for generators or AVRs using PID controllers. Therefore, the auto-tuning method for the PID controller and self-commissioning excitation system have been studied with a view toward reducing processing time and effort. Since modeling these excitation systems and tuning the PID controller based on the results is a key technique for enhancing auto-tuning methods, a precise analysis is needed to obtain the required voltage response.
A simple method for tuning PID controllers in excitation systems with an AC exciter was investigated in [1]. In this previous research, the complicated, non-linear excitation system was simplified using compensation methods and modified to a simple linear system. Based on this simplified model, each value of the gains for the PID controller were determined based on pole-zero cancellation or pole placement methods using the parameters of the generator and exciter. Based on the aforementioned tuning method and simplified model, self-commissioning [2], as well as PID controller auto-tuning methods have also been studied [3,4]. However, the experimental results from those studies were different from the simulation or analysis in some cases since the model was oversimplified and the delay components in the excitation system were ignored. In [5], most of the delay components in the excitation system were approximated and taken into account for the stability analysis. However, since all the delay components were represented as corresponding time delay functions, the stability was inaccurate, and controller design consideration based on this model was too complicated. In [6], only the measurement delay, which had the longest delay period, from [5] was considered for generator parameter estimation, stability analysis, and PID controller tuning based on pole-zero cancellation in a static excitation system. The differences between experiment and analysis were somewhat improved in this study; however, the stable region was still incorrect, and also, the non-minimum phase zero from the approximation was included in the delay model. However, this is not a factor in the real measurement delay. The cause of these problems is that the delay model has too many approximations; measurement delay is approximated using a time delay function, and this time delay function is also approximated using Pade approximation for use in a pole-zero cancellation-based tuning method.
In this paper, a tuning method that considers measurement delay without the aforementioned approximations is proposed and analyzed. Furthermore, the implementation of the self-commissioning and model-based tuning of a PID controller based on the modified model is presented.
2. Simplified Models of the Excitation Systems
Figure 1 and Figure 2 show the two types of general excitation systems for synchronous generators. The general configuration of both types is very similar. PT (Power Transformer) and CTs (Current Transformers) are used to measure phase voltage and current, respectively, while a buck converter is used as a regulator. To supply voltage to the regulator, a diode rectifier is used to handle both internal (AC) and external (AC or DC) sources. The main difference between the two excitation systems is the existence of an AC exciter. The AC exciter is used to supply electric power to the generator field using a much smaller amount of electric power. Therefore, the excitation system with an AC exciter, shown in Figure 2, can lower the power rating of the voltage regulator, but with this, the voltage response during load variation can become sluggish due to the delay component introduced because the AC exciter is a generator in itself. If there is no AC exciter, as shown in Figure 1, the regulator can easily control the output voltage since the system order is reduced and the output current of the buck converter directly affects the magnitude of the phase.
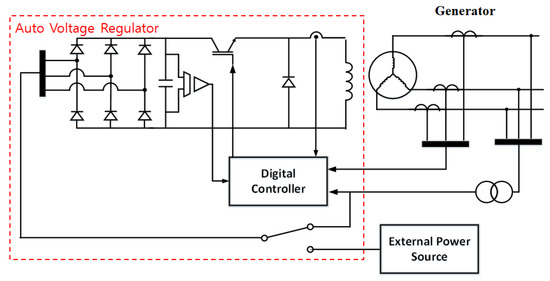
Figure 1.
Configuration of the static excitation system.
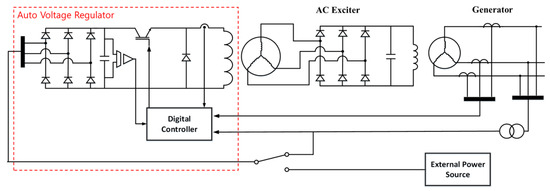
Figure 2.
Configuration of the excitation system with the AC exciter.
Based on the configuration in Figure 1 and Figure 2, the block diagram of a general excitation system can be expressed as in Figure 3, where and represent the reference and measured rmsvoltage, respectively, is the terminal voltage of generator, is the residual voltage, and are the reference and actual output voltage of the regulator, is the DC-link voltage, d is the duty ratio of the regulator, is the gain of the transformer, and are gains, and are the time constants for the AC exciter and generator, and , , and are the PID gains for the controller. The red dashed block represents the auto voltage regulator, the values and functions of which can be altered by software. The reference voltage of the regulator is given as a line-to-line rms voltage, and, therefore rms value measurement is needed for closed-loop control. Furthermore, both the external power source or output of the generator can be chosen as the power source for the buck converter in the regulator. Even though the voltage level and characteristics differ by the kind of power source, this does not affect the total system behavior since the PWM conversion block compensates for those characteristics based on the DC-link voltage measured by the voltage sensor, as shown in Figure 1 and Figure 2. Since the generator in both systems has residual flux in the field, the initial voltage from this residual flux is added to the output voltage.
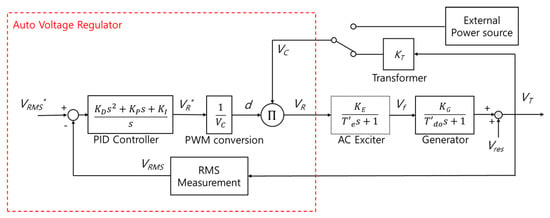
In the case of static excitation systems (the configuration shown in Figure 1), there is no transfer function for the AC exciter (the dashed block in Figure 3), but the rest of the blocks are the same.
However, the system diagram shown in Figure 3 is too complicated to be able to analyze the excitation system properly or optimally tune the PID controller gains because of its non-linearity. Therefore, the given block diagram should be simplified considering only system blocks that have a dominant affect on the overall excitation system. In this section, the simplified models from previous papers are reviewed and the proposed model with its system modifications is presented.
2.1. Conventional Simplified Model
As mentioned above, the PWM conversion compensates for output voltage variations of the buck converter. Therefore, the output regulator voltage reference () can be replaced by (), eliminating the voltage feedback loop and PWM conversion block. Furthermore, in this simplification, the rms voltage measurement is assumed to be so fast that it can be neglected. Based on the compensated and neglected components shown in Figure 4, the open-loop transfer function of the simplified model can be expressed as in Equation (1).
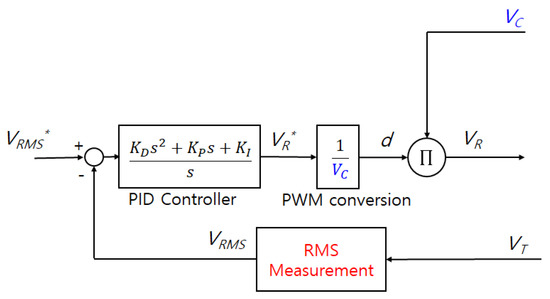
Figure 4.
Compensated and neglected components of the excitation system for simplification.
In this case, the loop gain is determined not only by the gains of the PID controller, but also by the open-loop gains for the AC exciter and generator models. Since the loop gain should be determined only by the PID controller in order for the tuning method to remain feasible, the rms voltage error should be divided by the product of gains from the AC exciter and generator, as shown in Figure 5, while the open-loop transfer function of the excitation system can be altered as in Equation (2), and Figure 6 shows the simplified block diagram of the excitation system.

Figure 5.
Loop gain compensation for the excitation system with the AC exciter.

Figure 6.
The block diagram of the simplified excitation system [1].
If there is no AC exciter in the excitation system, the static excitation system, open-loop gain compensation, and its transfer function can be simply expressed as in Equation (3).
Then, the block diagram of this excitation system would be as in Figure 6 (without an AC exciter block).
2.2. Simplified Model with Approximated Measurement Delay
In order to measure the line-to-line rms voltage, a moving rms technique is generally used, and it can be implemented using Equation (4).
According to Equation (4), the moving rms is nothing but the square-root of the moving average of the square of the input, which in this case is the line-to-line terminal voltage of the generator. Since the moving rms is mainly based on the moving average, its basic characteristics are the same.
Figure 7 shows the block diagram of the moving rms and its operation. Since the square value of the utility frequency is the input of the moving average, the frequency of the input of the moving average is twice that of the utility frequency, while the mean value of the input is the square of the moving rms since the rms value is the average value of a half cycle of the generator’s line-to-line voltage. To get a stable average value for the input, the gain of the input frequency has to have a very low value.
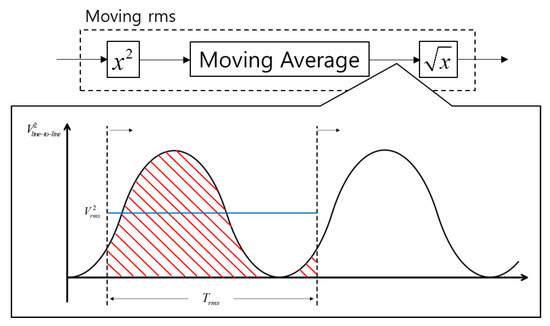
Figure 7.
Block diagram of the moving rms and its operation.
Figure 8 shows the Bode plot of the moving average when the moving average period was set to 0.1 s. As shown in this figure, the gains for the periods, which were multiples of the measurement period of the moving average, had very low values. Therefore, if the measurement period of the moving average were set to one of the multiple values of half of the period of the utility frequency, most rms voltage ripple caused by utility frequency could be eliminated. Generally, tens of times the period of the utility frequency were used for the moving average period in order to suppress rms voltage ripple from other causes such as noise or offset value from a sensor.
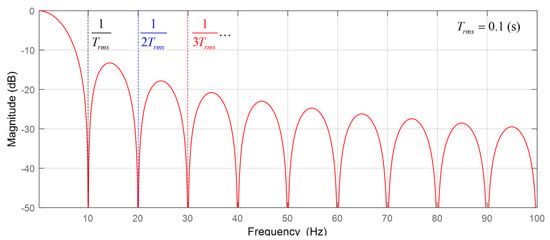
Figure 8.
Bode plot of the moving average with a period of 0.1 s.
However, even though the period of the moving average was set by considering generator operation, there was a certain period of time that it took to reach the real rms value after the rms value changed.
Figure 9 shows the input and output of the moving average block in Figure 7 when the magnitude of the line voltage was rapidly changed. In this case, the moving average period was set to 1.5 times that of the period of the utility frequency. As shown in the figure, it took time for the measured value to reach the real value, and the time taken was the same as the set moving average period. As mentioned earlier, the moving average period was generally set to tens of times the period of the utility frequency, which was hundreds of milliseconds, and this measurement delay should be taken into account since it was not negligible.
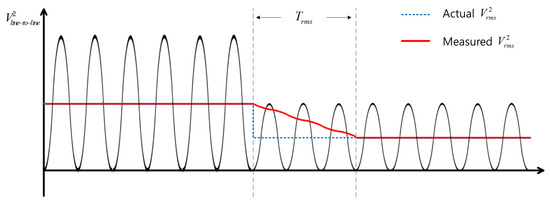
Figure 9.
Response of the moving average to a moving rms when the magnitude of the phase voltage is rapidly changed.
Since the Bode plot for moving average was certainly not linear, in [6], the transfer function of the measurement delay was approximated as shown in Figure 10 based on the measurement period and linearized using Pade approximation. However, this type of model approximation was not accurate enough and could not represent the transient characteristics of real measurement delay. Furthermore, the model-based tuning method based on this model could not be trusted because a pole-zero cancellation method should not be performed with a Pade approximation-based model [7].

Figure 10.
The block diagram of simplified excitation system with approximated measurement delay [6].
2.3. Proposed Simplified Model with Linear Measurement Delay
Although voltage measurement using the moving rms, whose block diagram is shown in Figure 11a, can suppress the voltage ripple from the utility frequency component very well, it cannot be expressed as a linear function, and if the period is very long, it requires too much data storage capacity to get a stable rms value since it does not have a reclusive form.
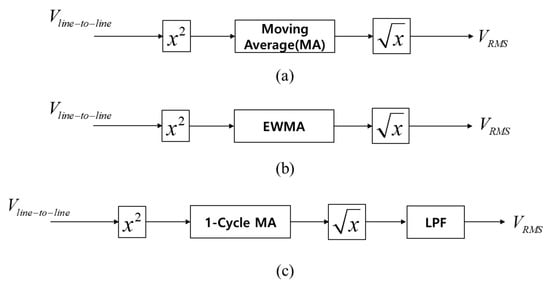
Figure 11.
Block diagrams for rms measurement methods. (a) Moving rms with the moving average, (b) moving rms with Exponentially Weighted Moving Average (EWMA), and (c) proposed rms measurement method.
The Exponentially Weighted Moving Average (EWMA) can replace the moving average of the moving rms to give a reclusive form, as shown in Figure 11b. However, the suppression capability of the voltage ripple from the utility frequency component is not as good as using the moving average. This is because the EWMV has the same capability as the first-order low-pass filter shown in Figure 12, and yet, the transfer function of the measurement still cannot be a linear function because of the square and square-root functions used before and after EWMV.
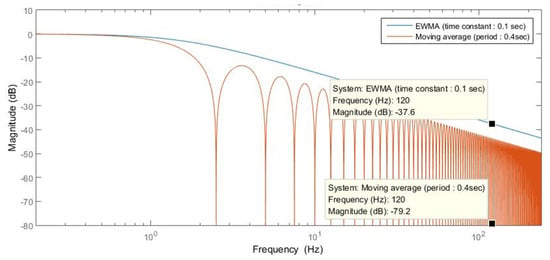
Figure 12.
Frequency response comparison between the moving average and EWMA when the utility frequency is 60 Hz.
In this paper, another way to measure rms was used, and we used a conventional moving rms for just one line voltage cycle, 0.016 s at 60 Hz, and connected to the low-pass filter directly as shown in Figure 11c. In this case, not much memory storage was required since it only needed one cycle of moving rms, and then, the low-pass filter was implemented recursively. Furthermore, the suppression capability of the voltage ripple from the utility frequency component was inherited, and more importantly, the model for measurement delay could be approximated as if only a low-pass filter was used since the response of the moving rms was much faster than the low-pass filter.
Figure 13 shows the step response of the aforementioned three measurement methods when the voltage magnitude was rapidly changed using the step function. In this figure, the period of the moving average was set to four times the time constant of the low-pass filter and considered the settling time for a fair comparison. The conventional moving rms and EWMA-based moving rms did not have the same transient response as the ideal low-pass filter, while the proposed measurement method had almost the same response. Furthermore, as mentioned earlier, only the EWMA-based rms measurement method experienced ripple voltage in the steady-state, even though the characteristics of the EWMA and low-pass filter were the same. This shows clearly that only the proposed measurement method was good enough to use as an approximated linear function from the perspective of modeling transient response.
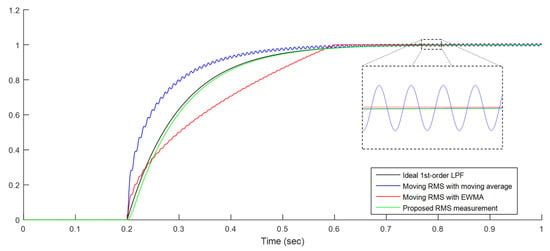
Figure 13.
Step response comparison of rms measurement methods and first-order low-pass filter.
Since the transfer function of the rms measurement could be expressed as a low-pass filter, the measurement delay no longer needed to be approximated as a delay function, as shown in Figure 10. Therefore, the simplified block diagram could be altered as shown in Figure 14 based on the time constant of the series-connected low-pass filter of the rms measurement.

Figure 14.
Proposed simplified model that considers measurement delay.
3. Stability Analysis of the Proposed Model-Based PID Controller Tuning Method
When the controller for the excitation system is designated as a PID controller and the system model is defined, model-based optimal tuning of gains for the PID controller can be performed. The benefit of optimal tuning over Ziegler–Nichols or trial-and-error methods is that you can choose the gains for the controller before operation. Therefore, not only effort and time for tuning the PID controller is saved, but also the controller tuning process will be more secure since the system response can be estimated when the reference input is changed or a disturbance occurs based on the defined model.
One of the model-based optimal tuning methods for the PID controller is to cancel the poles of the plant using the zeros of the PID controller. This is called pole-zero cancellation, and it is widely used when the system model and parameters are known and the order of the system is not very high. Since the order of the plant for the simplified models presented in the previous section was third-order at most, it was reasonable to tune the PID controller using pole-zero cancellation.
After pole-zero cancellation was performed, the stability of the corresponding excitation system was analyzed by the root locus, and the expected step response was presented assuming the corresponding model was correct in order to be compared with experimental results and verify the reliability of the proposed model.
3.1. Conventional Simplified Model-Based PID Controller Tuning Method
3.1.1. Static Excitation System
The conventional simplified model for a static excitation system is shown in Figure 15, and this is similar to the block diagram in Figure 6 only without an AC exciter. The loop transfer function of this excitation system is simply given by Equation (5).

Figure 15.
The block diagram of the simplified static excitation system.
In this case, only the first-order polynomial of the numerator for the PID controller was needed to perform pole-zero cancellation since only the generator transfer function existed in the plant. Therefore, the value of the D gain would be zero, making the PID controller a PI controller as follows.
To perform pole-zero cancellation, the gains of the PID controller should be selected based on the time constant of the generator and loop gain of the system. Since the system gains were compensated for by the simplification shown in Section 2, the PID gain values were determined based only on the time constants of the system with a simple loop gain (, ). The pole-zero cancellation process for the open-loop transfer function is shown in Equation (7).
Therefore, the closed-loop transfer function of the conventional simplified static excitation system is expressed as in Equation (8).
As a result, the closed-loop transfer function of the conventional simplified static excitation system could be expressed as a first-order low-pass filter with the bandwidth and time constant determined by the loop gain ().
3.1.2. Excitation System with an AC Exciter
If an AC exciter were added to the previous static excitation system, the block diagram would be changed as shown in Figure 6, and the loop transfer function of this system can be expressed as in Equation (9).
It has been shown that there were two poles for the generator and exciter, and the second-order polynomial of numerator for the PID controller was needed to perform pole-zero cancellation. Considering the loop gain of the system and the parameters for the generator and exciter, the PID gain values were determined by (, , ), and the pole-zero cancellation process is as in Equation (10).
Furthermore, the total transfer function for this system is as follows.
3.2. Proposed Model-Based PID Controller Tuning Method and Stability Analysis
Since the total transfer functions with the conventional PID controller tuning methods based on pole-zero cancellation for both systems were expressed as first-order low-pass filters, there should be no oscillation and no instability in the system because there are no complex poles or RHP (Right-Half Plane) poles in the root locus analysis shown in Figure 16.
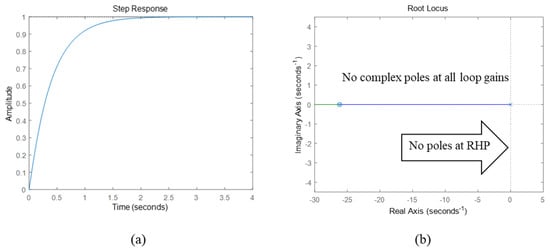
Figure 16.
Expected step response and root locus plot of the static excitation system with the optimally-tuned PID controller based on the conventional simplified model. (a) Step response and (b) root locus analysis for a static excitation system. RHP, Right-Half Plane.
To take the measurement delay component into account, the measurement block should be added to the feedback line, as shown in Figure 14, because the instantaneous excessive overshoot in the terminal voltage could occur when the measurement delay transfer function was on the open-loop line, even though the rms value of the output voltage was stable, and the loop gain value was set too high. Since the limit voltage overshoot was given as a certain percentage of the nominal voltage, the instantaneous voltage overshoot should be considered when the controller of the voltage regulator was tuned, and it was reasonable to set the system output as the output of the hypothetical instantaneous rms voltage, which was of the generator block output that was proportional to the magnitude of the phase voltage.
In this section, the proposed rms measurement method shown in Chapter 2 is applied. Furthermore, the negative effects from the measurement delay in the conventional optimal tuning method were analyzed for both excitation systems, while the optimal tuning methods for each system were modified considering measurement delay.
3.2.1. Negative Effects from Measurement Delay with Conventional Tuning Methods
The proposed simplified model with measurement delay block for static excitation systems is shown in Figure 17, and its loop transfer function is as follows.

Figure 17.
The block diagram of simplified static excitation system with the measurement delay component.
If the conventional tuning method, ignoring the delay component, were applied (, ), then the loop transfer function of this system would be calculated as in Equation (13).
Since only the pole from the generator was canceled while the pole from the measurement delay remained, the loop transfer function was a second-order system. Since the second-order system had the stability issue, the loop gain should carefully be selected.
Figure 18 shows a root locus analysis of this system. The expected step response could not be defined in this case because it possibly contained complex poles or even RHP poles depending on the loop gain. For example, as shown in Figure 19a, the system had no complex poles or RHP poles when the loop gain had a low value. However, as the loop gain value increased, complex poles started to appear, as shown in Figure 19b, and this in turn caused oscillation at the response. The oscillation and overshoot then became bigger if the loop gain increased further, as shown in Figure 19c. This implied that the demand response time or system bandwidth had limits because, conventionally, the loop gain was determined by them. To make a long story short, the faster the system response, the more unstable it became.
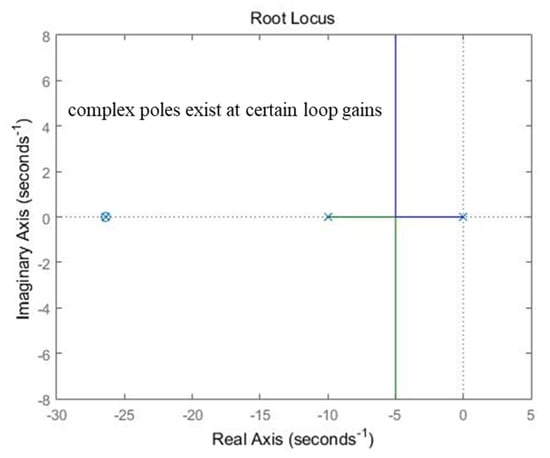
Figure 18.
Root locus plot of the static excitation system with the optimally-tuned PID controller based on the conventional simplified model considering measurement delay.
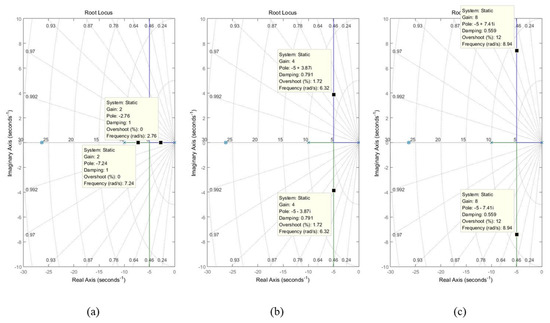
Figure 19.
The location of the poles of static excitation systems with different values of the loop gain (). (a) . (b) . (c) .
Furthermore, based on Equation (13), the closed-loop transfer function can be calculated as follows.
Since an LHP zero existed in this system, the step response of this system could have overshoot even if the system was stable and had no complex poles. Therefore, not only the response time and stability, but also the overshoot should be considered when the PID controller was tuned because the overshoot was also generally limited in the system.
3.2.2. Modified PID Controller Tuning Method that Considers Measurement Delay for Static Excitation Systems
Modifying the PID tuning method for static excitation systems is very simple. From Equation (12), we already know that the system had two poles in the loop transfer function. Therefore, those two poles could be canceled using the zeros of the PID controller in a similar manner to that used by the conventional PID tuning method for excitation systems with an AC exciter. To cancel the aforementioned poles, the gains for the PID controller are defined as follows.
Using gains from Equation (15) for the PID controller transfer function in Equation (12), the loop transfer function for a static excitation system with a PID tuning method based on the proposed model is calculated as in Equation (16).
Since the loop transfer function of the modified PID tuning method, shown in Equation (16), resulted in the same transfer function as for the conventional tuning method without measurement delay, shown in Equation (7), the expected response and root locus plot were the same as in Figure 16. However, in the case of this modified method, the measurement delay did not affect the stability of the system because the PID controller gains were defined by taking the delay into account.
The closed-loop transfer function of the static excitation system with this modified tuning method is calculated by Equation (17).
The result of Equation (17) was different from Equation (8), which means that even if the loop transfer function were the same, the step response could be different. Since it had a first-order high-pass filter transfer function, we could see that the higher the bandwidth of the first-order low-pass filter term from Equation (17), the higher the overshoot during its step response.
To prevent excessive overshoot and achieve fast response, the loop gain value () should be limited to a certain value because the bandwidth of the first-order low-pass filter term from Equation (17) was directly related to . From Equation (17), the excitation system achieved the fastest response when the loop gain value was , as shown in Equation (18).
Even though the instantaneous response was achieved in Equation (18), it could not be performed in real life because of hardware limitations. Figure 20 shows the expected step response of the excitation system whose closed transfer function was Equation (17).
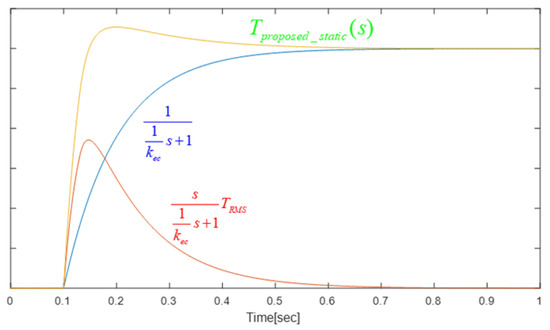
Figure 20.
Step response of static excitation system when the modified PID controller tuning method is applied.
As shown in this figure, the step responses of the high-pass filter and low-pass filter were summed to give the response of the static excitation system, and the high-pass filter response was not ideal due to the hardware limitations. If the loop gain were set to the same value as in Equation (18), hardware limitations caused a slight overshoot, but this would be when the fastest response occurred with the smallest response time. Therefore, it was still reasonable to limit the loop gain value to to achieve the demand response without damaging the system.
In summary, the modified value of the PID controller for the static excitation system is as follows.
3.2.3. Loop Gain Limitation for Excitation Systems with an AC Exciter
The block diagram of the excitation system with an AC exciter with the measurement delay component is shown in Figure 14. For this kind of excitation system, we could not add zeros to cancel the additional pole from the measurement delay as we did in the previous section because the PID controller only had two zeros at the maximum. However, even if the gains of the PID controller were not changed, we still could limit the loop gain using analysis to minimize oscillation and overshoot by considering the measurement delay. From Figure 14 and Equation (10), the loop transfer function of this excitation system could be expressed by Equation (20) where the PID gains were , , .
Since the result of Equation (20) was the same as the loop transfer function of Equation (13), the root locus analysis was the same as in Figure 18 and Figure 19, and the transfer function considering the measurement delay would also be the same as in Equation (21), which is calculated as follows.
As shown in the result of Equation (21), the response of the excitation system with an AC exciter was divided into the sum of the responses of the second-order band-pass filter and low-pass filter. Therefore, if the common characteristic equation of both filters were stable, the system was stable, and the step response of the system could be defined based on the damping ratio () of the second-order system, which decreased as increased.
To set the minimum damping ratio to an adequate value for a step response with fast response and small overshoot, the relationship between the damping ratio and the loop gain in this excitation system should be identified first. Based on Equation (21), the characteristic equation of the system could be expressed as in Equation (22).
This equation implied that the natural frequency () of the system was .
Therefore, the relationship between the loop gain and damping ratio was defined as in Equation (23).
Since and were always positive values, it could be expressed as in Equation (24).
If we set the minimum value of the damping ratio to , we could get the loop gain limit from Equation (25) as shown in Equation (26)
Furthermore, it could be rewritten as Equation (27) because and were always positive values.
In summary, the PID controller gains and its loop gain value limitation to minimize oscillation and overshoot could be represented as in Equation (28).
4. Experimental Results
In order to verify the proposed simplified model, the linearity of the measurement method, and the modified PID controller tuning methods for both kinds of excitation system, experiments were conducted based on the configuration shown in Figure 21 and Figure 22. The parameters for both excitation systems are shown in Table 1.
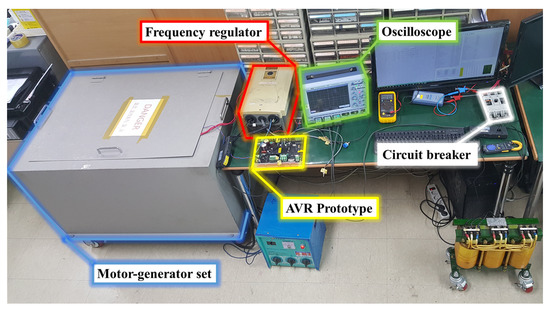
Figure 21.
Overall experimental configuration. AVR, Auto Voltage Regulator.
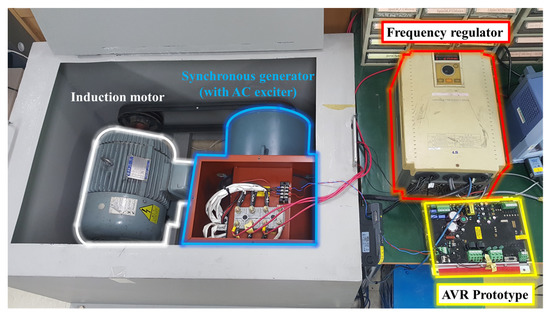
Figure 22.
Motor-generator set for imitation of the speed regulator in a synchronous generator system.

Table 1.
The excitation system parameters for the experiment.
Since actual excitation systems have non-linearity from the saturation effect, all the parameters were obtained based on the operating point in the no-load condition since it was the worst condition for the stability for generators [1].
Figure 23 shows the step responses of the static excitation system, the configuration of which is shown in Figure 1, with an optimally-tuned PID controller based on the conventional simplified model and voltage measurement method shown in Figure 11a. The reference phase voltage was set from 0 V to 110 V in the first division of time. Since the instantaneous rms voltage could not be measured without a delay, the line-to-line voltage was measured as a second-hand measure of the instantaneous rms voltage by its peak line-to-line voltage. Since the current controlled by the voltage regulator was directly related to the generator output voltage in the static excitation system, the field current () response also had a similar response as the instantaneous rms voltage or peak line-to-line voltage. The loop gains chosen for Figure 23a–c were the same loop gain values for the plotting root locus shown in Figure 19. Even though the PID controller gains in the real system were selected based on the conventional analysis shown in Figure 16, which should not have oscillation at the step response, the system response started to show oscillations and became a serious problem as the value of increased, as shown in the root locus plot in Figure 19. If the value of were too high, the response became hard to predict, as shown in Figure 23d, because of the non-linearity of the measurement method shown in Figure 11a and the hardware limitations of the voltage regulator. Since the conventional optimal tuning method and its analysis guaranteed there were no oscillations from the step response for all ranges as implied in Figure 16, it was dangerous to follow this tuning procedure blindly.
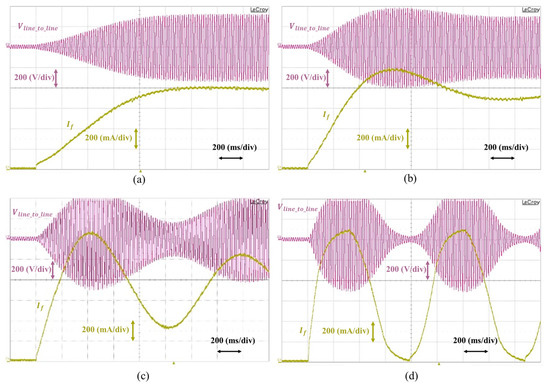
Figure 23.
Step responses of the optimally-tuned static excitation system based on the conventional method with different values of loop gain (). (a) . (b) . (c) . (d) .
Figure 24 shows the step responses of the optimally-tuned static excitation system using the linear measurement method shown in Figure 11c and the controller gains presented in Equation (19), which was based on the proposed simplified model that considered measurement delay. The values of in Figure 24a–c were also the same as the values that were used in Figure 19.
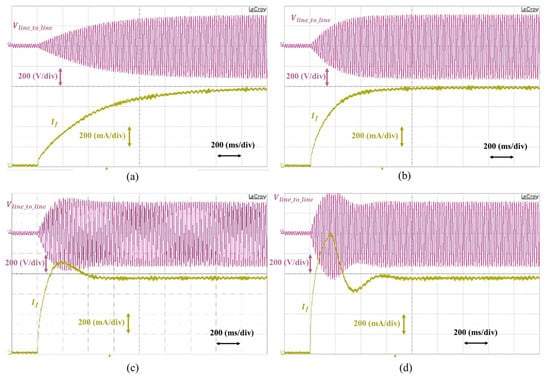
Figure 24.
Step responses of the optimally-tuned static excitation system that considers measurement delay with different values of loop gain (). (a) . (b) . (c) . (d) .
Comparing to Figure 23, the responses of the static excitation system were not only stable without oscillation, but also responded faster even though the loop gains were exactly the same. From Equation (19), the limit value of the loop gain could be defined as . Ideally, the step response should not have an overshoot because the transfer function in Equation (18) was one. However, since the regulator output voltage was limited to its DC-link voltage, in Figure 3, it could not synthesize the ideal step response of the high-pass filter component from Equation (17) with a high bandwidth as shown in Figure 20. Therefore, although the loop gain did not exceed the limitations of the system, a small overshoot could occur because of these hardware limitations, as shown in Figure 24c. If exceeded its limitation, the overshoot would be bigger as the value of the loop gain increased because of the first-order high-pass filter term in Equation (17). Furthermore, an oscillation could occur because of the limitations of the voltage regulator, as shown in Figure 24d. However, since the measurement delay was taken into account for the modified tuning method and the non-linearity from the measurement delay was minimized in the proposed optimal tuning method, Figure 24d shows a more stable and faster response than the step response shown in Figure 23d.
Figure 25 shows the step response of the optimally-tuned excitation system with an AC exciter, the configuration of which is shown in Figure 2. The line-to-line rms reference voltage was set from 220 V to 380 V to protect voltage measurement devices from breakdown by high voltage overshoot. Since an AC exciter was added to the system, the field current response was not similar to the line-to-line voltage because of the delay component from the AC exciter. Considering the added AC exciter, the optimal gain values for the PID controller were chosen as in Equation (28). Since the gain values for the PID controller were not changed from the conventional tuning method and only the loop gain limitation was proposed, in Figure 25, the loop gains were selected to compare the response when the loop gain exceeded its limitation. From Equation (28), the limit condition of the loop gain for the excitation system with an AC exciter was . Figure 25a shows the step response at the limit loop gain condition. The voltage and current had almost no overshoot or oscillation since the loop gain limitation was set based on a stable response in Equation (28). In Figure 25b, where the was slightly higher than the limit value, the field current had a small overshoot. However, it did not affect the output voltage because the AC exciter filtered this overshoot from the field current, and the voltage had a faster response than the limit condition. Therefore, the loop gain limit from Equation (28) was not absolute, and it could be adjusted to obtain a faster response with a bigger overshoot by changing the value of in Equation (24) to Equation (26). If the value of increased further, the overshoot and oscillation from the response increased along with it, as shown in Figure 25c,d. As shown in these figures, it can be seen that the value of should be properly limited because of not only the increment of overshoot and oscillation, but also the decrement of dynamic characteristic from a certain point.
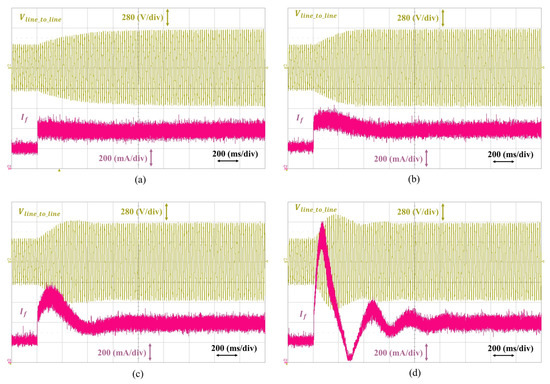
Figure 25.
Step responses of the optimally-tuned excitation system with an AC exciter that considers measurement delay with different values of loop gain (). (a) . (b) . (c) . (d) .
5. Conclusions
In this paper, model-based tuning methods for the excitation systems of a synchronous generator were presented and analyzed by considering the measurement delay. A simplified excitation system model that considered measurement delay was presented, and a voltage measurement method with the minimum non-linearity was proposed. Furthermore, the optimal tuning method was modified based on the proposed simplified model and then compared to the conventional optimal tuning method by analysis. Experimental results showed that the general stability and dynamic characteristics of the step response for the proposed method were much better than for the conventional method and verified the analysis given in the paper. Since this paper proposed a linear simplified model for the excitation system, the proposed model could be used in parameter identification methods for self-commissioning operation as well, and this would guarantee more accurate parameters for the excitation system. Furthermore, as constantly mentioned in the Experimental Section above, hardware limitations could cause unintended effects on the excitation system. These effects normally appeared in the excitation system when the loop gain exceeded the proposed limitation. Therefore, analysis of the effect from these limitations would be a good subject for a cost-driven voltage regulator with tight hardware limitations and a microprocessor that has low processing speed, while a fast response is still a requirement.
Author Contributions
K.-M.C. conceived of and designed the experiments; K.-M.C. performed the experiments; K.-M.C. analyzed the data; K.-M.C. and C.-Y.W. contributed reagents/materials/analysis tools; K.-M.C. wrote the paper; K.-M.C. and C.-Y.W. participated in the research plan development and revised the manuscript. All authors contributed to the manuscript. All authors read and agreed to the published version of the manuscript.
Funding
This research received no external funding.
Acknowledgments
This work was supported by the National Research Foundation of Korea (NRF) grant funded by the Korea government (MSIP) (No. 2019R1A2C2007216).
Conflicts of Interest
The authors declare no conflict of interest.
References
- Kim, K.; Schaefer, R.C. Tuning a PID controller for a digital excitation control system. IEEE Trans. Ind. Appl. 2005, 41, 485–492. [Google Scholar] [CrossRef]
- Kim, K.; Rao, P.; Burnworth, J. Application of Swarm Intelligence to a digital excitation control system. In Proceedings of the 2008 IEEE Swarm Intelligence Symposium, St. Louis, MO, USA, 21–23 September 2008. [Google Scholar]
- Kim, K.; Rao, P.; Burnworth, J.A. Self-Tuning of the PID Controller for a Digital Excitation Control System. IEEE Trans. Ind. Appl. 2010, 46, 1518–1524. [Google Scholar] [CrossRef]
- Schaefer, R.C.; Kim, K. Auto tuning speeds commissioning of the generator excitation system. In Proceedings of the Conference Record of 2014 Annual Pulp and Paper Industry Technical Conference, Atlanta, GA, USA, 22–26 June 2014; pp. 137–143. [Google Scholar]
- Ayasun, S.; Gelen, A. Stability analysis of a generator excitation control system with time delays. Electr. Eng. 2010, 91, 347–355. [Google Scholar] [CrossRef]
- Choo, K.M.; Jung, W.S.; Kim, J.C.; Kim, W.J.; Won, C.Y. Study on Auto-Tuning PID Controller of Static Excitation System for the Generator with Low Time Constant. In Proceedings of the 2018 21st International Conference on Electrical Machines and Systems (ICEMS), Jeju, Korea, 7–10 October 2018; pp. 755–759. [Google Scholar]
- William, S.; Levin, L. Remarks on Pade Approximations. In The Control Handbook, Second Edition: Control System Fundamentals; CRC Press: Boca Raton, FL, USA, 2007. [Google Scholar]
© 2020 by the authors. Licensee MDPI, Basel, Switzerland. This article is an open access article distributed under the terms and conditions of the Creative Commons Attribution (CC BY) license (http://creativecommons.org/licenses/by/4.0/).