Abstract
The abundant reserve of shale gas in Sichuan Basin has become a significant natural gas component in China. To achieve efficient development of shale gas, it is necessary to analyze the stress state, pore pressure, and reservoir mechanical properties such that an accurate geomechanical model can be established. In this paper, Six wells of Neijiang-Dazu and North Rongchang (NDNR) Block were thoroughly investigated to establish the geomechanical model for the study area. The well log analysis was performed to derive the in-situ stresses and pore pressure while the stress polygon was applied to constrain the value of the maximum horizontal principal stress. Image and caliper data, mini-frac test and laboratory rock mechanics test results were used to calibrate the geomechanical model. The model was further validated by comparing the model prediction against the actual wellbore failure observed in the field. It was found that it is associated with the strike-slip (SS) stress regime; the orientation of SHmax was inferred to be 106–130° N. The pore pressure appears to be approximately hydrostatic from the surface to 1000 m true vertical depth (TVD), but then becomes over-pressured from the Xujiahe formation. The geomechanical model can provide guidance for the subsequent drilling and completion in this area and be used to effectively avoid complex drilling events such as collapse, kick, and lost circulation (mud losses) along the entire well. Also, the in-situ stress and pore pressure database can be used to analyze wellbore stability issues as well as help design hydraulic fracturing operations.
1. Introduction
Shale gas resource is the fastest growing natural gas resources in exploration and development of unconventional oil and gas resource over the world. The recoverable shale gas resource of China is estimated to be 12.85 × 10¹² m3, of which Sichuan Basin is the area with the largest reserve of natural gas and the greatest cumulative production of natural gas in China [1,2,3]. Shale gas is an important energy component that changes China’s natural gas development and even the entire energy development pattern. NDNR Block, is located in the southern Sichuan Basin, the main reservoir is the deep-buried (3500–4500 m) Silurian Longmaxi formation with a stratum thickness of 65–516 m and a transgressive black shale at the bottom.
In order to achieve efficient development of shale gas resource in the area, it is necessary to analyze the stress state, pore pressure and reservoir mechanical properties to establish a precise geomechanical model, therefore avoiding complex drilling such as collapse, kick, mud losses, and so on. A geomechanical model is made up of five principal components, which are the three principal stresses, pore pressure, and rock mechanical properties. The three principal stresses are the vertical stress, Sv; the maximum horizontal stress, SHmax; and the minimum horizontal stress, SHmin. The rock mechanical properties comprise several physical rock properties such as unconfined compressive strength (UCS or C0), internal friction coefficient (IF), Young’s modulus (E), Poisson’s ratio (ν), and the Biot coefficient(α). The magnitudes and orientations of the principal stresses make up the in-situ stress tensor [4,5]. They interact with the other two geomechanical components, the pore pressure and the rock strength, to induce geomechanical issues during drilling, for example, wellbore breakouts, drilling fluid losses and sand production.
Detailed geomechanical model was conducted to provide the operator with a 1D Geomechanical Model (shortened for “1D GM”). The focus of the work is to evaluate the primary geomechanical risks to provide recommendations and an optimum mud weight (MW) profile along the proposed well path, as well as provide other geomechanical suggestions for safe drilling and completion practices. The GM is aimed at avoiding or mitigating the potential for fluid kicks and hole instability problems, including stuck pipe in tight hole conditions, hole pack-off, shale cavings, borehole collapse, significant mud losses and lost circulation due to excessively high MW with a low fracture gradient or unintended formation fracturing.
2. Materials and Methods
Six wells including W203, W204, W205, W206, R202 and H1 were selected to build the geomechanical model for the neighboring newly planned shale gas exploration wells in the NDNR Blocks. The model used logs, images, drilling data, well tests and laboratory test results from the six wells. Conventional logs (acoustic, density, resistivity, gamma and caliper) and drilling data were available for these wells. A pressure/injection rate vs. time plot was provided for Leak off Test/Formation Interity Test (LOT/FIT) conducted at casing shoes for shallow formation from R202. Image data in the 6 inch hole section in W203, the 8.5 inch in W205 and 6.5 inch in W206. Laboratory rock mechanical tests were performed on samples retrieved from W206. Table 1 and Table 2 provide a summary of the data used to establish the geomechanics model.

Table 1.
Rock mechanical parameters testing of W206.

Table 2.
Brazilian test results of Longmaxi Formation, in W204, W205, W206.
Before constructing a geomechanical model and effectively using it to guide oilfield drilling, completion and development, it is necessary to analyze the wellbore stability characteristics of the wells in the area. A detailed review of each well is an important step in properly developing and verifying a geomechanical model. The analysis of the drilling events that may be related to mechanical instability of the wellbore, hence, can be used to help derive parameters of the geomechanical model and calibrate/verify the model. Examples of such events include tight hole, stuck pipe, pack-off, total losses, partial losses or gains, water influx, excessive reaming and washing, and so forth. Losses or gains of drilling mud help to constrain the minimum horizontal stress, Shmin, and the pore pressure. Stuck pipe or tight hole conditions and hole reaming may indicate excessive amounts of cavings as a result of shear failure (i.e., wellbore breakouts). All those events are plotted against drilling depth and time, together with the mud weights used to facilitate the analysis and verification. The drilling experience review was performed for all of the six wells.
Figure 1 shows the geomechanically-related drilling events of H1 well. The H1 well is a vertical well with mud weights of 1.02 to 2.4 SG (specific gravity). In the drilling process, problems such as tight hole, losses and connection gas frequently occurred. At the depths of about 1000, 4500 and 6000 m of the measured depth (MD), connection gas and inflow were see, while the tight hole events frequently occurred below 1000 m MD. A number of mud losses happened below the depth of 2000 m MD. Based on the analysis of the drilling experiences in three wells, it can be found that most of the wells were drilled successfully with few borehole instability related drilling problems, and the mud weight used for drilling varies among wells. The aforementioned drilling events can be used to check and verify the geomechanical model.
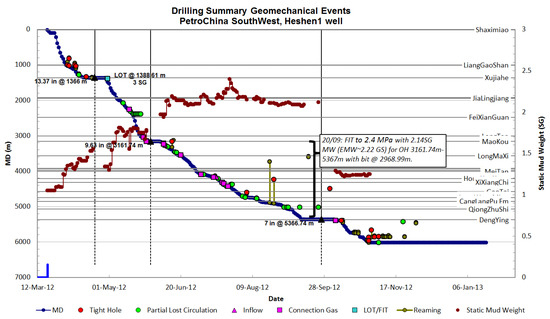
Figure 1.
Geomechanical events during drilling of H1.
3. Results
3.1. Vertical (Overburden) Stress
Gravitational stress at any point in the earth is caused by the weight of the rock column overlying that point. The overburden stress (Sv) at depth z, is calculated by integrating the weight above the point (ρ(z)) using the following equation [6]:
where Sv is the vertical (overburden) stress (Pa), ρ(z) is the formation bulk density (kg/m3), g is the gravitational acceleration (m/s−2), and z is the depth (m).
This equation covers the contribution from the material from the surface to a depth of interest (z). The key issue for such an analysis, and thus a well-constrained overburden gradient, is the use of reliable composite density profiles. The calibrated near-surface density information recorded well log density data, as well as densities estimated from the well log acoustic data using the published velocity-density relationships (for example the Gardner or Bellotti relationships) can both be used as input of density for overburden estimation. A pseudo-density curve is established for the depth of the missing density data. Based on the log density data, the relationship between the acoustic velocity and the density (such as Gardner and Bellotti relation) is fitted, and the pseudo-density curve is established by using the acoustic data. At depths without any logging data, the existing data are used to fit the density information of the missing data depth, and the overburden pressure is calculated jointly by the “measured density” and “pseudo-density.”
3.1.1. Density Curves
The method of density integral is used to calculate the overlying formation pressure, which requires the rock density data from the surface to the bottom of each well. The density logs of the adjacent wells have not reached the surface. Among them, the density logging of well W206 is about 50 m below the surface, R202 is only below 1988 m, W205 is below 1095 m, H1 is below 1350 m, and the data of W203 and W204 are not collected from 12 ¼ inch well, no overlying formation pressure and other stress parameters. Therefore, exponential fitting was applied to represent the density of the missing interval between the surface and the top of the first reliable density measurement [7,8]. The density curve fit is 2.5 g/cm3 at the ground surface, which is consistent with the density measurements in the similar onshore environments, and also match with the density logs from the wells for the deeper intervals. The trend was used as a proxy of density in the absence of the actual density data in the shallow section. To improve the estimation, the actual density data (from the related wells) and the pseudo-density (where actual density appeared to be affected by hole condition) were combined to estimate the overburden stress.
3.1.2. Overburden Gradient Estimation
Figure 2 shows the density log (green), pseudo-density data estimated from acoustic logs (blue), exponentially fitted curve for the shallow depths without measurements (red) and the final composite density profiles used for overburden estimation, combining all the available data for H1. The 1-arm caliper logs were also plotted to help with the judgments of the density log quality. Although 1-arm caliper data has its limitation in estimating the borehole shape and diameter, it gives a rough idea of the hole shape and the existence of the borehole failure under the condition there is no other multi-arm caliper data available. This block is a new field of shale oil and gas exploration and development in China, with limited drilling and limited geological data. Up to date, the 1-arm caliper data are the only type of caliper information available from this field. Because most of the wellbores are in good shape based on the 1-arm caliper data, the density logs were adopted wherever possible for the three wells. The pseudo-density data were used where hole enlargements were observed. The overburden in the reservoir is 2.67 SG for R202 and W205, 2.66 SG for W206, and 2.65 SG for HS1.
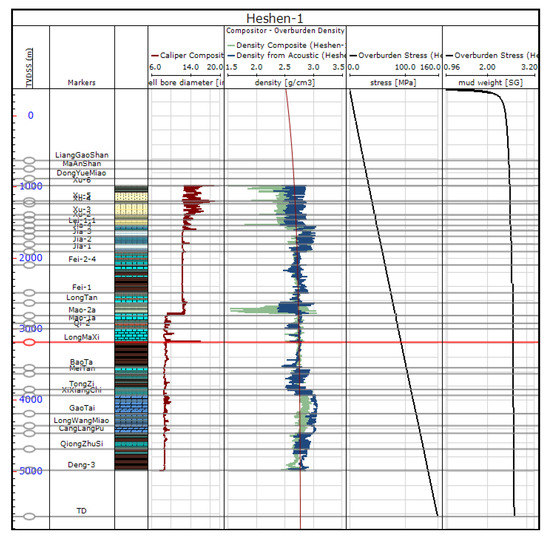
Figure 2.
Estimation results of the overburden gradient in H1 well.
Figure 3 shows the modelled vertical stress for W206, W205, H1 and R202 in the form of gradient with reference to TVD. The relatively small variation between each overburden suggests a stable relationship between formation properties in the area. The range of overburden stress varies from 2.66 to 2.67 SG in the Longmaxi formation.
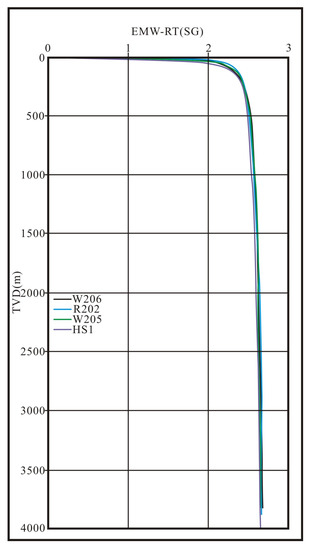
Figure 3.
Overburden gradient in several wells.
3.2. Pore Pressure Analysis
Pore pressure is an important element of the geomechanical model, which plays a fundamental role in stress variation across the region [9]. Pore pressure also directly affects drilling, completion and production during the entire life cycle of the field. The typical workflow for 1D pore pressure modelling starts with the post-drill pore pressure determination for the wells using the suite of data from these wells, particularly the direct pressure measurements. The modelling involves detailed evaluation and preparation of well diaries for all the wells by taking into consideration the drilled well information including wireline logging data, measured formation pressures and drilling events. Necessary QC (quality control) and compositing of well-logs will be carried out along with different corrections as required. Also, emphasis is placed on understanding the prevalent geological setting. Having an awareness regarding the effect of various geological parameters on overpressure generation is not only crucial for the Pp analyses but also plays a critical role in influencing the overall geomechanical model.
1D pore pressure modelling was carried out by taking into consideration the petrophysical and drilling data from R202, W205, H1 and W206. Log-based methods such as normal compaction trend analysis is used for pore pressure prediction in the study area although the interpretations have to be used with caution due to the presence of several thick carbonate sections, the age of the strata (Jurassic-Ordovician) and the complex tectonic history. Model parameters were calibrated by integrating drilling experiences from the well observations, regional pressure data, geological information and geomechanical model verifications. Overpressure has been reported in both the overburden and targeted Longmaxi Formation. Based on well tests and drilling experiences. No depletion has been reported in the study area. Due to differences in total organic content, hydrocarbon generation and low permeability, pore pressure can vary greatly in the targeted formation.
There are many classic methods for pore pressure estimations, there has actually been recent work on calculating pore pressures using classical density functional theory [10,11]. Among the many empirical equations for pore pressure prediction, Eaton’s (1975) method for acoustic transit time and resistivity were well accepted and proved to be effective if the normal shale resistivity/acoustic transit time is properly determined [12,13]. The model is based on the premise that when acoustic slowness or resistivity values of “clean” shales is read directly from logs and plotted as a function of depth on semi-log scale, there exists a normal trend line through the normally pressured section. A deviation of the log values from this normal trend line is indication of abnormal pore pressure.
For the original Eaton equations, an exponent of 1.2 was used for resistivity and 3.0 for acoustic slowness [12,13]. For this paper, the exponents were adjusted to be 1.3 and 3.4 to reflect the changes of lithology and calibrated by the mud weight, connection gas and inflow and so forth, drilling events. These exponents work well for resistivity and acoustic logs, respectively.
where Ro is observed resistivity (actual measurement data), RN is normal resistivity, which is from normal compaction trend line, and x is Eaton exponent (dimensionless), default is 1.2.
where DTo is observed interval transit time, DTN is normal interval transit time, and x is the Eaton exponent (dimensionless) with a default value of 3.0.
Direct pressure measurements were available from wells which can help to understand the overpressure distribution in the study area. Figure 4 is color-coded based on wells. All of the wells show a similar pattern in terms of overpressure distribution. Pressure measurements from well tests in wells and regional data suggest overpressure from 1500 m TVD and a gradual increase with depth. Well tests in the Longmaxi formation shows a pressure range of 1.13–1.99 SG.
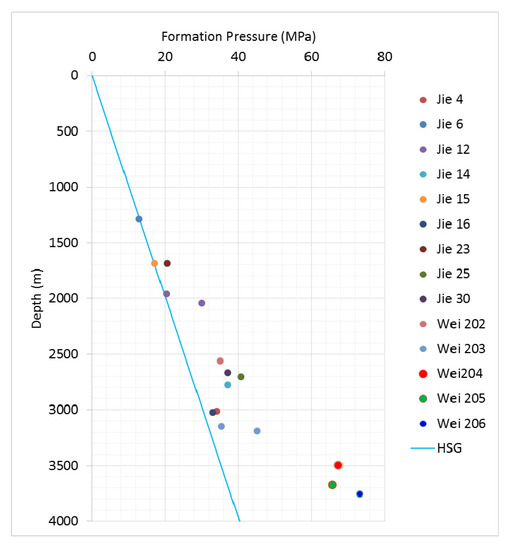
Figure 4.
Pore pressure measurements in the reginal wells.
Figure 5 shows the results of pore pressure determination for H1 well. The log-based modelling, calibrated with well events, suggests that the pore pressure is near hydrostatic from the surface to 1000 m TVD and becomes overpressured from the Xujiahe formation. The overpressure from Jialingjiang to Feixianguan formation appears to be higher than in the other wells. The shale is highly overpressured with a maximum Pp gradient of 2.1 SG. The model shown here is pre-drill only, No pos-drill work involved.
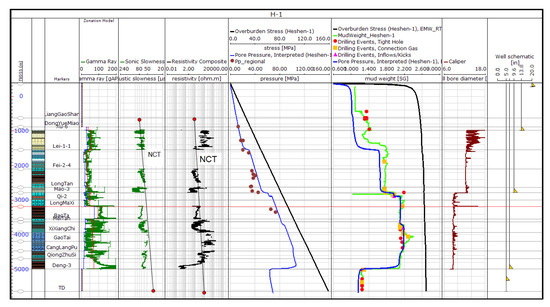
Figure 5.
1D Pore pressure modeling of H1.
Overpressure profiles were calculated using the final post-drill pore pressures and hydrostatic pressures for the 4 wells. A small difference in the pore pressure profiles exists amongst the 4 wells. The overpressure from the Jialingjiang to Feixianguan formation for the H1 well appears to be higher than in the other wells.
3.3. Rock Mechanical Properties
The mechanical response of rocks to changes in stresses is controlled by the mechanical properties of the rock. Rock mechanical properties such as uniaxial compressive strength (UCS or C0), internal friction coefficient (μ), Young’s modulus (E), Poisson’s ratio (ν) and so forth, is an integral part of the geomechanical model. These rock properties can be obtained by conducting a series of triaxial compression tests on cylindrical samples from the same depth but at different confining pressures. The elastic moduli (both Young’s modulus and Poisson’s ratio) can be calculated from the stress-strain measurements correlated to axial and radial directions [6,9,14]. For the samples that failed as a result of shear failure, the pressures can best be analyzed using Mohr Circle techniques.
3.3.1. Laboratory Rock Strength Tests
Both Triaxial compression tests and Brazilian tests were available on core plugs from W206. Seven laboratory triaxial tests were conducted on shale cores from the Longmaxi Formation in W206. Two or three samples were tested under the same confining pressures (in situ conditions/effective stress). Tensile strength ranges from 4.2 to 12.2 MPa in the Longmaxi formation, and the tensile strength wells appear to be higher in W206 than in W204 and W205 wells. The Young’s Modulus and Poisson’s Ratio results from the tests will be used to calibrate the estimation from wireline logs. Unconfined compressive strength and internal friction are not able to be interpreted from the tests, so regional data and relationships were used for the rock strength estimation.
Table 1 and Table 2 show the comparison of lab results and log-derived values for static Young’s Modulus (E) and static Poisson’s Ratio (v). Young’s Modulus and Poisson’s ratios were interpreted at the elastic section of the curve corresponding to the locations of ~50% of the strain curves (Figure 6). The laboratory tested E and v values for W206 match the calculated rock mechanical properties very well. At the same time, there are lack of test results on internal friction to calibrate/verify the log-derived values. Because the triaxial tests at same depths were all conducted under same confining pressures close to assumed effective mean in-situ stress conditions, it is impossible to use the test results to construct Mohr Coulomb failure envelop plots to derive the possible unconfined compressive strength and internal friction angle from these tests.

Figure 6.
Stress-Strain curves for Triaxial Compressreion Tests in W206. (a) 3753.96–3754.22; (b) 3792.29–3792.53.
3.3.2. Rock Mechanics Model
Elastic moduli, including the Young’s modulus and Poisson’s ratio, are required for evaluating field stresses. The dynamic Young’s modulus (Ed) and dynamic Poisson’s ratio (νd) were estimated from the acoustic data with the following equations:
where Edyn is dynamic Young’s modulus, Vp is compression wave velocity, Vs is shear wave velocity and Den is density.
where PR is dynamic Poisson’s ratio.
Figure 7 is the crossplot between the static Young’s Modulus derived from laboratory core tests and the dynamic young’s modulus calculated from the wireline acoustic and density logging data. Because there is only three tests available in W206, the regional data was referenced to help derive a relationship between static and dynamic Young’s Modulus. Therefore, the relationship between the static and dynamic Young’s Modulus is [15,16,17]:
where Esta is the static Young’s Modulus. Internal Friction is calculated using a modified Lal-Vp equation. Because there is no laboratory tests available for calibration, Internal Friction is calculated using empirical equations selsected based on lithology [5]:
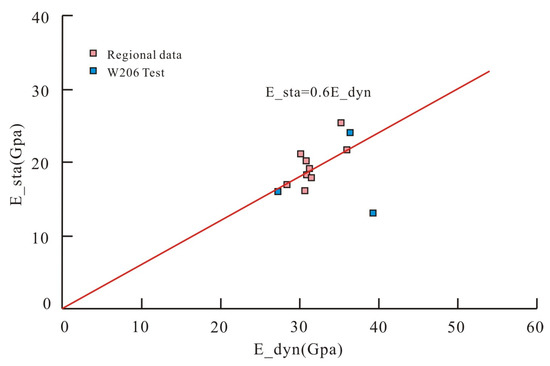
Figure 7.
The relationship between the E_sta and E_dyn.
Shale, Siltstone and Limestone:
Dolomite:
where IF is internal friction.
The depth continuous rock strength profiles of the study wells were determined using wireline log data. The most common method of predicting the log-based rock strength uses the empirical relationships between rock strength (UCS) and reservoir properties measured or derived from wireline logs. Laboratory rock strength tests were used to calibrate the empirical equations to be suitable for local geological background. Different empirical equations have been tried based on experiences in analogue environments.
Rock strength is calculated using empirical relationships between log data and UCS:
The UCS of shale calculated using E-Literature equation [5]:
The UCS of limestone calculated using modified Militzer-DT equation [14]:
where DTCO is the sonic (P-wave) travel time (μs/ft).
The UCS of dolomite calculated using E-Dolomite equation [5]:
The UCS of sandstone calculated using Modified McNally equation [9]:
Although the empirical equations were selected based on the global experiences in similar geological environments, there is high uncertainty with the rock strength estimation because there is no laboratory tests available to calibrate the estimation of internal friction and UCS.
3.3.3. Rock Mechanics Data
Figure 8 shows log-derived uniaxial compressive strength for W206 using the above-mentioned equations. There is a reasonable degree of uncertainty associated with the rock mechanical properties estimation due to the lack of calibration data. Young’s Modulus, Poisson’s Ratio and internal friction coefficients are shown in the figure. There was a good match between lab results and results estimated from empirical equations for Young’s modulus and Poisson’s ratio. The comparable results from lab results and empirical equations increased the confidence in the estimation of rock mechanical properties for the wells in NDNR Blocks. The empirical equations were used for the remainder of the modelling.
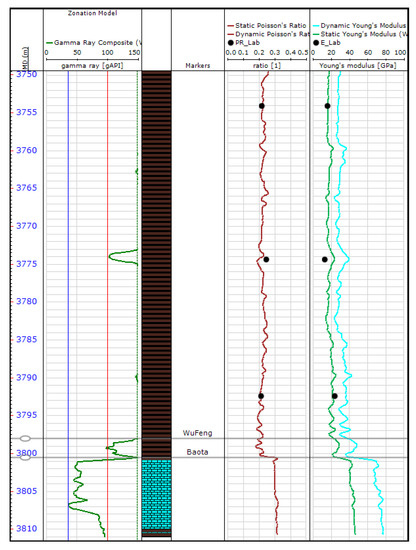
Figure 8.
Rock mechanical properties calibration of W206.
Figure 9 displays the rock strength comparison in the Longmaxi Formation for W206, W205, H1 and R202. The upper images are the frequency of different UCS, and the lower curve is the UCS cumulative curve. P10 (10%) represents the corresponding UCS when the cumulative UCS frequency reaches 10%.

Figure 9.
Rock strength comparison in Longmaxi Formation.
Table 3 gives a comparison of rock uniaxial compressive strength. The rocks appear to be strong in general and the P10 UCS is ~55–60 MPa in Longmaxi Formation. The rock strength is slightly stronger in H1 than in other wells.

Table 3.
Comparison of rock uniaxial compressive strength.
3.4. Horizontal Stress Magnitude and Direction
3.4.1. Orientation of Horizontal Stress
The orientation of SHmax was constrained using observations of borehole failure in the study wells. Wellbore failure analysis allows us to constrain the orientation and magnitude of the maximum horizontal stress (SHmax) because stress-induced wellbore failures occur due to the stress concentration acting around the wellbore during drilling. The presence, orientation, and severity of failure are a function of the in-situ stress field, wellbore orientation, and rock strength [18,19,20]. Wellbore breakouts appear in electrical image data as low or high conductivity (depending on the drilling fluid used) on opposite sides of the wellbore wall. Usually these appear as out of focus zones in electrical image log data due to the pad being out of contact with the wellbore wall. Drilling-induced tensile fractures appear as thin dark bands approximately parallel to the axis of a vertical wellbore occurring 180 degrees apart in the image.
In fact, the position of these features around the wellbore can be used to determine the azimuth of SHmax. The azimuth of wellbore breakout indicates the azimuth of SHmin, and the azimuth of drilling-induced tensile fractures indicates the direction of SHmax [19,21,22,23]. The full wellbore micro-resistivity imaging (FMI) and Caliper log data of W203 and W205, and the XRMI data of R202 were obtained to analyse the SHmax direction. Figure 10 shows wellbore breakout examples from W205. The mean wellbore breakout width is 57 ± 9° and the azimuth of SHmin is 36° N. Therefore, the azimuth of SHmax is 126° N.
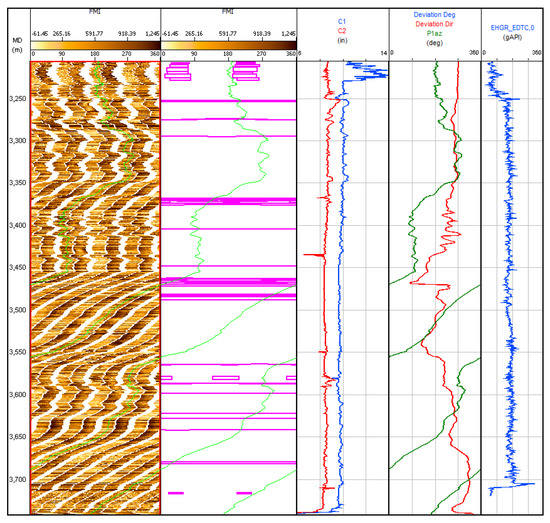
Figure 10.
Wellbore breakout analysis for W205.
Figure 11 shows the image data from R202. The vertical features in a vertical wellbore that develop 180° apart appear to be drilling-induced tensile fractures. The azimuth of these features is the azimuth of SHmax (111° N).
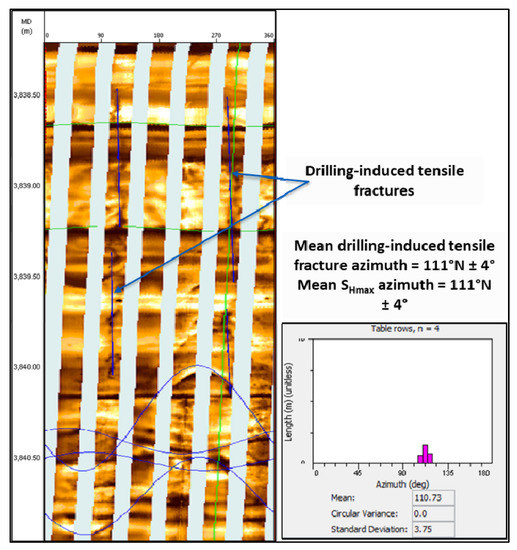
Figure 11.
Enhanced Micro-resistivity Imaging (XRMI) analysis of R202.
Figure 12 demonstrates the calliper analysis for the 6-inch hole section of W203. Calliper data are extracted from the FMI data and only cover 30 m of the wellbore. The upper 10 m of the data show evidence of wellbore breakouts, which have a mean azimuth of 16° N. The inferred azimuth of SHmax is 106° N.
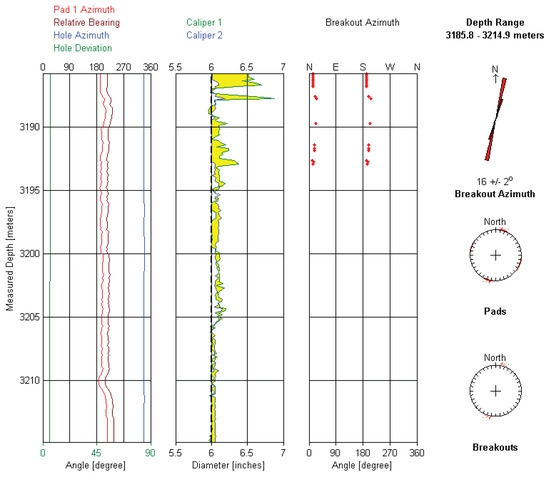
Figure 12.
Caliper analysis for W203.
Table 4 lists the results of logging data analysis for three wells. The maximum horizontal stress direction results obtained by FMI, caliper and XRMI analysis are close.

Table 4.
Summary of image analysis.
Based on the orientation of interpreted breakouts, the derived SHmax azimuth ranges from 106–126° N in the study area. Although there was uncertainty with the interpretation, this observation is generally consistent with the published regional stress azimuth. A SHmax orientation of ~116° N was used for the NDNR Blocks.
3.4.2. Magnitude of SHmin
There are several ways of calculating the magnitude of the minimum horizontal stress (SHmin) including log-based methods and direct measurements such as leak-off tests, extended leak-off tests, mini-frac, micro-frac, hydraulic fracturing, and so on [24]. The most reliable measurement of in situ minimum horizontal stress (SHmin) is the diagnostic mini-frac or extended leak-off test, XLOT [25]. Good XLOT or mini-frac data are not always available. The equivalent circulation density (ECD) of the drilling fluid at the time of losses can provide an estimate of SHmin.
Once the magnitude of SHmin has been evaluated at a few depths from the fracture creation tests, it can be used as an indicator to extrapolate the SHmin magnitudes for all intervals. In this study, two approaches have been used to estimate the SHmin profile for the entire depth coverage. One was the Effective Stress Ratio (ESR) approach, which was determined as:
where ESRShmin is the effective stress ratio of SHmin.
Table 5 shows the mini-frac and hydraulic fracturing data for W205, W203, W204 and W206. Mini-frac tests were conducted in the horizontal section of W204 and W205. However, there are not any digital data available for proper closure pressure interpretation. Hydraulic fracturing data with proppant injection from other wells were also examined to help determin the possible Shmin range in the Longmaxi formation.

Table 5.
Mini fracture and hydraulic fracturing data.
Table 6 shows the FIT test results have considerable variation with some being higher than the estimated overburden stress. The FIT results cannot be used to calibrate SHmin at shallow depths. The closure pressures interpreted from mini frac and hydraulic fracturing data will be used to calibrate the SHmin estimation in the Longmaxi formation.

Table 6.
Formation test information.
The ESR approach was used to extrapolate the SHmin profile for the entire depth coverage based on the LOT data from NDNR block. Because there is no digital data available, the SHmin profile was calibrated using mini-frac interpretations of W205 and hydraulic fracture interpretations of W206. Mini-frac tests remain the most reliable method for determining the minimum (usually horizontal) in situ total stress. It was a shut-in test in the paper, the fracture closure pressure (FCP) can be determined by plotting pressurer as a function of time and detecting a change in linearity of the pressure decay [26,27]. Fracture closure pressures from mini-frac and hydraulic fracturing data were used to calibrate the estimation of SHmin in W205 and W206 (Figure 13, Figure 14, Figure 15 and Figure 16). An average effective stress ratio of 0.7 was used to constrain the SHmin profile from the surface to TD. The same approaches were applied to the SHmin modelling for the other wells.
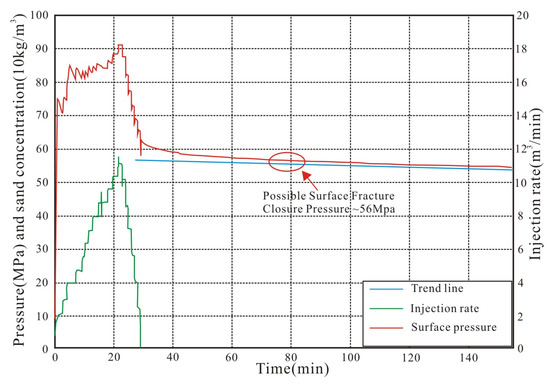
Figure 13.
Mini-frac test pressure curve in W205.
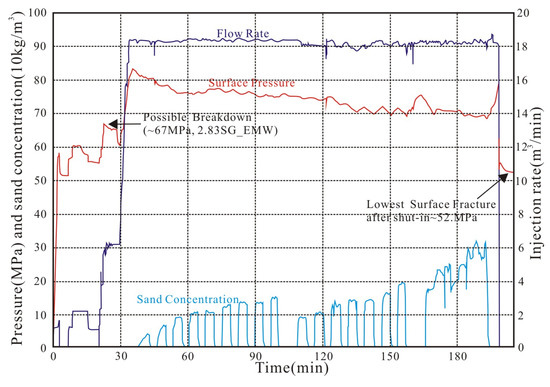
Figure 14.
Pressure curve of hydraulic fracturing in W206.
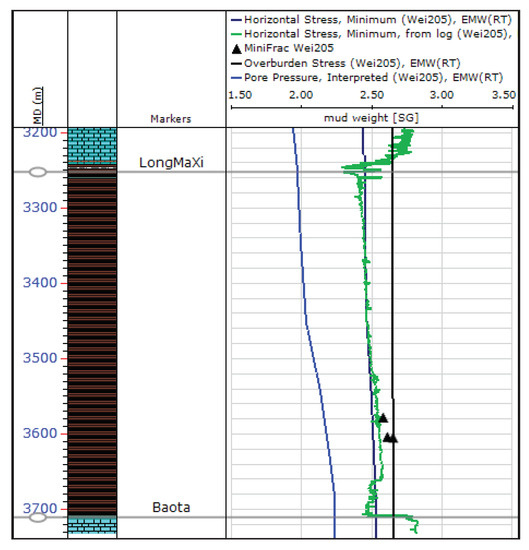
Figure 15.
Shmin profile of W205.
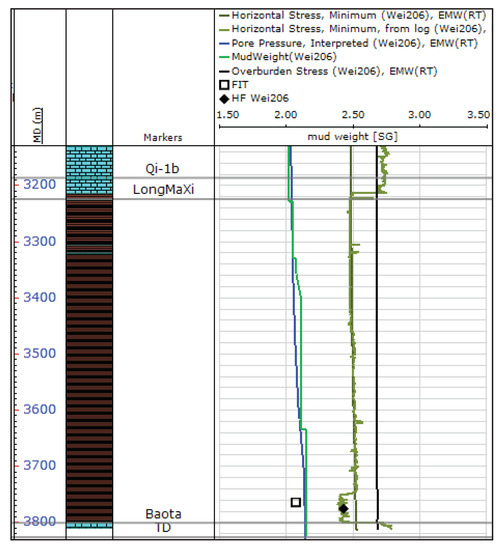
Figure 16.
Shmin profile of W206.
3.4.3. Magnitude of SHmax
The remaining parameter needed to determin the geomechanical model completely is the magnitude of SHmax, which probably is the most difficult stress parameter to constrain. The approach used for constraining SHmax is to forward model the stress conditions consistent with observations of wellbore failure in image and calliper logs with two approaches-the effective stress ratio (ESR) and a log-derived SHmax approach. The effective stress ratio approach is similar to what was used for determining the Shmin and is written as:
where ESRSHmax is the effective stress ratio of SHmax.
The magnitudes of Sv and Pp have been evaluated and the only parameter that is required to determin SHmax is the ESRSHmax. This was accomplished by analysing the SHmax magnitudes at a few critical depths where breakouts were observed. The breakout zones may be characterised from either image or calliper data. The determination of the SHmax magnitude uses the pore pressure, overburden, least principal stress, internal friction coefficient, sliding friction coefficient, Biot coefficient, Poisson’s ratio and the mud Weight used in drilling the well at the depth of the observed failure.
Figure 17 is a cross plot of SHmax versus Shmin magnitudes. The cross plot is shown with either the UCS or breakout width contours overlying the stress polygon, which corresponds to all possible in situ stress states [15]. The stress polygon determins all the possible magnitudes of Shmin and SHmax at any depth as determined by Anderson’s faulting and Coulomb’s faulting theories for a given friction coefficient and pore pressure. The polygon construction is based on the assumption that the effective stress ratio cannot exceed that required to cause motion on pre-existing faults that are optimally oriented to the principal stress field. Vertical and horizontal dashed black lines correspond to the overburden (Sv) and separate the fields of NF (normal faulting), SS (strike-slip faulting) and RF (reverse faulting). The boundaries of the polygon are determined by the failure conditions under the different stress regimes (i.e., friction coefficient), and therefore represent a case of active faulting. The only allowable stress states are those that are either along the perimeter of the polygon or within its interior. This ensures that the in-situ stresses cannot exceed a ratio of shear to effective normal stress that would initiate slip (or earthquakes) on appropriately oriented faults.
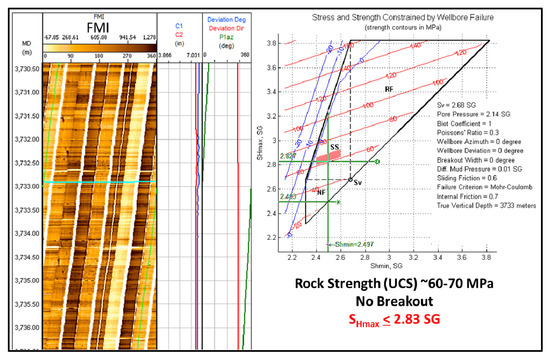
Figure 17.
SHmax magnitude determination of W206 at 3733 m true vertical depth (TVD).
There was no reliable drilling induced failure observed on the FMI data of W205 and W206. Data from W205 showed there are intervals of over-gauge hole. The calliper and FMI data from W206 show clear intervals of in-gauge hole in regions with low rock strength. These intervals can be used to model the upper bound of SHmax at a number of depth. The stresses, pore pressure, rock mechanical properties (UCS, internal friction coefficient, Poisson’s ratio), wellbore geometry and mud weight used at the modelling depth were used to calculate the SHmax magnitude. A Mohr-Coulomb criterion was adopted in the prediction and this criterion best explained the wellbore failure seen in different formation.
Figure 18 and Figure 19 show the results of the SHmax constraints at selected modelling depth of W205. For intervals where FMI data were available, a snapshot of the image and calliper over the modelled interval was plotted on the left side of the slide. The stress polygon analysis is also shown in each slide and the input parameters were summarised beside the stress polygon. The inferred range of SHmax is shown in the red box.
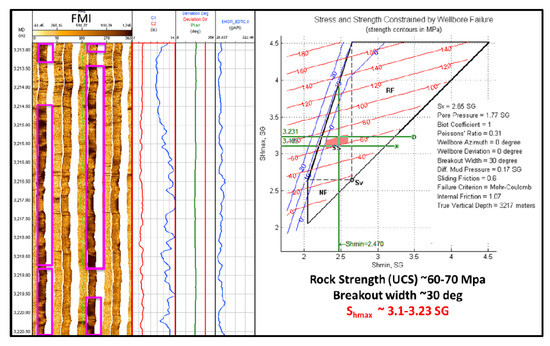
Figure 18.
SHmax magnitude determination of W205 at 3217 m TVD.
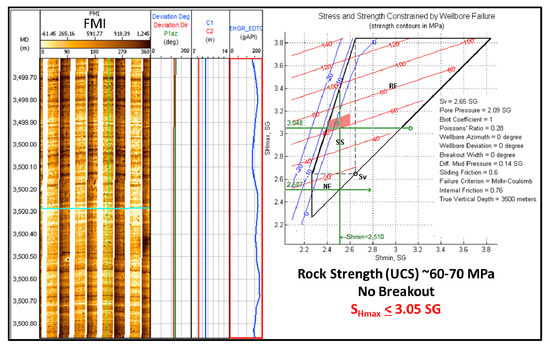
Figure 19.
SHmax magnitude determination of W205 at 3500 m TVD.
3.4.4. Horizontal Stress Model
The log-derived Shmin and SHmax magnitudes estimated by the “constant strain” method are determined as [18,19,20]:
where ν is the static Poisson’s ratio, α is the Biot coefficient, Pp is pore pressure (MPa), E is the static Young’s modulus (GPa), Sv is the vertical stress (MPa), εh and εH are the tectonic strain in the Shmin and SHmax direction. An accurate geomechanical model should be able to explain any geomechanical problems experienced during drilling. Once a geomechanical model is constructed, the model is combined with the actual mud Weights used to drill the wells to see if it is able to predict the downhole conditions described in the drilling reports and shown by the image and calliper data.
The final stress and pressure model of the well is determined by the effective stress ratio and the logging calculation method. Figure 20, Figure 21, Figure 22 and Figure 23 show the final stress and pore pressure models for the wells using the effective stress ratio method and log-derived stress modelling method. The ESR of Shmin and SHmax was derived to be 0.7 and 1.2 respectively. The ESR of Shmin and SHmax curve were used for profiling the SHmax magnitudes from the surface to the top of Longmaxi formation which constant strain method was used to calculate the stress for the Longmaxi reservoir. The derived SHmax magnitudes show a strike-slip stress regime for the entire interval, Shmin < Sv < SHmax.
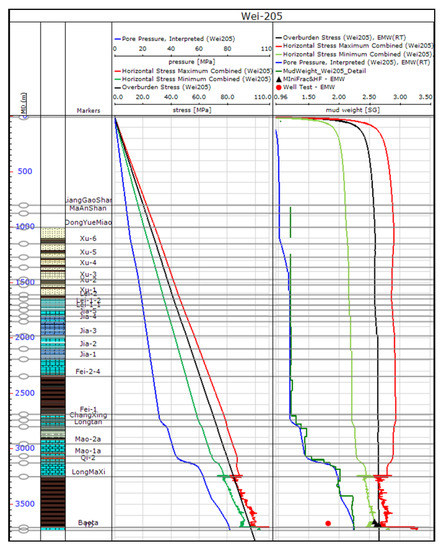
Figure 20.
Final stress and pore pressure model for W205.
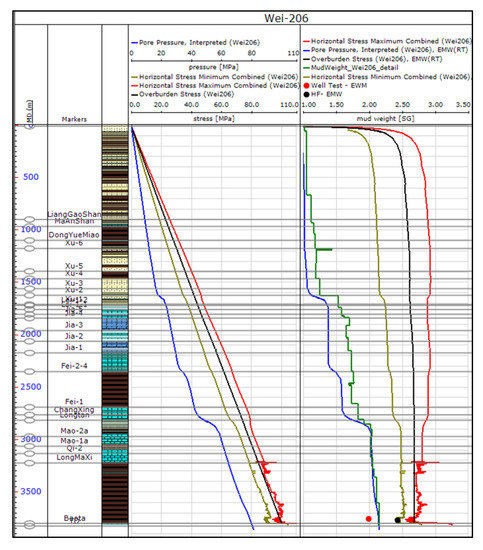
Figure 21.
Final stress and pore pressure model for W206.
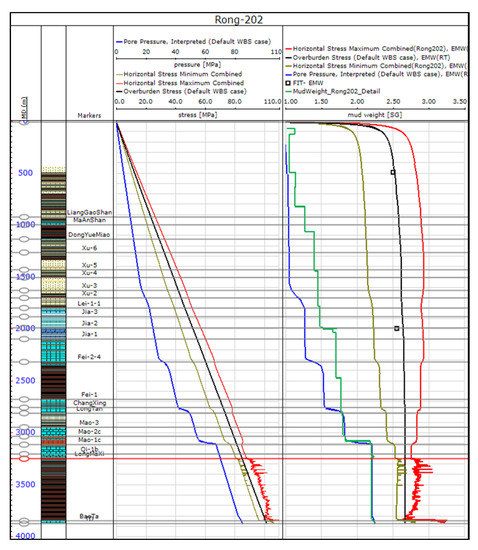
Figure 22.
Final stress and pore pressure model for R202.
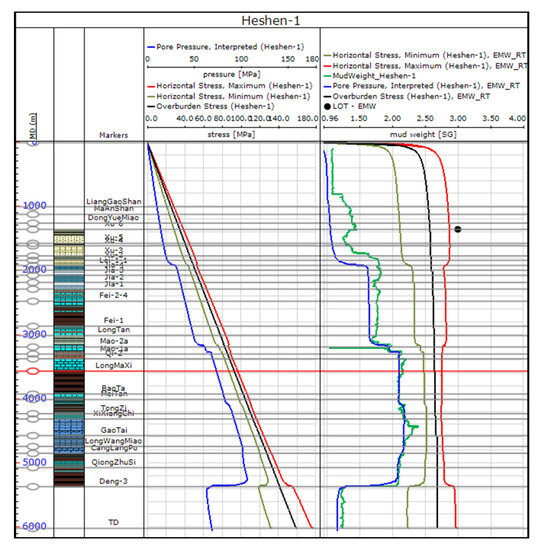
Figure 23.
Final stress and pore pressure model for H1.
4. Discussion
For oil and gas reservoirs, a precise geomechanical model should be able to reasonably interpret all the geomechanical events during the drilling. The established geomechanical model is combined with the actual drilling mud weights to predict the drilling events observed during the drilling process and verified by the logging and caliper data after drilling. Mud weights are designed to keep the well stable and too low mud weights will lead to wellbore failure. If the mud weight is too low, the wellbore will collapse. If the mud weight is too high, the drilling will induce the tensile fracture. This wellbore failure development follows law of rock mechanics and is predictable. Breakout development can be predicted by calculating the stress concentration around a well and seeing if the rocks are strong enough to prevent these breakouts with certain mud weights in the wellbore.
The verification process involves the following: the geomechanical models and the mud weights in the hole were used to forward model the occurrence of wellbore breakouts or hole failure. These possible predicted breakouts are compared to observations (caliper) of wellbore failure and also drilling experiences. The mud weights used in the breakout verification represent the lowest mud weight the particular hole interval saw during operations. Drilling experiences that may indicate hole instability are tight hole, over-pull, cavings, pack-off, stuck pipe, excessive torque/drag, and so on.
5. Conclusions
This paper selects the log data of six wells of NDNR blocks to establish a geomechanical model. The model was verified by drilling events, and the results show that the prediction results of the geomechanical model match the actual observations. The establishment of the geomechanical model provides guidance for the subsequent drilling construction in this area and can be used to effectively avoid complex drilling events such as collapse, kick, and lost circulation (mud losses) along the entire well.
- (1)
- NDNR blocks appear to be associated with a strike-slip (SS) stress regime. However, the three principal stresses are very close to each other in the Longmaxi Formation because of the effect of high overpressure. Such a mechanism could lead to transitional normal faulting or reverse faulting stress regimes at certain depth.
- (2)
- The orientation of SHmax was inferred to be 106–130° N based on the wellbore failure interpreted from the image logs and the calliper data recorded in offset wells. The orientation of SHmax in the study area is consistent with the regional trend in the Sichuan Basin.
- (3)
- The pore pressure appears to be approximately hydrostatic from the surface to 1000 m TVD and then becomes overpressured from the Xujiahe Formation. The overpressure generally increases with depth but varies in different formation. The overpressure for H1 from the Jialingjiang to Feixianguan formation appears to be higher than in other offset wells. The Longmaxi formation is generally highly overpressured with a maximum Pp gradient close to 2.1–2.2 SG.
- (4)
- The rock matrix is relatively strong in general and the P10 UCS is 55–60 MPa in Longmaxi Formation. The UCS of H1 is slightly higher than other offset wells across the formation.
Author Contributions
Conceptualization, investigation and writing—original draft preparation, M.Z. and H.L.; methodology, H.T.; software, M.Z.; validation of model, M.Z. and H.L.; writing—review and editing, M.Z., H.L. and J.Z.; project administration and funding acquisition, H.T. and C.J.; English polishing and editing, M.Z. and H.L. All authors have read and agreed to the published version of the manuscript.
Funding
This research was funded by the Natural Science Foundation of China, grant number 51674211 and the Key Projects of the Natural Science Foundation, China, grant number 51534006).
Acknowledgments
We are very grateful to Southwest Oil and Gas Field Company, PetroChina, for their kind help and support to complete this study and the permission to publish the results. We thank all the editors and reviewers for their helpful comments and suggestions, and also we thank Feng Gui from Baker Hughes and Botao Lin from China University of Petroleum (Beijing), for their kind help of paper writing and revision.
Conflicts of Interest
The authors declare no conflict of interest. The funders had no role in the design of the study; in the collection, analyses, or interpretation of data; in the writing of the manuscript, or in the decision to publish the results.
References
- Ma, X.H. Natural gas and energy revolution: A case study of Sichuan-Chongqing gas province. Nat. Gas Ind. 2017, 37, 1–8, (In Chinese with English Abstract). [Google Scholar] [CrossRef]
- Li, H.; Tang, H.M.; Zheng, M.J. Micropore Structural Heterogeneity of Siliceous Shale Reservoir of the Longmaxi Formation in the Southern Sichuan Basin, China. Minerals 2019, 9, 548. [Google Scholar] [CrossRef]
- Tang, X.L.; Jiang, Z.X.; Li, Z.; Gao, Z.Y.; Bai, Y.Q.; Zhao, S.; Feng, J. The effect of the variation in material composition on the heterogeneous pore structure of high-maturity shale of the Silurian Longmaxi formation in the southeastern Sichuan Basin, China. J. Nat. Gas Sci. Eng. 2015, 23, 464–473. [Google Scholar] [CrossRef]
- Brudy, M.; Zoback, M.D. Compressive and tensile failure of boreholes arbitrarily-inclined to principal stress axes: Application to the KTB boreholes, Germany. Int. J. Rock Mech. Min. Sci. 1993, 30, 1035–1038. [Google Scholar] [CrossRef]
- Chang, C.; Zoback, M.D.; Khaksar, A. Empirical relations between rock strength and physical properties in sedimentary rocks. J. Petrol. Sci. Eng. 2006, 51, 223–237. [Google Scholar] [CrossRef]
- Khaksar, A.; Taylor, P.G.; Fang, Z.; Kayes, T.; Salazar, A.; Rahman, K. Rock strength from core and logs: Where we stand and ways to go. In Proceedings of the 2009 SPE EUROPEC/EAGE Annual Conference and Exhibition, Amsterdam, The Netherlands, 8–11 June 2009. [Google Scholar]
- Castagna, J.P.; Batzle, M.L.; Eastwood, R.L. Relationships between compressional-wave and shear-wave velocities in elastic silicate rocks. Geophysics 1985, 50, 571–581. [Google Scholar] [CrossRef]
- Gardner, G.H.F.; Gardner, L.W.; Gregory, A.R. Formation velocity and density- the diagnostic basics for stratigraphic traps. Geophysics 1974, 39, 770–780. [Google Scholar] [CrossRef]
- McNally, G.H. Estimation of coal measures rock strength using sonic and neutron logs. Geoexploration 1987, 24, 381–395. [Google Scholar] [CrossRef]
- Landers, J.; Gor, G.Y.; Neimark, A.V. Density functional theory methods for characterization of porous materials. Colloids Surf. A Physicochem. Eng. Asp. 2013, 437, 3–32. [Google Scholar] [CrossRef]
- Lee, J.W.; Nilson, R.H.; Templeton, J.A.; Griffiths, S.K.; Kung, A.; Wong, B.M. Comparison of Molecular Dynamics with Classical Density Functional and Poisson-Boltzmann Theories of the Electric Double Layer in Nanochannels. J. Chem. Theory. Comput. 2012, 8, 2012–2022. [Google Scholar] [CrossRef]
- Eaton, B.A. The equation for geopressure prediction from well logs. In Fall Meeting of the Society of Petroleum Engineers of AIME; Society of Petroleum Engineers: Dallas, TX, USA, 1975; SPE 5544. [Google Scholar]
- Zhang, J.C. Pore Pressure Prediction from Well Logs Methods, Modifications, and New Approaches. Earth-Sci. Rev. 2011, 108, 50–63. [Google Scholar] [CrossRef]
- Militzer, H.; Stoll, R. Einige Beitraige der Geophysik zur primadatenerfassung im Bergbau. Neue Bergbautech. 1973, 3, 21–25. [Google Scholar]
- Eaton, B.A. The effect of overburden stress on geopressure prediction from well logs. J. Petrol. Technol. 1972, 24, 929–934. [Google Scholar] [CrossRef]
- Zoback, M.D.; Barton, C.A.; Brudy, M.; Castillo, D.A.; Finkbeiner, T.; Grollimund, B.R.; Moos, D.B.; Peska, P.; Ward, C.D.; Wiprut, D.J. Determination of stress orientation and magnitude in deep wells. Int. J. Rock Mech. Min. Sci. 2003, 40, 1049–1076. [Google Scholar] [CrossRef]
- King, M.S. Static and dynamic elastic properties of rocks from the Canadian shield. Int. J. Rock Mech. Min. Sci. Geomech. Abst. 1983, 20, 237–241. [Google Scholar] [CrossRef]
- Moos, D.; Zoback, M.D. Utilization of observations of well bore failure to constrain the orientation and magnitude of crustal stresses: Application to continental, Deep Sea Drilling Project and ocean drilling program boreholes. J. Geophy. Res. 1990, 95, 9305–9325. [Google Scholar] [CrossRef]
- Moos, D.; Zoback, M.D. In situ stress measurements in the NPR hole. Off. Sci. Tech. Inf. Tech. Rep. 2001. [Google Scholar] [CrossRef]
- Zoback, M.D.; Healy, J.H. In situ stress measurements to 3.5 km depth in the Cajon Pass scientific research drill hole: Implications for the mechanics of crustal faulting. J. Geophy. Res. 1992, 97, 5039–5057. [Google Scholar] [CrossRef]
- Li, H.; Tang, H.M.; Qin, Q.R.; Zhou, J.L.; Qin, Z.J.; Fan, C.H.; Su, P.D.; Wang, Q.; Zhong, C. Characteristics, formation periods and genetic mechanisms of tectonic fractures in the tight gas sandstones reservoir: A case study of Xujiahe Formation in YB area, Sichuan Basin, China. J. Petrol. Sci. Eng. 2019, 178, 723–735. [Google Scholar] [CrossRef]
- Dubinya, N.V. An Overview of Wellbore Methods of Investigating Stress State of the Upper Layers of the Earth’s Crust. Izv. Ppys. Solid Earth 2019, 55, 311–326. [Google Scholar] [CrossRef]
- Sone, H.; Zoback, M.D. Viscous relaxation model for predicting least principal stress magnitudes in sedimentary rock. J. Petrol. Sci. Eng. 2014, 124, 416–431. [Google Scholar] [CrossRef]
- Peska, P.; Zoback, M.D. Compressive and tensile failure of inclined well bores and determination of in situ stress and rock strength. J. Geophy. Res. 1995, 100, 12791–12811. [Google Scholar] [CrossRef]
- Lavrov, A.; Larsen, I.; Bauer, A. Numerical Modelling of Extended Leak-Off Test with a Pre-Existing Fracture. Rock Mech. Rock Eng. 2016, 49, 1359–1368. [Google Scholar] [CrossRef]
- Nolte, K.G. Determination of fracture parameters from fracturing pressure decline. In Proceedings of the SPE Annual Technical Conference and Exihibition, Las Vegas, NV, USA, 23–26 September 1979. SPE 8341. [Google Scholar]
- De Bree, P.; Walters, J.V. Micro/minifrac test procedures and interpretation for in situ stress determination. Int. J. Rock Mech. Min. Sci. Geomech. Abst. 1989, 26, 515–521. [Google Scholar] [CrossRef]
© 2020 by the authors. Licensee MDPI, Basel, Switzerland. This article is an open access article distributed under the terms and conditions of the Creative Commons Attribution (CC BY) license (http://creativecommons.org/licenses/by/4.0/).