Article

Separated Flow Control of Small Horizontal-Axis Wind Turbine Blades Using Dielectric Barrier Discharge Plasma Actuators

1
Department of Mechanical Engineering, Tokyo University of Science, Tokyo 125-8585, Japan
2
Department of Mechanical Engineering and Robotics, Shinshu University, Nagano 386-8567, Japan
3
Department of Aeronautics and Astronautics, The University of Tokyo, Kanagawa 252-5210, Japan
4
Institute of Fluid Science, Tohoku University, Miyagi 980-8577, Japan
5
Department of Mechanical Science and Engineering, Kogakuin University, Tokyo 163-8677, Japan
6
Department of Aerospace Engineering, Tohoku University, Miyagi 980-8579, Japan
7
Department of Information and Computer Technology, Tokyo University of Science, Tokyo 125-8585, Japan
*
Author to whom correspondence should be addressed.
Energies 2020, 13(5), 1218; https://doi.org/10.3390/en13051218
Submission received: 16 January 2020 / Revised: 2 March 2020 / Accepted: 4 March 2020 / Published: 6 March 2020
(This article belongs to the Special Issue Control of Dynamic Flow Fields)

Abstract

:
The flow control over the blades of a small horizontal-axis wind turbine (HAWT) model using a dielectric barrier discharge plasma actuator (DBD-PA) was studied based on large-eddy simulations. The numerical simulations were performed with a high-resolution computational method, and the effects of the DBD-PA on the flow fields around the blades were modeled as a spatial body force distribution. The DBD-PA was installed at the leading edge of the blades, and its impacts on the flow fields and axial torque generation were discussed. The increase in the ratios of the computed, cycle-averaged axial torque reasonably agreed with that of the available experimental data. In addition, the computed results presented a maximum of 19% increase in the cycle-averaged axial torque generation by modulating the operating parameters of the DBD-PA because of the suppression of the leading edge separation when the blade’s effective angles of attack were relatively high. Thus, the suppression of the leading edge separation by flow control can lead to a delay in the breakdown of the tip vortex as a secondary effect.

Graphical Abstract

1. Introduction

Wind turbines convert the kinematic energy of wind into electrical energy. A horizontal-axis wind turbine (HAWT) is a common type of wind turbine, and usually consists of three main components, namely, a rotor, generator, and surrounding structure. The rotor includes the blades, where the aerodynamics of each blade have been sufficiently studied for more efficient and stable power generation [1]. However, the flow around wind turbine blades is sometimes separated due to the environmental flow around them, and this separation often causes unsteadiness and vibrations. Hence, flow separation is one of the main issues that disrupts the stable and robust power generation. Thus, in the current study, we investigate the control of the separated flow over wind turbine blades using a dielectric barrier discharge plasma actuator (DBD-PA). Generally, a DBD-PA has a greater advantage in structure, energy consumption, size, and weight in comparison with conventional devices, such as jet blowing devices [2]. In addition, it can be easily installed on the surfaces of existing objects and mechanical devices. Figure 1a shows a schematic of a typical-type DBD-PA, which consists of two thin electrodes and a dielectric material. When an alternating-current (AC) voltage with high volts (an order of 103) and driving frequencies (an order of 103–104) is applied between the two electrodes, atmospheric-pressure non-equilibrium plasma is generated, which produces a jet flow above the dielectric material [3,4]. The relationship between the velocity of the induced wall jet and the parameters of the DBD-PA was experimentally investigated. Moreover, the parameters of the DBD-PA include operational parameters, such as the input voltage, frequency, and waveform, and geometric parameters, such as the electrode height, length, and gap [5,6,7,8,9,10,11,12]. The results [5,6,7,8,9,10,11,12] demonstrate that if the electrodes of the DBD-PA are geometrically optimized, then the time-averaged maximum velocity of the wall jet can reach up to 7 m/s, and if the multi-frequency of modulation is adopted as the input waveform (we called it a burst modulation, see Figure 1b), then the induced flow shows a rich spectrum in the frequency characteristics. Figure 1b shows the waveform of input AC voltage in the case of burst modulation. In Figure 1b, Vpp, fbase, fburst, Ton, and Tburst represent peak-to-peak magnitude and base frequency of the input AC voltage, the burst frequency, the duration in which the actuation of the DBD-PA is on, and the time period of burst modulation (Tburst = 1/fburst), respectively.
With knowledge of the fundamental characteristics of DBD-PAs and the results of their usage [5,6,7,8,9,10,11,12], a DBD-PA-based flow control was applied to stalled stationary airfoils where massive flow separation occurs. Improvements in the aerodynamic performance of the stalled airfoils have been reported in previous investigations [7,8,11,12,13,14,15,16,17]. For example, Sato et al. [13,14,15] presented the effective operational parameters of DBD-PAs based on the results of more than 200 large-eddy simulations (LES) and the mechanisms of suppression of separated flows from the leading edge of an airfoil under a low Reynolds number (O(104)) condition. Moreover, the suppression of the separated flow from the leading edge of the airfoil using a DBD-PA with burst modulations at a chord-based Reynolds number of 105 [15,16] and 106 [15,17] was demonstrated based on the results of LES. Recently, Fujii [18] provided a comprehensive review based on previous efforts [13,14,15,16,17] and also presented a further possibility of airfoil-flow control using a DBD-PA-based flow control based on the results of LES and other related experiments.
Recently, a DBD-PA-based flow control was applied to the blades of HAWTs [19,20,21,22,23,24,25,26,27]. Table 1 and Table 2 show that each study evaluated the performance of the DBD-PA-based flow control technique while taking into consideration different configurations of HAWTs during different flow conditions. In Table 1 and Table 2, there are several nondimensional parameters (i.e., the Reynolds number Rec, tip-speed ratio λ, reduced frequency k, Mach number M, and duty ratio (burst ratio, BR). They are defined as follows:
Re c = ρ U c μ , λ = 2 π f r o t ( b + r r o o t ) U , k = π f r o t c U , M = U t i p a , BR = T o n T b u r s t ,
where ρ, μ, U, Utip, a, c, b, rroot, and frot, represent the density of air, the viscosity of air, the velocity of air, the velocity of blade tip, speed of sound of air, the chord length of blade, the radial length at the root of blade from the center of rotation, and the rotational frequency of blade, respectively, and subscript ∞ indicates the quantities in the freestream condition. Moreover, certain improvements in torque generation due to the DBD-PA-based flow control technique have been reported [19,20,21,22,23,24,25,26,27]. Of note, all the cases attached the DBD-PAs near the leading edges of the turbine blades and utilized the burst modulation with the duty cycle. Moreover, Matsuda et al. [19,20] and Mitsuo et al. [25] measured the change in the output power due to the variation of the yaw angle (Φyaw) of the freestream coming to the rotational plane of a HAWT. Their results showed that decreases in the average power output took place when the yaw angle was high. In addition, a rotating stall around a small-scale HAWT [26] was experimentally studied recently, and the smart rotor control [27] of DBD-PAs was characterized and assessed without considering the yaw angle of the freestream. The flow field around the blade was also visualized using a phase-locked particle image velocimetry. Their results showed that a DBD-PA placed along the span produces a chord-wise body force and has very little effect on flow separation, even with the burst modulation. By contrast, a DBD-PA installed along the blade chord generates a body force into the radial directions, and this case successfully mitigates the rotating stall [26]. The torque due to the aerodynamic drag was reduced by up to 22% at a tip-speed ratio of 3.7, suppressing the stall over the outboard on 50% of the blade [26]. Moreover, Greenblatt et al. [28] studied pulsed, leading edge DBD-PAs on a vertical-axis wind turbine (VAWT). The control of the dynamic stall of VAWT blades was successfully demonstrated, leading to up to a 38% increase in the turbine power output.
The above-mentioned studies have demonstrated the applicability of the DBD-PA-based flow control to wind turbine blades of different sizes and flow conditions. However, the effects of DBD-PAs on the three-dimensional flow structures around the blades have not been adequately understood yet. The objectives of the current study are to investigate the control mechanisms of the separated flow around the wind turbine blades of a HAWT and analyze the controlled flow structures around the blades using a DBD-PA. To this end, LES of the unsteady separated flow around the blades and the flow induced by the installed DBD-PA at the leading edge of the blade were conducted. The outline of this paper is as follows. First, the model information, flow conditions, and operational conditions of a DBD-PA are explained. Second, the numerical methods adopted in this study are briefly described. Then, the results computed in the cases with/without flow control are presented, and the key observations of the flow control effects using a DBD-PA are discussed. Finally, the conclusion is drawn.

2. Case Description

Flow Conditions and Wind Turbine Blade Model

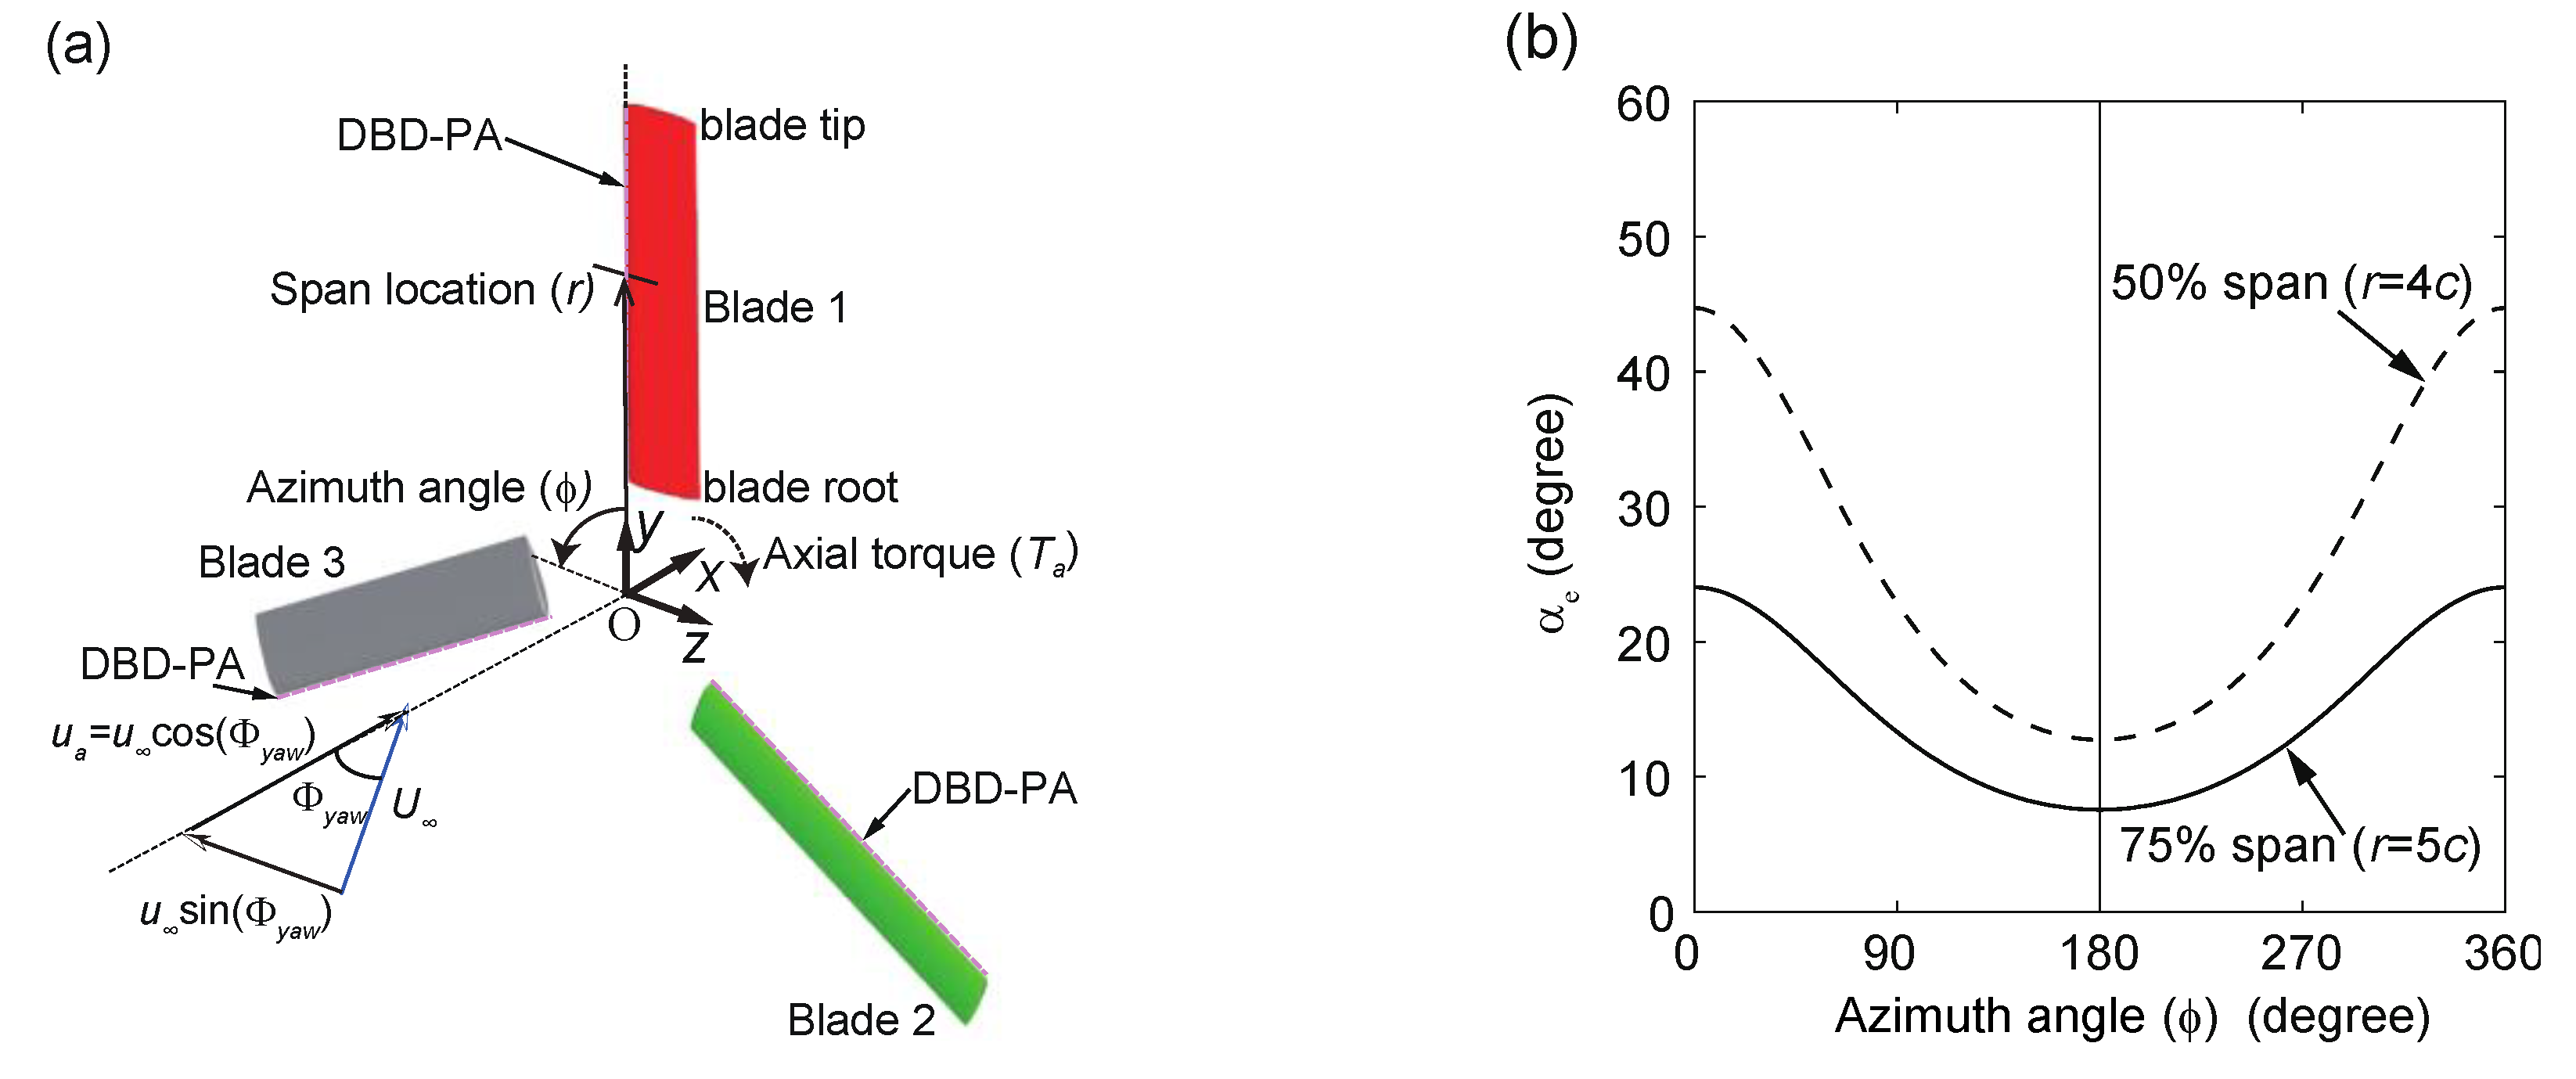
The current study considers a wind turbine blade configuration and a flow condition that are based on a model reported by Mitsuo et al. [25]. The experimental study [25] was mainly designed to analyze the effects of flow control around a simple HAWT blade model using a DBD-PA. Figure 2a shows the configuration of the HAWT blade considered in the current study. The cross-sectional shape of the blade is a NACA0012 airfoil. The chord length of the blade c was 0.2 m, and its span length b was 1.0 m. The blade was installed with a geometrical angle of attack αg of 10 degrees with regard to the rotational plane, and it revolved around the x-axis. Its rotational frequency frot was 174 rpm. The position of the blade was represented using the azimuth angle ϕ(t). For example, ϕ of 0 degree and 90 degrees corresponds to a blade with a 12 and 9 o’clock direction from the upstream viewpoint, respectively. The freestream velocity U was set as 10 m/s, and the tilt angle of the freestream was 40 degrees (i.e., yaw angle, Φyaw) with respect to the rotational axis. Of note, although this flow condition was consistent with that of a previous experiment [25], it may or may not often occur in practice. Thus, for simplification purposes, the current study did not include a nacelle and a pole in all the computations (see Figure 2a). All the nondimensional parameters were computed based on Equation (1), and Rec, λ, k, and M were equal to 1.3 × 10⁵, 2.369, 0.182, and 0.07, respectively.
Considering the aerodynamic analysis of the wind turbine blade, information on the instantaneous effective angle of attack αe(t) at an arbitrary blade span location is useful. Thus, αe(t) at the radial position of the blade from the center of the rotational point (r) was estimated using the following formula based on the blade element theory:
α e = tan 1 ( u a u v ) α g ,
u a = U cos ( Φ y a w ) ,
u v = ω r + U sin ( Φ y a w ) cos ( ϕ ( t ) ) ,
where r, ϕ(t), ua, uv, Φyaw, and ω represent the radial location of the blade from the center of the rotation, azimuth angle of the blade, flow velocity normal to the rotational plane, effective incoming flow at the cross-section of the blade, yaw angle, and angular frequency, respectively. Figure 2b plots the time histories of αe for the selected span positions. The effective angle of attack αe reduces when the azimuth angle ϕ varies from 0 degree to 180 degrees. The cycle-averaged effective angles of attack at 50% and 75% spans from the root were 28.7 and 15.8 degrees, respectively. In the stationary airfoil cases, the stall angle of the NACA0012 at Rec = 1.0 × 10⁵ was approximately 11 degrees [29].

3. Materials and Methodologies

3.1. Governing Equations

Three-dimensional Navier–Stokes (NS) equations, nondimensionalized by the freestream density, freestream velocity, and chord length of the blade, were employed as the governing equations. In the nondimensional form, the governing equations are represented as follows:
ρ t + ρ u k x k = 0 ,
ρ u i t + ( ρ u i u k + p δ i k ) x k = 1 Re c τ i k x k + D c S i ,
e t + ( ( e + p ) u k ) x k = 1 Re c ( τ i k x k 1 ( γ 1 ) Pr M 2 q k x k ) + D c S k u k ,
S i = Q c E i ,
where xi, ui, qi, ρ, p, e, τij, Si, δij, γ, t, and Dc denote the nondimensional forms of the positional vector, velocity vector, heat flux vector, density, pressure, total energy per unit volume, stress tensor, body force vector, Kronecker delta, ratio of specific heats, time, and nondimensional parameter for the DBD-PA body force, respectively. The Prandtl number Pr is defined as follows:
Pr = μ C P κ ,
where κ and Cp represent the thermal conductivity and constant pressure specific heat, respectively. The last terms on the right-hand side of Equations (6) and (7) represent the momentum and energy added to the unit volume by the DBD-PA body force model. The description of these terms is presented in the next subsection. The system is closed and the equation for the ideal gas of state is written as follows:
p = ( γ 1 ) ( e 1 2 ρ u k u k ) ,
where p and γ represent the static pressure and the specific-heat ratio.

3.2. DBD-PA Body Force Model

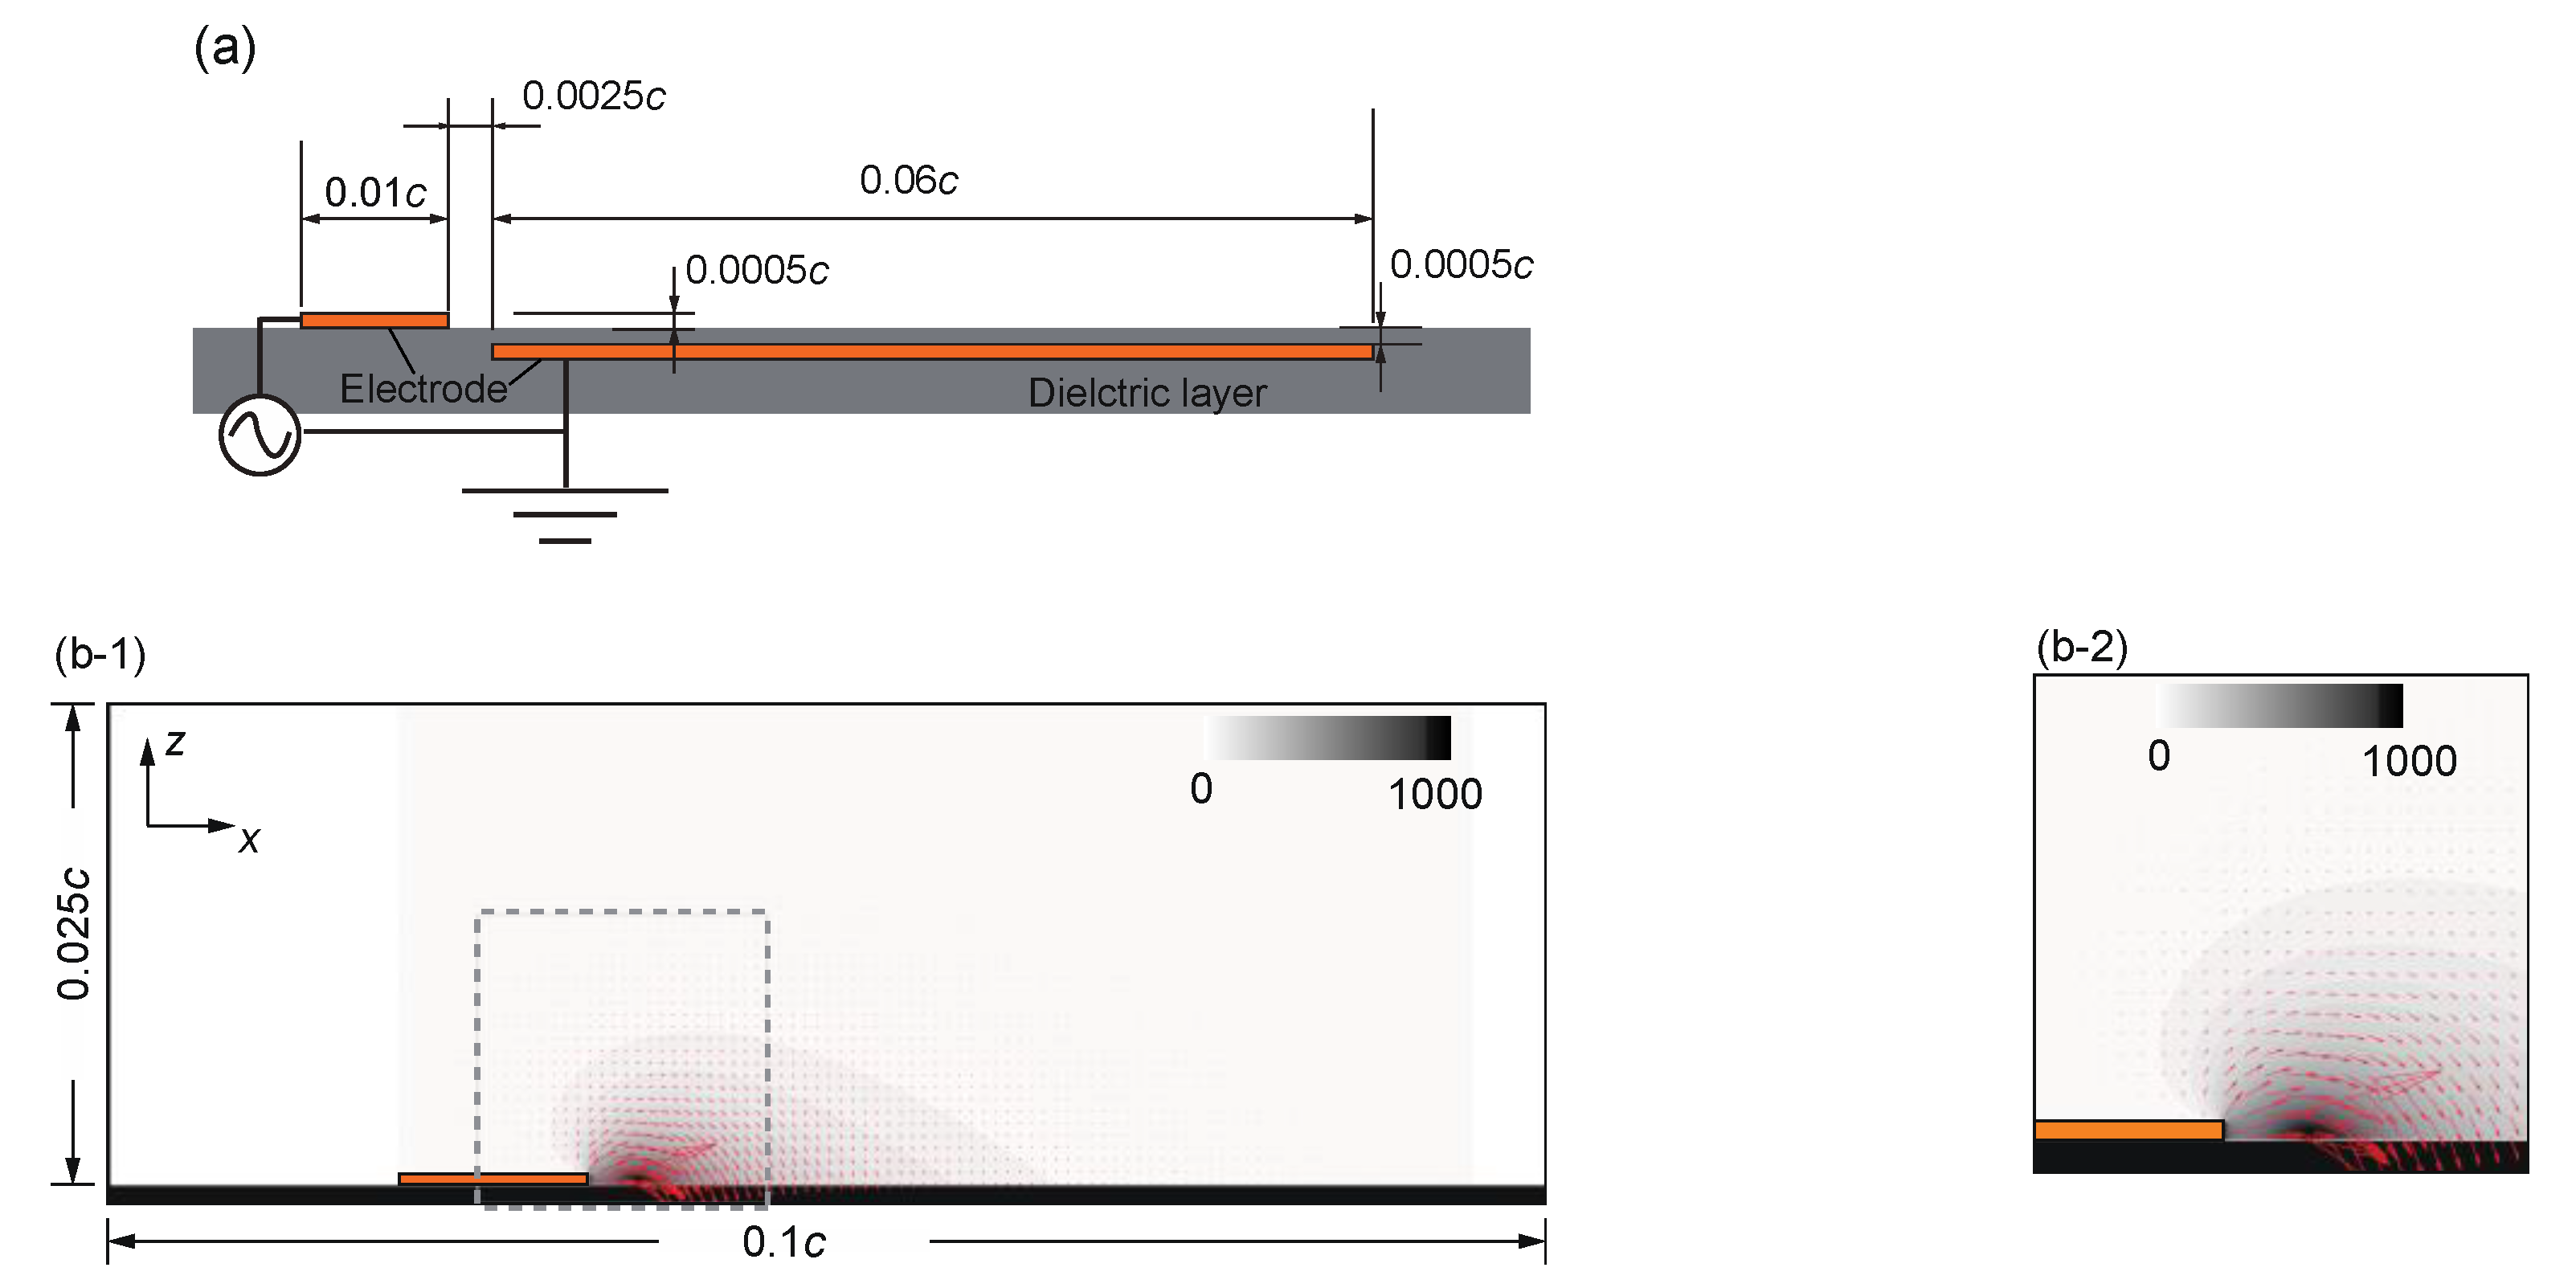
The effects of the DBD-PA body force were represented as DcSi and DcSiuk in the NS equations. There were several DBD-PA body force models [30,31,32,33,34], and this study adopted one of them [33]. Detailed information regarding the adopted DBD-PA body force model can be found in Aono et al. [33], and a brief description of the model is given below. Figure 3 shows the sketch of the modeled DBD-PA, contour of the magnitude of the nondimensional body force, and body force vectors near the exposed electrode. The spatial distribution of the body force was similar to that of the Suzen–Huang’s model [32]. The body force vector in the component along the blade span was set to zero because the uniform geometry of the DBD-PA along the blade span was considered. The body force model rotated 90 degrees counterclockwise about the blade span axis and then attached to the blade surface at the leading edge of the blade.
The magnitude of the DBD-PA body force was represented by multiplying the nondimensional parameter (Dc) by the body force vectors (Si) in the NS equations (Equations (6) and (7)). The definition of Dc is as follows:
D c = Q c , r e f E r e f c ρ U 2 ,
where Qc and Ei denote the electric charge and electric-field vector, respectively, and subscript ref denotes the reference value. Moreover, we set Qc,ref and Eref as the maximum values of Qc and E in the pre-computation of the model, respectively [32]. In addition, the temporal variation in the body force distribution was formulated by the multiplication of the body force vectors (Si) and sin2(2πFbaset). Here, Fbase is the nondimensional base frequency of the input AC voltage (Fbase = fbasec/U), and was set at 170, which is higher than that of the fluctuation of flow. This model assumed that the temporal variation of the body force can be characterized as push/push [35]. The input waveform of the burst modulation was generated based on the nondimensional burst frequency (F+ = fburstc/U) and BR as shown in Figure 1b.

3.3. Note of Reliability of Approach and Adopted DBD-PA Body Force Model

In this subsection, the reliability of the approach adopted in this study and adopted DBD-PA body force model are noted. As described in Section 3.1 and Section 3.2, in our approach, before conducting flow-control simulations, the partial differential equations of the Suzen-Huang’s model [32] with a static boundary condition were numerically solved in order to calculate the body force vectors (Si) that represent the maximum forcing. After that, we incorporated this electro-hydrodynamic body force vector into the right-hand side of the NS equations as the body force terms, with an assumption that the magnitude of the distribution body force was in proportion to the boundary condition. The reliability the approach and the body force model were investigated in our previous studies [13,14,15,33,34,36]. In particular, the flow induced by the DBD-PA under the quiescent air condition [33,34] and the flow structures around the airfoil at the chord-based Reynolds number of 63,000 [13,14,15] and the circular disk at the diameter-based Reynolds number of 5000 [36] were reported. Setting the appropriate range of nondimensional parameter Dc was important in order to obtain the realistic range of time-averaged maximum induced velocity by the Suzen-Huang’s model with the burst modulations under the quiescent air condition and the reliable results of controlled effects using the DBD-PA. Therefore, we carried out several pre-computations of the flow field induced by the DBD-PA in a quiescent field in order to find the appropriate range of Dc. As a result, the maximum time-averaged induced wall-parallel velocities were close to 0.25U and 0.4U in the cases of burst modulation with Dc of 0.5, a BR of 10% and F+ of 1 and continuous actuation with Dc of 0.125, respectively. From this analysis and considering previous efforts [13,14,15,33,34,36], we think that induced flow and effects of control using the DBD-PA on the blades discussed in this study are sufficiently reliable.

3.4. Numerical Methods

In this study, an in-house fluid dynamic solver (LANS3D [37]) was used, and the NS equations were solved in the generalized curvilinear coordinates (ξ, η, ζ). The spatial derivatives of the convective, viscous terms, symmetric-conservative metrics [38], and Jacobian [38] were evaluated with a sixth-order compact difference scheme [39]. In addition, near the computational boundaries, including the inner boundaries resulting from the domain decomposition, a second-order, one-sided, and central formulas at the first and second grid points off the boundaries were used to evaluate the spatial derivatives because of the unavailability of a complete stencil of the six-order compact difference scheme. A tenth-order filtering [39,40] was used with a filtering coefficient of 0.4 to stabilize the computation. As for the time integration, an alternating direction implicit symmetric Gauss–Seidel method [41,42] was used. Moreover, a backward second-order difference formula was utilized for time integration, and three sub-iterations [43] were adopted to ensure the accuracy of time integration. The computational time step was 3.5 × 10⁻⁵c/U, which corresponds to the maximum local Courant number that is approximately equal to 30. All the grids were rigidly rotated around the origin of the coordinate, and the rotations of the blades were simulated. The coherent structure model [44] was used as a subgrid scale model of the LES, and a parallel computation was conducted using message passing interfaces. All the simulations were carried out using 18,800 cores of the K computer, which is based on distributed memory architecture of more than 640,000 cores [45]. The subroutines related to the compact finite differencing scheme in LANS3D were tuned for the K computer [46]. Moreover, efficient evaluation techniques of the symmetric conservative metrics [47] were adopted to reduce the computational time.

3.5. Computational Grids and Boundary Conditions

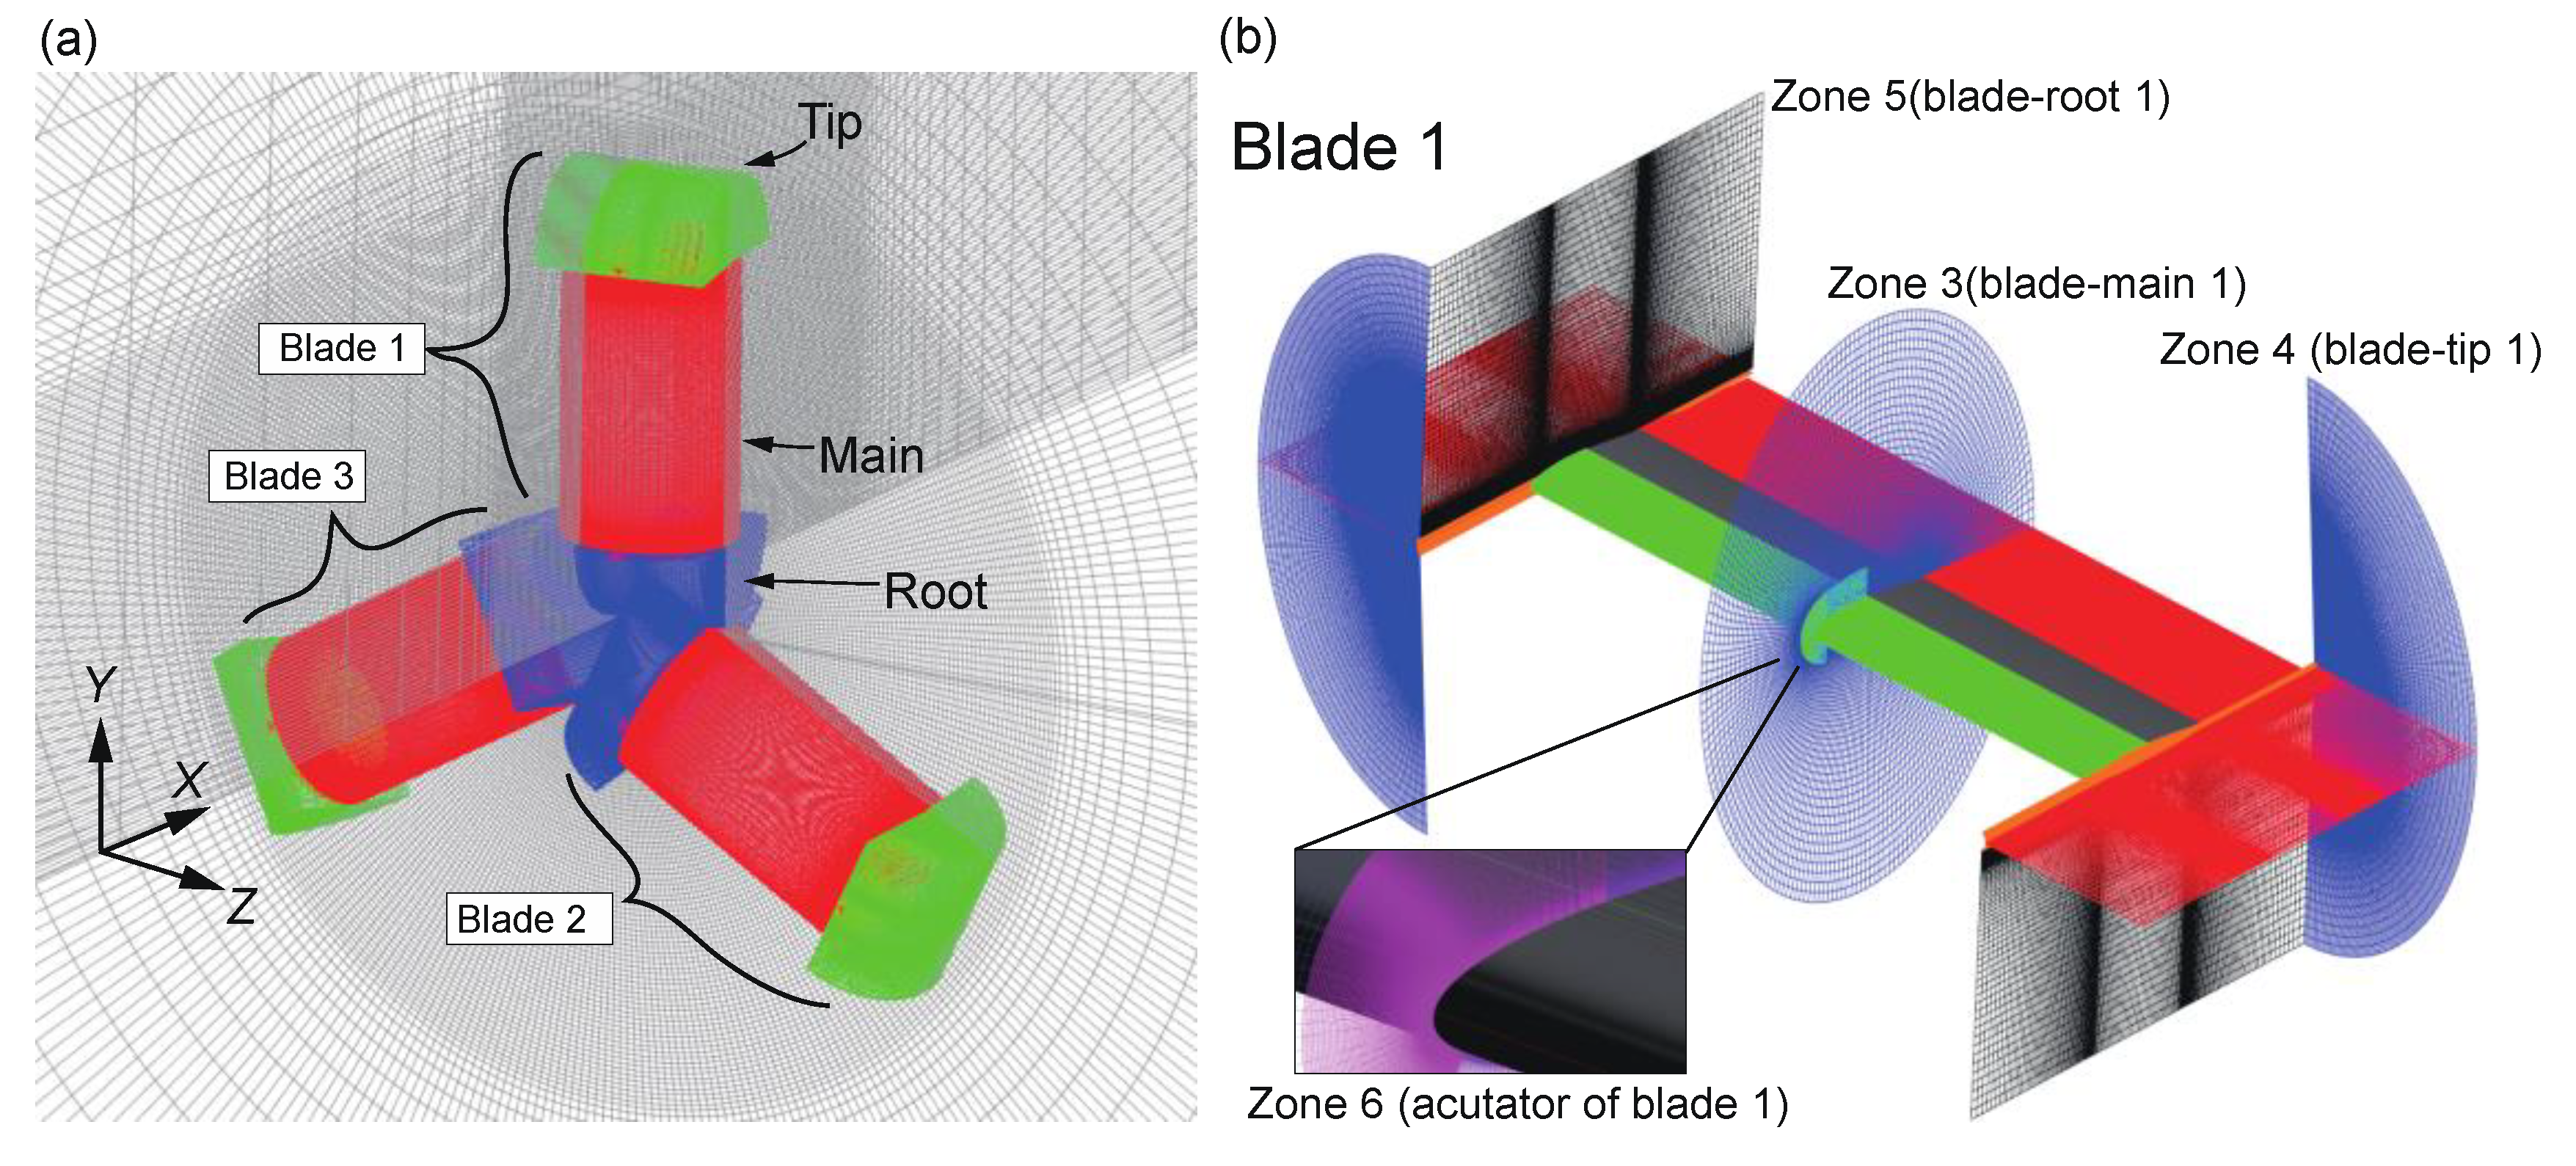
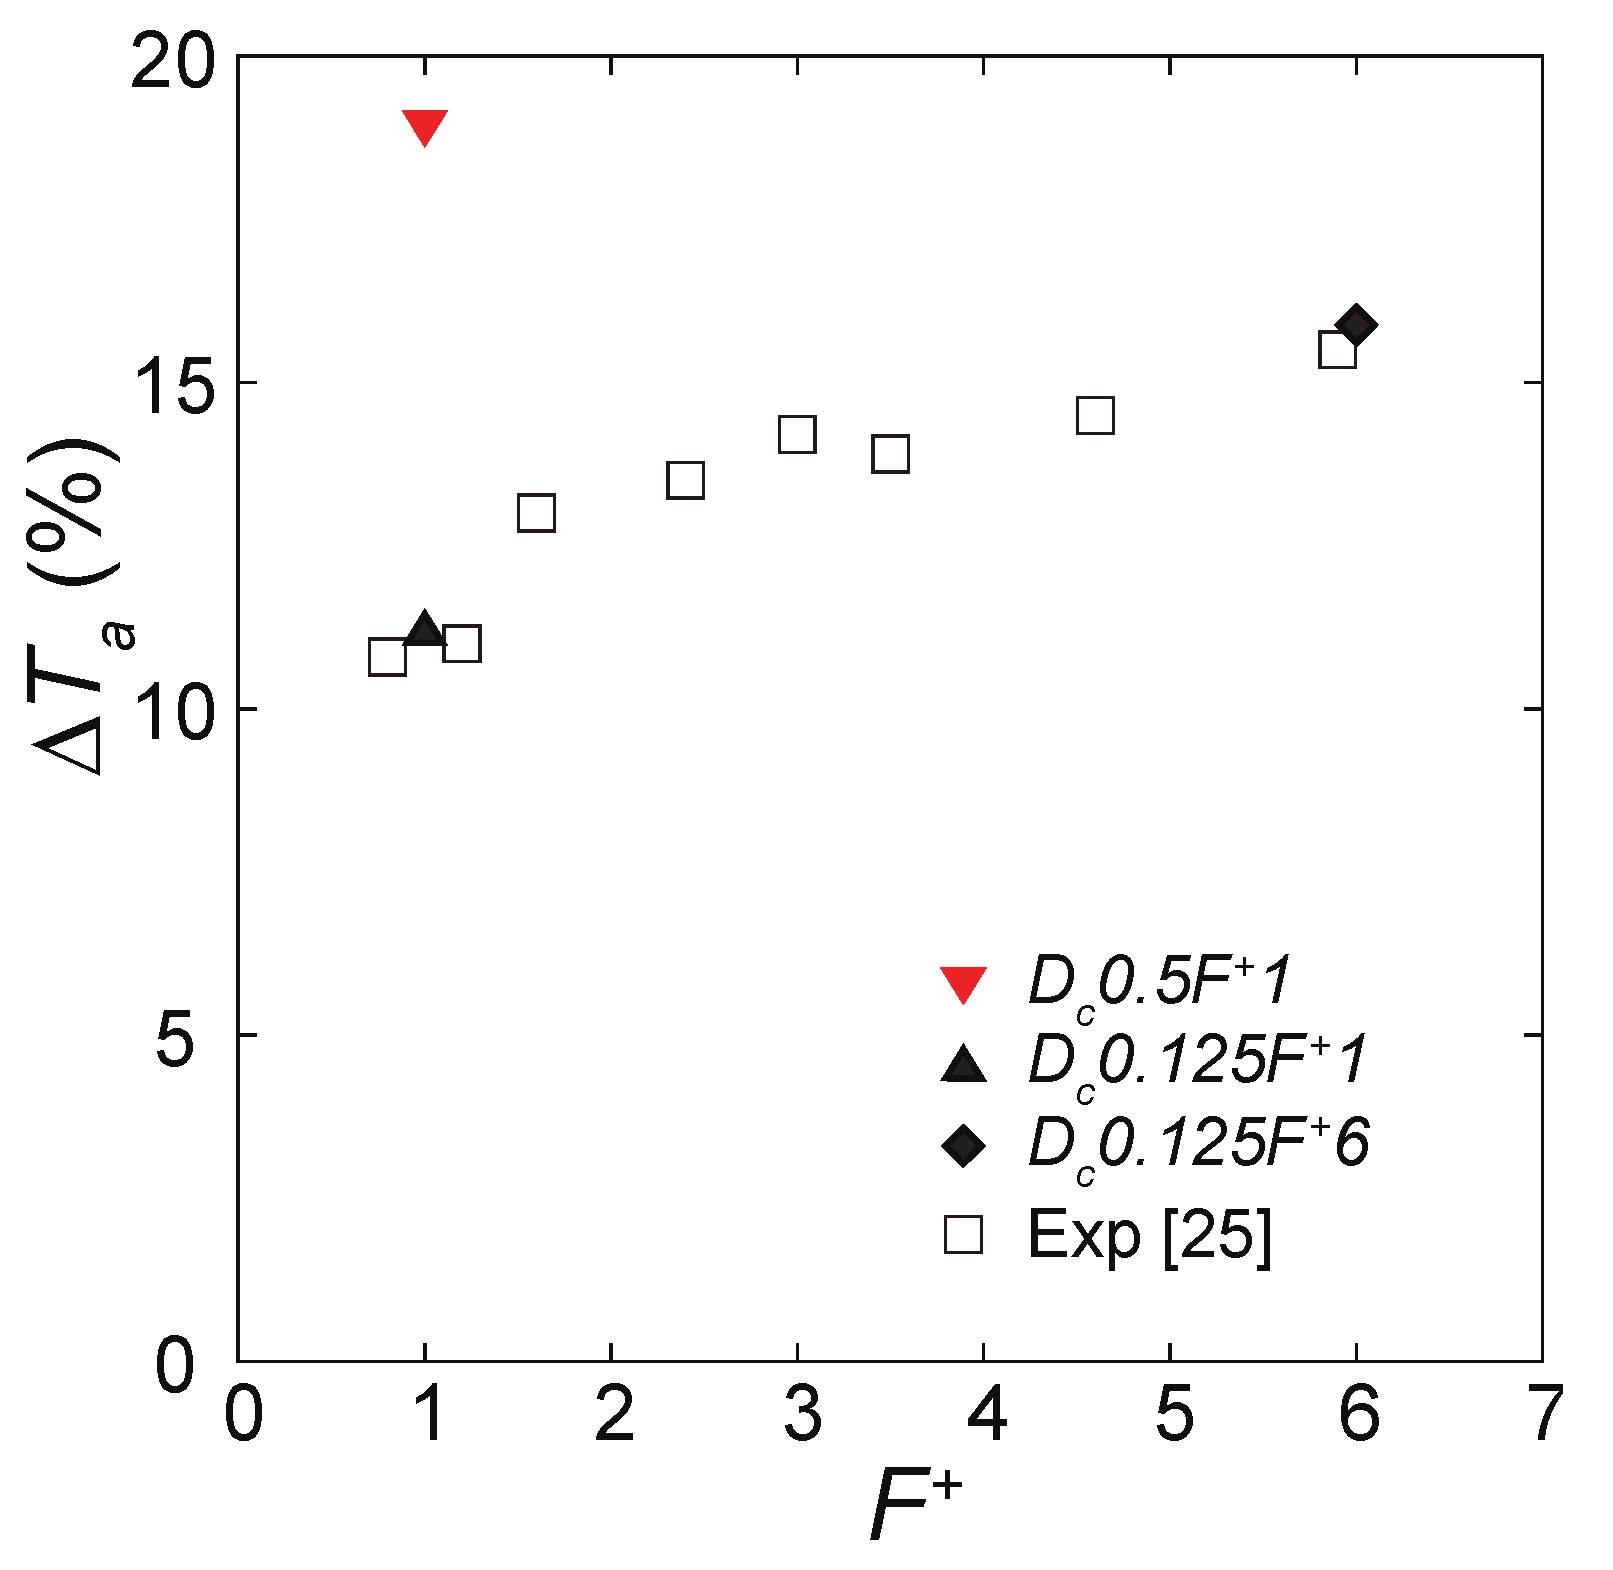
This study used the overset grid technique [48] to handle the region of the body force and the three wind turbine blades. Here, a single grid is called a zone. Table 3 shows the number of grid points of each grid (zone), where the total number of grid points is approximately 700 million. Figure 4 shows the computational grids around the model. The grid system requires four single grids per wind turbine blade to represent the blade surface and DBD-PA, where these grids are composed of the blade-main, blade-tip, blade-root, and body-force subgrids. The body force distribution was computed based on the grid corresponding to the body force model region, and the body force was mapped to zones 6, 10, and 14. Two background grids surrounding the blade volume grids were employed, leading to the completion of the overset grid system. The length between the outer boundary and center of rotation was 50c. At the outflow boundaries, zero-gradient conditions were adopted, and at the inflow boundaries, the freestream velocity was assigned. As for the surface of the blade, no-slip and adiabatic-wall conditions were adopted. The minimum grid size in the direction normal to the airfoil surface was set as 1.369 × 10⁻⁴c. This grid spacing is so small that at least 20 grid points can exist within the laminar boundary layer around the leading edge of the blade. It was impossible for us to perform a grid sensitivity analysis in this study due to the required highly expensive computational resources. Therefore, the current study qualitatively discusses the effects of DBD-PAs on the aerodynamics of wind turbine blades and the applicability of DBD-PA-based flow control techniques to wind turbine blades. Although the grid convergence study is absent, the qualitative trend of an increase in the ratio of the cycle-averaged axial torque shows a reasonable agreement with the experimental data (see Figure 5) [25]. Furthermore, the used fluid dynamics solver in the current study was validated for flow control simulations around the airfoil in the Rec range of O(104) to O(106) [13,14,15,16,17].

3.6. Computational Cases

All the cases are tabulated in Table 4. In the current study, one computation without flow control using a DBD-PA and three computations with flow control using a DBD-PA with different operational conditions were carried out. The operational parameters of some of the controlled cases were set based on the experimental conditions of the previous study [25], and the duty cycle/BR was fixed to 0.1. The DBD-PA was switched on at 2 degrees or 0.33 degrees per 21 degrees of the azimuth angle (ϕ) with F+ of 1 and 6, respectively.

4. Data Processing

The computed data were averaged based on 72 phases (i.e., 5 degrees of the azimuth angle ϕ per phase), and a phase number of one meant that the instantaneous flow data around the blades with an azimuth angle between 0 degrees and 5 degrees was averaged. The results at the two phases, where a remarkable difference between the cases with and without the DBD-PA was found, and the maximum torque generation were highlighted. Moreover, αe was the same at both phases. The cycle-averaged axial torque Ta was calculated by adding the cycle-averaged axial torque values of the blades. Two revolutions of the blades were also used to obtain the cycle-averaged value.

5. Results and Discussion

5.1. Effect of DBD-PA on the Cycle-Averaged Axial Torque Output

Figure 5 shows an increase in the ratios of the cycle-averaged axial torque (ΔTa) generated by one blade due to the flow control of the DBD-PA, and the computed results indicate that the flow control using DBD-PAs installed at the leading edges of wind turbine blades can increase the axial torque generation by more than 10% in comparison with blades without flow control. The maximum ΔTa was approximately 19% when F+ = 1 and Dc = 0.5 (Dc0.5F+1). When cases with the same Dc were considered, a higher ΔTa was obtained with a higher F+ (Dc0.125F+6). This qualitative trend of the improvement in ΔTa with respect to the change of F+ is similar to that reported in a previous experiment [25].

5.2. Phase-Averaged Flow and Aerodynamic Characteristics

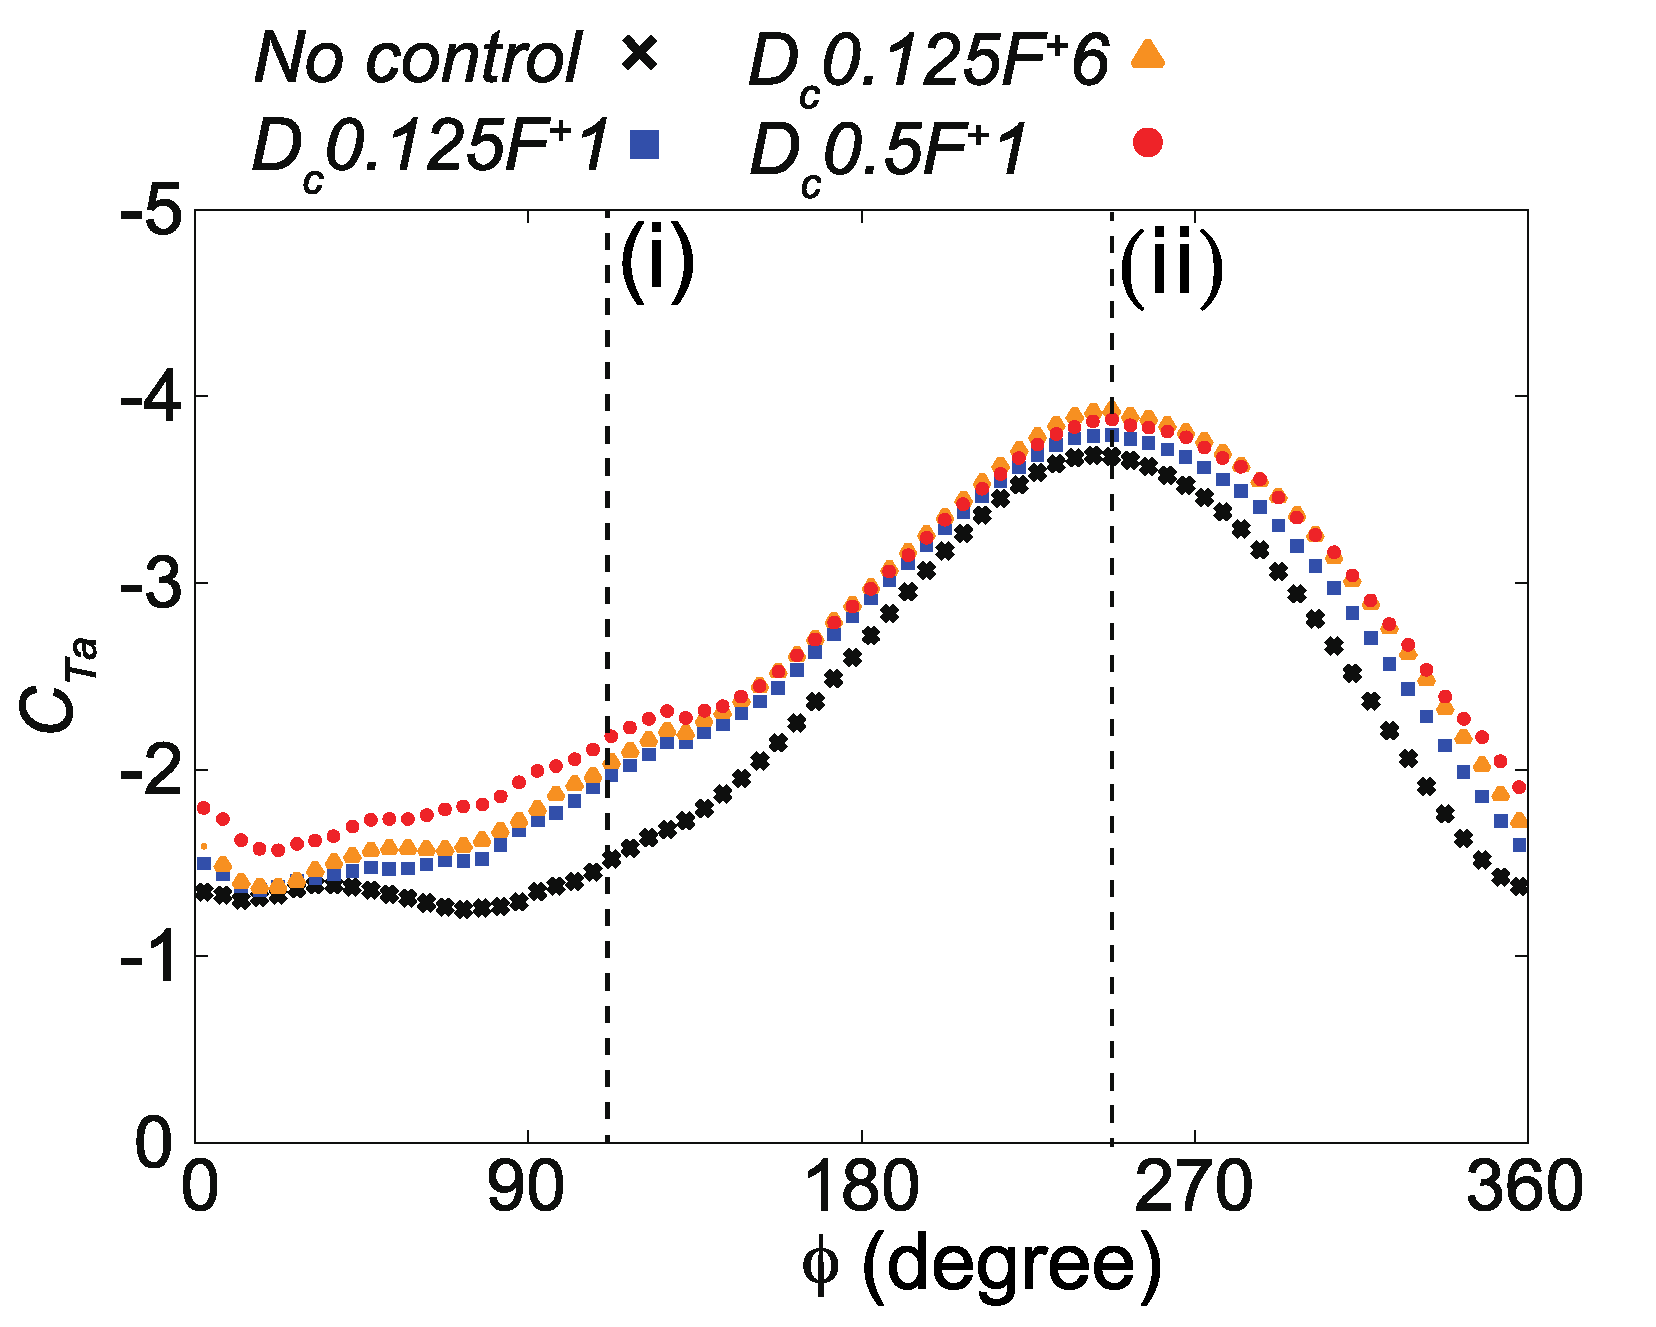
Figure 6 presents the phase-averaged torque coefficient of the blade (CTa) as a function of the azimuth angle ϕ in the cases with and without control. The variation of CTa with respect to the change of the azimuth angle ϕ is similar in all cases. Unlike the stationary airfoil-flow control cases [13,14,15,16,17], the effects of F+ on the aerodynamic performance were not clearly identified. However, when the azimuth angle ϕ approached 90 degrees, the difference in the value of CTa with and without flow control was clear, and it became minimum when CTa reached its maximum value. The trend of the difference in the value of CTa is most likely due to differences in the flow structures around the blades because of the variation in the effective angle of attack αe. Next, the flow structures around the blades at the selected two phases that correspond to the azimuth angle ϕ of 112.5 degrees (see Figure 6 (i) refers to near minimum axial torque generation) and 247.5 degrees (see Figure 6 (ii) refers to near maximum axial torque generation) were analyzed.
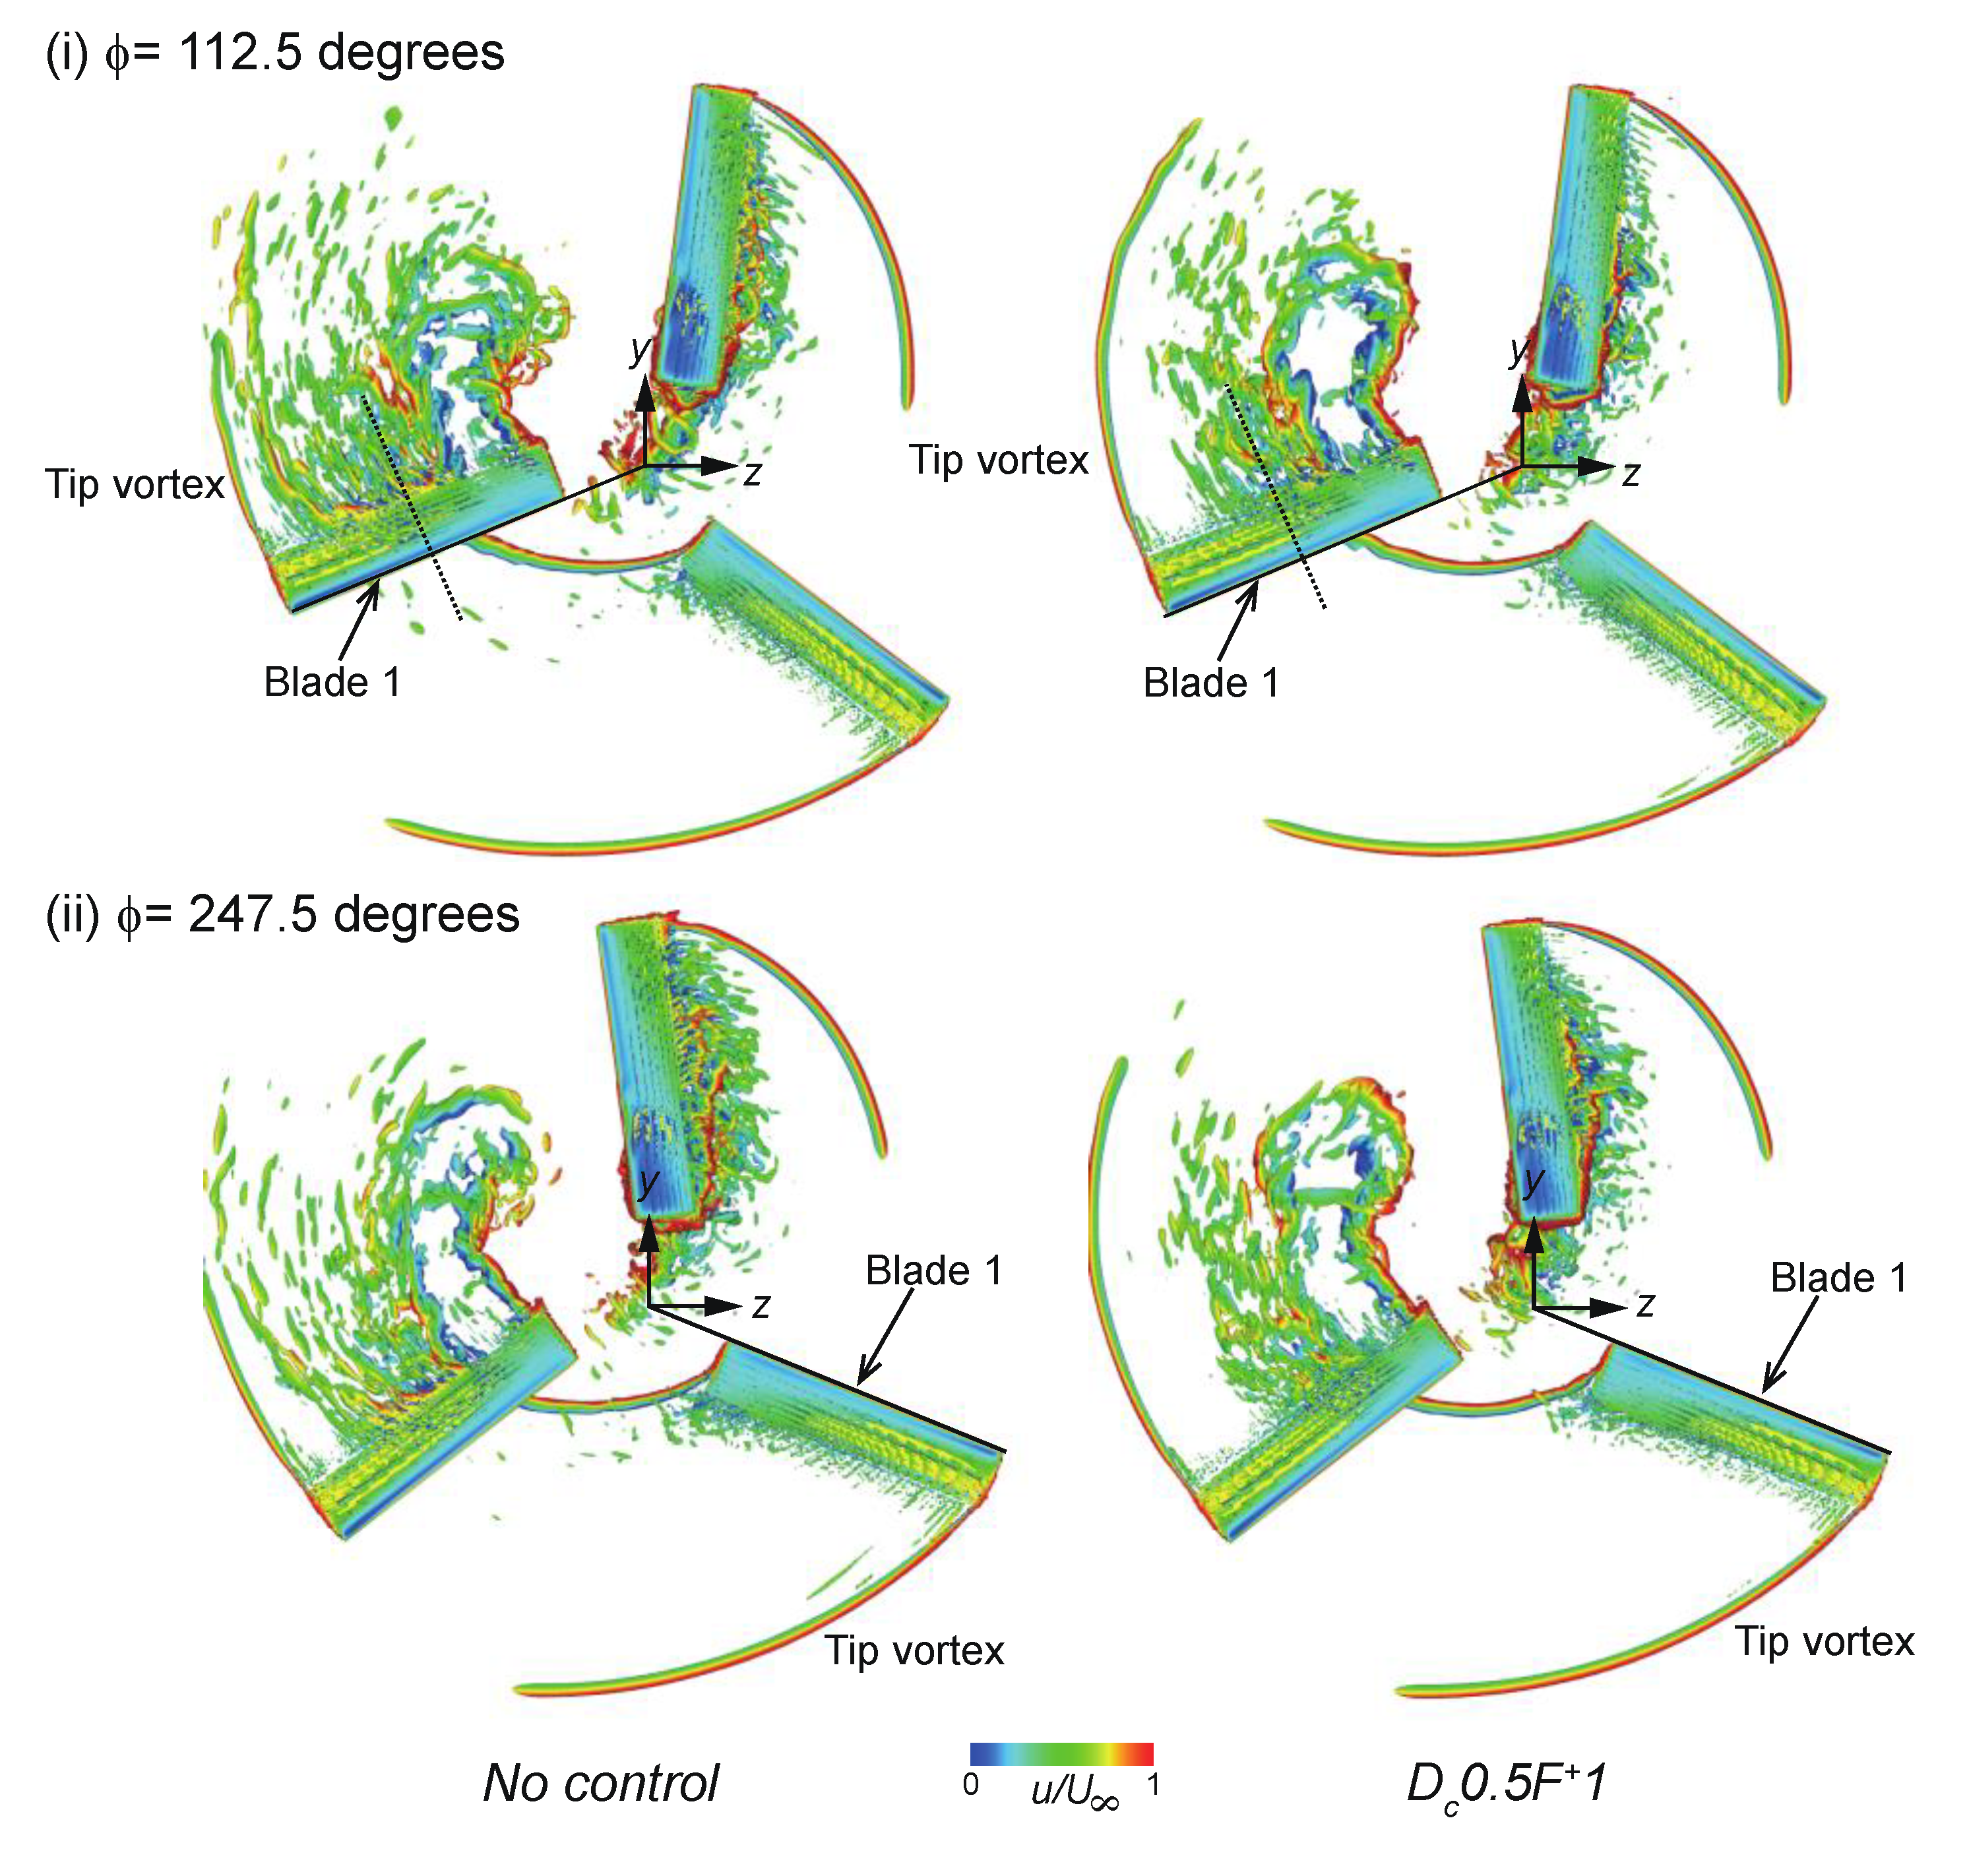
Figure 7 shows the three-dimensional flow structures around the blades at two selected phases (ϕ = 112.5 degrees and 247.5 degrees, respectively). The isosurfaces of the second invariant of the velocity gradient tensor (Q-criterion [49], Q = 200) were visualized and colored by the flow velocity magnitude in the x-direction. In the first phase (Figure 7 (i)), the flow around blade 1 was separated in both cases. The suppression of the flow separation around blade 1 due to the flow control can be found in the region between 50% of the blade’s span and the blade tip. By contrast, in the second phase (Figure 7 (ii)), the flow around blade 1 near the tip was weakly separated. Thus, the suppression of the flow separation due to the flow control was lesser compared with that in the first phase. Thus, in the first phase (Figure 6 (i) and Figure 7 (i)), the increase in the axial torque generation from the flow control using the DBD-PA was more present in comparison with the second phase (Figure 6 (ii) and Figure 7 (ii)).
The flow visualization illustrates that the effects of the flow control using DBD-PAs on the flow structure around turbine blades vary with the span direction. Here, we further analyzed the relationship between the flow structures and the contribution of the axial torque based on the span position of the blade. Figure 8 plots the contribution of the axial torque along the span of blade 1. According to the flow visualization shown in Figure 7, the three regions of the blade span (i.e., from the root to 50% span, from 50% span to 75% span, and from 75% span to the tip) were considered. In the first phase (Figure 8 (i)), the axial torque generated by the span position from 50% to the blade tip improved because of the flow control using the DBD-PA, and it was also equal to the axial torque generated by the blade span 50% to the blade root. In the second phase (Figure 8 (ii)), the axial torque generated by the span position from the blade root to 50% span improved due to the control of flow by the DBD-PA.
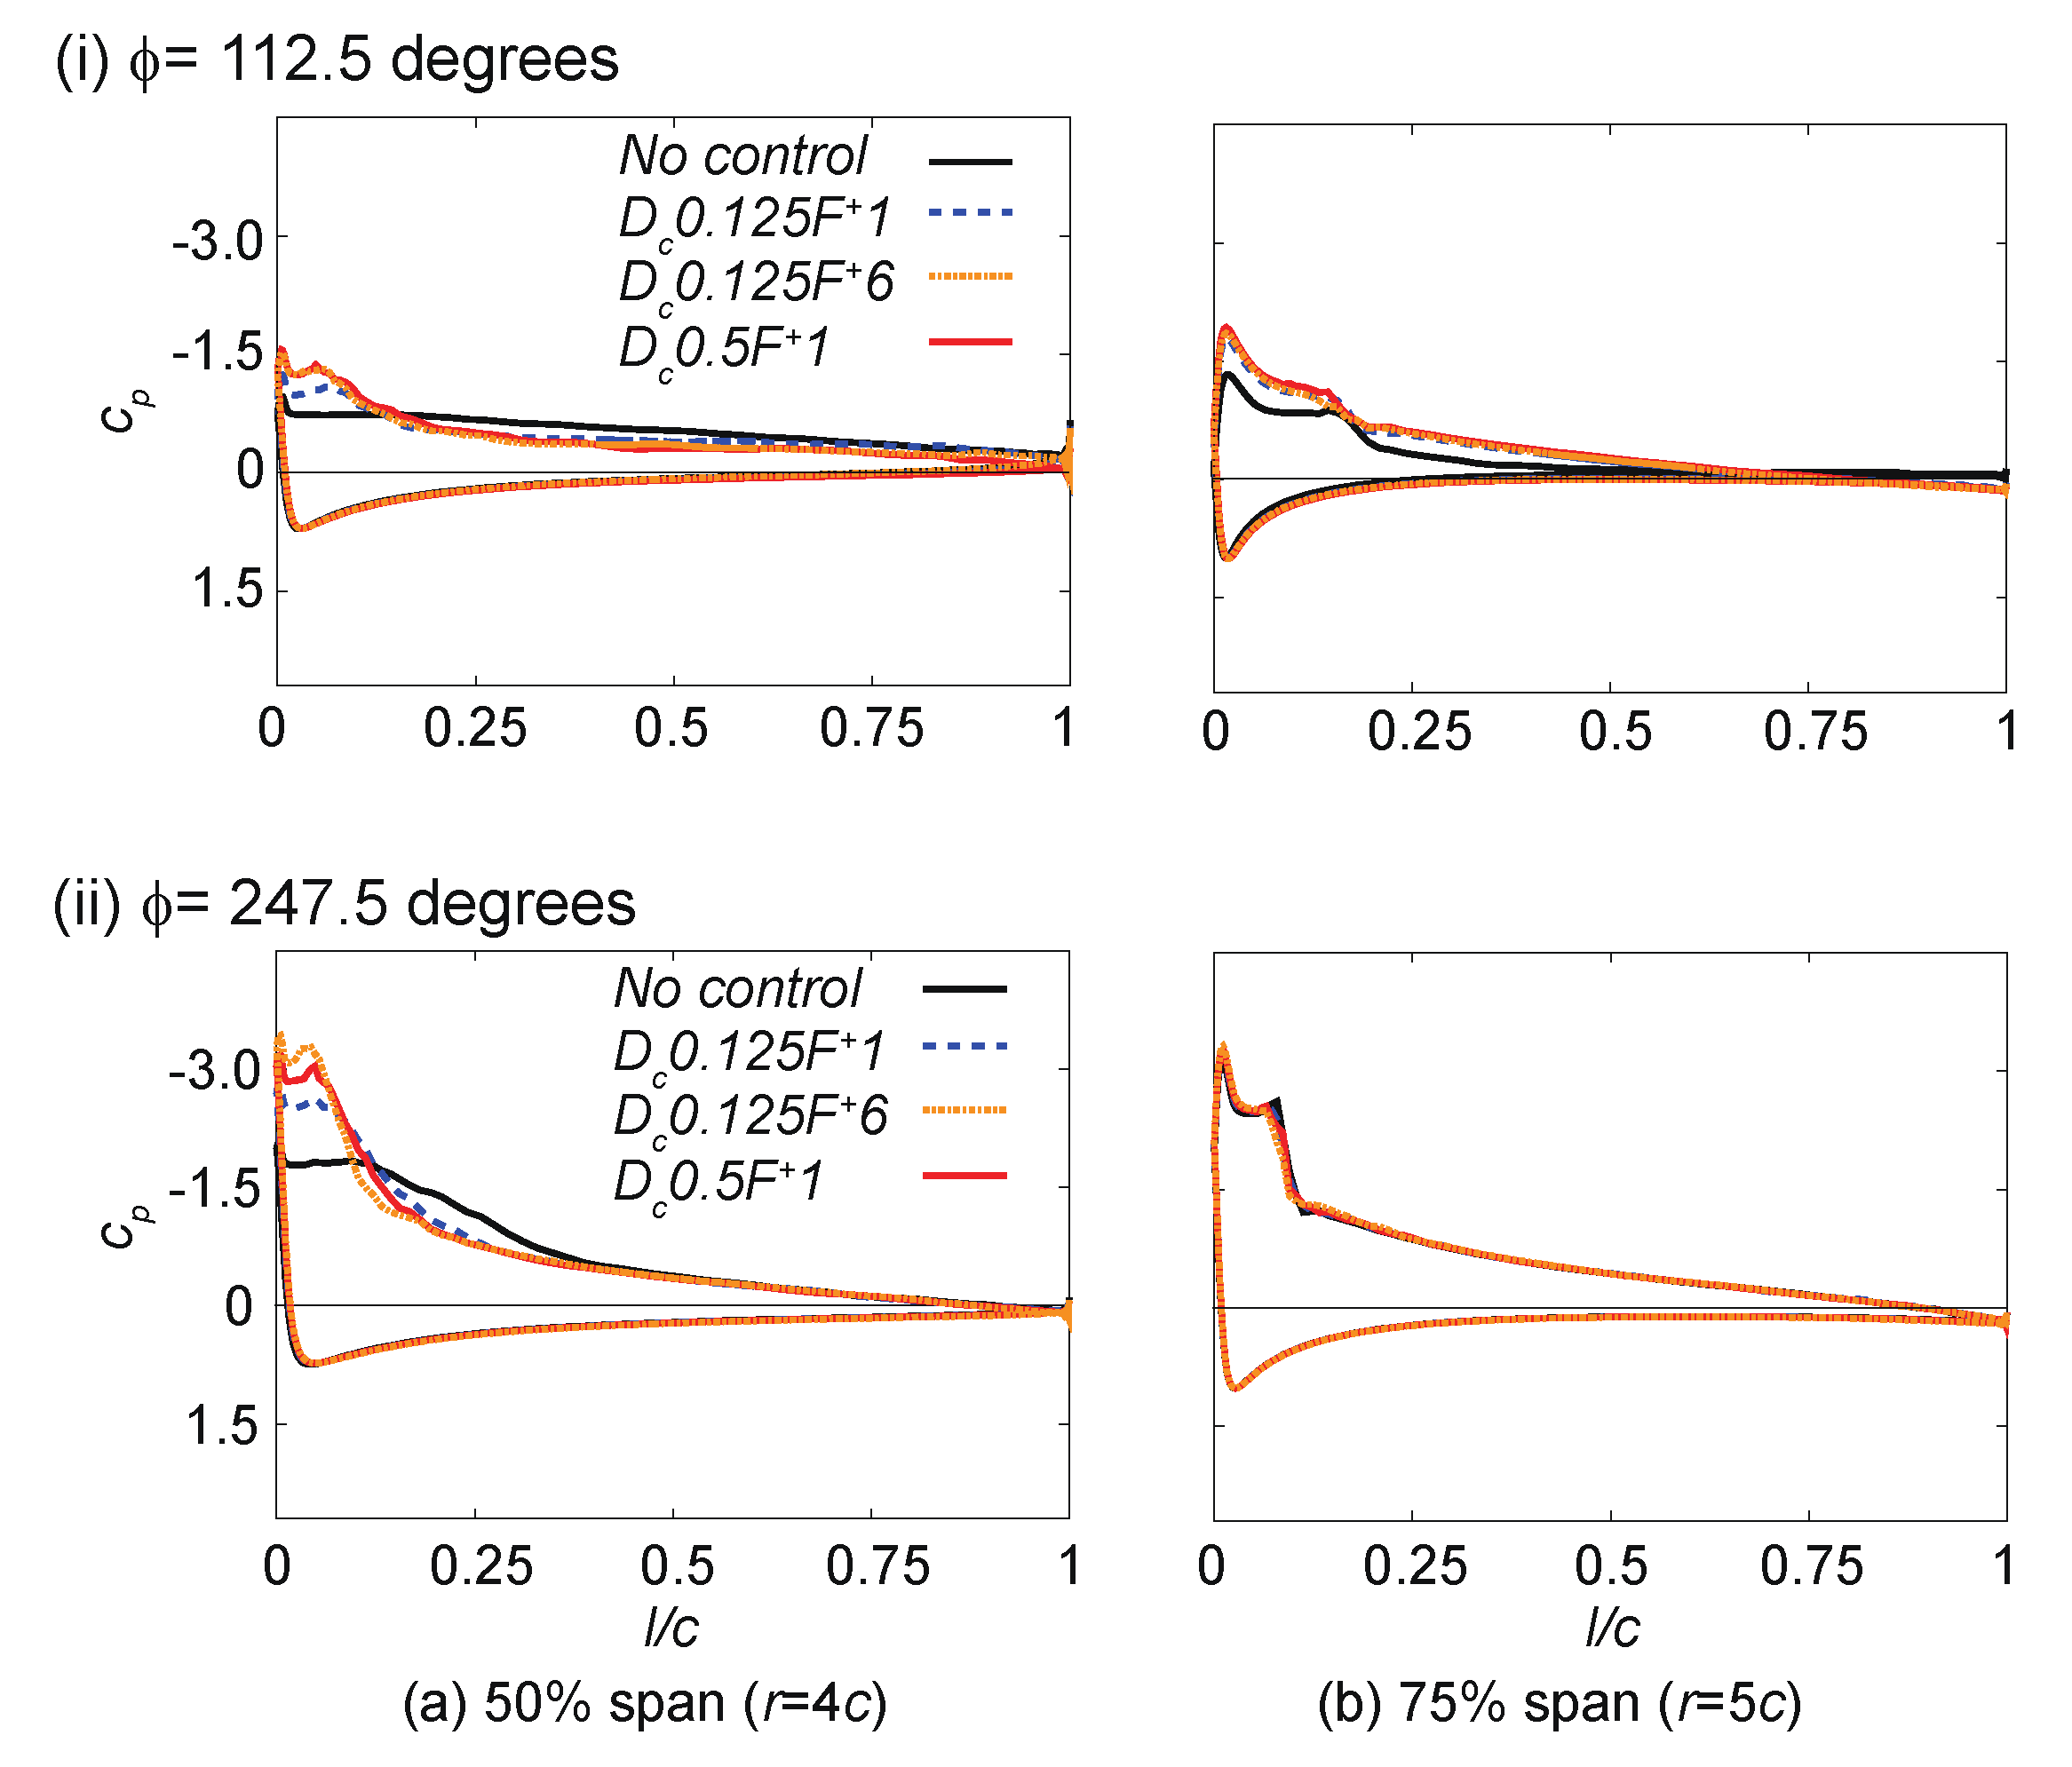
Furthermore, Figure 9 shows a comparison of the pressure distributions over the blade section at span positions of 50% and 75%. Here, the surface pressure coefficient was normalized based on the dynamic pressure of the effective flow velocity, and l in Figure 9 indicates the local chord length from the leading edge of the blade. Figure 9 presents the difference between the cases with and without flow control using the DBD-PA except for the results at the 75% span section in the second phase (Figure 9b (ii) 75% span). The differences in the surface pressure distribution were related to the axial torque generation. The suction peaks were enhanced with the DBD-PA, and the surface pressure distribution at the 50% span section in the first phase (Figure 9a (i) 50% span) indicated a vortex convection near the blade surface. In the second phase, the surface pressure distributions at the 50% and 75% span sections with the DBD-PA indicated the presence of a laminar separation bubble on the suction side of the blade.
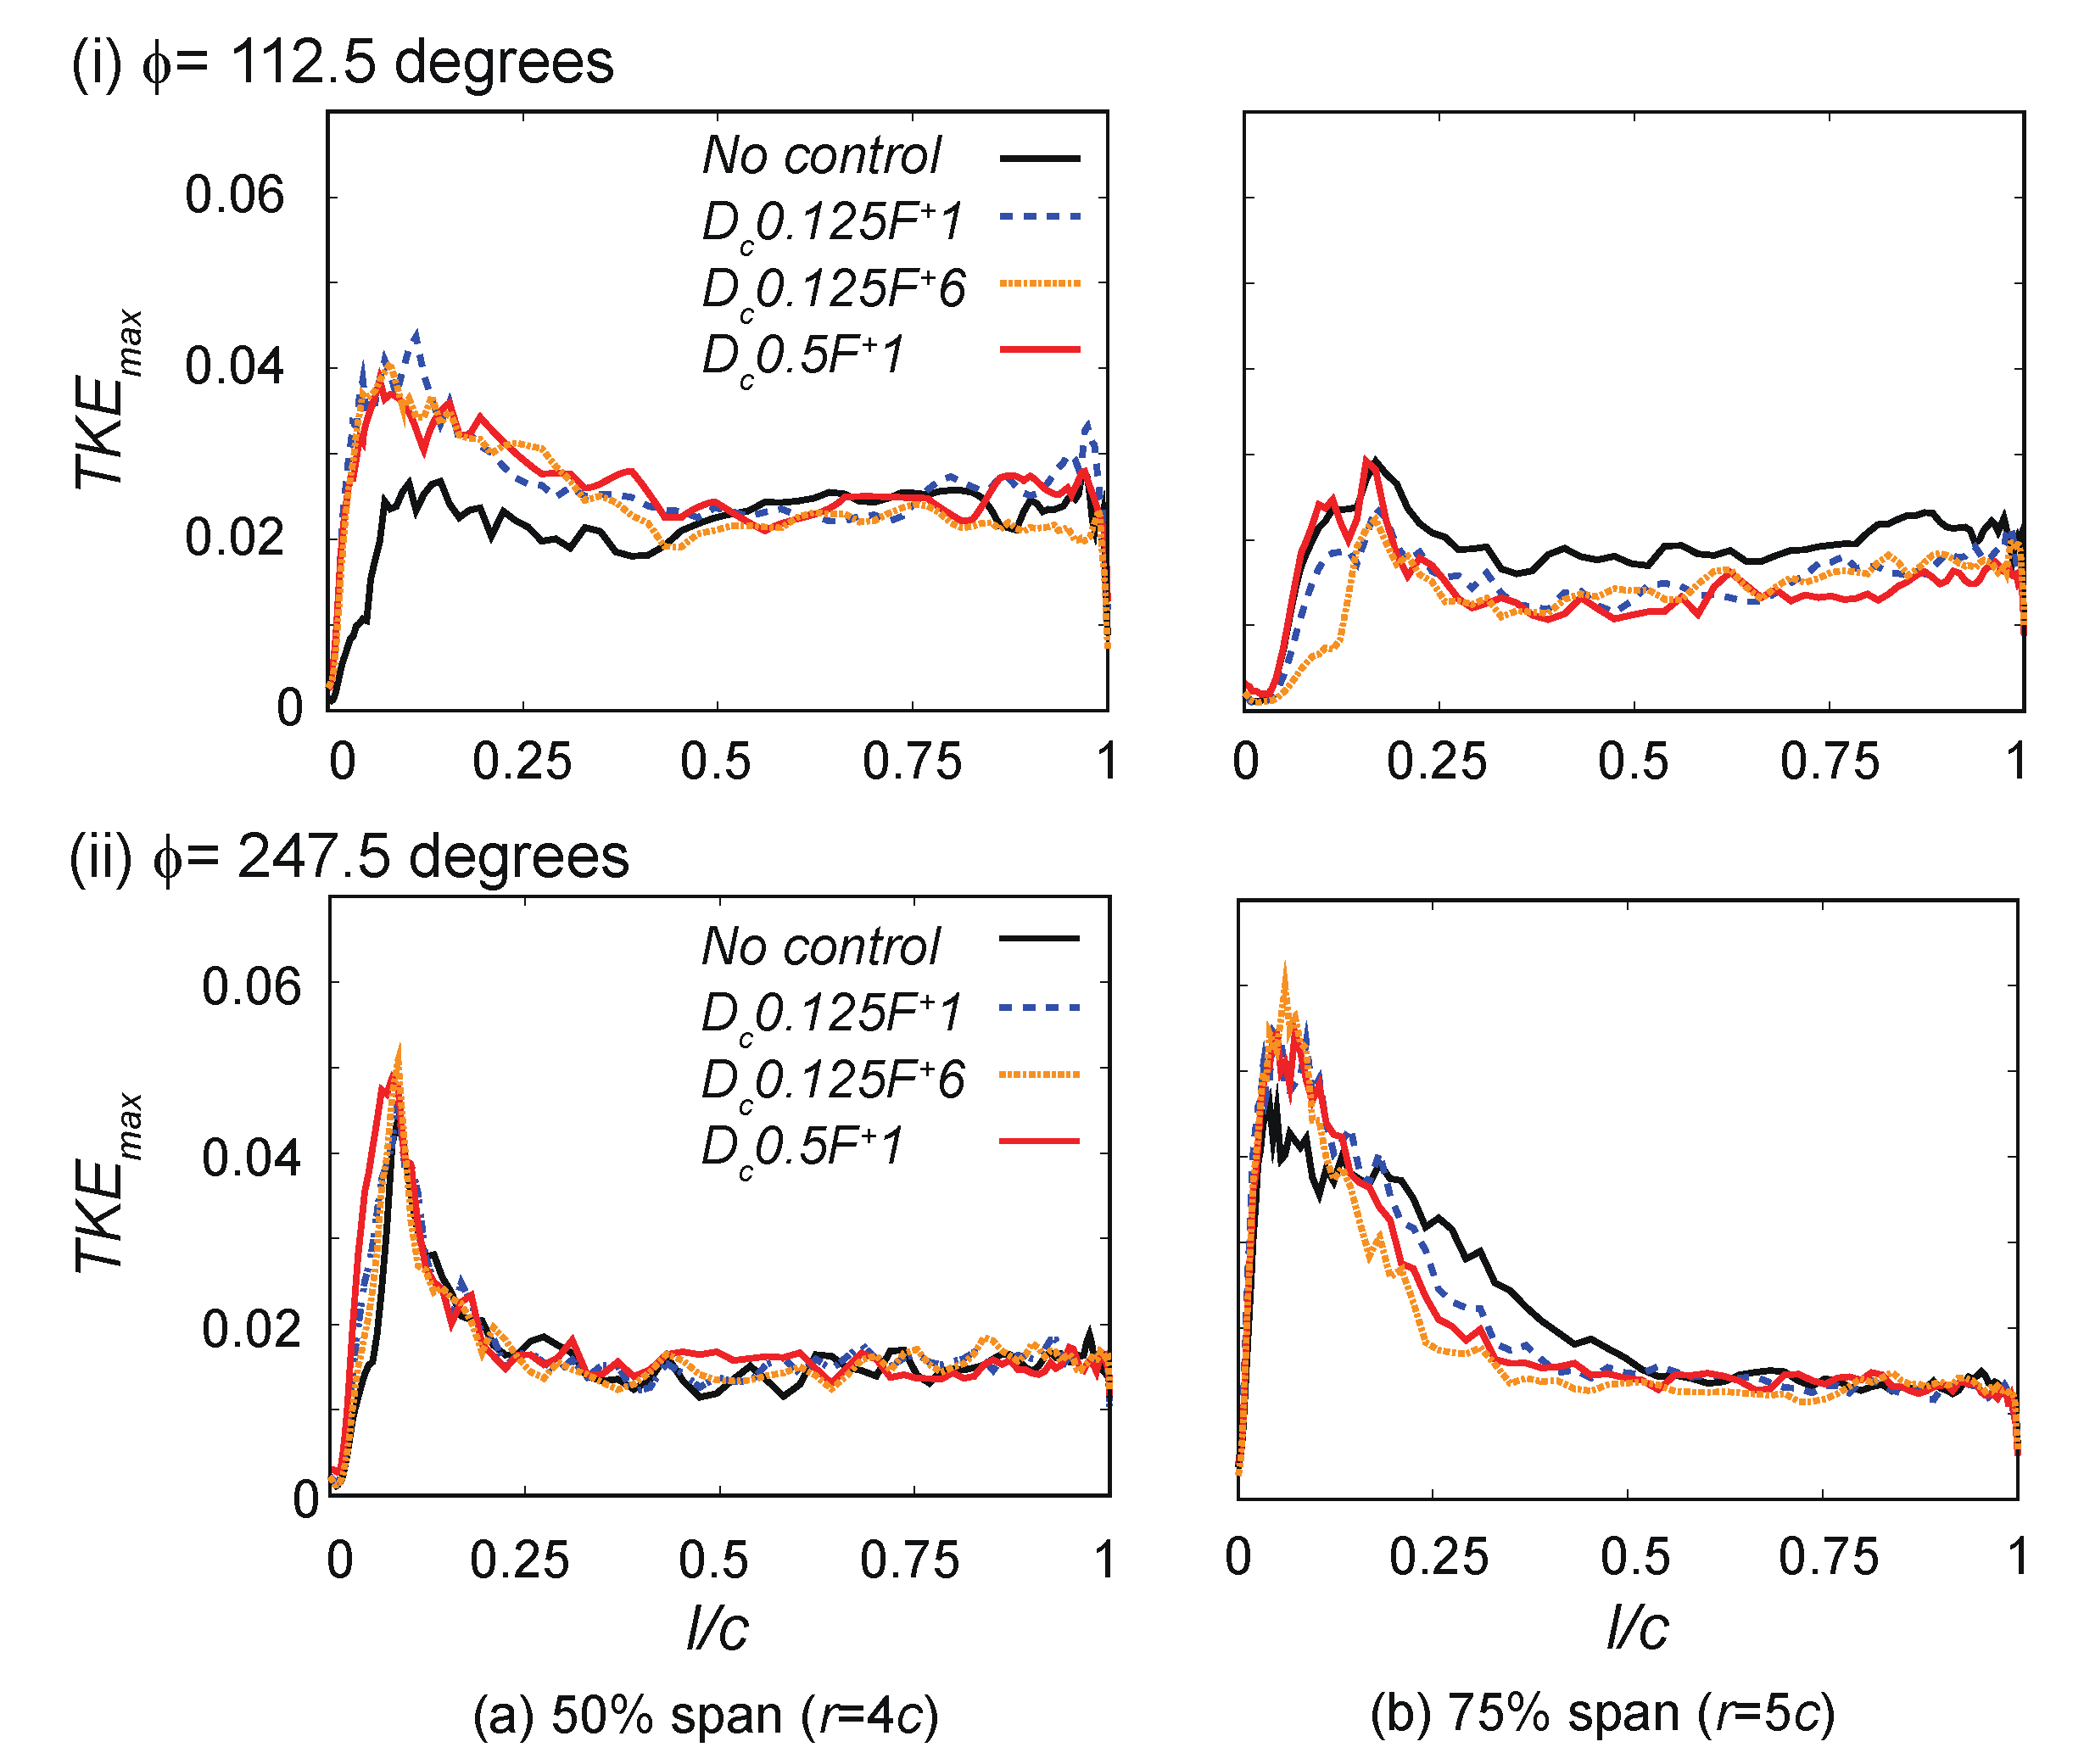
In addition, we examined the turbulent kinetic energy (TKE) distribution by collecting the maximum value of TKE in the direction normal to the surface (see Figure 10). The rapid increase in the TKE and higher maximum TKE (TKEmax) was presented in the cases with flow control using the DBD-PA at the 50% span section. The results implicate that DBD-PAs promote the laminar-to-turbulent tension of separated leading edge shear layers, which has a similar influence on the separated leading edge shear layer of the airfoil that was reported in stationary airfoil cases [13,14,15,16,17].
The results so far are the observations and findings related to the leading edge separation of the wind turbine blade. Here, the wake structures can be seen, especially the tip vortices. Recalling Figure 7, the tip vortex around blade 1 remained longer when using a DBD-PA for flow control. The differences in the tip-vortex length around blade 1 in cases with control and without control were computed based on iso-Q surfaces. The differences were approximately 4.0c at ϕ = 112.5 degrees and almost zero at ϕ = 247.5 degrees, respectively. In the case without flow control, the separated flow and vortices were convected to the downstream and interacted with the tip vortex. However, such interactions can cause a breakdown of the tip vortex. The results in the cases with flow control show a suppression of the leading edge separation near the tip region, which leads to very weak vortex-flow interactions between the tip vortex and the separated flow from the leading edge. This is the secondary effect of the flow control of DBD-PAs, and it may play a role in the reduction of sound generation. Of note, the considered primary effect of DBD-PAs in this study is the suppression or delay of the leading edge separation of wind turbine blades.

5.3. Discussion about Flow Control around the Sophisticated Wind Turbine Airfoil Cross-Section

In the previous subsection, the effects of the DBD-PA-based flow control on wind turbine blades were presented and discussed. In comparison with those reported in a previous study [26], the discrepancy observed can be due to three possible reasons. First, the difference in the airfoil shape affected the separation characteristics and hysteresis of the flow around the blade. In particular, for the dynamic stalled case, the previous study presented a considerable difference between the NACA0012 and NACA636-618 airfoils in terms of the separation point in time [50]. In addition, in the case of the NACA0012 airfoil, the separation point was fixed at the leading edge while in the case of the NACA636-618 airfoil the separation point changed in time [50]. Moreover, the difference in the airfoil geometry can result in changes in the behavior of flow separation, reattachment, and secondary separation. In a well-designed airfoil, such as the NRELS822, the trailing-edge separation was more prominent compared with that in the NACA0012 airfoil. In such flow fields, a DBD-PA installed at the leading edge cannot directly affect the flow near the trailing edge, so the aerodynamic performances of the airfoil cannot be effectively enhanced. Second, the yaw angle of the freestream causes a time variation of the effective angle of attack of the blade; hence, the flow becomes more unsteady in time and three-dimensional in space. As the yaw angles were not considered in the previous study [26], the flow dynamics around the blades were most likely different, and less leading edge separation was expected. Third, the effectiveness of the operational condition of the DBD-PA depends on the flow structures around the blades. Therefore, it is necessary to further study and prove the above-mentioned three points in the near future.

6. Conclusions

The effects of DBD-PAs on axial toque generation and flow structures around simple experimental horizontal-axis wind turbine blades under a low tip-ratio condition were numerically investigated and reported in this paper. A DBD-PA was modeled as a spatial body force distribution with time variations, and the flow around the rotating blades was simulated based on LES with the compact finite differencing scheme. Moreover, large-scale parallel computations were conducted using 18,800 cores of the K computer. As the low tip-ratio condition and an inclined incoming flow were considered, the computed flow around the blades was dynamically changed with the time variation of the azimuth angles. Moreover, the effects of the DBD-PA on axial torque generation were evaluated based on three revolutions after the DBD-PA was switched on. The results show that revolution-averaged axial torque approximately increased by 11%–19% compared to the case without a DBD-PA. Here, the DBD-PA seemed to mainly affect the separated leading edge shear layer, leading to a delayed leading edge separation of the wind turbine blades. Thus, DBD-PAs can improve the axial torque generation. Further experimental studies to validate the model for the present test case are required for future research.

Author Contributions

Conceptualization, H.A. and K.F.; formal analysis, H.A; investigation, H.A.; writing—original draft preparation, H.A.; writing—review and editing, all authors; supervision, K.F. All authors have read and agreed to the published version of the manuscript.

Funding

This research received no external funding.

Acknowledgments

This research used computational resources of the K computer and other computers of the HPCI system provided by the AICS and the Information Technology Center, The University of Tokyo through the HPCI System Research Project (Project ID: hp130001, hp140207, hp150219, and hp150291). H.A. acknowledges Mitsuo for fruitful discussions and providing information of the experiments.

Conflicts of Interest

The authors declare no conflict of interest.

References

  1. Sorensen, J.N. Aerodynamic aspects of wind energy conversion. Annu. Rev. Fluid Mech. 2011, 43, 427–448. [Google Scholar] [CrossRef] [Green Version]
  2. Cattafesta, L.N., III; Sheplak, M. Actuators for active flow control. Annu. Rev. Fluid Mech. 2011, 43, 247–272. [Google Scholar] [CrossRef] [Green Version]
  3. Roth, J.R.; Sherman, D.M.; Wilkinson, S.P. Boundary layer flow control with a one atmosphere uniform glow discharge surface plasma. In Proceedings of the 36th AIAA Aerospace Sciences Meeting and Exhibit, Reno, NV, USA, 12–15 January 1998. [Google Scholar]
  4. Roth, J.R.; Sherman, D.M.; Wilkinson, S.P. Electrohydrodynamic flow control with a glow-discharge surface plasma. AIAA J. 2000, 38, 1166–1172. [Google Scholar] [CrossRef]
  5. Roth, J.R.; Dai, X. Optimization of the aerodynamic plasma actuator as an electrohydrodynamic (EHD) electrical device. In Proceedings of the 44th AIAA Aerospace Sciences Meeting and Exhibit, Reno, NV, USA, 9–12 January 2006. [Google Scholar]
  6. Forte, M.; Jolibois, J.; Pons, J.; Moreau, E.; Touchard, G.; Cazalens, M. Optimization of a dielectric barrier discharge actuator by stationary and non-stationary measurements of the induced flow velocity: Application to airflow control. Exp. Fluids 2007, 43, 917–928. [Google Scholar] [CrossRef]
  7. Corke, T.C.; Martiqua, L.P.; Orlov, D.M. SDBD plasma enhanced aerodynamics: Concepts, optimization and applications. Prog. Aerosp. Sci. 2007, 43, 193–217. [Google Scholar] [CrossRef]
  8. Wang, J.-J.; Choi, K.-S.; Feng, L.-H.; Jukes, T.N.; Whalley, R.D. Recent developments in DBD plasma flow control. Prog. Aerosp. Sci. 2013, 62, 52–78. [Google Scholar] [CrossRef]
  9. Benard, N.; Moreau, E. Electric and mechanical characteristics of surface AC dielectric barrier discharge plasma actuators applied to airflow control. Exp. Fluids 2014, 55, 1846. [Google Scholar] [CrossRef] [Green Version]
  10. Enloe, C.L.; McLaughlin, T.E.; VanDyken, R.D.; Kachner, K.D.; Jumper, E.J.; Corke, T.C. Mechanisms and responses of a single dielectric barrier plasma actuator: Plasma morphology. AIAA J. 2004, 42, 589–594. [Google Scholar] [CrossRef]
  11. Moreau, E. Airflow control by non-thermal plasma actuators. J. Phys. D 2007, 40, 605. [Google Scholar] [CrossRef]
  12. Corke, T.C.; Post, M.L.; Orlov, D.M. Single dielectric barrier discharge plasma enhanced aerodynamics: Physics, modeling and applications. Exp. Fluids 2009, 46, 1–26. [Google Scholar] [CrossRef]
  13. Sato, M.; Aono, H.; Yakeno, A.; Nonomura, T.; Fujii, K.; Okada, K.; Asada, K. Multifactorial effects of operating conditions of dielectric-barrier-discharge plasma actuator on laminar-separated-flow control. AIAA J. 2015, 53, 2544–2559. [Google Scholar] [CrossRef]
  14. Sato, M.; Nonomura, T.; Okada, K.; Asada, K.; Aono, H.; Yakeno, A.; Abe, Y.; Fujii, K. Mechanisms for laminar separated-flow control using dielectric-barrier-discharge. Phys. Fluids 2015, 27, 117101. [Google Scholar] [CrossRef]
  15. Sato, M.; Okada, K.; Asada, K.; Aono, H.; Nonomura, T.; Fujii, K. Unified mechanisms for separation control around airfoil using plasma actuator with burst actuation over Reynolds number range of 103–106. Phys. Fluids 2020, 32, 025102. [Google Scholar]
  16. Aono, H.; Kawai, S.; Nonomura, T.; Sato, M.; Fujii, K.; Okada, K. Plasma-actuator burst-mode frequency effects on leading-edge flow-separation control at Reynolds number 2.6 × 10⁵. AIAA J. 2017, 55, 3789–3806. [Google Scholar] [CrossRef]
  17. Sato, M.; Asada, K.; Nonomura, T.; Aono, H.; Yakeno, A.; Fujii, K. Mechanisms for turbulent separation control using plasma actuator at Reynolds number of 1.6 × 10⁶. Phys. Fluids 2019, 31, 095107. [Google Scholar]
  18. Fujii, K. Three flow features behind the flow control authority of DBD plasma actuator: Result of high-fidelity simulations and the related experiments. Appl. Sci. 2018, 8, 546. [Google Scholar] [CrossRef] [Green Version]
  19. Matsuda, H.; Tanaka, M.; Goshima, S.; Amemori, K.; Nomura, M.; Osako, T. Experimental study on plasma aerodynamic control for improving wind turbine performance. In Proceedings of the Asian Congress on Gas Turbines, Shanghai, China, 20–22 August 2012. [Google Scholar]
  20. Matsuda, H.; Tanaka, M.; Amemori, K.; Nomura, M.; Osako, T. Plasma aerodynamic control effect on wind turbine performance. In Proceedings of the Japan Society Mechanical Engineering Annual Meeting, Kanazawa, Japan, 9–12 September 2012. [Google Scholar]
  21. Tanaka, M.; Matsuda, H.; Amemori, K.; Shimura, N.; Yasui, H.; Osako, T. Torque argument effect of plasma actuator aerodynamic control for field rotor. In Proceedings of the Wind Power Energy Symposium, Tokyo, Japan, 27–28 November 2012. [Google Scholar]
  22. Matsuda, H.; Tanaka, M.; Osako, T.; Maeda, T.; Kamada, Y. Flow visualization study using tuft method on plasma actuated wind turbine blade flow. In Proceedings of the Symposium of the Visualization Society of Japan Annual Meeting, Tokyo, Japan, 16–17 July 2013. [Google Scholar]
  23. Tanaka, M.; Osako, T.; Matsuda, H.; Yamazaki, K.; Shimura, N.; Asayama, M.; Kondo, S.; Kawakami, M.; Oryu, Y.; Yoshida, S. Power enhancement effect of plasma aerodynamic control for large scale wing turbine. In Proceedings of the Wind Power Energy Symposium, Tokyo, Japan, 12–13 November 2013. [Google Scholar]
  24. Matsuda, H.; Tanaka, M.; Osako, T.; Yamazaki, K.; Shimura, N.; Asayama, M.; Oryu, Y. Plasma actuation effect on a MW class wind turbine. Int. J. Gas Turbine Prop. Power Syst. 2017, 9, 47–52. [Google Scholar]
  25. Mitsuo, K.; Watanabe, S.; Atobe, T.; Ito, T.; Shiohara, T.; Tanaka, M. Aerodynamic characteristics improvement of a wind turbine by plasma actuators. In Proceedings of the Japan Society Mechanical Engineering Annual Meeting, Okayama, Japan, 8–11 September 2013. [Google Scholar]
  26. Jukes, T.N. Smart control of a horizontal axis wind turbine using dielectric barrier discharge plasma actuators. Renew. Energy 2015, 80, 644–654. [Google Scholar] [CrossRef]
  27. Nelson, R.; Corke, T.; Othman, H.; Patel, M.; Vasudevan, S.; Ng, T. A smart wind turbine blade using distributed plasma actuators for improved performance. In Proceedings of the 46th Aerospace Science Meeting and Exhibit, Reno, NV, USA, 7–10 January 2008. [Google Scholar]
  28. Greenblatt, D.; Schulman, M.; Ben-Harav, A. Vertical axis wind turbine performance enhancement using plasma actuators. Renew. Energy 2012, 37, 345–354. [Google Scholar] [CrossRef]
  29. Ohtake, T.; Motohashi, T. Flow field around NACA0012 airfoil at low Reynolds numbers Part 1 characteristics of airfoil wake. J. Jpn. Soc. Aeronaut. Space Sci. 2009, 57, 397–404. [Google Scholar]
  30. Shyy, W.; Jayaraman, B.; Anderson, A. Modeling of glow discharge-induced fluid dynamics. J. Appl. Phys. 2002, 92, 6434–6443. [Google Scholar] [CrossRef]
  31. Orlov, D.M.; Corke, T.C. Numerical simulation of aerodynamic plasma actuator effects. In Proceedings of the 43rd AIAA Aerospace Sciences Meeting and Exhibit, Reno, NV, USA, 10–13 January 2005. [Google Scholar]
  32. Suzen, Y.B.; Huang, P.G.; Jacob, J.D.; Ashpis, D.E. Numerical simulations of plasma based flow control applications. In Proceedings of the 35th Fluid Dynamics Conference and Exhibit, Toronto, Ontario, Canada, 6–9 June 2005. [Google Scholar]
  33. Aono, H.; Sekimoto, S.; Sato, M.; Yakeno, A.; Nonomura, T.; Fujii, K. Computational and experimental analysis of flow structures induced by a plasma actuator with burst modulations in quiescent air. Mech. Eng. J. 2015, 2, 1–16. [Google Scholar] [CrossRef] [Green Version]
  34. Kawai, S.; Bouwhuis, T.; Abe, Y.; Yakeno, A.; Nonomura, T.; Aono, H.; Oyama, A.; Hoeijmakers, H.; Fujii, K. Dominant parameters for maximum velocity induced by body-force models for plasma actuators. Theor. Comput. Fluid Dyn. 2018, 32, 805–820. [Google Scholar] [CrossRef]
  35. Font, G.I.; Enloe, C.L.; McLaighlin, T.E. Plasma volumetric effects on the force production of a plasma actuator. AIAA J. 2010, 48, 1869–1874. [Google Scholar] [CrossRef]
  36. Aono, H.; Kimura, T.; Honami, S.; Ishikawa, H. Mechanisms of drag reduction due to flow control around circular disk using coaxial type dielectric barrier discharge plasma actuator at low Reynolds numbers. Fluid Dyn. Res. 2020, 52, 015508. [Google Scholar] [CrossRef]
  37. Fujii, K.; Obayashi, S. High-resolution upwind scheme for vortical-flow simulations. J. Aircr. 1989, 26, 1123–1129. [Google Scholar] [CrossRef]
  38. Abe, Y.; Nonomura, T.; Iizuka, N.; Fujii, K. Geometric interpretations and spatial symmetry property of metrics in the conservative form for high-order finite-difference schemes on moving and deforming grids. J. Comp. Phys. 2014, 260, 163–203. [Google Scholar] [CrossRef]
  39. Lele, S.K. Compact finite difference scheme with spectral-like resolution. J. Comp. Phys. 1992, 103, 16–22. [Google Scholar] [CrossRef]
  40. Gaitonde, D.V.; Visbal, M.R. Pade type higher-order boundary filters for Navier-Stokes equations. AIAA J. 2000, 38, 2103–2122. [Google Scholar] [CrossRef]
  41. Fujii, K. Simple ideas for the accuracy and efficiency improvement of the compressible flow simulation methods. In Proceedings of the 1st International CFD Workshop of Supersonic Transport Design, Tokyo, Japan, 16–17 March 1998. [Google Scholar]
  42. Iizuka, N. Study of Mach Number Effect on the Dynamic Stability of a Blunt Re-Entry Capsule. Ph.D. Thesis, University of Tokyo, Tokyo, Japan, 2006. [Google Scholar]
  43. Chakravarthy, S.R. Relaxation methods for unfactored implicit upwind schemes. In Proceedings of the 22nd Aerospace Sciences Meeting, Reno, NV, USA, 9–12 January 1984. [Google Scholar]
  44. Kobayashi, H.; Ham, F.; Wu, X. Application of a local SGS model based on coherent structures to complex geometries. Int. J. Heat Fluid Flow 2008, 29, 640–653. [Google Scholar] [CrossRef]
  45. Miyazaki, H.; Kusano, Y.; Okano, H.; Nakada, T.; Seki, K.; Shimizu, N.; Shoji, F.; Uno, A.; Kurokawa, M. K computer: 8.162 PetaFLOPS massively parallel scalar supercomputer built with over 548,000 cores. In Proceedings of the IEEE International Solid-state Circuits Conference, San Francisco, CA, USA, 19–23 February 2012. [Google Scholar]
  46. Aono, H.; Nonomura, T.; Iizuka, N.; Ohsako, T.; Inari, T.; Hashimoto, Y.; Takaki, R.; Fujii, K. Scalar tuning of a fluid solver using compact scheme for a supercomputer with a distributed memory architecture. CFD Lett. 2013, 5, 143–152. [Google Scholar]
  47. Abe, Y.; Aono, H.; Nonomura, T.; Fujii, K. Efficient evaluations of symmetric conservative metrics for high-order finite-difference schemes on a rotating grid. In Proceedings of the 2nd Frontiers in Computational Physics: Energy Sciences, Zurich, Switzerland, 3–5 June 2015. [Google Scholar]
  48. Fujii, K. Unified zonal method based on the fortified solution algorithm. J. Comp. Phys. 1995, 118, 92–108. [Google Scholar] [CrossRef]
  49. Jeong, J.; Hussain, F. On the identification of a vortex. J. Fluid Mech. 1995, 285, 69–94. [Google Scholar] [CrossRef]
  50. Fukumoto, H.; Aono, H.; Watanabe, T.; Tanaka, M.; Matsuda, H.; Osako, T.; Nonomura, T.; Oyama, A.; Fujii, K. Control of dynamic flowfield around a pitching NACA633-618 airfoil by a DBD plasma actuator. Int. J. Heat Fluid Flow 2016, 62, 10–23. [Google Scholar] [CrossRef]
Figure 1. Schematic diagram of a typical-type dielectric barrier discharge plasma actuator (DBD-PA) (a) and waveform of input voltage under burst modulation (b).
Energies 13 01218 g001
Figure 2. Configuration of the HAWT blade model (a) and time histories of αe at the selected span sections (b).
Energies 13 01218 g002
Figure 3. (a) Sketch of the modeled plasma actuator (PA) and spatial distribution of the DBD-PA body force model: (b) (1) overview; (2) zoom-up view near the exposed electrode.
Energies 13 01218 g003
Figure 4. Computational grids around the model: (a) overview; (b) near blade 1.
Energies 13 01218 g004
Figure 5. Increase ratios of cycle-averaged axial torque with respect to that of the case without control as a function of F+.
Energies 13 01218 g005
Figure 6. Phase-averaged axial torque coefficient CTa as a function of the azimuth angle ϕ.
Energies 13 01218 g006
Figure 7. Phase-averaged flow structures around the blades. Isosurface is Q = 200.
Energies 13 01218 g007
Figure 8. Contributions of phase-averaged axial torque coefficients along the span of the blade.
Energies 13 01218 g008
Figure 9. Distributions of the phase-averaged pressure coefficient (cp) over the blade surface at (a) 50% and (b) 75% of the span from the blade root.
Energies 13 01218 g009
Figure 10. Distribution of the maximum turbulent kinetic energy (TKEmax) of the suction side of the blade surface at (a) 50% and (b) 75% of the blade sections from the blade root.
Energies 13 01218 g010
Table 1. Model and flow conditions of previous investigations on DBD-PA-based flow control for horizontal-axis wind turbines (HAWTs).
Parameters[26][19,20][25][21,22][23,24]
Number of blades23333
Diameter (m)0.61.562.3761066
Chord length c (m)0.0780.0570.20.2131.8
Airfoil (near midspan)NRELS822-NACA0012DU91W210DU91W2250
Airfoil (near tip)NRELS822-NACA0012NACA63-618NACA63-618
Freestream velocity,
U (m/s)
26.5
(4.5–12.5)
7.5, 10, 2068.3
Yaw angle, Φyaw (degree)00, 15, 30, 450, −4090
Rotational frequency,
frot (Hz)
5 (4–6.5)30–400170, 1746013.5 (11–16)
Tip velocity, Utip (m/s)9.4232.621.631.446.7
Nondimensional parameters
Reynolds number, Rec1.1 × 1042.5 × 1041.3 × 1058.8 × 1041.0 × 106
Tip-speed ratio, λ4.65.02.25.25.6
Reduced frequency, k0.610.180.180.110.15
Table 2. Operational conditions of the DBD-PA-based flow control for HAWTs.
Parameters[26][19,20][25][21,22][23,24]
Position (%)3, 380000
Peak-to-peak applied voltage, Vpp (kV)6.59.0 (8.0–10.0)95.510
Base frequency, fbase (Hz)14,00015,000900015,00015,000
Burst frequency, fburst (Hz)9–1530020–300-4.6
Duty ratio (burst ratio) BR (%)-1010101
Table 3. Number of computational grid points.
Name of GridξηζTotal Points
Zone 1 (background)3374951023170,651,745
Zone 2 (background)4149541832,095
Zone 3 (blade-main 1)201150110130,471,801
Zone 4 (blade-tip 1)1693011015,137,769
Zone 5 (blade-root 1)1693011015,137,769
Zone 6 (actuator of blade 1)6041461123108,540,612
Zone 7 (blade-main 2)201150110130,471,801
Zone 8 (blade-tip 2)1693011015,137,769
Zone 9 (blade-root 3)1693011015,137,769
Zone 10 (actuator of blade 2)6041461123108,540,612
Zone 11 (blade-main 3)201150110130,471,801
Zone 12 (blade-tip 3)1693011015,137,769
Zone 13 (blade-root 3)16930110015,137,769
Zone 14 (actuator of blade 3)6041461123108,540,612
Table 4. Computational cases.
Case NameF+DcBRFbase
No controlNANANANA
Dc0.125F+110.1250.1170
Dc0.5F+110.50.1170
Dc0.125F+660.1250.1170