1. Introduction
Control of flow around bluff bodies has been studied both actively [
1,
2,
3,
4] and passively [
5,
6]. Bluff bodies are the representative shapes in some parts of various types of actual fluid machinery. Although success is guaranteed when using passive flow control techniques [
5,
6], an active flow control technique using a plasma actuator (PA) is of interest to the current study because of its advantage [
3,
4].
Figure 1a shows a schematic illustration of a typical PA. The basic structure of PA was firstly developed by Roth et al. [
7], and it consists of a dielectric sheet and a pair of exposed and encapsulated electrodes. When a high voltage current (AC) between electrodes is applied, dielectric barrier discharge (DBD) occurs near one side edge of the exposed electrode. Then, the air around the edge is partially ionized by DBD, and the electric fields formed around the electrodes accelerate the charged particles. As a result, momentum transports due to the collision of the ionized particles with the surrounding neutral particles, and it develops into a one-way tangential jet. The induced flow jet is advected in the direction from the exposed electrode to the encapsulated electrode. This typical PA, called the “sheet-type PA” to distinguish it from the “string-type PA”, used in this study.
To date, experimental [
3,
4,
8,
9,
10] and numerical [
11,
12] studies have been conducted and shown the possibilities of improvement in the lift-to-drag ratio and increasing the stall angle using the sheet-type PA installed near the leading edge of the airfoil as well as the effectiveness of modulation drive. Moreover, control methods of flow fields on more complex shaped 3D bluff bodies have been investigated. One of such examples is the Ahmed body [
13], designed as a representative automobile model. From the flow structures in the case of without flow control, the longitudinal vortices generated from the slant around the 3D bluff body with slant angle at the rear end strongly correlate with the magnitude of the pressure drag [
14]. Since the pressure drag most likely dominates the total drag acting on the 3D bluff body, weakening or transferring the vortices is conducted using flaps or PAs [
15,
16]. Recently, flow control using a pulse jet controlled by a solenoid valve on a square back shaped 3D bluff body model has been studied [
16,
17,
18]. The correlation between the flow pattern in the wake and the generation of the drag on the square back shaped 3D bluff body due to the pulse jet flow control has been reported [
16,
17]. Moreover, the effects of the frequency of the pulse jet on flow structures and drag force have been analyzed. Results indicate that the change of frequency of the pulsed jet has a considerable impact on the drag force acting on the square back shaped 3D bluff body [
16]. These efforts present certain possibilities of the drag reduction by the active flow control in the case of the square back shaped 3D bluff bodies.
Another example of the 3D bluff body is the generic body of a car door mirror consisting of a half cylinder and a quarter sphere [
19,
20,
21]. This model has a 3D curved surface on the front and the rear end cut off with a sharp corner. Since the car door mirrors are a component installed as a projection on the body surface of a vehicle, they can generate vortices by flow separation that interact with flow around the vehicle. Those vortices cause an increase in aerodynamic drag and noise. Thus, research and development studies related to car door mirrors have been conducted in order to improve vehicle aerodynamic characteristics [
22,
23]. Furthermore, there are many examples of devices installed as projections on mobilities, such as the landing gears of aircraft [
24,
25] and pantographs of high-speed trains [
26,
27], which have complicated shapes and cause deterioration of the aerodynamic performance. On the other hand, to the best of our knowledge, the active flow control on the generic body of a 3D curved surface has not been adequately addressed. Therefore, more studies are required to understand the detailed mechanisms of change in fluid dynamic force on the 3D curved surface bluff bodies due to the flow control. In addition, the knowledge and understanding regarding the flow around the 3D curved surface bluff bodies, including the car door mirror, landing gears, and pantographs, and developing methods for improving aerodynamic performance by active flow control are expected to be useful for many types of fluid machinery with protrusion devices.
On the other hand, unlike the sheet-type PA, a string-type PA developed by Segawa et al. [
28] has shown promise in terms of the smooth installation on 3D curved surface objects without the change of the original surface shape.
Figure 1b shows the basic structure of a typical string-type PA. The string-type PA consists of a conductive wire coated with highly flexible insulation material preliminarily and an exposed electrode. If a groove for embedding a metal wire is structured on the surface of the test piece, it can be flush mounted to the objects. Using the string-type PA, the suppression of turbine tip clearance flow and feedback control of flow separation on an NACA0015 airfoil have been presented by experiments [
28,
29]. These cases have verified the performance of the string-type PA in flow control around a two-dimensional curved surface that has been reported by many researchers [
8,
9,
10,
11,
12].
In this study, the string-type PA is applied to a 3D curved surface bluff body (the car door mirror model) on the surface in which the sheet-type PA might not be easily installed, and the control effects on aerodynamic properties were investigated based on the measurements of static pressures on the model surface, drag forces acting on the model, and velocity distributions around the model analyzed by particle image velocimetry (PIV). Through these experiments and analyses, we found a significant change in the drag coefficient due to the flow control. Although the increase in drag coefficient was observed in all flow control cases, we explored the mechanisms of the drag increase on the model in order to identify the possibility of the drag reduction of the 3D curved surface bluff body using the string-type PA.
2. Experimental Set up
2.1. Tested Model and Flow Condition
In this study, a 3D bluff body model simulating car door mirror geometry was adopted as the test piece. As shown in
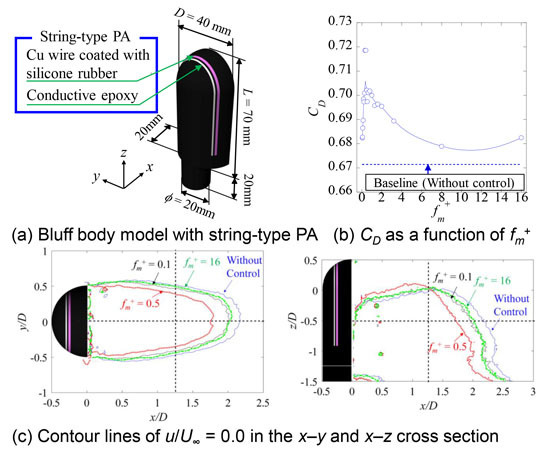
Figure 2, this model is a combination of a half cylinder (40 mm in the diameter (
D) and 50 mm in height) and a quarter sphere (
D = 40 mm), and the total height of the mirror model from the bottom wall was designed as 70 mm. An additional cylinder (20 mm in the diameter, 20 mm in height) used as a support is attached to the bottom surface of the half cylinder. A monocoque structure of the test piece made of heat resistant resin (TSR-884B) was modeled at a molding pitch of 100 μm by using a 3D rapid prototyping apparatus (CMET Inc., ATOM m-4000).
Figure 2b shows a schematic drawing of the model and internal structure in the
x–
z cross section. In a previous study on the flow around a car door mirror model conducted by Kato et al. [
22], the separation point at Re = 10
5 was approximately 70 degrees. Juke et al. [
30] tried to control the flow around a two-dimensional cylinder with sheet-type PAs and indicated that a sheet-type PA located slightly upstream of the separation point was effective in mitigating flow separation. In consideration of this information, for constructing a flush mounted string-type PA, concave grooves (1.5 mm wide, 1.6 mm deep) were molded at the position 60 degrees from the stagnation point, which was presumed to be slightly upstream of the separation point. A copper wire (Cu wire) coated with silicone rubber (outer diameter: 1.3 mm, Cu diameter: 0.6 mm) was buried into the groove, and moisture-curable silicone was filled in the gaps between the model and wires to prevent a step with the mirror model surface. In addition, a conductive epoxy was filled in a V-shaped groove provided upstream of the wire for constructing the exposed electrode. A lead wire bonded to the exposed electrode and embedded Cu wire coated with silicone rubber were derived from inside to outside of the model through a midair hole of the support and connected to the power supply. From a safety perspective, high voltage AC was applied to the Cu wire, and the exposed electrode was connected to the ground (GND).
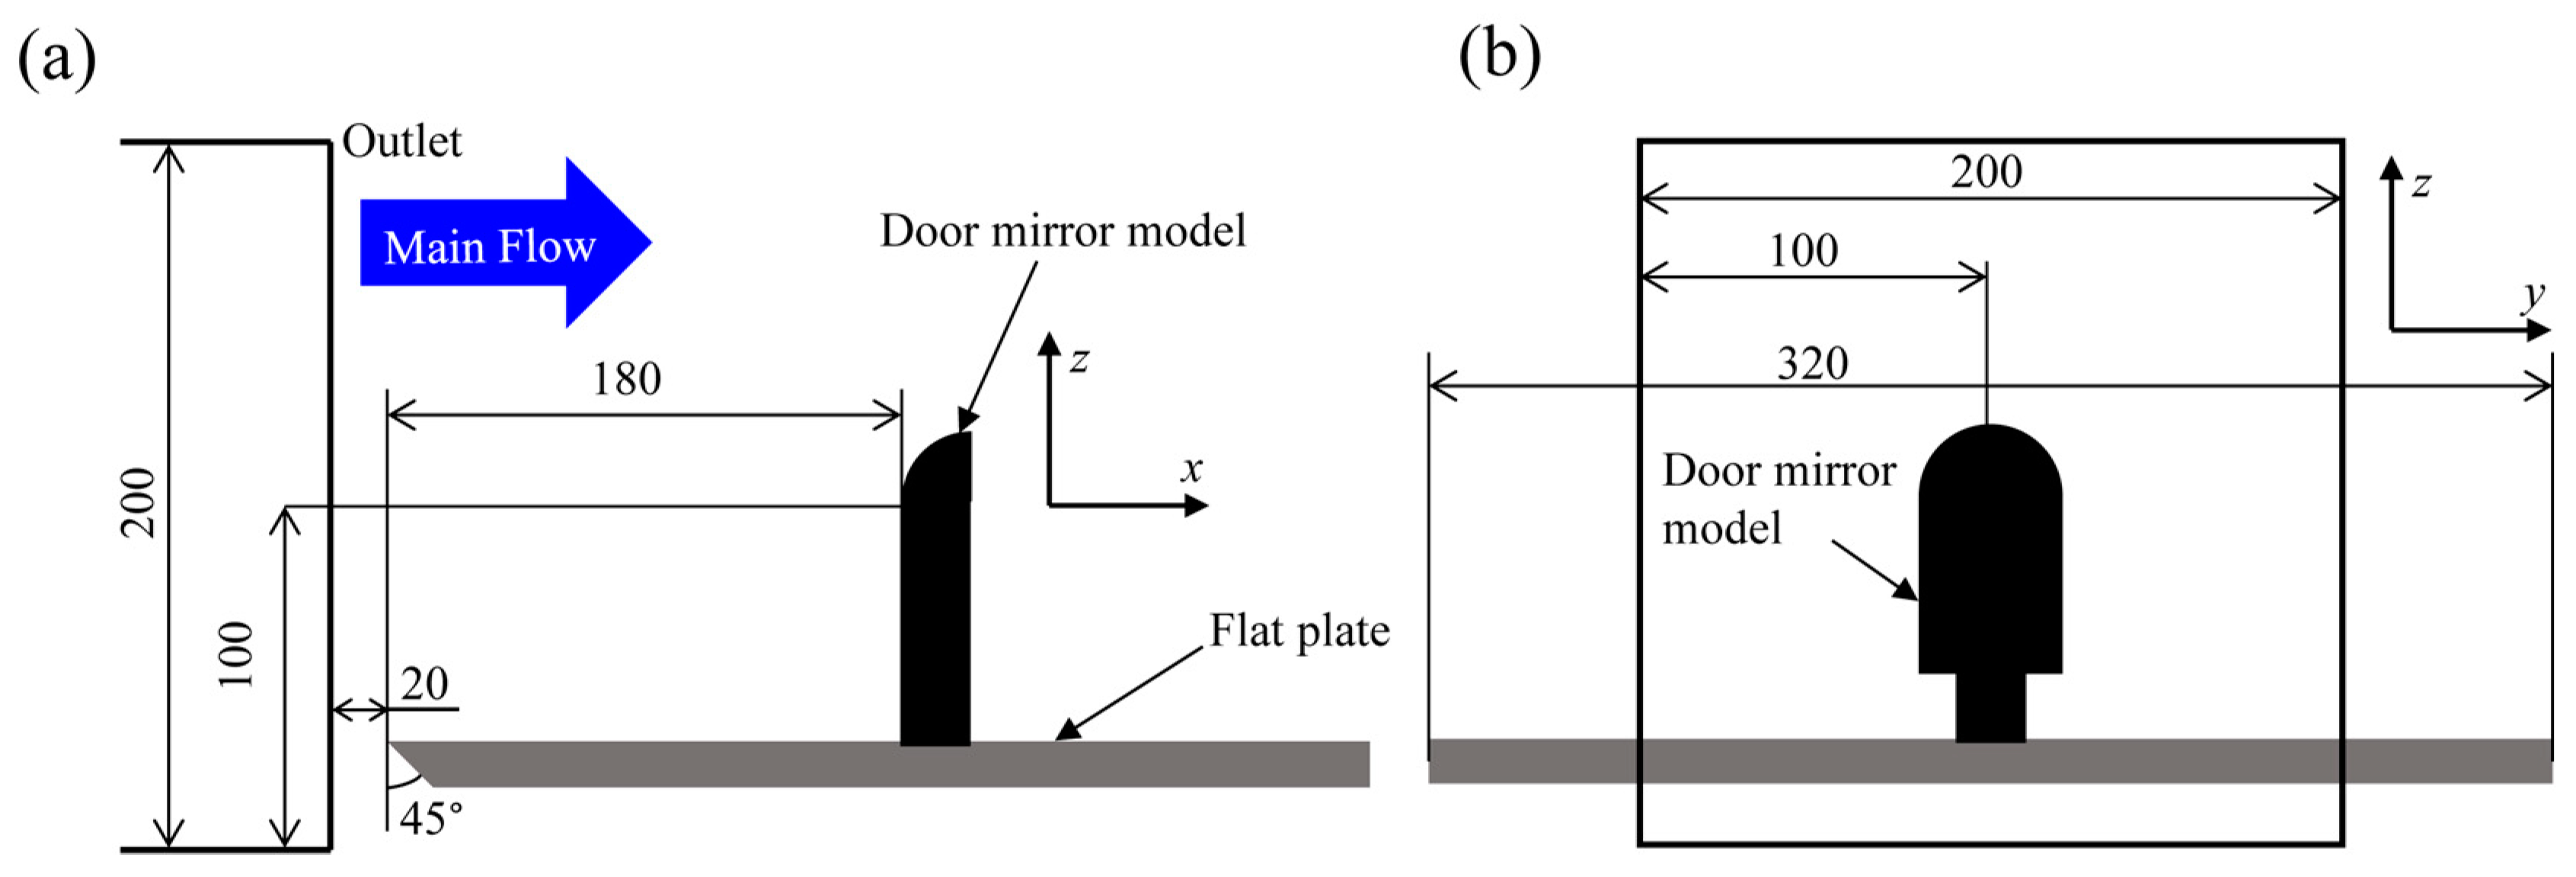
The model was installed on a flat plate that was fixed downstream of the exit with a 200 × 200 mm cross section in an open-circuit blowout wind tunnel. In this study, the main flow velocity (
U∞) was set at 5 m/s, and the Reynolds number (Re) based on the half cylinder diameter (
D) of the test piece as the representative length was Re = 1.3 × 10
4. The turbulent level of the incoming flow to the test piece was less than 0.4%. As shown in
Figure 3, the flat plate was inserted 20 mm downstream from the exit of the wind tunnel contraction section. On the other hand, the test piece was placed at 180 mm downstream from the leading edge of the flat plate, and the highest stagnation point of the half cylinder was adjusted in the middle of the blowout port cross section.
2.2. Particle Image Velocimetry (PIV)
The arrangement of the test section and PIV system is shown in
Figure 4. Dioctyl Sebacate (DOS) droplets atomized by a Laskin nozzle to the order of 1 μm in diameter were introduced into the flow as seeding particles, and the flows around the model were visualized using a 15 mJ/pulse double-pulse Nd:YAG laser (Litron Lasers, NANO S30-15PIV), and 300 pairs of flow images were acquired at 3.75 Hz using a cross-correlation camera (TSI Inc., PIVCAM13-8, 1280 × 1024 pixel resolution). An interrogation window of the square grid in 16×16 pixels was chosen, and velocity components (
u,
v) in the
x–
y cross section and (
u,
w) in the
x–z cross section were analyzed by the single-step interrogation algorithm using PIV software (TSI Inc., Insight ver. 3.53) with 50% overlap between adjacent interrogation windows. Velocity vectors exceeding a certain magnitude were deleted as error vectors. Velocity vector components in each grid were averaged by the number except for errors.
Since the size of the visualization area was different for each cross section, the image resolutions of each pixel were also varied to dpx = 170.5 μm/pixel in the x–y cross section and 130.0 μm/pixel in the x–z cross section, respectively. The laser pulse interval obtaining a pair of flow images (∆t) was set such that the maximal displacement of seeding particles near the acceleration region around the model during ∆t was less than four pixels. In this study, ∆t = 100 μs and 70 μs were set in the cases for obtaining a pair of images in the x–y and x–z cross sections. Since the minimum displacement of the seeding particle calculated by the sub-pixel interpolation in PIV image processing is about 0.1 pixel, the uncertainties of the velocity components in the x–y and x–z cross sections were calculated to be 0.17 m/s and 0.19 m/s by calculating 0.1 dpx/∆t, respectively. Therefore, the error of velocity in the PIV analysis was estimated to be less than 4% of the main flow velocity.
2.3. Pressure Measurement on the Model Surface
The static pressures on the model surface were measured using the static pressure holes placed at 14 locations on the back surface, as shown in
Figure 5. On the opposite side of the model back surface (inside of the model), stainless steel tubes (outer diameter: 1.6 mm) were inserted into 14 concave structures, where through-holes for differential pressure measurements (0.5 mm in diameter) were made in each center. The space between their holes and tubes were glued to prevent leakage. Flexible urethane tubes (inner diameter: 1.37 mm, outer diameter: 2.18 mm) connecting their static holes and a pressure scanner (Pressure Systems Inc., Model 9116) were pulled out of a support hollow to avoid disturbing flow around the model. The pressure scanner is composed of 16 independent silicone semiconductor piezoresistive elements and can measure the differential pressure from the atmospheric pressure. Time series of static pressure fluctuations at 14 locations were acquired at the same time by a sampling rate of 500 Hz. The time-averaged pressure coefficient (
Cp) was also computed based on the time-averaged data at the 14 locations. The 60 s (30,000 points by each channel) between 10 and 70 s after the PA started operation were adopted for calculating the time-averaged value.
Cp is defined as follows:
where ∆
p and
ρ are the difference between the pressure measured in the static hole and atmospheric pressure, and air density, respectively. This pressure scanner with the temperature compensation function can measure the differential pressure at each channel ranging from −2.5 kPa to 2.5 kPa relative to atmospheric pressure, and static accuracy including combined errors due to non-linearity, hysteresis, and non-repeatability is shown to be ±0.05% FS in the specifications, which corresponds to the measurement error of 2.5 Pa.
In the pre-process measuring pressure fluctuations, each channel of the pressure scanner was reset to zero under the quiescent flow condition. Before and after PA operation for 80 s, pressure fluctuations without PA operation were obtained for 15 s to estimate the pressure coefficients under the condition of without flow control (before: ∆p (t < 0), after: ∆p (t > 80)). The standard deviation in a series of experiments for the difference between time-averaged ∆p (t < 0) and ∆p (t > 80) was less than 0.25 Pa. On the other hand, the standard deviation of ∆p (t < 0) (or ∆p (t > 80)) was 0.13 Pa at each experiment. From the analysis of these uncertainties, the cumulative error was evaluated as 0.01 in terms of Cp. In addition, the time-averaged ∆p (t < 0) was different in each measurement due to non-repeatability. Therefore, the time-averaged ∆p (t < 0) obtained under various PA driving conditions was averaged in order to determine the baseline. For estimating Cp, conclusively, ∆p under flow control during each measurement was offset by the difference between the time-averaged ∆p (t < 0) and baseline.
2.4. Drag Force Measurement
Aerodynamic drags acting on the model under various PA driving conditions were measured using a three-component force transducer (Kyowa Electronic Instruments Co., Ltd., LSM-B-5NSA 37-P, rated capacity: 5 N). The experimental setup of force measurement is illustrated in
Figure 6. Each component force in the
x (drag),
y, and
z axes measured by the three-component force transducer was converted to an analog voltage signal by a strain gauge built into the dynamic strain measurement system (Kyowa Electronic Instruments Co., Ltd., DPM-911B), and then recorded by a digital oscilloscope (Tektronix Inc., DPO-4034). Time series of three component forces were acquired at a sampling rate of 1000 Hz, and here, the drag coefficient (
CD) was evaluated with an averaged value for 60 s (60,000 points). The
CD is defined as follows:
where
Fx is the aerodynamic force in the
x-axis component, and
S is the projected area of the model. Note that measured
y and
z axes component forces were referenced to confirm the proper setting of the model and the magnitude of vibration.
In the catalog specification, the measurement accuracy of the three-component force transducer is shown as 0.001 N, which is equivalent to 0.024 in terms of a drag coefficient under the without flow control condition at Re = 1.3 × 10⁴ in this study. In addition, as a result of calibration using a standard weight, the ratio of load to output voltage shows high linearity with changes in load near the maximum load on the test piece. The measurement accuracy of Fx due to non-linearity and non-repeatability was less than 0.03 N in the case of without flow control at Re = 1.3 × 10⁴ in this study.
In measuring the drag force, each channel of the three-component force transducer was reset to zero under the quiescent flow condition at first. Before and after PA operation for 80 s, the drag force fluctuations without PA operation were obtained for 5 s to estimate the drag coefficients without flow control (before: Fx (t < 0), after: Fx (t > 80)). The standard deviation in a series of experiments for the difference between the time-averaged Fx (t < 0) and Fx (t > 80) was less than 0.000015 N. On the other hand, the standard deviation of Fx (t < 0) (or Fx (t > 80)) was 0.00018 N in each experiment. From the analysis of these uncertainties, the cumulative error was 0.02 in terms of CD. Moreover, time-averaged Fx (t < 0) was varied in each measurement due to non-repeatability at Re = 1.3 × 10⁴. Therefore, the time-averaged Fx (t < 0) obtained under various PA driving conditions was averaged in order to determine the baseline. For estimating CD, conclusively, Fx under flow control during each measurement was offset by the difference between the time-averaged Fx (t < 0) and baseline.
2.5. Driving Conditions of PA
In this study, the base frequency of sinusoidal voltage (
fp) and peak-to-peak voltage (
Vp-p) were set at 10 kHz and 16 kV, respectively, for driving of the string-type PA. The string-type PA was operated in burst modulation control [
3,
4,
9].
Figure 7 shows the waveform patterns of the applied sinusoidal voltage. Unlike the waveform in the case of continuous control (
Figure 7a), the burst control (
Figure 7b) has the two time periods that the PA switches on (
Ton) and off (
Toff). Here, the dimensionless burst frequency (
fm+) and duty ratio (DR) are defined as follows:
where
fm,
U∞,
Ton, and
Toff indicate the burst frequency, main flow velocity, duration in one cycle for driving PA under burst control, and duration in one cycle for switching PA off under burst control, respectively. In this study, in order to investigate the influences of the
fm+ on flow around the model and the drag force acting on the model,
fm+ varied from 0.04 to 16 (0.04, 0.07, 0.1, 0.13, 0.16, 0.2, 0.27, 0.32, 0.4, 0.5, 0.53, 0.64, 0.8, 1.0, 1.28, 1.6, 2.0, 3.2, 8.0, and 16) with fixed DR = 20%.
4. Discussion
In the previous section, the results showed that the drag measured was increased by the flow control with all burst frequencies considered while the length (
Xrev/
D) and width (
Yrev/
D) of the recirculation region (the characteristic length of the wake) were decreased. In general, when the recirculation area caused by flow separation shrinks in wake flow around the bluff body, drag force is considered to be decreased because of the velocity deficit reduction. For example, Michelis and Kotsonis [
32] also tried to mitigate flow separation on the door mirror of a truck by installing a sheet-type PA in the guide vane adjacent to the side mirror of a full-scale truck and found that momentum deficiency was suppressed by driving the sheet-type PA. However, when the flow around the bluff body is three-dimensional, the drag force can increase, as shown in this study, even if the momentum deficit was recovered in the two-dimensional cross section of velocity distributions. Indeed, the results shown in
Section 3.2, 3.3, and 3.4 clarified that
CD under burst control was increased since the entrainment of separation flow into the model back surface was enhanced by driving the string-type PA, and the model was pulled downstream by the low-speed structure that approached the back surface.
In this section, the correlation between the controlled flow patterns and the drag force acting on the model is analyzed and discussed. To discuss the control effects on the pressure on the model surface and the drag acting on the model, the rate of spatial-averaged
Cp based on the 14 locations shown in
Figure 5 (
) and
CD under control compared to that without control (
γp and
γD) [
17] are introduced and defined as follows;
Figure 22 shows the effects of
fm+ on the surface pressure and drag force acting on the model. The change of
γp with respect to the variation of
fm+ correlates with the change of
γD with respect to the variation of
fm+. Also, although the
γD varies due to the flow control,
γD becomes larger than that in the cases considered. These results mean the drag forces acting on the model increase in comparison with that of the case without the control. The
γp and
γD firstly increase in the ranges of 0.04 ≤
fm+ ≤ 0.53, then both reach their maximum value at near
fm+ = 0.53 and start decreasing with an increase in
fm+. When
fm+ becomes larger than three, the changes of
γp and
γD are not significant. The maximum increase in
CD is approximately 7% compared to the case of without control.
Figure 23 visualizes the recirculation region by the contour line of
u/
U∞ = 0.0 for the cases with and without the control. The contour lines shown in
Figure 23 indicate the change of the recirculation region due to the variation of
fm+. The length and width of the recirculation region shrink with the increase in
fm+ up to 0.5, but it enlarges when
fm+ exceeds 0.5. From the contour lines in the
x–
z cross section, basically, the response of the length and width of the recirculation region to the variation in
fm is similar to that observed in the
x–
y cross section. However, due to an asymmetric geometric feature in the
z-direction and the presence of the wall beneath the bottom of the model, the recirculation region is formed in the lower part rather than the boundary between the quarter sphere and the half cylinder (
z/
D = 0). The height (
Zrev/
D) of the recirculation region length in
x/
D < 1.25 increases by the control while the length (
Xrev/
D) of the recirculation region length below
z/
D = 0.0 decreases. These flow patterns imply that the recirculating flow in the model wake exhibits the three-dimensionality.
It is interesting that the changes of wake structures (i.e., recirculation region) in the
x–
y cross section in the cases of the drag increase are similar to those observed in the flow control on a square back shaped 3D bluff body model using the pulsed jets [
16,
17]. In particular, the drag increased when the recirculation length in the wake was shortened by the flow control with the non-dimensional forcing frequency normalized by the model height and freestream velocity being around 0.8. On the other hand, the drag decreased by the flow control with a higher non-dimensional forcing frequency than four [
17], which was not be observed in the results presented in the current study. In the previous study [
17], the wake manipulations in terms of the enhancement of the momentum entrainment and recirculation length were responsible for the mechanisms of these drag changes. The enhanced entrainment decreasing the length of the recirculation region was proposed for low-frequency forcing work in all the controlled cases. Although an aerodynamic wake sharpening was also observed in the results of the current study, little reduced entrainment due to the control with high-frequency forcing was observed. This difference observed in the controlled wake structure might cause an increase in drag force acting on the model with high-frequency forcing. In addition, if the direction of the main flow is not parallel to the square back shaped 3D bluff body model, another mechanism of the drag reduction [
18] and dependencies of drag change mechanisms on Re and the magnitudes of induced jet velocity were reported [
17].
In short, the elongation of the recirculation length in the main flow direction plays an important role in drag reduction based on the observations from the results of current and previous studies [
16,
17,
18]. The main control effect of the string-type PA with the burst modulation on the flow around the curved surface 3D bluff body model is the aerodynamic wake sharpening with the enhanced entrainment. We consider that the mechanism underlying the drag increases by driving the string-type PA is due to a decrease in pressure of the model back surface associated with the movement of the recirculation region. For the future works, 3D base flow around the 3D curved surface bluff body model under different flow conditions (e.g., Re and the angle of main stream) and multiple string-type PAs with different burst frequencies and the flow control with control laws [
29,
33] should be investigated.
5. Conclusions
In this study, the active flow control using the string-type PA was applied for the door-mirror like bluff body with curved surface at Re of 1.3 × 10⁴. The effects of burst frequencies and duty cycle ratios on flow structures around the model and drag force acting on the model were investigated. Although the drag reduction was not realized by the flow control using the string-type PA, the effects of control on flow structures around the bluff body with the curved surface, as well as the relationship between flow structures and drag force generation, were analyzed in detail. These findings could be used for improving the flow control using the string-and sheet-type PA for bluff bodies at Re of O(104).
In addition, the contribution of this research to the scientific community is considered as follows: (i) to offer further understanding of flow structures around the bluff body with curved surface with/without the string-type PA, (ii) to provide the results of analysis regarding the operational parameters of PA such as duty cycle ratio and modulation frequency, and (iii) to assess the relationship between surface pressure and PIV measurement data and drag force acting on the model in order to explain the reason of drag increase. We consider that all the results and discussions presented in this study can contribute to improving flow control techniques for bluff bodies with three-dimensional curved surfaces.


 ,
, 