4.1. The Effect of Flow Rate on the Fracture Initiation Pressure
Usually we call the maximum pressure as the breakdown pressure and it seems that the rock sample is fractured and fails when the pressure reaches the maximum. However, the rock around the wellbore bottom already begins to be fractured before the maximum pressure [
41]. To properly make sure the fracturing initiation pressure is helpful to analyze the rock properties, such as failure stress, tensile stress, and shear stress in real field hydraulic fracturing. Accurate estimation of fracturing initiation pressure is also important for the effective and efficient designing of hydraulic fracture schemes. It will directly influence hydraulic fracturing method and difficulty in field-scale operations [
42].
To find out the time of fracturing initiation, we firstly analyze the hydraulic fracturing process. When the wellbore is full of water, the pressure will rise quickly. When enough fluid is pressurized, a fracture initiates from the bottom of the wellbore, and some new volume is induced. The pressurized fracturing water near the wellbore bottom expands to fill the new initiated flaw volume, and thus reducing the wellbore pressure. At the same time, the pressurized water will naturally, via syringe, quickly flow into the wellbore to compensate this pressure drops. As the new pressurized water volume is larger than the new induce crack volume. This may induce higher pressure in the wellbore, but wellbore pressure would not increase obviously. As a result, we can find that the highest fracturing pressure always lasts for a while from the fracturing pressure recording curve. This phenomenon will definitely cause the decrease of the pressurization rate. Then the initiated fracture will propagate towards the boundary of the sample and more volume is developed. When the pressurized fluid cannot compensate the new volume. The pressure curve declines. When the fractures reach the sample’s boundary and the fluid flows out of the sample, the pressure becomes stable. The pressure does not fluctuate and the pressurization rate become zero.
Based on the analysis of fracturing process, we find that the pressurization rate could be used to indicate the fracturing initiation, fracturing termination, and propagation time. In
Figure 8a–f, the red curves are the pressurization rate curves. When the wellbore is not full of fracturing fluid, the pressure keeps at zero and the pressurization rate is also kept at zero. Then the pressurization rate rapidly rises and usually fluctuates in a constant vale for a while at the top of the curve. In this period, fluid is full of the wellbore and still pressurized into the wellbore, no fracture is initiated. As the flow rate is constant, the pressure rises approximately linearly with time, and the pressurization rate is almost constant with little fluctuations. The beginning of a quick decline in the pressurization rate curve could be considered as evidence of the fracture initiation point. As the rock in the wellbore bottom could not withstand the high pressure, the fracture initiates, micro cracks are induced, thus, the wellbore pressure increase rate reduces. This is the reason that the new pressurized water expands from the wellbore to fill the new induced fracture volume and the new pressurized fluid cannot absolutely compensate the pressure reduction, consequently the pressurization rate decreases. When the fracture tip is going to hit the sample boundary, the pressure is almost equal to fluid friction loss pressure along the pathway, the pressurization rate rises and gradually becomes zero.
Based on the above analysis, the fracture initiation pressure could be regarded as the time when the pressurization rate begins to rapidly decrease, at which the fracturing pressure has not yet reached the maximum value (see
Figure 8a–f). We can find that, from
Figure 8a–f and
Table 3, with the flow rate increase, the initiation pressure also increases. Hence, the injection flow rate influences the initiation pressure in hydraulic fracturing.
Figure 9 shows the initiation pressure under different injection flow rates in different tests, the initiation pressure is approximately positive linearly increasing with the injection flow rate. For instance, the initiation pressure ascends from 21.06 to 32.52 MPa as the injection flow rate is increased from 5 to 30 mL/min, the initiation pressure increases 54.42%. And the coefficient of determination was 0.9808.
4.2. The Effect of Flow Rate on the Fracture Propagation Time
The measurement accuracy of hydraulic fracturing pressure depends on the accurate interpretation of the fluid pressure–time curves [
43]. The fracture propagation time is a crucial parameter to estimate fracture extension range in field scale hydraulic fracturing [
44]. In development process of oil, gas, and geothermal fields, the time of hydraulic fracturing will also directly influence the number and magnitude of the induced earthquakes [
45].
In laboratorial hydraulic fracturing tests, the fracture propagation time is usually the time interval that it takes from the fracture initiation until it grows all the way to the boundary of the experimental sample from the wellbore bottom. After a fracture is triggered, the fracture grows, more and more new volume will be induced, and the wellbore pressure decline rate will accelerate. This is shown in
Figure 8, where wellbore pressurization rated (red curves) are decreasing after the fracture initiation points. It could be considered to be the beginning of the fracture propagation. When the fracture reaches the sample boundaries, the fluid begins to flow out into fracturing capsule from the fractures. The pressure in the wellbore is now equal to frictional pressure that the fracturing fluid loses along the fracture pathway. As the fracturing pressure is stable and does not change with time and the pressurization rate becomes zero without fluctuation. This is the time point (see
Figure 8) that could be practically considered as the fracture propagation ending, and the remaining the pressure–time data represent the new injected water flowing via the fracture pathway. Through the pressurization rate curve, we can easily determine the propagation time. The fracture propagation time (see
Figure 8) could be considered as the time interval between the fracture initiation and the fracture end.
The propagation time of a granite specimen with different injection flow rates is shown in
Figure 10. As shown in
Figure 10, with the increase of injection flow rate, the propagation time has a linear decrease trend. The propagation time decreases from 613 to 88 s when the injection flow rate increases from 5 to 30 mL/min, the propagation time decreases 85.64%. At the same time, the propagation times are linearly fitted with the determination coefficient of 0.9851. This relationship represents that with the increasing of injection flow rate, more fluid is pumped into the wellbore in the same time interval, more new volume is created, the fracture propagation rate also increases, and the fracture propagation time decreases.
Usually, induced earthquakes are accompanied with a whole hydraulic fracturing process, a longer fracture propagation time always means that more earthquakes are triggered [
45]. In an in-situ project, a traditional view is that the maximum induced earthquake magnitudes are only related to the volume of injected fluid [
46]. Therefore, to get a good fracture network and avoid a dangerous earthquake, a small injection flow rate with a long propagation is always adopted in field-scale operation over recent years [
47,
48]. Whereas, this method also could cause a large earthquake, for example, hydraulic fracturing of the Pohang hydraulic fracturing project almost lasted several months over two years, a M
w 5.5 earthquake was caused, this earthquake injured about 70 people and induced extensive damage to the Pohang city [
49]. Since the seismographs were firstly installed in 1905, this induced earthquake was the most damaging, and the magnitude is second-largest in South Korea [
50]. As a result, it is necessary for hydraulic fracturing to choose a reasonable fracturing propagation time.
4.3. The Effect of Flow Rate on the Post-Fracturing Pressure
The post-fracturing pressure is the almost constant pressure with time after the fracture reaches the rock boundary, when the fracture length does not increase. This time point is illustrated in
Figure 8a, after this time point, the pressure–time data recorded is just showing the process that water flows via the created fracture to rock boundary. The pressure in the wellbore remains almost constant. It is noteworthy that the post-fracturing pressure behavior is very similar to the fluid injection pressure during the heating extraction stage or petroleum extraction stage after hydraulic fracture in the field for an in-situ project. This injection pressure (post-fracturing pressure) is based on the concept that when constant viscous fluid in isothermal reservoir condition flows through a constant length fracture pathway, the frictional pressure loss along the pathway does not change with time. In an in-situ project, the requirement for hydraulic fracturing technology is very high. If the fractures are too developed (indicating a low post-fracturing pressure), the water flows too fast in the fractures, the heat exchange time between the rock mass and water is short, the heat transfer is insufficient, and the water temperature at the water outlet well is low. The thermal energy cannot be well exploited. If few fractures propagate insufficiently or the fracture channel is narrow (indicating a high post-fracturing pressure), the water cannot flow through the inlet wellbore to the outlet wellbore well, it may result in serious water loss or less water could flow out of the outlet wellhead. We will not yet achieve the purpose of thermal energy exploitation. Therefore, in hydraulic fracturing, we need properly propagated fractures, water not only can flow well in the fracture, but also can have a good heat transfer with rock thermal reservoir along fractures. However, the fractures cannot be directly observed after hydraulic fracturing in field-scale operation, and we need to find other methodologies to interpret the fracturing pressures.
In laboratorial hydraulic fracturing experiments, the post-fracturing pressure is the frictional pressure loss when fluid flows through the whole fracture system. It is in accordance with the injection pressure during the in-field heat extraction phase and could directly reflect the fracture condition and it is an important parameter to determine the heat extraction efficiency and to evaluate the hydraulic fracturing results.
As the injection flow rates are different in tests, the post-fracturing pressures could not be used for analysis directly. To test the fracture network and contrast the post-fracturing pressures in different tests, the flow rate is change to 5 mL/min at the end of each test. If injection flow rate was greater than the least flow rate, new fractures might be triggered for the samples whose flow rate (the flow rate in
Table 3) was lower during hydraulic fracturing experiment stage. So, we choose the lowest flow rate when revising the post-fracturing pressures.
Table 4 presents the post-fracturing pressures when the flow rates are changed to 5 mL/min, they are called the revised post-fracturing pressures. We can see that a higher injection flow rate during the experimental (hydraulic fracturing) phase, a lower revised post-fracturing pressure is caused.
As shown in
Figure 11, the revised post-fracturing pressure is linearly decreasing with the injection flow rate increasing. The revised post-fracturing pressure decreases from 11.2 to 1.43 MPa (a gradient of 87.23%) when flow rate increases from 5 to 30 mL/min. And after linearly fitted the revised post-fracturing pressure data, a coefficient of determination 0.9926 is achieved. We can see that a lower revised post-fracturing pressure corresponds to a lower injection flow rate after hydraulic fracturing, a higher revised post-fracturing pressure corresponds to a higher injection flow rate. It means a lower injection flow rate may cause a fracture network with less fractures and narrow channels for water flowing through, whereas a higher injection flow rate may lead a developed fracture network that water could easily flow through.
The post-fracturing pressure is an effective parameter to estimate the fracture opening and leak off during hydraulic fracturing [
43]. It also could help to analyze the fracture geometry, length, and smoothness, a lower post-fracturing pressure usually corresponds to a better-connected fracture network with longer and smoother fracture branches [
51]. The post-fracturing pressure is an indispensable parameter when predicting the productivity of wells after hydraulic fracturing [
52]. Therefore, it is necessary to correctly identify the post-fracturing pressure and find out its changing laws.
4.4. The Effect of Flow Rate on the Fracture Breakdown Pressure
Usually, the fracture breakdown is defined as the time point when the pressure in wellbore reaches the maximum, this means that fracture breakdown typically occurs after the point of initiation [
53,
54,
55]. The fracture-initiation pressure is the time point when a tiny defect near borehole begins to propagate and the breakdown pressure is usually larger than the fracture-initiation pressure [
41,
56]. In general, we need to distinguish the initiation pressure and breakdown pressure when considering the problem of fracture propagation.
The breakdown pressure always occurs after the initiation pressure when the fracture is just initiated and the new created volume cannot compensate the injected fluid. The breakdown process represents a situation that the water supply (the amount of water injected into the wellbore) is greater than the water demand (the water volume needed to propagate the fracture), the wellbore bottom pressure continues to rise. A higher pressure (breakdown pressure) will be caused.
The initiation pressure represents the pressure when the fracture begins being initiated. It is a parameter that could reflect the properties of the rock sample. The breakdown pressure is the maximum pressure value in the pressure curve and it could be used to help to design the fracturing scheme, select a fracturing pump, and estimate the fracture range in field operation [
57]. Therefore, it is necessary to separately analyze the initiation pressure and the breakdown pressure, whether for laboratory research or field scale engineering.
Figure 12 shows the change trend of the breakdown pressure under influence injection flow rate increase. The breakdown pressure is almost positive linearly increasing with the increase of injection flow rate. The coefficient of determination is 0.9943 after linearly fit. The breakdown pressure increases from 22.12 to 36.01 MPa when the injection flow rate increases from 5 to 30 mL/min, the breakdown pressure increases 62.79%.
The breakdown pressure is a very important parameter during the hydraulic fracturing process [
11]. A previous study also showed that it could influence the fracture propagation patterns and fracture morphology [
43,
55,
58]. The fracture approach mechanics of hydraulic fracturing was mainly determined by the breakdown pressure yet [
59]. This parameter is widely used when analyzing the fracture behavior in a laboratorial test, numerical simulation, and in-situ project [
15,
43,
56,
60]. As a result, it is crucial to correctly determine the breakdown pressure and analyze its changing trend with the injection flow rate.
4.5. The Effect of Flow Rate on the Fracture Geometry
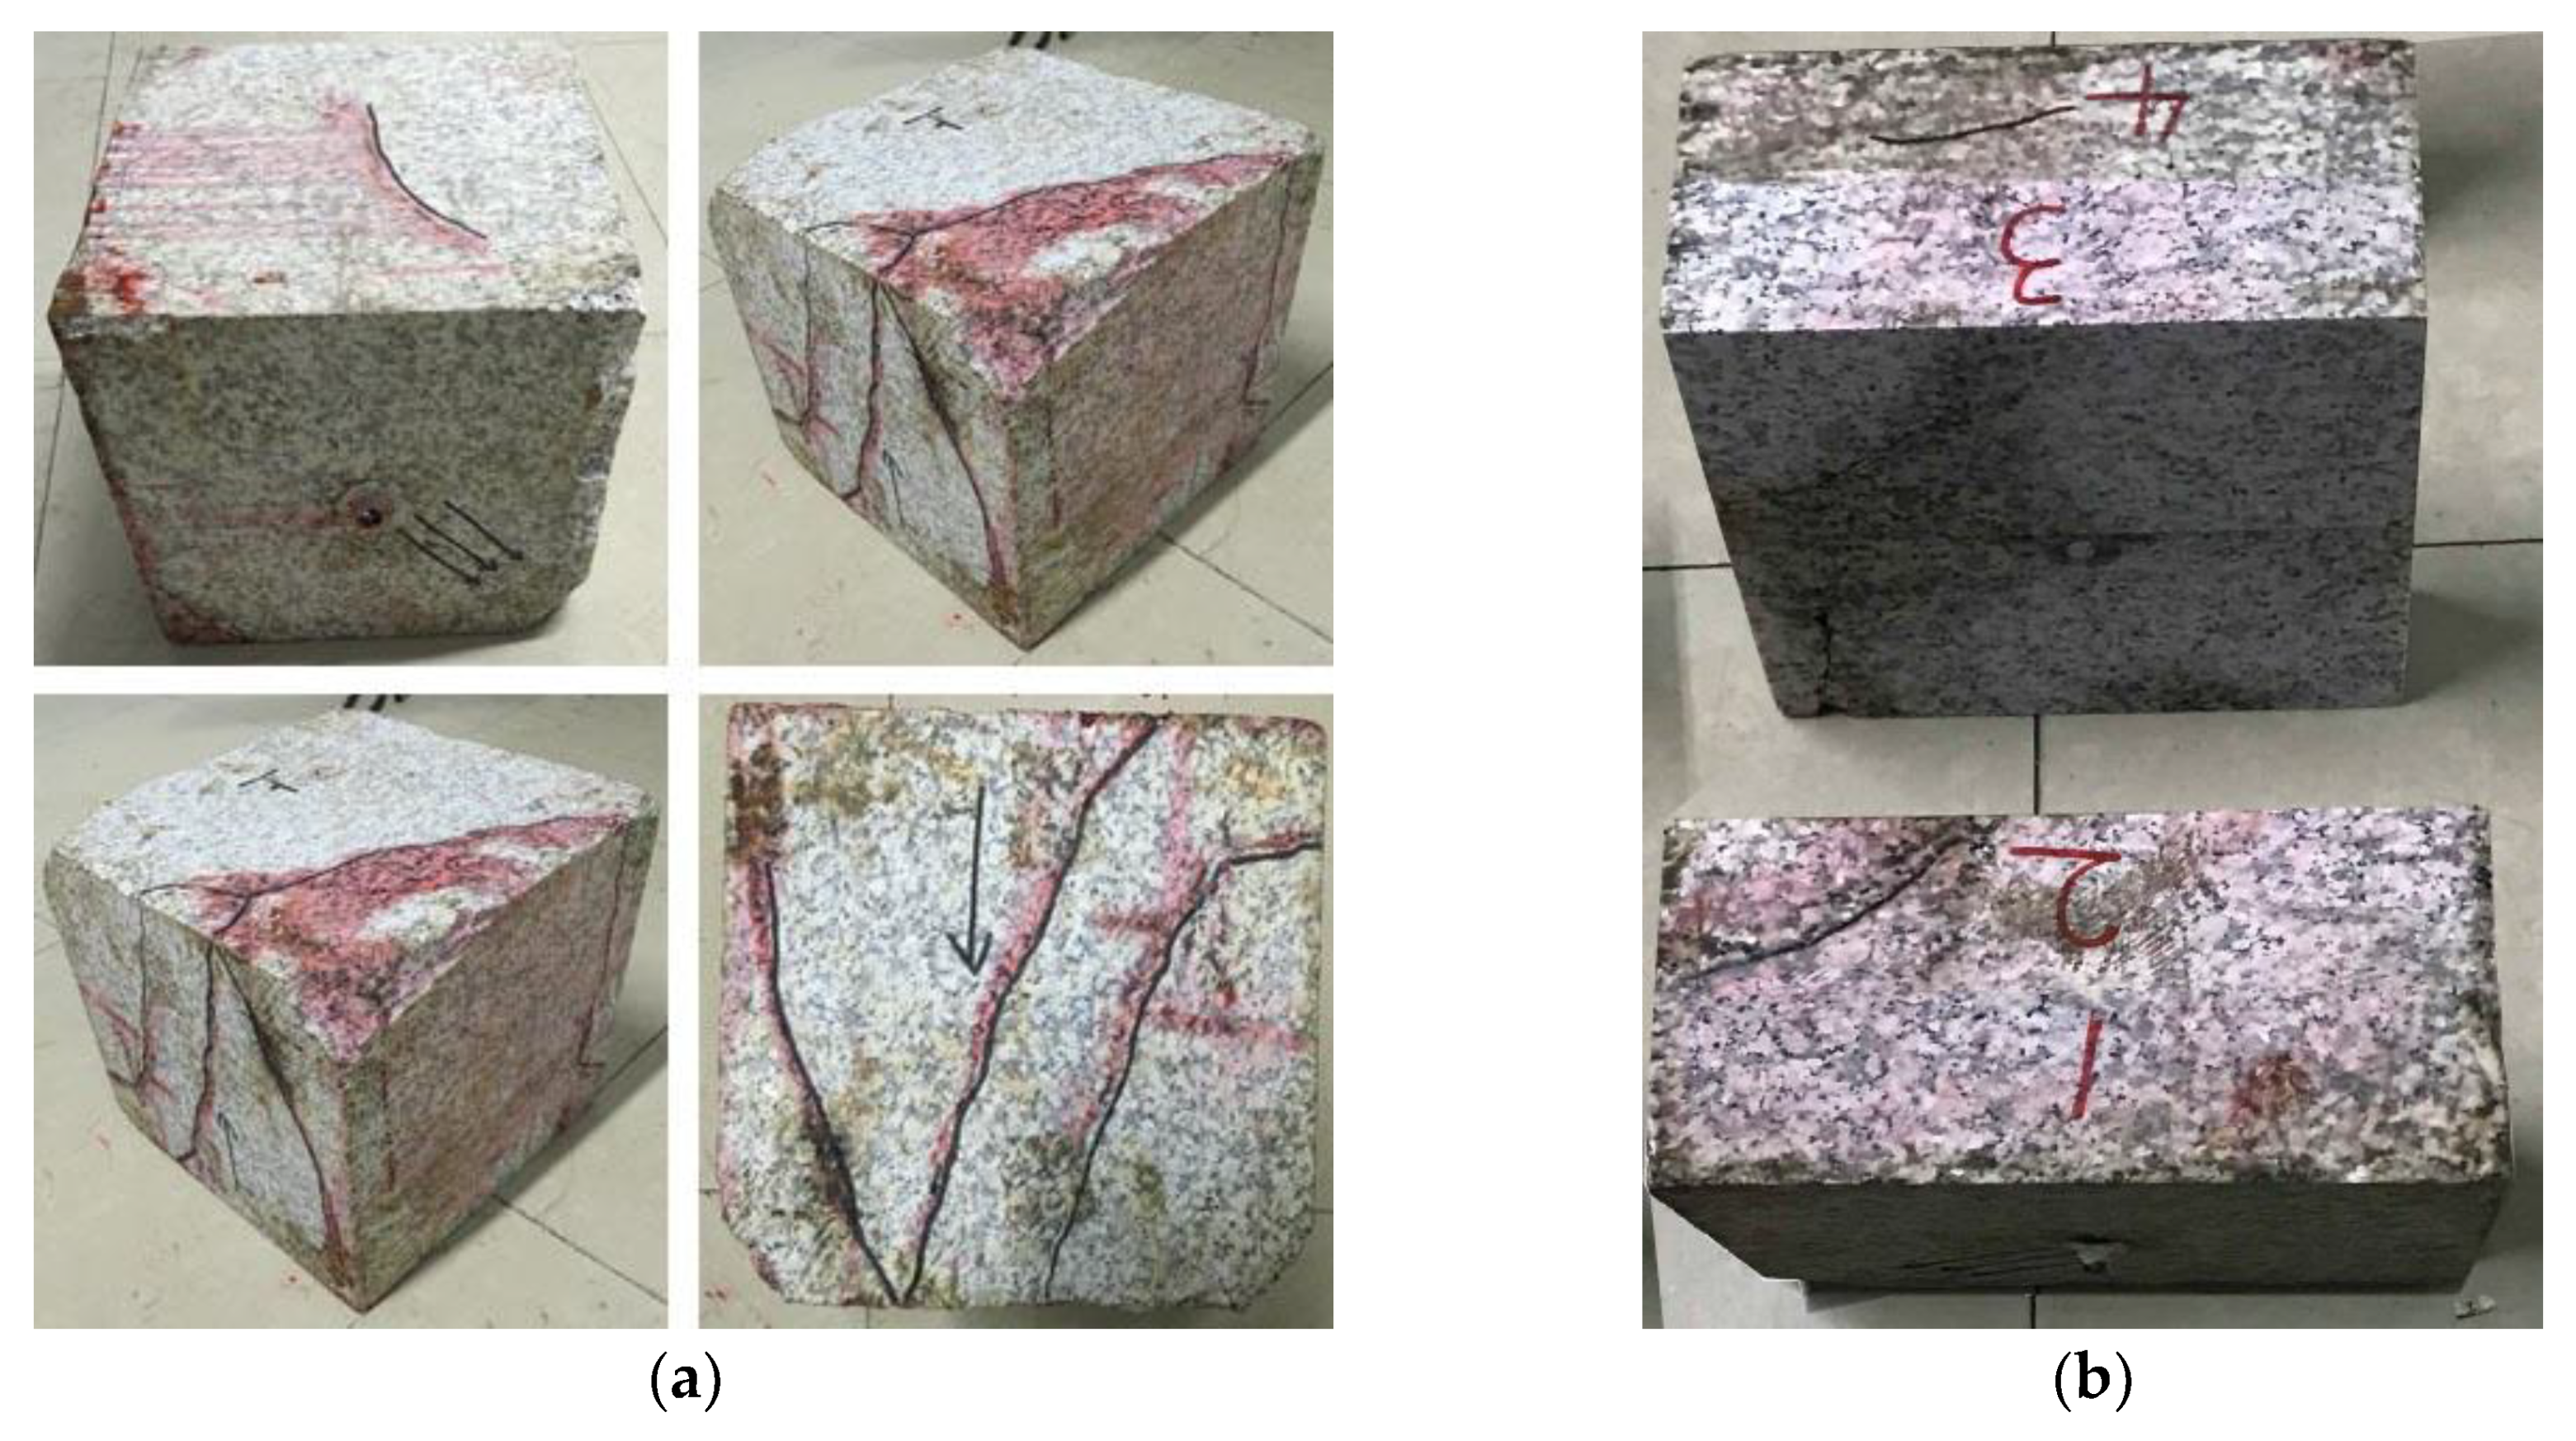
The fracture geometry is of vital importance for the evaluation of hydraulic fracturing effect. The fracture length, height and morphology are important indexes to access the hydraulic fracturing results and investigate fracture extension patterns. To clearly observe these indexes of the fractures, the samples are cut in half at the wellbore bottom.
Figure 13a–f show the fractures of test No. 1–6 samples.
Table 5 presents the fracture total lengths.
In
Figure 13a, only a two-wing fracture is induced in the Preferred Fracture Direction (PFD), that is the maximum principle pressure axis direction, the direction of the fracture is almost perpendicular to the direction of the minimum stress. In
Figure 13b, only a two-wing fracture is induced. The upward fracture and downward fracture have angles of about 15.4° and 19.2° with the PFD respectively, the propagation angles are small, and the fractures are considered along the PFD. In
Figure 13c, a three wing fracture is induced. The upward fracture propagation angle is 30.0°, which is larger than the two downward ones (14.8° and 19.44°). As the angles are less than 45°, the angles are closer to the maximum stress axis, and the downward fracture in left propagates a short path then turns towards the PFD. As a result their propagation directions could be considered to be along the maximum principle pressure direction. In
Figure 13d, only a two-wing fracture is propagated. The fracture propagates downwards and upwards both in a curved way, and the upward fracture turns towards PFD in a distance away from the wellbore. The downward fracture could not be obviously observed towards to PFD. In
Figure 13e, three wings are initiated from the wellbore. The wing that propagates to the upper left has an angle of 34.3° with respect to PFD. The two wings that propagate to right almost against the PFD near the wellbore. Then the upper right one changed its direction towards the PFD. The lower left one propagates into three branches away from the wellbore, and two of them develop towards the PFD and merge upward into one fracture. The downward branch propagates along the PFD at first, and then develops against the maximum stress at the lower edge of sample. In
Figure 13f, this test exhibited a multiple fracturing distribution, a fracture system with three wings are initiated from the wellbore. The upward wing propagates almost along the PFD. The upward one is the widest fracture and could be considered as the main hydraulic fracture. However, its three branches are almost against the PFD. The left downward wing is initiated along the PDF and then grows in a curved path to the lower left, its only branch propagates against the PFD. The right downward wing is initiated against the PFD at first and then its branch propagates along the PFD.
It was expected that a fracture propagation direction would be vertical along the PFD, perpendicular to the minimum principle stress. However, only the fracture in Test 1 (
Figure 13a) propagated almost along the PFD, and most of the others were initiated in an angle respect to the PFD. As it still can be seen from
Figure 13, fracture propagation in hydraulic fracturing is influenced by triaxial principal stresses (crustal stress in field). Although, sometimes the fractures are not initiated along the PFD near the wellbore, the fractures will gradually turn to PFD in curved paths as the fractures grow towards the boundaries of the samples. At last, the fracture propagate direction is the PFD. The reason is that the actual stress state near the wellbore zone is very complex. The initiation of hydraulic fracture is controlled by the in-situ stress, the wellbore, the wellbore internal pressure, the pore pressure, the rock stress condition, the rock anisotropy, and other mechanisms [
54]. As a result, the fractures may be initiated not along the PFD at first. Once the fracture has some length, fracture propagation rate is stable, the fracture tip moves far away from the wellbore and stress complex area, the fracture goes into a less-stressed region, and then the fracture propagation will be controlled by the triaxial stresses and along the PFD, as the injection pressure is less than the breakdown pressure in this time, this means that less pressure is needed for the fracture propagation.
We could also see that in Tests 4, 5, and 6, some fracture branches still did not approach the PFD when they reached the rock boundary, and even parts of them were perpendicular to the PFD. As shown in
Figure 13d–f, some of the main fractures, that propagated from the wellbore, could not be seen to turn towards the PFD when the fracture tips hit boundary. Fan and Hannes et al. [
35] performed a series of studies, and showed that with the increase of injection flow rate, the balance between fracture propagation and fluid injection could be broken, the fracture propagation would become unstable and fluctuated, and it meant that the fracture propagation pathway might be unpredictable. And sometimes, in the area around the wellbore, the fracture propagation would not obey the PFD law. This was in accordance with our experiment results. Higher injection flow rate meant higher pump pressure and more energy available for rock failure near the injection wellbore. More energy was introduced into the rock, the chances of creating a complicated fracture network were increased [
61]. The reason was that, when a lot of water was pumped into the wellbore in a short time, a high-pressure environment was formed rapidly at the bottom of the wellbore, this would lead the fracturing process to be similar to an explosion process, the fractures propagated rapidly from the wellbore to the rock boundary, and the hydraulic fracturing time was very short. As the energy and pressure were released rapidly, this kind of “exploded” fracture propagation pattern always triggered new tension fractures, and as a result, the fractures might not propagate along the PFD. Whereas, when the injection flow rate was low, the fracture propagation rate was low and the fracture tended to be shearing ones, shear fracturing always propagated along the weak points among the rock mineral particles approaching to the PFD and this process was controlled by the principal stresses [
26]. Usually, in high injection flow rate, the “exploded” phenomenon only influenced the rock mass near the wellbore, when the fractures propagated far away enough, the propagation turned to the PFD again. But in our tests, the side length of the rock sample was only 300 mm, it may be still in the influence of the “exploded”, so the fractures propagating towards the PFD was not obviously observed.
The description for the hydraulic fracture geometry was very important in the in-situ operation. A more complex and wider fracture might result in lesser frictional resistance and a higher permeability, the fluid flowed through the fractures would be more easily with less resistance, and as a result, in field-scale operations, the heat extraction time from rock would be short, the heat extraction efficiency would be low. On the other hand, fluid would suffer higher frictional pressures when flowing through a single narrow fracture. The flow rate was low and the heat extraction between fluid and rock was sufficient, whereas the total amount of fluid flowing through the fractures would also be low. As a result, the amount of the extracted heat was still low. So, an appropriate fracture geometry was vital for an in-situ project.
Analyzing fracture morphology after hydraulic fracturing would demonstrate how the injection flow rate could influence the fracture geometry. To compare and observe the fractures widths of different tests. We chose two parts to enlarge five times in the fracture photo of each test. In
Figure 13, with the increase of the flow rate, the fracture generally became wider.
Figure 14 showed the total length of the fractures varied with respect to injection flow rate. Generally speaking, the total length of fractures increased with the increase of flow rate. However, we could see that the total length of the fractures in Test 4 was less than that in Test 3. Combined with
Figure 13, from the enlarged fractures photos, we could see that the fractures of Test 4 were wider, and the corresponding revised post-fracturing pressure in
Table 4 was lower yet, it meant that the frictional resistance in Test 4 was lower than that in Test 3 when the fluid flowed through the fracture system, so it could be considered that it did not violate the flow rate-post fracturing pressure law. As a result, we could get that a higher flow rate led to higher initiation and breakdown pressures, wider fractures, and a more complex fracture system. This resulted in a higher connectivity of the fractures and a lower friction resistance for fluid flowing. The revised post-fracturing pressure in
Table 4 was in accordance with this conclusion.
When the injection flow rate was increased from 5 to 20 mL/min, the total length of fractures increased, but the increase trend, as shown in
Figure 14, was not obvious. When the injection flow rates were increased to 25 and 30 mL/min, the fractures total lengths had notable increase. Combined with
Figure 13, the fractures in Tests 1, 2, 3, and 4 (injection flow rate from 5 to 20 mL/min) formed a two-wing or a three-wing fracture, a fractured network in these tests was not induced. As a result, the increase of injection flow rate only increased the fractures width, but not in the fracture length. This meant the fractures in Tests 1–4 should be mainly shear fractures. When the injection flow rate was increased to 25 mL/min (Test 5) and 30 mL/min (Test 6), the “exploded” fracturing mode was trigger, the fractures were mainly tension fractures. Fracture networks formed in the both two test and hence the fracture lengths had obvious increase. It showed that when the injection flow rate was low, the shear fractures were induced, and the hydraulic fracturing usually formed a main fracture without branches. When the injection flow rate was high enough, the tension fractures could be trigged, the hydraulic fracturing could form a fracture network.
4.6. The Mean Injection Power
Figure 14 recognizes the relationship between the injection flow rate and fracture total length, although by increasing the injection flow rate, a longer fracture length is induced, the mathematical relationship between the two parameters were not gotten from
Figure 14.
To analyze the reason that injection flow rate could influence the geometry, width, and complexity of fractures. A new parameter called Mean Fracturing Power (
) is put forward. Each test has a specific flow rate (Q), the fracturing pressure (P) varies as a function of time (t). In view the injection flow rate unit (m
3/s), hydraulic fracturing pressure unit (N/m
2), and time unit (s), it could be realized that the unit of the product of fracturing pressure, injection flow rate, and time will be N∙m. This means that this product represents the energy that supplies for hydraulic fracturing. Hence, the
is defined as:
where
T is the fracture propagation time. The unit of
is power (W).
Table 6 shows the Mean Fracturing Power of Test No. 1–6.
The relationship between the mean fracturing power and the total length of fractures is shown in
Figure 15. The mean fracturing power has a good positive liner relationship with the fracture total length and the coefficient of determination is found to 0.9052. In most circumstances, especially in field, fractures cannot be observed and measured directly. And the fracture length is most important parameter to evaluate the hydraulic fracturing effect. Previous methods to the evaluate hydraulic fracturing are usually the drilling, micro-earthquake, and magnetotelluric method, these measurement methods sometimes cannot be used in field due to their high budget. As a result, estimating the fracture length is always a challenging work in field scale hydraulic fracturing. The fracture total length roughly positive increases with the increase of the mean fracturing power, hence we can use this relationship to roughly evaluate the fracture length in field with almost no cost. This linear relationship provides us with a new way to roughly predict fracture length.
4.7. The Permeability of the Hydraulic Fracture
Up until now, hydraulic fracturing is an imperative technique for economic exploitation of geothermal energy resources by enhancing deep buried rock permeability. Therefore, it is important to understand the permeability after hydraulic fracturing. Patel et al. [
62] proposed a method to estimate fracture permeability using the injection pressure data. This method hypothesizes that due to the injected fracturing fluid flowing into induced fractures, a drop of the injection pressure happens just after the breakdown phenomenon. This hypothesizes is in accordance with our aforementioned pressure sharply decrease reason. Here, we used this method to analyze the fracture permeability of the rock samples after test.
Figure 8a–f show the pressure curves the six tests. In these curves, just after the breakdown pressure, a sharp decrease in injection pressure (pump pressure) is observed. The drop down of the pressure is caused by the injected fluid diffusion when water goes into the new created fracture volume. The diffusion source is the water outlet hole in the steel tube. After the sharp descend in the pressure curve, the injected fluid flows into the rock sample through induced fractures. Therefore the pressure will obey a one-dimensional diffusion equation:
The solution to Equation (2) could be given by Equation (3):
where
t is the time after the breakdown,
D is the hydraulic diffusivity,
is the length of the fracture, and
is the breakdown pressure. Equation (3) can be used to modelling fit the experiment pressure curve,
,
z, and
t are known and then the hydraulic diffusivity could be estimated. The induced fracture permeability could be estimated from Equation (3) through hydraulic diffusivity with the equation Shapiro et al. [
63]:
where
is the dynamic viscosity of the fluid, K is the permeability, and N is defined as:
where,
where
is the shear modulus of the frame and
is the porosity,
,
, and
are the fluid bulk moduli, grain material, and dry frame, respectively.
Based on the Equations (2)–(9), the fracture permeability could be calculated by using hydraulic fracturing pressure curves of the six granite rock samples. The values of , , and are 2.18, 75, and 28.09 GPa, respectively. The and are 15.58 GPa and 0.0395 Pa·s, respectively, and the is 0.000,186,3 Pa·s.
The permeability was 0.92 1.21, 2.23, 3.32, 5.72, and 7.54 mD when injection flow rate was 5, 10, 15, 20, 25, and 30 mL/min, respectively. The value of estimated fracture permeability with injection flow rate is plotted in
Figure 16. The fracture permeability shows a positively ascend trend with the injection flow rate increase. And it means that a higher injection flow rate will cause wider, lager fractures. All of the rock sample permeability after hydraulic fracturing is higher than the sample original permeability. As the original permeability is 0.34 mD, the permeability is obviously promoted. When the injection flow rate increases by 5 mL/min every time, compared with the original sample permeability, the permeability is increased 1.71, 2.55, 5.56, 8.78, 15.81, and 21.21 times, respectively. When the injection flow rate is 30 mL/min, the permeability is the highest. In field-scale operation, we usually trend to create more fractures and form higher permeability, a higher injection flow rate is better. At the same time, this also puts forward higher requirements for technology and equipment, it may require more cost and more advanced equipment, hence the maximum permeability as the primary consideration may not be economical nor reasonable. Therefore, in the hydraulic fracturing process, it is necessary to consider fracturing scheme carefully, the injection rate can not only form a good fracture network, obviously improve permeability, but also ensure a reasonable cost. For example, for the five fracturing injection rates selected in this experiment, the 25 mL/min can be considered as the best. Although 5, 10, 15, and 20 mL/min increased the permeability to a certain extent, but the magnitude of the permeability is not increased higher enough, a fracture network is not formed, the hydraulic fracturing effect is not obvious. Whereas the 30 mL/min has obtained the maximum permeability, compared with the permeability result of 25 mL/min, the permeability is increased 31.82%, this promotion is not obvious enough. Considering the cost of a field operation, this increase is unworthy, so the injection rate of 25 mL/min can be regarded as the best, of course, this conclusion is only the based on the experimental result. In field, more factors should be considered when selecting a reasonable injection flow rate.
Pate et al. [
63] calculated hydraulic fracturing permeabilities, which are 2.28, 2.58, and 5.69 mD, when hydraulic diffusivities are 0.00086, 0.001075, and 0.00215, respectively. The estimated fracture permeabilities were compared with the fracture permeabilities measured by using AP608™ permeability test apparatus. Solberg et al. [
19] analyzed the hydraulic fracturing in low permeability sandstone rocks with kinds of injection rates. The permeabilities of rock are measured and the change of permeability before and after the experiment is compared. Their research shows that hydraulic fracturing induced permanent structural changes in the rock and increased rock permeability. The permeabilities are 0.38, 5.99, 24.89, and 13.76 nm
2 correspond to the pump rates of 3.0, 15, 30, and 70 mm
3/s. The estimated permeabilities are in close agreement with the measured ones. Our experimental conclusions were consistent with the results of Solberg and Patel et al.


