Analysis of the Use of Electric Drive Systems for Crew Transfer Vessels Servicing Offshore Wind Farms


Department of Ship Automation, Gdynia Maritime University, Poland Morska St. 83, 81-225 Gdynia, Poland
Energies 2020, 13(6), 1466; https://doi.org/10.3390/en13061466
Submission received: 9 February 2020
/
Revised: 16 March 2020
/
Accepted: 18 March 2020
/
Published: 20 March 2020
(This article belongs to the Section D: Energy Storage and Application)
Abstract
:The article presents issues related to the possibility of using electric propulsion systems in units used to transport crews servicing wind towers at sea. Offshore wind energy issues are discussed. Proposals for electric propulsion systems that could be used on units for transporting crews servicing offshore wind farms are presented. The possibility of using purely electrical drive systems or hybrid drive systems operating in a diesel-electric configuration is analyzed. By observing the motion of real CTV units, based on the data from the MarineTraffic service, a mathematical simulation model was developed, for which a number of simulations were carried out in the Modelica environment. The developed mathematical model takes into account the dynamic loads acting on the ship’s hull, hydrodynamic resistances, electric and diesel propulsion systems’ properties together with their individual elements’ characteristics. The tests of the electric propulsion system showed reduced fuel consumption (approx. 60%) and harmful gas emissions to the atmosphere (approximately 70%) in relation to conventional, internal combustion engine propulsion.
1. Introduction
Climate changes that have occurred on our planet in recent years are a motivation for research and development of various technologies related to renewable energy sources. One such technology with a very high potential for electricity production is the possibility of harnessing wind power with wind turbines. According to the predictions of the International Energy Agency (IEA) [1], the next twenty years will see an impressive development of offshore wind energy, contributing to the decarbonisation of energy systems and reduction of air pollution. Currently, offshore wind accounts for only 0.3% in global electricity production (with the top players being: Denmark, United Kingdom, Belgium, and The Netherlands with 16%, 8%, 5% and 3% of the total yearly electricity consumption, respectively). The wind’s potential is so enormous that it would meet the demand for electricity around the world more than eighteen times today if such technical production capabilities existed. Meanwhile, given the current pace of development of offshore wind farms, it is estimated that only in 2040 the fraction of power produced from offshore wind on European market will reach 19.3%, 13.0% in Korea, 5.3% in the USA and 5.0% in China, with World average of 5.4% [1].
The history of the use of wind energy by people is very long and goes back to the 1st century AD, when the Greek engineer, Hero of Alexandria, created a wind wheel machine. In the following years, windmills were used to grind grain or pump water (7–9th century AD, Iran; 10-19th century AD, China and Europe). In 1887 in Scotland, Prof. James Blyth of Anderson’s College constructed the world’s first wind turbine for electricity production. Up till 1910, several thousand turbines ranging in power from 5 to 25 kW worked around the world. In 1941, a 1.25 MW wind turbine was created in the USA. In the 1970s, the top turbine capacity already reached 2 MW. Construction of the first offshore wind farm began in southern Denmark in 1991. In 2000, global electricity production from wind reached 17.4 GW; in 2005 - 59.1 GW, in 2008 - 120.7 GW, in 2014 - 369.9 GW, and in 2018 - 591 GW [2,3]. Currently, electricity production from wind farms is expected at 648 GW in 2019, 710 GW in 2020, 773 GW in 2021 and 841 GW in 2020. According to the Global Wind Energy Council (GWEC), it is anticipated that new installations will be commissioned annually, for both land and sea, with capacities above 55 GW up to 2023, with the share of offshore wind farms increasing compared to land-based facilities [4,5]. An important aspect affecting the productivity of offshore wind farms is their location. A wind map where wind turbines are being erected, or are planned to be erected in Northern Europe is shown in Figure 1 [6,7].
The selection of a specific location for the future offshore wind farm [8,9,10,11] is preceded by performing thorough analysis including:
- the current use of the sea area (shipping routes, fisheries, environmental protection areas, military areas, gravel and sand extraction areas, present and planned pipelines and cables, oil and gas extraction areas, other navigation restrictions),
- bottom bathymetry (costs of foundations),
- proximity to the coastline (power line costs, service and maintenance),
- wind conditions (expected annual energy yield from the farm [MWh/a], efficiency level [%], average annual wind power [W/m2], average annual wind energy potential [kWh/m2a], relative and absolute number of operating hours per year, depending on wind speed intervals and altitude above sea level [%], average annual turbine operation time and operation time at full power [h,%], capacity factor [%], power density [MW/km2],
- the possibility of connecting the offshore wind farm power system to the onshore power network (transmission network structure, and flexibility, current level of demand, energy storage capacity, structure of cross-border interconnections),
- projected level of recipient electricity demand,
- ensuring recipient energy security,
- energy market prices,
- legal and administrative conditions (compliance with regional policy),
- human resources (investors, designers, contractors, service technicians),
- development of the economy (new jobs) related to offshore wind farms,
- available logistics (ports, shipyards, warehouses, equipment and components, the ability to build foundations, delivery of turbine structures, supply of transformer stations and cables, vessels for construction of turbines, vessels for laying cables and service vessels),
- risks and barriers.
The most important producers of electricity in Europe from offshore wind farms include the United Kingdom with 45%, Germany 34%, Denmark 8%, Belgium 7%, Netherlands 5% and others 1% [12]. In the world, the largest producers, just like in Europe, are: the United Kingdom with 34%, Germany 28%, China 20%, Denmark 6%, Belgium 5%, Netherlands 5%, Sweden 0.8%, Japan 0.3%, USA 0.1% and others 1.2% [13].
In Poland, a program for the development of offshore energy and maritime industry has been initiated [8], and it has contributed to discussions and decisions related to the construction of new wind farms in the Baltic Sea, whose total installed capacity is to amount to about 10 GW [14]. The Polish Government’s decision to build offshore wind farms, congruent with decisions of other countries in the world, does not only ensure energy security for their citizens, but also stimulates the development of science and industry, which entails generation of an economic impulse in the form of reviving the economy and creating new jobs.
The popularity of offshore wind turbines is mainly associated with the cost of electricity production, which recently fell from € 200/MWh in 2015 to even € 46/MWh in 2019 for newly built investments, where the efficiency level is around 60% [15,16] (for comparison, the current cost of electricity from coal is about € 90–100/MWh). Reducing electricity prices can be even more effective with optimization of costs associated with: use of innovative technologies; electricity transmission; development of large investments; limiting taxes; CO2 emissions charges, as well as with maintenance and servicing.
At present, turbines with a capacity of about 6–8 MW are most commonly used, however, it is expected that the capacity of individual turbines may reach up to 20 MW in 2030 [1]. Depending on the adopted technology of energy transfer in offshore wind farms, the voltage level in the power grid can be from several to several hundred kilovolts. The voltage level from the wind turbine itself is usually 6.6 kV. When choosing a specific voltage level to charge the energy store installed on board the CTV unit, it is important to consider the choice of a suitable transformer, unidirectional electricity converter and energy store to charge the batteries installed on the CTV in a situation where the wind turbine does not produce electricity due to lack of adequate wind strength [17,18,19].
Among wind turbine manufacturers, the most installed structures in the years 1995-2018 were manufactured by Siemens Gamesa (63%), MHI Vestas (18%), Senvion (6%), Envision (4%), Goldwind (3%), Bard (2%), Ming Yang (1%), Sewind (1%), GE Renewable Energy (1%), others (1%). In 2019, GE Renewable Energy constructed and installed a 12 MW turbine with an efficiency of around 63%, rotor diameter of 220 m, and height of 260 m [20]. To install such powerful structures it is required to use ships with appropriate lifting capacity and height [21].
Various types of ships (Figure 2) are used to build, maintain and service offshore wind farms [22]. The most popular of them are:
- Heavy Maintenance and Construction Vessels. This is the basic group of ships that are used to build wind tower structures. They include the most spectacular looking Jack-up vessels. Other vessels used in the construction of wind towers are: geotechnical vessels, stone dumping vessels, floating sheerleg cranes, barges, semi-submersible floating platforms, heavy lift vessels and diving support vessels.
- Wind Farm Service Vessels. They are usually another group of vessels, consisting of crew transfer vessels (CTVs) and offshore accommodation vessels (OAV). The most popular types of units of this type are: catamarans, support vessels (W2W), crew transfer vessels (CTV), surface effect ships (SES), service operational vessels (SOVs), daughter craft, SWATH and Semi-SWATH vessels, trimarans, monohulls and RIBs.
- Cable Installation Vessels. Special cable construction is used to transfer energy produced by wind turbines. Laying them necessitates special vessel types, of which the most popular are: cable laying vessels, cable laying barges, barges, ROV support vessels and multi-purpose vessels.
The need for servicing and repairs of turbines are an important element from the point of view of the operation of offshore wind farms. To carry out service and repair tasks, units that are characterized by developing high speeds while maintaining low costs are sought.
To ensure at the same time the economic viability of these vessels, it is necessary to maintain the installed propulsion power as low as possible. Concurrently, low operating costs are associated with the design of the ship’s hull structure with low drag. This task is difficult to implement for single-hull vessels, which would have to be long and narrow, which would in turn negatively affect the stability, load capacity and space for transported crew and goods. The solution to this problem was the use of units consisting of two or three hulls, which are characterized by good stability, structural strength, large loading space, low drag and the ability to develop high speeds while maintaining low operating costs. These advantages caused that lightweight catamarans made of plastic or aluminum are increasingly used to operate offshore wind farms (Figure 2d). Other units that have been used recently are catamarans with an air cushion, such as WAVECRAFT™ [27] ensuring high transfer speeds, low fuel consumption and rocking stabilization, especially when approaching wind towers (Figure 3).
The costs associated with servicing largely depend on the location of the offshore wind farm, i.e., the distance from the port providing logistics. The average distance from the shore is, respectively: 44.4 NM (80 km) for United Kingdom, 33.3 NM (60 km) for Germany, 16.7 NM (30 km) for The Netherlands and the USA, 13.9 NM (25 km) for Denmark and Poland 25 km, 11.1 NM (20 km) for China [1,22]. CTV and SOV units are mainly used for service and repairs of wind towers and associated infrastructure. Their task is to take service crews, along with the required equipment and parts, from the port or residential unit (OAV), and transport them to a specific location of the wind tower. Then after service work, the crews are again transported from the wind tower to the port or the residential ship. To minimize service costs [28], this process is subject to optimization regarding both its management [22,29,30], and the safe steering of the ship along a given route [31,32,33,34,35,36]. CTVs are intensively used during the operation of offshore wind farms and require frequent refueling, which is both expensive and time consuming. The main issue addressed in the publication is the possibility of using an electric propulsion system with a battery energy storage unit on CTVs used for servicing and servicing offshore wind farms. The first ships with electric drive were produced at the beginning of the 20th century. Then, due to the efficient use of energy contained in the fuel, hybrid-electric ships appeared. This type of propulsion was mainly used on cruise vessels, offshore support/construction vessels (OSV/OCV), DP class drilling vessels and LNG carriers [37,38]. At the beginning of the 21st century, clean electric propulsion systems appeared to propel small ferries [39], fishing boats [40] and even container ships [41].
The paper presents electric propulsion system configurations and possible scenarios of operation on offshore wind farms. An important element justifying the use of this type of propulsion for a CTV is the possibility of practically free replenishment of energy in the battery storage units of the unit while waiting for the crew to be taken or during maneuver-free time.
2. CTV Operations Characteristics
CTVs are used to transport crews and equipment used for repair and servicing of offshore wind towers, and substations related to electricity transmission infrastructure. They are able to take on a dozen or so people who, depending on the work performed, are distributed to individual wind towers. A typical single service brigade consists of two or three people. The duration of a CTV’s stay outside the port may be from one to several days [30]. During this time the CTV can run a daily route of about 100 NM (180 km), depending on the distance of the wind farm from the port or residential unit (OAV) and the extent of the wind farm, with average distance between wind towers being 1.1 NM (2 km). After service finishes, the brigades are again transported from the wind towers to the port or residential ship. Various types of stabilization systems are used to stabilize the position of the ship at the wind tower or other stopover, so that the crew can move freely from the ship to the tower and back. These systems, whose main providers include: Ampelmann, Maxcess, Houlder TAS, Mobimar, etc., are usually mounted on the tower ladders and the ship’s hull, preventing relative changes of position, and allowing safe traversal [42].
Figure 4 shows the infrastructure layout of the Hornsea Project One near United Kingdom wind farm, with marked distribution of wind towers (black dots), power cables connecting towers (cyan lines), distribution stations (yellow dots), power cables connecting distribution stations with shore station (red lines) and an example CTV route (shades of orange). The most frequented routes are depicted with a brighter shade of orange.
Route data of the sample CTV, the catamaran MHO Grimsby, has been acquired from the MarinneTraffic.com website [43]. The route shown in Figure 4 was completed in about 16 days. The route presented was used as a given route for the proposed hybrid electric propulsion system.
Table 1 shows a selection of CTV MHO Grimsby parameters.
Units for transporting crews servicing wind towers are characterized by the ability to work at wave height reaching up to 3 meters, while maintaining good maneuverability and achieving speeds of between 15 to 25 kn (27–45 km/h). Usually these are catamarans made of aluminum, enabling the transfer of equipment and people (on average about 12 persons). More than half of the CTVs in operation use fixed and variable pitch propeller screws for their propulsion. Another type of propulsors are water-jet propellers, frequently used especially on farms where the water level around the towers is very low. The main type of prime movers is internal combustion engines. These units provide very high comfort for passengers during their transport offering: amortized seats, kitchen, TV and entertainment system and even residential cabins. A cargo crane or container mounting surface is usually available on board. With the development of wind farms, the demand for the use of CTV increases [45]. Therefore, an important parameter is the costs of their operation, which can be optimized through the use of electric propulsion systems, and which costs generally affect the operation of offshore wind farms and subsequently its electricity prices.
Figure 5 shows the section of the hull and the arrangement of rooms and equipment on the CTV MHO Grimsby ship. The propulsion system was placed in the floats of the ship together with fuel and water tanks. The proposed electric propulsion system take place of diesel engines, which are characterized by much larger dimensions compared to the generated power than electric machines. The place of fuel tanks can be replaced with an energy storage system, which could take form of a battery pack, hydrogen cell, or a combination of different types of batteries and sources of electricity.
3. Modeling
3.1. Mathematical Description
To estimate propulsion power for an example CTV (MHO Grimsby), it is necessary to determine the drag that occurs when a ship moves in a marine environment. Emerging resistance is related to external and hydrodynamic forces acting on the hull. The magnitude of these forces depends mainly on the geometrical dimensions and shapes of the ship’s hull, as well as the speed developed by the ship. The FREE!Ship design environment (released under the GNU General Public License (GPL), Boston, MA, USA) [47], was used to estimate the drag resistance of the catamaran, for which the geometrical dimensions and parameters of the ship were implemented (Figure 6).
Determination of hull resistance for an exemplary CTV ship was carried out based on the modified Dubrovsky method [48] implemented in the FREE!Ship environment. Dubrovsky’s method assumes that the total resistances of a double-hull ship are associated with the resistance of its single hull, which can be determined on the basis of the relationship:
where: RT—total catamaran towing resistance; Rfr—frictional resistance of the wetted surfaces of catamaran hulls; Rp— pressure resistance related to the shape of the hull; Kp — coefficient related to the influence of the catamaran’s hull shape on the pressure resistance; Rw— wave resistance; Kw— coefficient related to the influence of the catamaran’s hull shape on wave resistance.
The adopted simplification allowed the consideration of the RT ship hull resistance coefficient when switching to the dimensionless form ζT in the catamaran structure and its relationship with the coefficient for a single hull:
On this basis, the interaction coefficients of a two-hull ship in relation to the coefficients of a single hull were determined:
where: w,wK— coefficients related to the flow generated during the hydromechanical interaction of the hull of a moving ship with the surrounding fluid for a single hull and a catamaran; KV— coefficient reflecting the impact of hull interactions on the associated flow; t,tK— suction coefficients for a single hull and a catamaran; Kt — coefficient reflecting the impact of hull interactions on the suction; i2,i2k— coefficients of the influence of flow irregularities for a single hull and a catamaran;
Considering the speeds with which CTV can move, the estimated total value of catamaran resistance was determined taking into account: wave resistance, friction resistance, pressure resistance and additional resistances, based on the relationship:
where: RTOT— total catamaran resistance; Rfr—frictional resistance; Rp—pressure resistance; Rw—wave resistance; RAD—additional resistance.
The value of friction resistance of catamaran hulls can be determined from the formula:
where: Cf— frictional resistance coefficient (-); ρW—density of water (kg/m3); V—ship speed (m/s); Ω— wetted area of the hull (m2).
The friction resistance coefficient Cf is determined from the appropriate tables and graphs based on the relative roughness coefficients of a given surface and a dimensionless parameter called the Reynolds number:
where: v— catamaran speed (m/s); L— catamaran length (m); u — water kinematic viscosity (m2/s); g—standard gravity (m/s2).
The percentage of friction resistance Rfr in the total resistance is not constant and changes with the speed of the ship. By determining the ratio of flow inertia to the external area of an object partially submerged in water, i.e., the ship, we can determine the Froude number:
For hulls that have a low Froude number, friction resistance is about 70–80% of the total resistance. With the increase in Froude number, the friction resistance decreases to around 30% [49].
The pressure resistance Rp, is caused by the turbulence of water flowing around the catamaran hulls due to the change in flow velocity and water viscosity. The effect of pressure resistance is that the water jets break away from the walls of the catamaran’s hulls, resulting in vortices that absorb a large amount of propulsion energy. The amount of pressure resistance depends mainly on the shape of the stern part of the catamaran hulls and its speed. The value of pressure resistance can be determined from the following formula [49]:
The pressure resistance coefficient is approximate based on the relationship [49]:
where: Cp— pressure resistance coefficient (-); ΩM — area of the submerged part of the cross section of the midship section (m2); LS — stern sharpening length (m).
Rw wave resistance is associated with the formation of waves from a moving hull, due to which pressure differences arise around the bow, stern and midship. The resulting waves generate successive bow and stern waves and interfering waves dependent on the mutual arrangement of the hulls. Depending on the geometric shapes of the hulls, the generated forces may be larger or smaller. At low catamaran speeds, the wave resistance can be 20–30% of the total resistance. For higher speeds, the wave resistance can reach up to 70% of the total resistance. In general, the value of wave resistance is difficult to determine because it largely depends on many factors. Therefore, the simplified value of wave resistance can be determined by [49]:
where: Cw— wave resistance coefficient (-).
The Cw wave resistance coefficient is a function of the Froude number and its value can be read from tables or graphs.
To determine the necessary value of PM, the propulsion power, the value of additional RADD, resistances that may occur during catamaran operation should be taken into account. The value of additional resistances is mainly influenced by: air resistance; resistance to protruding elements (appendages) of the hull such as rudder, keel, propellers, etc.; resistance due to hull fouling; resistance related to deterioration of weather conditions; resistance due to shallow waters and canals. The value of additional resistance can be estimated initially on the basis of:
where: RAD — aerodynamic drag, caused by surface part of the ship; RAP — appendage resistance, showing the influence of various hull appendages such as rudders, keel, etc.; RHF — hull fouling resistance; RAC — atmospheric conditions resistance; RS — shallows resistance; RCH — channel resistance.
The value of aerodynamic drag is mainly related to the size of the water surface of the catamaran’s hull and the speed it develops. The value of aerodynamic drag in normal weather conditions does not exceed 2 to 5% of the total drag.
where: CA— air resistance coefficient (-); ρA—density of air (kg/m3); V—ship speed (m/s); VA—wind speed (m/s); ΩA— area of projection of above water part of the catamaran onto the midship section, frontal area (m2).
The appendage resistance component characterizes the effect of flow oriented hull appendages such as keels, skegs, thrusters, rudders, stabilizer fins, and exposed propeller shafts. Depending on the elements and drive system used, the value of appendage resistance can be up to several percent (shaft covers 4–8%; rudders, thrusters 1–5%):
where: CAP— appendage resistance coefficient (-); ρW—density of water (kg/m3); V—ship speed (m/s); AC—appendage shape coefficient (-); SA—surface of appendage (m2).
The demand for PM, power necessary for catamaran propulsion may change when the ship’s hull is covered with seaweed and crustaceans. Depending on the water temperature, the amount of resistance associated with the RHF hull fouling can vary according to the relationship:
The total resistance related to catamaran movement may change as weather conditions change. Heavy rainfall, changes in wind speed and the resulting waving can lead to increased heeling, plunging, nodding as well as flooding the sides and decks of the catamaran. The cited changes in weather conditions can lead to a decrease in propeller efficiency and increased resistance to motion, which should be compensated by an appropriate power reserve of the propulsion system. Due to the fact that the atmospheric phenomena described cannot be represented by analytical expressions, the atmospheric conditions resistance component RAC is determined on the basis of model tests.
The catamaran’s resistance on waters with limited depth RS and width RCH is much higher than in waters with sufficient depth and width. The reason for this phenomenon is the change in shape and propagation of waves causing an increase in wave resistance, as well as an increase in the speed of flow around the catamaran hull through the water, which contributes to an increase in friction resistance. These phenomena have a significant impact on the power demand of the PM, propulsion system, especially at higher catamaran speeds. Under certain conditions related to the shallow depth and limited width of the waters, it is impossible and economically unreasonable for a ship to achieve and sustain its typical operating speeds. Therefore, when determining the required power of the propulsion system, the effects of the shallow water and movement in the channels are ignored, at the same time remembering that model tests of the units need to be carried out under the condition of sufficient width in the basin in which they are conducted, and ensuring a depth of at least 20 times the model’s draught.
Knowing the value of total resistance RTOT, it is possible to calculate the required power output of the motor PM (electric motor / internal combustion engine) used to drive the catamaran. To determine the power of the propulsion engine, it is necessary to know the drive train efficiency, which consists of: hull efficiency (0.95–1.05), the shaft line efficiency (0.9–0.99), rotational efficiency (1–1.07) and free running propeller efficiency (0.35–0.75) [50]:
where: PM—power of drive motor (kW); PT—towing power (kW); η—drive train efficiency; ηH—catamaran hull efficiency; ηS—shaft efficiency; ηR—rotational efficiency; ηRP—free running propeller efficiency.
Figure 7 shows the results of calculations of RTOT total resistances, depending on the speed developed by the catamaran. The determined resistance values were taken into account when selecting the power of electric drive system components.
3.2. Model of a Hybrid CTV Powertrain
During modeling of the powertrain in the Crew Transfer Vessel - MHO Grimsby (gross tonnage 217 ton, length 26.20 m, width 8.90 m, draft 1.75 m), whose parameters are presented in Table 1, the Modelica Energy Storages library and Modelica Standard Library from the MODELICA programming environment were used. The Modelica environment allows easy modeling of physical systems, because the models created in it are acausal, that is, the variables used in the equations do not have to be specified as input or output variables.
To build a hybrid CTV drive system, many components available on the market can be used, such as inverters [51,52,53,54,55], power converters [56,57,58], and electric machines [59,60,61].
Modeled propulsion systems included two configurations: a conventional diesel and a hybrid one. The structure of the first propulsion system is shown in Figure 8. It reflects the conventional diesel propulsion system consisting of blocks: internal combustion engines (4 x VOLVO PENTA D13-700, 515 kW) [62], driving two propellers through gearboxes; auxiliary power generator block (CUMMINGS ONAN 27 kW 230 V 50 Hz, fuel consumption 6.2 (L/h) at 75% load equaling 20 kW generated power) [63] supplying electric on-board equipment; a block specifying the route of the passage; a block modeling the catamaran hull with forces acting on it. The given fuel consumption values were taken from the ship’s operational data [64,65] and the internal combustion engine manufacturers’ documentation [62,63].
The configuration of the second, hybrid drive system, consists of two generating sets (with identical engines as in the conventional drive version - VOLVO PENTA D13-700, 515 kW) [62], electrical energy storage, with different number of packages, where 1 package equals 270 LiFePO4 160 Ah cells connected in series. Total energy and weight for each package configuration: 1p - 138 kWh, 1512 kg; 2p - 276 kWh, 3024 kg; 4p - 553 kWh, 6048 kg; 6p - 829 kWh, 9072 kg; 8p - 1106 kWh, 12096 kg. Further blocks include two electric motors, providing motive power (DANFOSS EM- PMI540-T4000-2400, 1022 kW) [66], driving propellers via gearboxes, an offshore charger block (240 kW) for charging the energy storage, and a power converter (20 kW), for supplying the catamaran power network. The flow of electrical energy is controlled by the PMS (Power Management System) block. The other elements of the modeled propulsion system are the same as for the diesel propulsion system, i.e., the route block and the block modeling the catamaran’s hull with forces acting on it. The overview of hybrid drive system is shown in Figure 9.
The models used to develop individual blocks were taken from the libraries available in the Modelica package and appropriately modified, so that they could accurately reflect the parameters of real devices and systems.
The dimensions of the catamaran, together with its mass and resistance to motion described by Equations (1)–(16) were modeled using the standard Modelica environment library elements. The catamaran hull block takes into account forces acting on the catamaran’s hull from propellers, and determines resistance forces depending on the speed of the vessel.
The modeling block for the internal combustion engine was implemented based on two characteristics: torque - engine speed curve, and the Brake Specific Fuel Consumption (BSFC) curve. The internal structure of the combustion engine block was divided into two parts, the first responsible for generating torque, and the second carrying out calculations related to fuel consumption. The diesel engine is controlled by changing the speed setpoint, and it performs automatic start and shutdown functions in reaction to the set speed value. The setpoint speed signal is transmitted to the PID engine speed controller, whose settings have been optimized so that the engine is able to reach the appropriate speed and torque in a given time.
In order to provide route data for both diesel, and hybrid systems, a block specifying the passage route speed in relation to time elapsed has been developed, and its internals can be seen in Figure 10.
The tasks of this block include: setting the currently required, in accordance with the adopted route, linear speed of the ship, controlling the ship’s anchor in the event of prolonged stop in one place, analyzing the future route of the cruise in terms of stopping periods and continuous operation of the propulsion system periods, as well as detecting the end of the route and ending the simulation. The route used in the simulation is a reflection of the route traveled by a real CTV vessel. For the purposes of simulation, it was assumed that the entire passage route is planned as a function of the speed dependence of the ship [67,68,69]. This assumption makes it easy to check if, and how long the ship will be moving, or at rest. The current speed of the ship depending on the time is obtained by using the Route Data block, which receives the time in seconds as input, and makes the speed set at the moment available at its output and it allows the control of simulated anchor throwing / retracting, when the speed decreases to zero. The Charge Predict block controls the periods in which there is a possibility of connection and disconnection of the ship to, and from the offshore charger port by the ship’s crew. The second of the prediction blocks, the Generator Run Predict, searches for periods of increased use of the ship’s propulsion, when for a minimum of 1800 s (half an hour) the set speed of the ship does not fall below 9 kn (16 km/h). Detection of such periods activates the digital signal GEN_RUN, which is used by the BMS system as an indicator whether, in the case of low battery state of charge, it should turn on the power generators at 35% State of Charge (SOC) instead of at 20%. The 15% SOC level difference was selected, so as not to cause unnecessary operation of the generating sets and related fuel consumption, while creating sufficient energy reserve so that its deficit would not force the battery to work below 20% of the state of charge.
The energy storage mapping block takes into account the non-linearity of the internal resistance characteristics of the LiFePO4 battery pack. Changes in temperature, and their effect on battery parameters are also taken into account, including heat exchange with the environment, self-heating effect, as well as the operation of temperature conditioning system enabling external heating or cooling of the energy storage.
Figure 11 shows the inside of the electric drive system block, which consists of the general model of the inverter and the synchronous electric motor, as well as the system specifying the allowed operation area in the form of the torque - rotational speed curve. The desired torque is compared to the maximum permitted torque at the current motor shaft speed and, if the desired value exceeds the maximum, it is limited to the maximum permissible value at that speed.
Figure 12 shows the inside of the offshore loader block. It is modeled as a DC source with a constant power of 240 kW. The charge enable signal is controlled by the route block. Assuming that each prolonged stop of the catamaran takes place at a wind tower equipped with the appropriate charging connector, charging is possible at every such stop. In order to limit the frequency of on-off cycling after the catamaran’s energy storage is fully charged, a small hysteresis of 2% of the battery’s charge has been introduced.
4. Simulation Results
Verification of modeled propulsion systems, diesel and hybrid, was carried out based on measurement data recorded for the real MHO GRIMSBY unit during its operation in the period from 20/06/2019 until 06/07/2019 (Figure 5). The route was completed during 16 days, and its length was about 1333.3 NM (2400 km). Figure 13 shows the speed profile for this route. During the realization of the route between the towers on the wind farm, periods of the unit’s operation are clearly visible, they are about 14 h long, and are followed by periods when the unit does not move about 10 h long. In addition, during the execution of daily tasks from tower to tower, there were longer periods of downtime during which the battery storage unit of the unit can be recharged at a wind tower equipped with an appropriate charging connector.
Figure 14 shows the energy consumption of CTV for both the diesel and hybrid propulsion systems. In addition, for the hybrid system, the results of tests for various configurations of electric energy storage system were presented. The concept of different configurations relates to the number of packages that make up the energy storage. One complete package is made of 270 cells. The packages can be connected in parallel and are marked respectively: 2p for two packages connected in parallel (Hybrid 2p, 276 kWh, 3024 kg) 4p for four packages (Hybrid 4p, 553 kWh, 6048 kg), 6p for six packages (Hybrid 6p, 829 kWh, 9072 kg), and 8p for eight packages (Hybrid 8p, 1106 kWh, 12,096 kg).
It can be seen that the diesel propulsion system consumes more energy contained in the fuel, compared to hybrid systems, respectively by: 1.86 times more for Hybrid 2p; 2.25 times more for Hybrid 4p; 2.95 times more for Hybrid 6p, and 3.54 times more for Hybrid 8p. The diminishing returns of increasing battery capacity effect can also be seen in the Figure 14, when each addition of extra energy capacity results in consecutive smaller gains in reduced fuel consumption. It is the result of increased draft of the vessel, which increases the ship’s resistance, and does not escape as exhaust into the atmosphere after combustion, as well as the result of vessel’s mode of operation. As the CTV’s route consists of a combination of short tower-to-tower jumps, and longer treks spanning sometimes the whole length of the wind farm, the more energy is available in the energy store, the longer journeys can be made on battery power only. As short trips are more frequent in the route, even a small amount of energy allows great reduction in fuel consumption.
The most fuel consumption-heavy parts of the route are the initial trip from the port to the wind farm, and the return journey, and this distance is too great to cross with battery power only, with the constrains of available ship volume, tonnage and contemporary battery technology. This drawback requires the presence of conventional power source – a diesel powered generator – which has enough power density to allow trips of more than 100 nautical miles, and existing maritime regulations dictate that this power source needs to be redundant, hence the existence of two such generators onboard the hybrid model.
The obvious effect of increased fuel consumption is the corresponding emission of carbon dioxide and other harmful substances into the atmosphere, as shown in Figure 15.
Figure 16 shows the costs of CTV energy consumption on a test route approximately 1333.3 NM long (2400 km). Assuming the cost of fuel at 585 USD per ton and the cost of electricity at 50 USD per MWh, the cost of traveling 1 NM (1.8 km) was estimated for the diesel system at 11.19 USD/NM, and for hybrid systems respectively: for hybrid 2p 6.25 USD/NM, for hybrid 4p 4.99 USD/NM, for hybrid 6p 3.99 USD/NM, and for hybrid 8p 3.42 USD/NM. Taking into account the total cost of fuel and electricity, the cost of traveling 1 NM was estimated at: hybrid 2p USD 6.63 / NM, hybrid 4p 5.60 USD / NM, hybrid 6p 4.71 USD / NM and hybrid 8p 4.22 USD/NM.
Figure 17 shows the details of energy flow through the battery storage, with energy exchanged between charging sources such as generating sets and offshore charger, and consumers in the form of electric propulsion motors and a power converter supplying on-board equipment. From the presented waveforms it is possible to read the periods when the drive system is working heavily (red line), when the energy storage is recharged from generating sets (blue line), when the energy is taken from batteries (green line), and when the energy storage is being recharged from offshore power grid (violet line) during stops.
Research has shown that the total amount of energy consumed for the operation of the CTV depends to some extent on the adopted level of SOCON-OFF energy storage recharge triggers, when the diesel generating sets turn on to replenish the power stored in the batteries. In practice, this means that for a narrow charge level of SOCON-OFF = 45 to 55%, the number of restarts of the generating set will be large, which translates into the time of operation of the generating sets and increased fuel consumption. In turn, for a wide range of energy storage operation at the level of SOCON-OFF = 10 to 95%, the number of starts will not be large, but at the same time the adopted charge level affects the time of operation of the generating sets and shortening the SOH lifetime of the energy storage due to deep discharge.
Therefore, when choosing the recharge trigger level, the current operational situation of the ship should be taken into account, as well as accounting the specifics of route and the vessel stop schedule. In some situations, lower energy storage discharge is more cost effective so that the vessel can reach the charging point in the wind tower (Figure 18).
5. Discussion
The diesel-battery-electric hybrid propulsion system is a proposal for CTV units, which by providing a high level of safety and reliability for crew and service teams, can additionally allow reduced energy consumption, and thus reduce both greenhouse gas emissions, and the costs of operating offshore farms wind.
Based on the tests carried out, it is possible to observe lower energy consumption (Figure 11) by hybrid systems in relation to the diesel propulsion system. These differences were respectively lower for: hybrid 2p, −46%; hybrid 4p, −56%; hybrid 6p, −66%; hybrid 8p, −69%. It should be noted that the reported fuel consumption (diesel) for both the conventional system and hybrid systems relate to the consumption of diesel fuel alone, without adding electricity consumption costs from the operated wind farm. After adding electricity costs, the differences in energy consumption in relation to the combustion system are as follows: Hybrid 2p, −41%; Hybrid 4p, −50%; Hybrid 6p, −58%; Hybrid 8p, −62%.
In order to optimize the operation of hybrid or electric propulsion systems, it would be necessary to carry out further research aimed at developing algorithms controlling the energy storage charging process in terms of optimizing the level of battery charging trigger revels (e.g., SOC: 10% ÷ 90%, 20% ÷ 80%, 30% ÷ 70%, 20% ÷ 95% etc.) taking into account the CTV range. A similar issue may relate to the optimization of the work scheduling process, associated with laying out transition routes between successive wind towers and CTV energy storage charging points. In a situation where the daily passage routes were all short, it would be possible to completely eliminate the use of internal combustion engines, making the CTV zero-emission ship. The use of CTVs could only be based on an electric drive whose energy stores would be charged from wind towers. The obtained test results confirmed that the modeled CTV maintaining the speed of 20 kn (36 km/h) with the hybrid 2p drive system is able to travel about 8.9 NM (16 km) on a full charge, and with the hybrid 8p drive system about 34.4 NM (62 km).
Another positive effect of the hybrid drive system is the reduction of CTV operating costs, expressed in USD (Figure 17). For the case of the tested route in relation to the internal combustion engine, operating costs decreased respectively: with hybrid 2p by −44%, with hybrid 4p by −55%, with hybrid 6p by −64% and with hybrid 8p by −69%. Taking into account electricity prices at the level of €46 per 1 MWh, operating costs compared to conventional diesel drive variant decreased respectively in: hybrid 2p by −41%, hybrid 4p by −50%, hybrid 6p by −58% and hybrid 8p by −62%. The obtained test results confirmed that the use of a hybrid system to drive a CTV brings measurable economic benefits to the shipowner, as well as the natural environment.
6. Conclusions
Research has shown that the use of the diesel-battery-electric hybrid propulsion system to drive CTV allows reduction of energy consumption contained in the fuel. The reduced fuel consumption translates into a reduction of carbon dioxide emissions into the atmosphere, together with other harmful compounds contained in exhaust gases. The use of hybrid drive on CTVs contributes to environmental protection by significantly reducing engine emissions.
At the same time, the use of an electric drive reduces noise and air pollution to zero when maneuvering, e.g., in ports, around residential ships, in quiet areas and other areas where exhaust emissions and noise from internal combustion engines are undesirable or prohibited, as well as making the vessel interior itself more quiet and vibration free, which creates better environment for the crew and passengers.
The obtained test results confirmed that thanks to the use of electric drive, it is possible to reduce the operating costs of units used to transfer service crews and the necessary equipment to carry out repairs and service of wind turbines together with auxiliary infrastructure.
Thanks to the hybrid system or the electric drive itself, the safety and reliability of CTV is increased through the possibility of using alternative energy sources, such as generating sets, energy storage or hydrogen fuel cells.
The use of a hybrid propulsion system with a DC intermediate circuit eliminates: the need to synchronize generating sets on common rails, reactive power losses, and disturbances from working electrical machines and converters of electricity in the power system of the unit, thus improving the quality of electrical energy in the ship’s power grid.
Funding
This research received no external funding.
Conflicts of Interest
The author declare no conflict of interest.
References
- International Energy Agency (IEA). Offshore Wind Outlook 2019–Analysis. Available online: https://www.iea.org/reports/offshore-wind-outlook-2019 (accessed on 28 December 2019).
- U.S. Energy Information Administration (EIA). History of Wind Power. Available online: https://www.eia.gov/energyexplained/wind/history-of-wind-power.php (accessed on 12 December 2019).
- Renewable Energy World. History of Wind Turbines. Available online: https://www.renewableenergyworld.com/2014/11/21/history-of-wind-turbines/#gref (accessed on 12 December 2019).
- Global Wind Energy Council (GWEC). Wind Back to Growth from 2019. Available online: https://gwec.net/wind-back-to-growth-from-2019-gwec/ (accessed on 12 December 2019).
- Ragheb, M. History of Harnessing Wind Power. In Wind Energy Engineering: A Handbook for Onshore and Offshore Wind Turbines; Letcher, T.M., Ed.; Academic Press: London, UK; San Diego, CA, USA, 2017; pp. 127–143. ISBN 9780128094518. [Google Scholar]
- Global Offshore Renewable Map|4C Offshore. Available online: https://www.4coffshore.com/offshorewind/ (accessed on 17 December 2019).
- Baworski, A.; Garbala, K.; Czech, P.; Witaszek, K. Estimation of the ability to use a mass of air from a moving vehicle in wind turbine propulsion. Sjsutst 2015, 88, 5–17. [Google Scholar] [CrossRef]
- Stryjecki, M.; Bojanowska, B.; Karlikowska, M.; Makowska, J.; Piotrowicz, Ł.; Wójcik, M. Programme for the Development of Offshore Energy and Maritime Industry in Poland. Available online: https://www.beif.pl/wp-content/uploads/2018/02/PRMEPM_EN.pdf?x30829 (accessed on 18 December 2019).
- Offshore Wind Farms Plan for Deeper Waters|E&T Magazine. Available online: https://eandt.theiet.org/content/articles/2017/07/offshore-wind-farms-plan-for-deeper-waters/ (accessed on 13 December 2019).
- Peter, T. Offshore Wind Turbines: Reliability, Availability and Maintenance; Institution of Engineering and Technology: London, UK, 2012; ISBN 9781849192293. [Google Scholar]
- Bhattacharya, S. Design of Foundations for Offshore Wind Turbines; John Wiley & Sons, Inc.: Newark, NJ, USA, 2019; ISBN 1119128145. [Google Scholar]
- Walsh, C. Offshore Wind in Europe, Key Trends and Statistics 2019. WindEurope.org. Available online: https://windeurope.org/wp-content/uploads/files/about-wind/statistics/WindEurope-Annual-Offshore-Statistics-2019.pdf (accessed on 8 February 2020).
- Unwin, J. Wind Energy by Country: Top 10 in the World Ranked by Capacity. Available online: https://www.power-technology.com/features/wind-energy-by-country/ (accessed on 8 January 2020).
- Riviera Maritime Media—Offshore Wind Journal. Offshore Wind Journal 2th Quarter 2019. Available online: https://www.rivieramm.com/offshore-wind-journal (accessed on 25 November 2019).
- Andrew, L. Offshore Wind Power Price Plunges by a Third in a Year: BNEF. Available online: https://www.rechargenews.com/transition/offshore-wind-power-price-plunges-by-a-third-in-a-year-bnef/2-1-692944 (accessed on 25 November 2019).
- Simon, E. Analysis: Record-Low Price for UK Offshore Wind Cheaper than Existing Gas Plants by 2023. Available online: https://www.carbonbrief.org/analysis-record-low-uk-offshore-wind-cheaper-than- existing-gas-plants-by-2023 (accessed on 25 November 2019).
- Parastar, A.; Kang, Y.C.; Seok, J.-K. Multilevel Modular DC/DC Power Converter for High-Voltage DC-Connected Offshore Wind Energy Applications. IEEE Trans. Ind. Electron. 2015, 62, 2879–2890. [Google Scholar] [CrossRef]
- Robak, S.; Raczkowski, R.M. Substations for Offshore Wind Farms: A Review from the Perspective of the Needs of the Polish Wind Energy Sector; Bulletin of the Polish Academy of Sciences: Warszawa., Poland, 2018; Volume 66, pp. 517–528. [Google Scholar] [CrossRef]
- Sakamuri, J.N.; Rather, Z.H.; Rimez, J.; Altin, M.; Goksu, O.; Cutululis, N.A. Coordinated voltage control in offshore HVDC connected cluster of wind power plants. In Proceedings of the 2017 IEEE Power & Energy Society General Meeting (PESGM), Chicago, IL, USA, 16–20 July 2017; p. 1, ISBN 978-1-5386-2212-4. [Google Scholar]
- GE Renewable Energy. World’s Most Powerful Offshore Wind Turbine: Haliade-X 12 MW. Available online: https://www.ge.com/renewableenergy/wind-energy/offshore-wind/haliade-x-offshore-turbine (accessed on 20 December 2019).
- Snyder, J. Larger Wind Turbines Propel Demand for Big Installation Vessels. Available online: https://www.rivieramm.com/news-content-hub/larger-wind-turbines-propel-demand-for-big-installation-vessels-57052 (accessed on 28 December 2019).
- 4C Offshore. Offshore Market Intelligence Services. Available online: https://www.4coffshore.com/ (accessed on 18 December 2019).
- Fresh Breeze for Offshore Wind Farms—DNV GL. Available online: https://www.dnvgl.com/ expert-story/maritime-impact/Fresh-breeze-for-offshore-wind-farms.html (accessed on 19 December 2019).
- Gamesa, S. Servicing Complex Offshore Needs. Available online: https://www.siemensgamesa.com/products-and-services/service-wind/offshore-logistics (accessed on 19 December 2019).
- Labrut, M. Van Oord Awarded Cable Installation Contract for Taiwanese Offshore. Available online: https://www.seatrade-maritime.com/asia/van-oord-awarded-cable-installation-contract-taiwanese-offshore-wind-farms (accessed on 19 December 2019).
- Wind Farm Supply & Crewboats. Offshore Supply Vessels and Crew Boats for Wind Farms. Available online: https://www.mtu-solutions.com/eu/en/applications/commercial-marine/commercial-marine-solutions/wind-farm-supply-and-crewboats.html (accessed on 19 December 2019).
- Air-Cushion principle—Umoe WAVECRAFT ™. Available online: https://www.wavecraft.no/ technology/air-cushion-principle/ (accessed on 28 January 2020).
- Dawid, R.; McMillan, D.; Revie, M. Decision Support Tool for Offshore Wind Farm Vessel Routing under Uncertainty. Energies 2018, 11, 2190. [Google Scholar] [CrossRef] [Green Version]
- Stålhane, M.; Halvorsen-Weare, E.E.; Nonås, L.M.; Pantuso, G. Optimizing vessel fleet size and mix to support maintenance operations at offshore wind farms. Eur. J. Oper. Res. 2019, 276, 495–509. [Google Scholar] [CrossRef]
- Anaya-Lara, O.; Tande, J.O.; Uhlen, K.; Merz, K. Offshore Wind Energy Technology; John Wiley & Sons, Ltd: Chichester, UK, 2018; ISBN 9781119097808. [Google Scholar]
- Kula, S.K. Autopilot Using the Nonlinear Inverse Ship Model. In Activities in Navigation: Marine Navigation and Safety of Sea Transportation; CRC Press-Taylor & Francis Group: Cleveland, OH, USA, 2015. [Google Scholar]
- Lisowski, J. The Optimal and Safe Ship Trajectories for Different Forms of Neural State Constraints. Solid State Phenom. SSP 2011, 180, 64–69. [Google Scholar] [CrossRef]
- Lisowski, J. The Sensitivity of State Differential Game Vessel Traffic Model. Pol. Marit. Res. 2016, 23, 14–18. [Google Scholar] [CrossRef] [Green Version]
- Mohamed-Seghir, M. Methods based on fuzzy sets to solve problems of Safe Ship control. In Novel Algorithms and Techniques in Telecommunications and Networking; Sobh, T., Elleithy, K., Mahmood, A., Eds.; Springer: Dordrecht, The Netherlands, 2010; pp. 373–377. ISBN 978-90-481-3661-2. [Google Scholar]
- Gierusz, W.; Waszkiel, A. Determination of Suction Forces and Moment on Parallel Manoeuvring Vessels for a Future Control System. Solid State Phenom. SSP 2011, 180, 281–287. [Google Scholar] [CrossRef]
- Rybczak, M. Improvement of control precision for ship movement using a multidimensional controller. Automatika 2018, 59, 63–70. [Google Scholar] [CrossRef] [Green Version]
- Hansen, J.F.; Wendt, F. History and State of the Art in Commercial Electric Ship Propulsion, Integrated Power Systems, and Future Trends. Proc. IEEE 2015, 103, 2229–2242. [Google Scholar] [CrossRef]
- Yang, T.; Cox, T.; Degano, M.; Bozhko, S.; Gerada, C. History and Recent Advancements of Electric Propulsion and Integrated Electrical Power Systems for Commercial & Naval Vessels. In Proceedings of the International Naval & Maritime Exhibition and Congress for Latin America, Vina Del Mar, Chile, 29 November–2 December 2016. [Google Scholar]
- E-Ferry. Available online: http://e-ferryproject.eu/ (accessed on 10 March 2020).
- Electric & Hybrid Marine World Expo 2020. Available online: https://www.electricandhybridmarineworldexpo.com/en/ industry-news.php (accessed on 15 March 2020).
- Calcuttawala, Z. China Just Launched the World’s First Electric Cargo Ship. Available online: https://www.businessinsider.com/china-just-launched-the-worlds-first-electric-cargo-ship-2017-12?IR=T (accessed on 15 February 2020).
- Mobimar.com. Wind Farm Crew Transfer Vessel—Mobimar. Available online: http://www.mobimar.com/commercial-vessels/trimaran-concept/wind-farm-crew-transfer-vessel (accessed on 18 January 2020).
- AIS Marine Traffic. MarineTraffic: Global Ship Tracking Intelligence. Available online: https://www.marinetraffic.com/en/ais/home/centerx:-12.0/centery:25.0/zoom:4 (accessed on 19 December 2019).
- MHO-Co A/S. MHO—GRIMSBY. Available online: https://www.mho-co.dk/fleet/mho-grimsby/ (accessed on 19 December 2019).
- 4COffshore. An Introduction to Crew Transfer Vessels. Available online: https://www.4coffshore.com/support/an-introduction-to-crew-transfer-vessels-aid2.html (accessed on 18 January 2020).
- Offshore Wind. OOC Nerz|Offshore Wind. Available online: https://www.offshorewind.biz/ vessels/ooc-nerz/ (accessed on 19 December 2019).
- FREE!ship Plus. Available online: https://sourceforge.net/projects/freeship/ (accessed on 10 September 2019).
- Dubrovsky, W.A. Multi-Hull Vessels; M31805-037/048(01)-78/20-78; Shipbuilding Publishing House: Petersburg, Russia, 1978. (In Russian) [Google Scholar]
- Staliński, J. Ship Theory; Maritime Publishing House: Gdynia, Poland, 1961. (In Polish) [Google Scholar]
- Łebkowski, A. Reduction of Fuel Consumption and Pollution Emissions in Inland Water Transport by Application of Hybrid Powertrain. Energies 2018, 11, 1981. [Google Scholar] [CrossRef] [Green Version]
- Ronanki, D.; Williamson, S.S. A Simplified Space Vector Pulse Width Modulation Implementation in Modular Multilevel Converters for Electric Ship Propulsion Systems. IEEE Trans. Transp. Electrific. 2019, 5, 335–342. [Google Scholar] [CrossRef]
- Ito, M.; Zhang, F.; Sato, H.; Mita, S.; Narukawa, K. Development of inverter-less FPP electric propulsion system. In Proceedings of the 2011 IEEE/SICE International Symposium on System Integration (SII 2011), Kyoto, Japan, 20–22 December 2011; pp. 1037–1042, ISBN 978-1-4577-1524-2. [Google Scholar]
- Zheng, C.F.; Ming Xiao, L.; Li, R.; Zhang, B.; Qiu, D.Y.; Yang, C. Seamless Power Supply Strategies for A Ship-Controlled Inverter System. In Proceedings of the 2019 22nd International Conference on Electrical Machines and Systems (ICEMS), Harbin, China, 11–14 August 2019; pp. 1–4, ISBN 978-1-7281-3398-0. [Google Scholar]
- Behrendt, Z. Predictive regulation of the output voltage of a three-phase two-level voltage inverter with an LC filter. Sci. J. Marit. Univ. Szczec. 2019, 57, 79–87. [Google Scholar] [CrossRef]
- Iwaszkiewicz, J.; Mysiak, P. Supply System for Three-Level Inverters Using Multi-Pulse Rectifiers with Coupled Reactors. Energies 2019, 12, 3385. [Google Scholar] [CrossRef] [Green Version]
- Strzelecki, R.; Mysiak, P.; Sak, T. Solutions of inverter systems in Shore-to-Ship Power supply systems. In Proceedings of the 2015 9th International Conference on Compatibility and Power Electronics (CPE), Lisbon, Portugal, 24–26 June 2015; pp. 454–461, ISBN 978-1-4799-6301-0. [Google Scholar]
- Smolenski, R.; Benysek, G.; Malinowski, M.; Sedlak, M.; Stynski, S.; Jasinski, M. Ship-to-Shore versus Shore-to-Ship Synchronization Strategy. IEEE Trans. Energy Convers. 2018, 33, 1787–1796. [Google Scholar] [CrossRef]
- Shevchenko, V.; Husev, O.; Strzelecki, R.; Pakhaliuk, B.; Poliakov, N.; Strzelecka, N. Compensation Topologies in IPT Systems: Standards, Requirements, Classification, Analysis, Comparison and Application. IEEE Access 2019, 7, 120559–120580. [Google Scholar] [CrossRef]
- Xu, X.; Liu, N.; Wang, K.; Zheng, Z.; Li, Y. Modulation and Control of an ANPC/H-Bridge Hybrid Inverter for Ship Electric Propulsion Drives. In Proceedings of the 2019 22nd International Conference on Electrical Machines and Systems (ICEMS), Harbin, China, 11–14 August 2019; pp. 1–5, ISBN 978-1-7281-3398-0. [Google Scholar]
- Guzinski, J.; Abu-Rub, H. Speed sensorless induction motor drive with motor choke and predictive control. COMPEL Int. J. Comput. Math. Electr. Electron. Eng. 2011, 30, 686–705. [Google Scholar] [CrossRef]
- Mansouri, M.M.; Mohamed-Seghir, M.M.; Nounou, H.N.; Nounou, M.N.; Abu-Rub, H.A. Bayesian methods for time-varying state and parameter estimation in induction machines. Int. J. Adapt. Control Signal Process. 2015, 29, 905–924. [Google Scholar] [CrossRef]
- Volvo Penta. Marine Genset. Available online: https://www.volvopenta.com/marinecommercial/ en-en/products/info/ marine-genset.html (accessed on 9 February 2020).
- Cummins Inc. Available online: https://mart.cummins.com/imagelibrary/data/assetfiles/0059599.pdf (accessed on 10 February 2020).
- World Marine Offshore. CTV Fleet: SWATH, High Speed, Hybrid Crew Transfer Vessels. Available online: https://wm-offshore.com/fleet/crew-transfer-vessels (accessed on 14 March 2020).
- Dalgic, Y.; Dinwoodie, I.; Lazakis, I.; McMillan, D.; Revie, M. Optimum CTV fleet selection for offshore wind farm O&M activities. In Safety and Reliability: Methodology and Applications; Nowakowski, T., Młyńczak, M., Jodejko-Pietruczuk, A., Werbińska-Wojciechowska, S., Eds.; CRC Press: Boca Raton, FL, USA, 2014; pp. 1177–1185. ISBN 978-1-138-02681-0. [Google Scholar]
- Dunfoss. Data Sheet Electric Machine, Permanent Magnet Internal EM-PMI540-T4000. Available online: https://assets.danfoss.com/documents/DOC320845936101/DOC320845936101.pdf (accessed on 14 February 2020).
- Alehashemi, A.; Hajiyakhchali, S. Optimizing Fleet Composition and Routing Plan Scheduling for Offshore Supply Operations: Case Study of an Offshore Drilling Firm. Asian J. Shipp. Logist. 2018, 34, 218–226. [Google Scholar] [CrossRef]
- Norlund, E.K.; Gribkovskaia, I. Environmental performance of speed optimization strategies in offshore supply vessel planning under weather uncertainty. Transp. Res. Part D Transp. Environ. 2017, 57, 10–22. [Google Scholar] [CrossRef]
- Mrówczyńska, B.; Król, A.; Czech, P. Artificial immune system in planning deliveries in a short time. Bull. Polish Acad. Sci. 2019, 67, 969–980. [Google Scholar] [CrossRef]
Figure 1.
Europe’s offshore wind farms: (a) location, (b) wind conditions [6].
Figure 1.
Europe’s offshore wind farms: (a) location, (b) wind conditions [6].

Figure 2.
Sample photos of ships used at offshore wind farms: (a) Jack-Up Vessel (JUV) [23], (b) Service Operational Vessels (SOV) [24], (c) Cable Laying Vessel (CLV) [25], (d) Crew Transfer Vessel (CTV) [26].

Figure 3.
Catamaran with an air cushion [27].
Figure 3.
Catamaran with an air cushion [27].

Figure 4.
Infrastructure arrangement view of an example Hornsea Project One wind farm near United Kingdom: wind towers (black dots); power cables connecting towers (cyan lines); distribution stations (yellow dots); power cables connecting distribution stations to the land station (red lines). Lines in shades of orange mark the route of CTV, MHO GRIMSBY, undertaken in the period from 20/06/2019 to 06/07/2019 [22,43].


Figure 6.
Geometric shape of the CTV hull as seen in FREE!ship [47].
Figure 6.
Geometric shape of the CTV hull as seen in FREE!ship [47].

Figure 7.
Approximate plot of total resistance depending on the longitudinal speed of the catamaran, where: PM—power of drive motor (kW); RTOT— total catamaran resistance (kN); RD— Resistances determined based on the Dubrovsky method (kN); Rw— wave resistance (kN); Rfr—frictional resistance of the wetted surfaces of catamaran hulls (kN).

Figure 8.
Model of a Diesel-Propeller Catamaran powertrain developed in Modelica.

Figure 9.
Model of a hybrid Diesel-Battery-Electric Catamaran powertrain developed in Modelica.
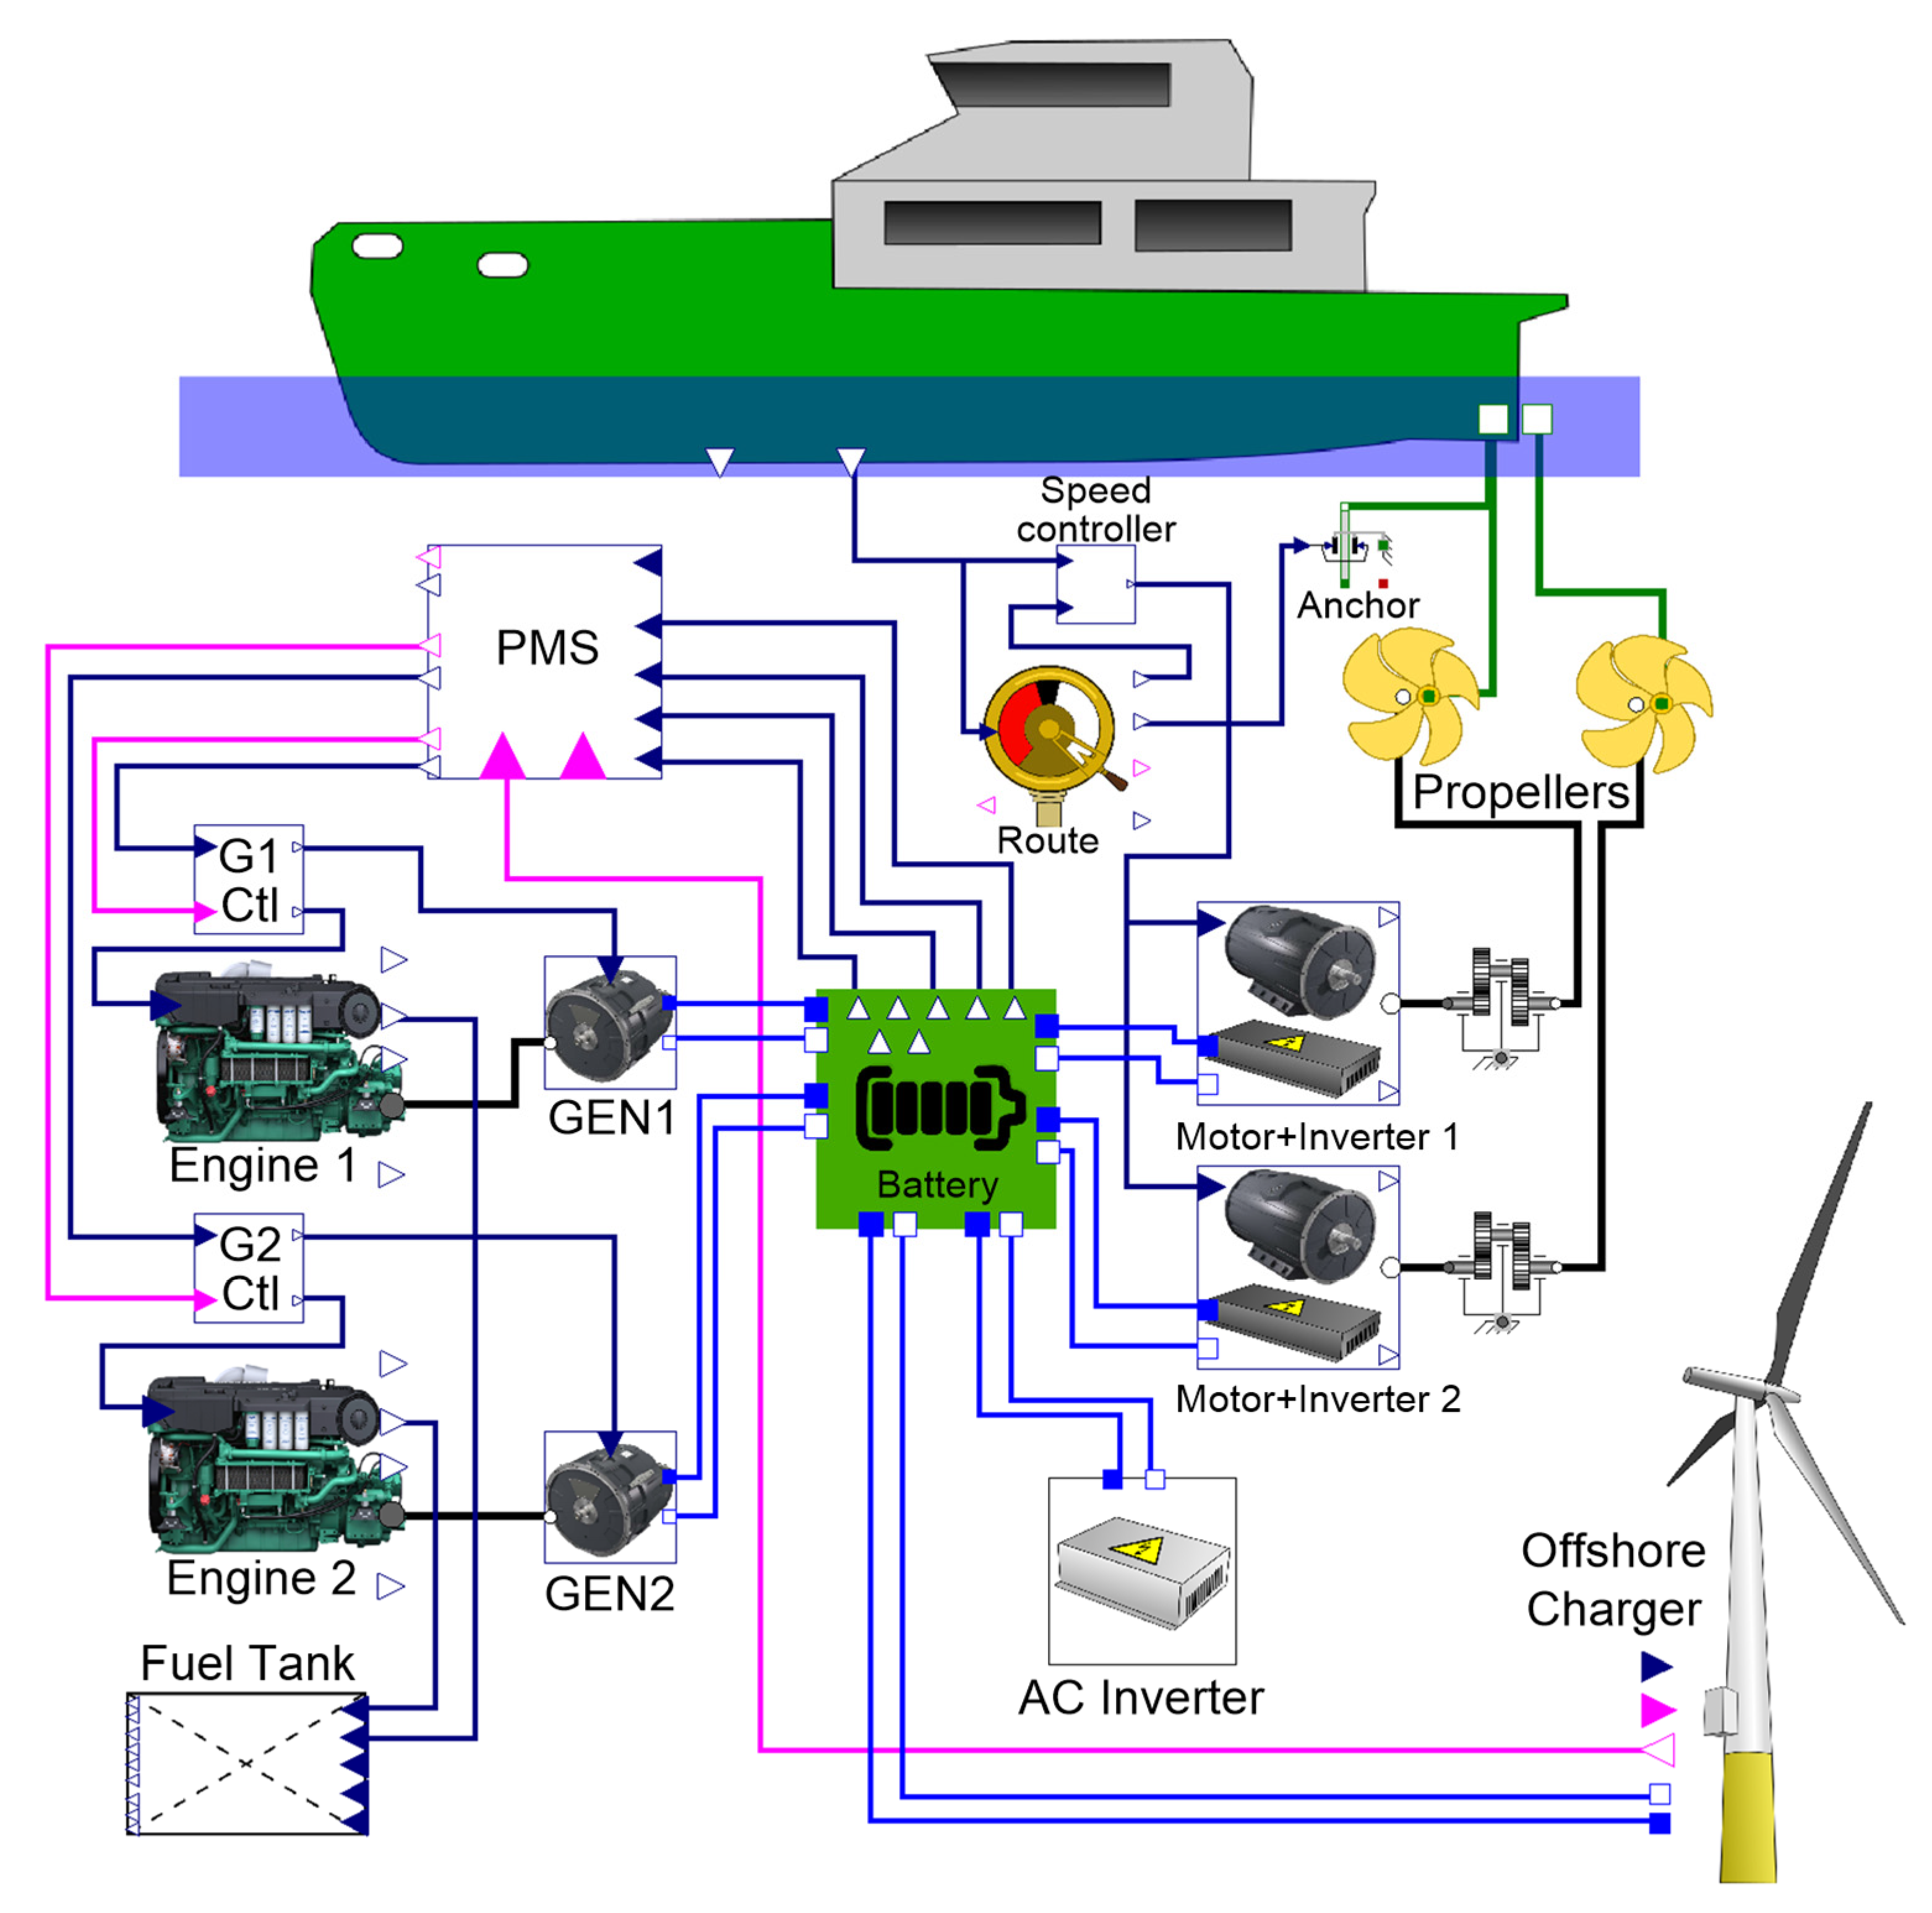
Figure 10.
Passage route block.

Figure 11.
Model of a hybrid Diesel-Battery-Electric Catamarans powertrain developed in Modelica.
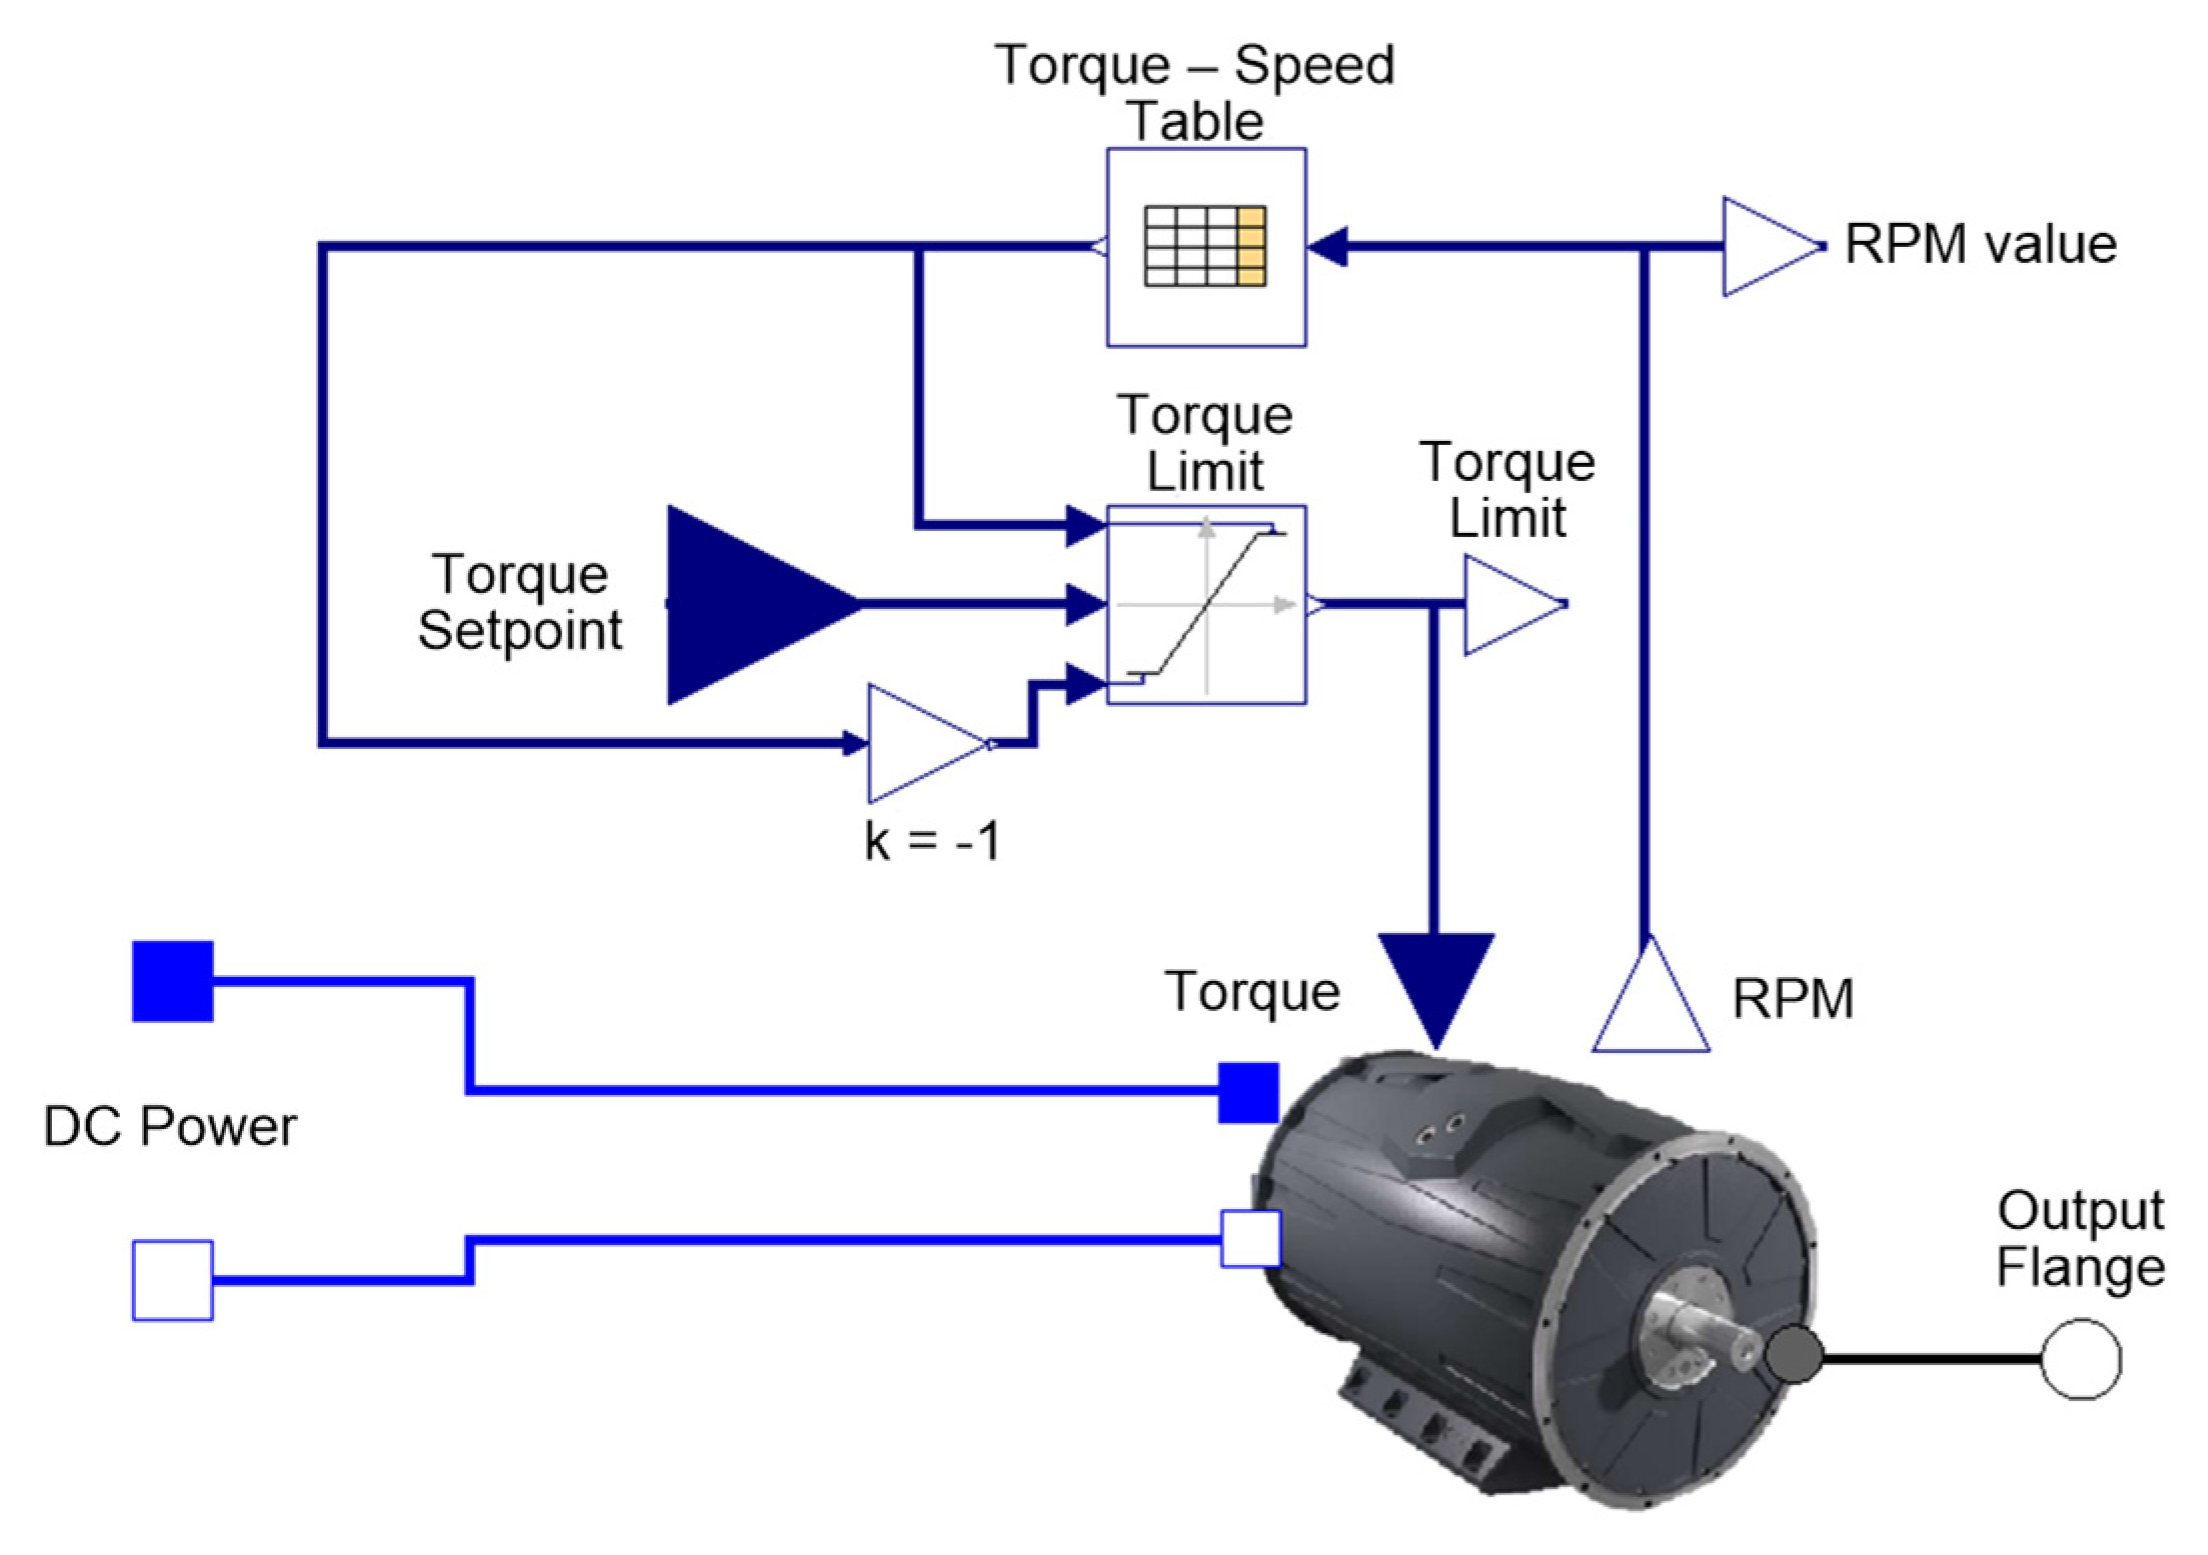
Figure 12.
Onboard charger block details.

Figure 13.
Catamaran speed profile set for the test route.

Figure 14.
Plot of energy consumed from fuel for various powertrain configurations on the same test route: Diesel, Hybrid 2p, Hybrid 4p, Hybrid 6p, Hybrid 8p.
Figure 14.
Plot of energy consumed from fuel for various powertrain configurations on the same test route: Diesel, Hybrid 2p, Hybrid 4p, Hybrid 6p, Hybrid 8p.
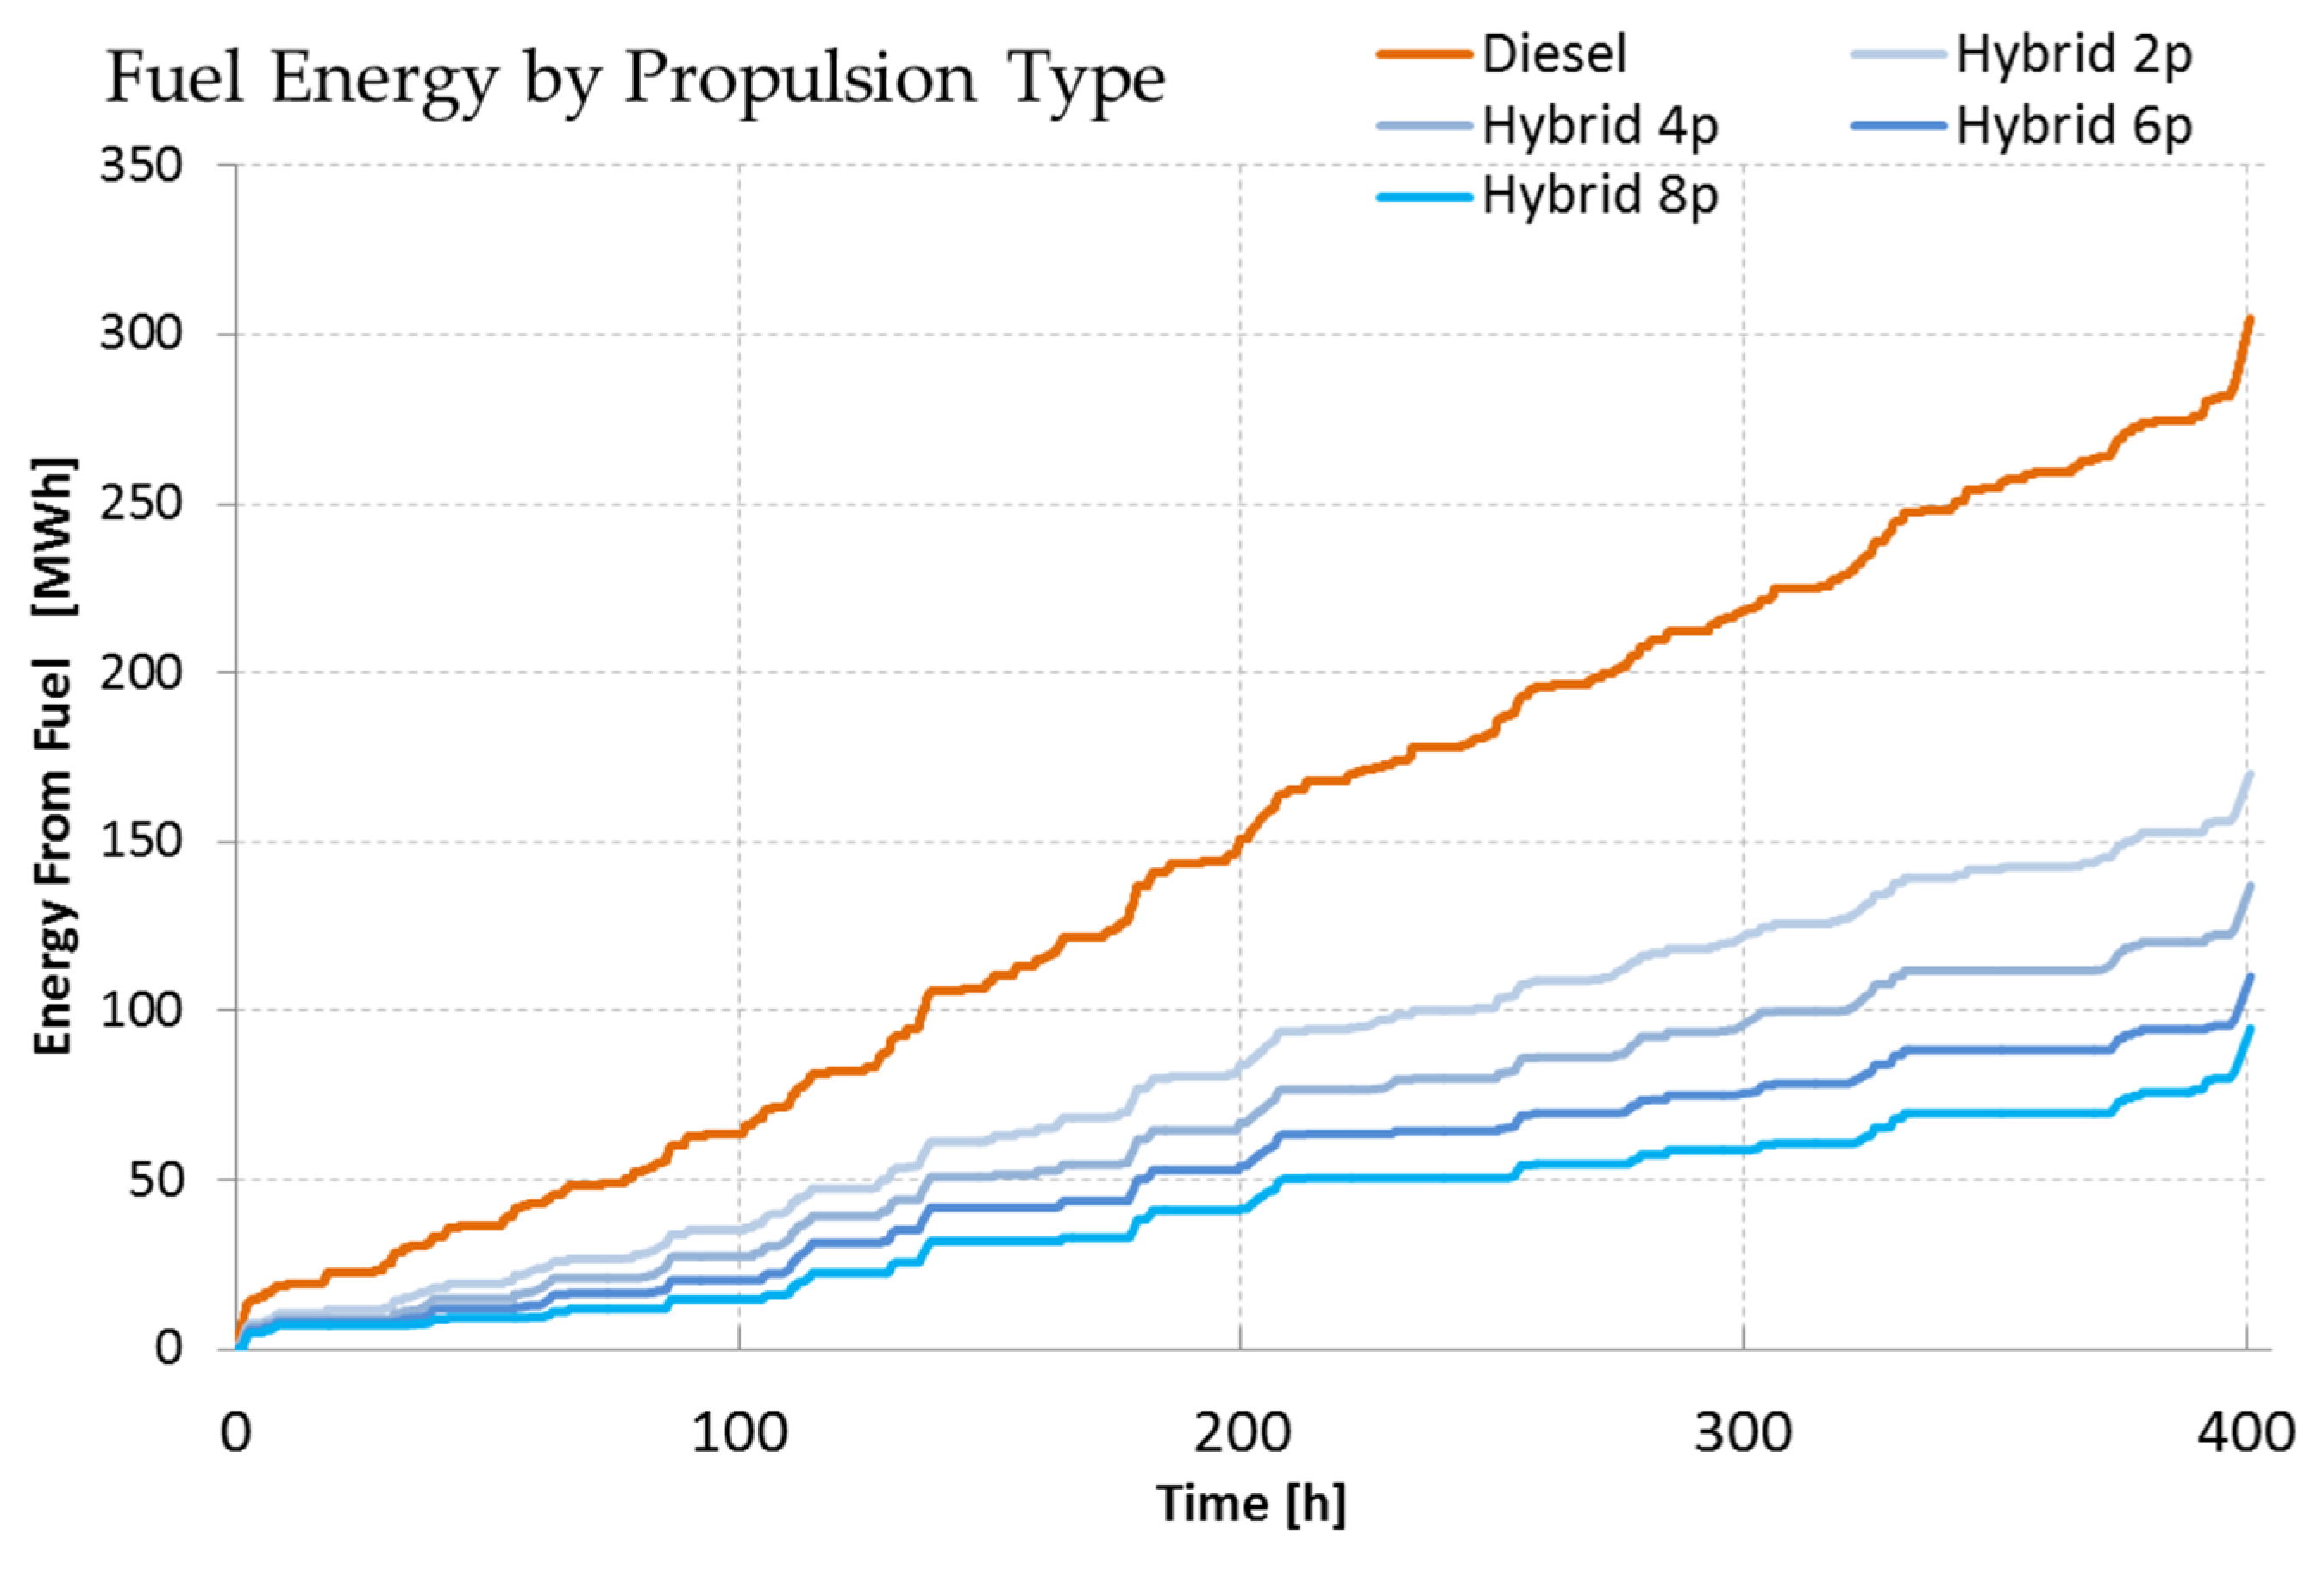
Figure 15.
Plot of CO2 emissions by propulsion type on the same test route.

Figure 16.
Plot of fuel cost by propulsion type on the same test route.
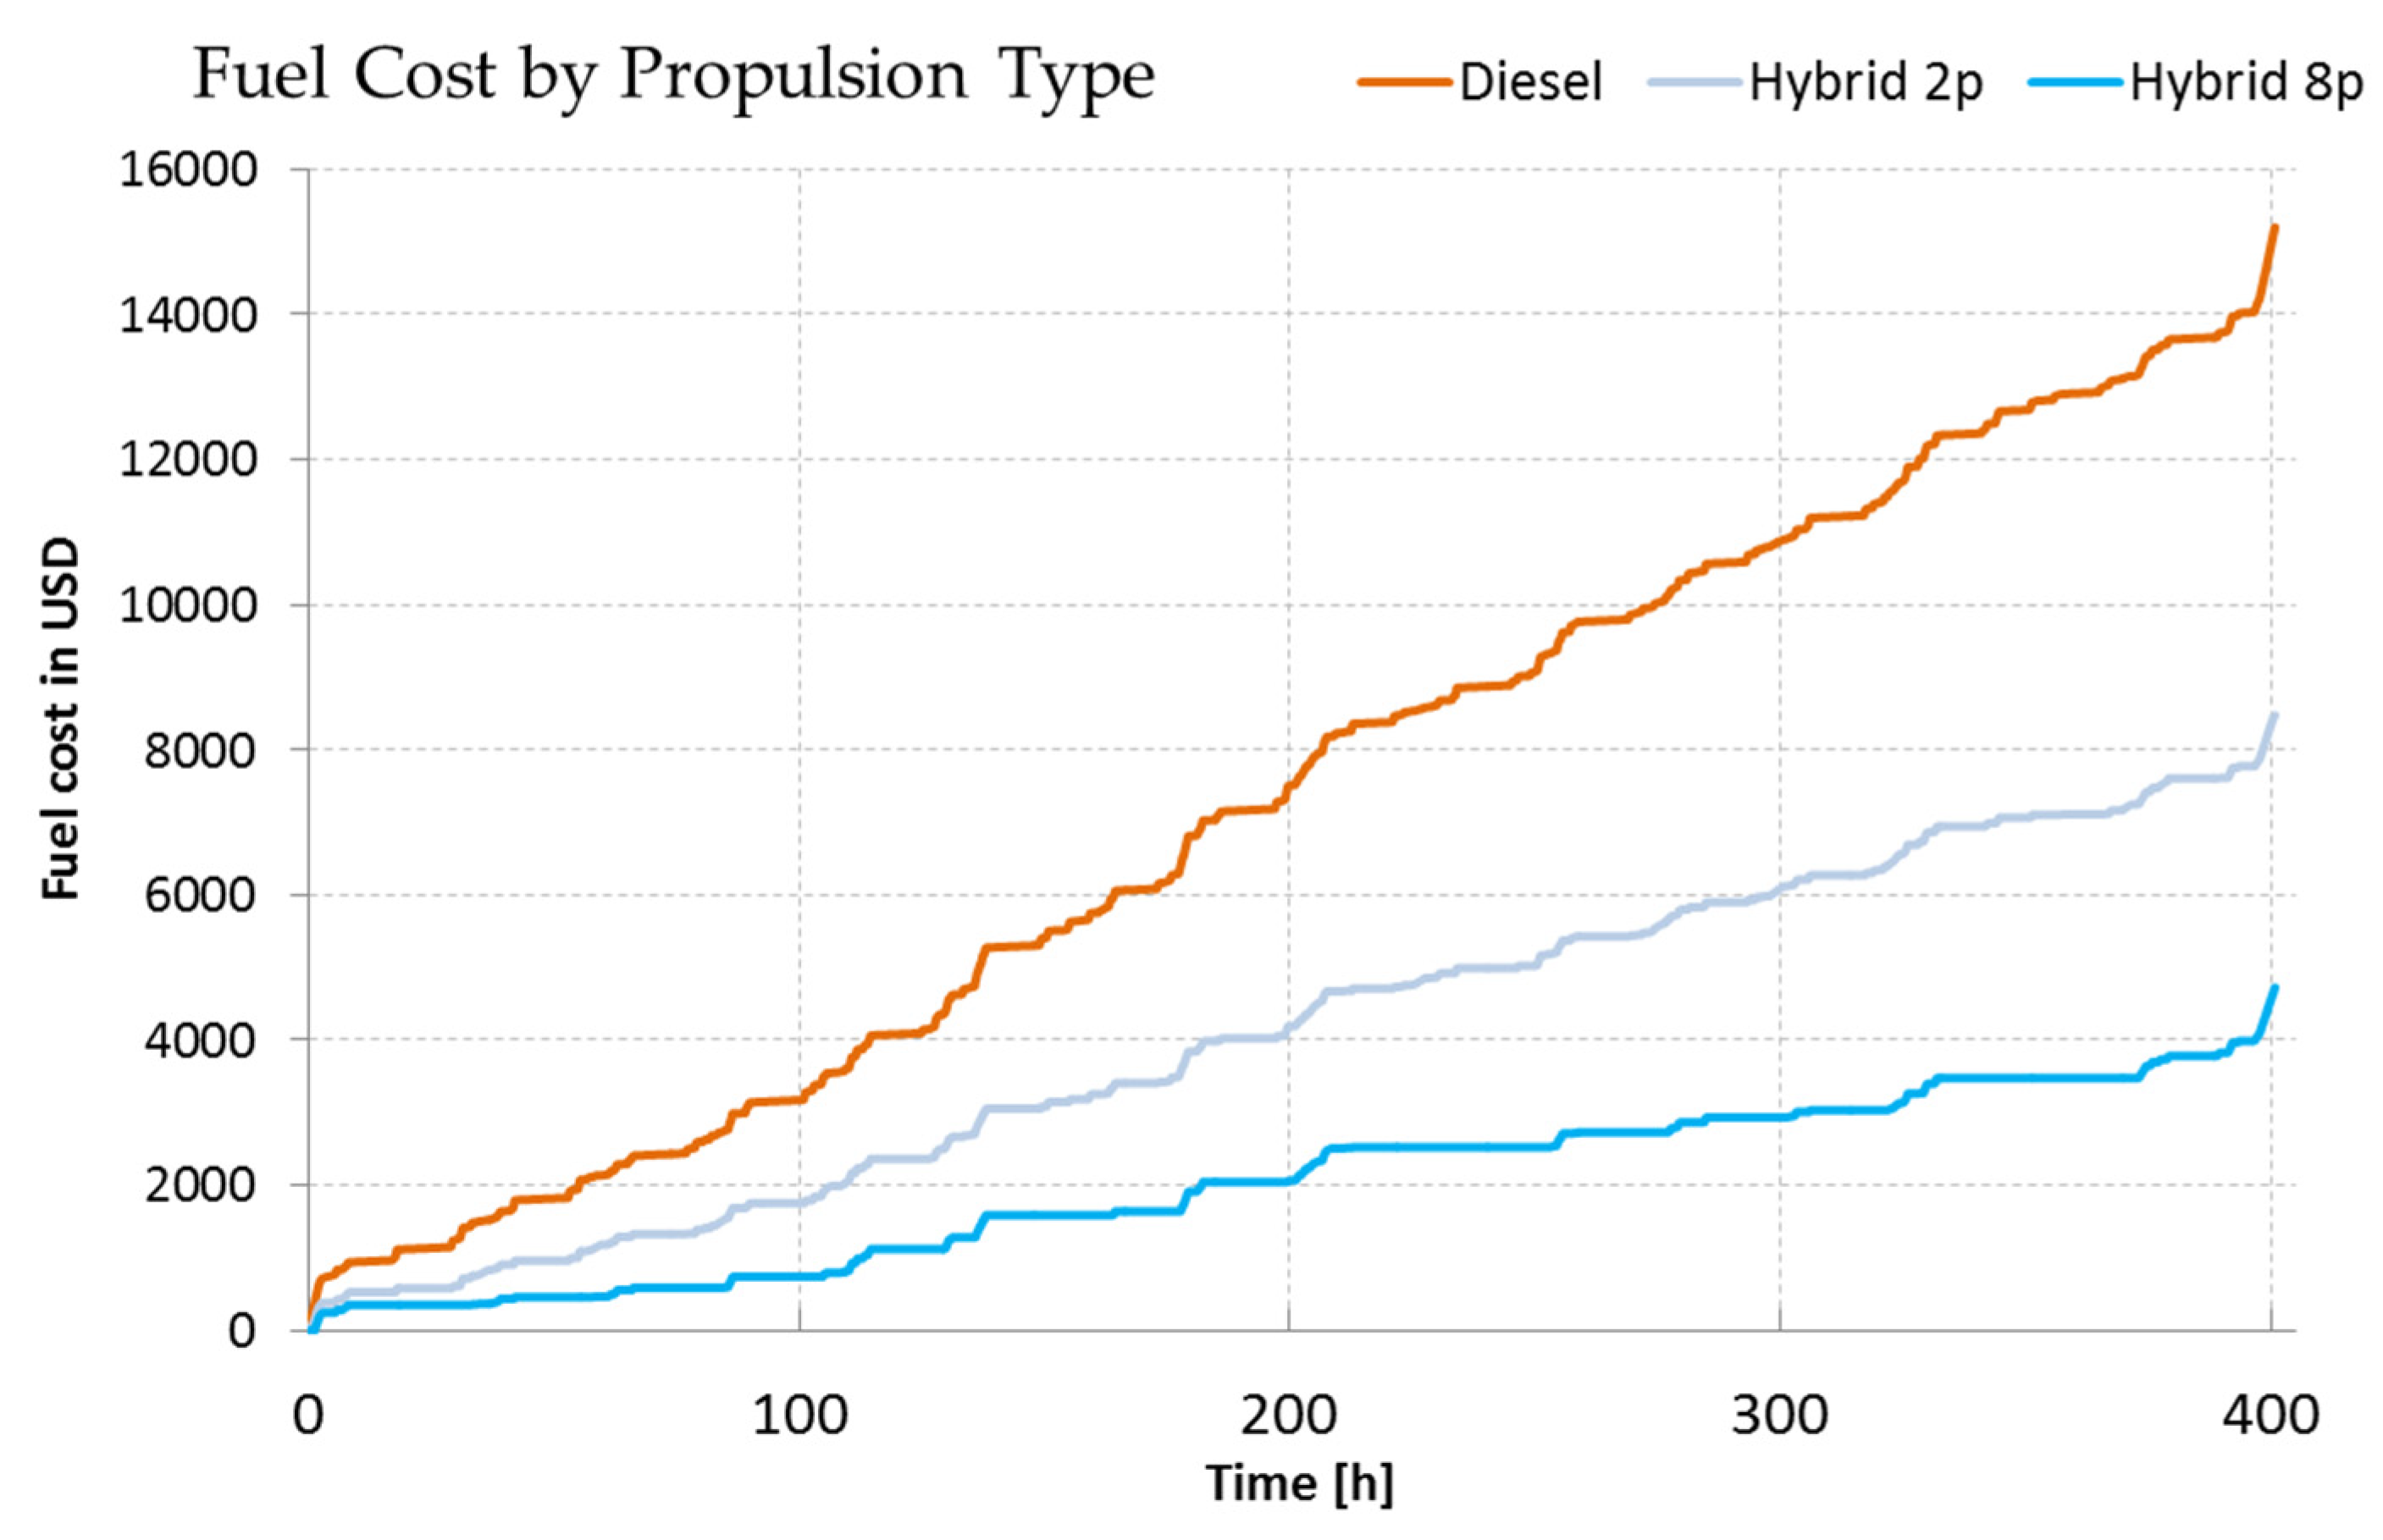
Figure 17.
Plot of power flow between generators, battery and propulsion system.

Figure 18.
Plot of battery state of charge for hybrid 8p drive system.


Table 1.
CTV MHO Grimsby basic parameters [44].
Table 1.
CTV MHO Grimsby basic parameters [44].
| Parameter | Description | Parameter | Description |
|---|---|---|---|
| Year built | 2016 | Engines | 4 × Volvo D13-700 High Speed Diesel |
| Type | Catamaran | Engine rating | 4 × 515 kW / 700HP |
| Hull & Superstruct. | Aluminium | Generator | 2 × Cummins Onan 27 ekW |
| IMO Number | 9766243 | Trim & Ride Control | 2 × Humphree HA 1000 |
| Gross Tonnage | 221 (NT 66) | Propulsion | Volvo Penta IPS 9000 Thrusters incl. |
| Length Overall | 26.20 m | Dynamic Positioning | |
| Breadth | 8.90 m | Service speed | 25 kn (45 km/h) |
| Depth | 3.95 m | Max. speed | 27 kn (48.6 km/h) |
| Max. Draught | 1.75 m | Fuel consumption | approx. 400 L/h |
| Air draught | 11.07 m | Fuel tank | 35,000 L |
| Fresh Water | 3000 L | Operating time | 24 h |
| Freshwater maker | 70 L/h | Power sockets fwd. | 1 × 415 V, 50 Hz, 32 A, 4 pin |
| Crew | 4 | Deck: | 1 × 220 V, 50 Hz, 15 A, 3 pin |
| IP | 12–36 | Power sockets aft. | 1 × 415 V, 50 Hz, 32 A, 4 pin |
| Crane | 6 t | Deck | 1 × 220 V, 50 Hz, 15 A, 3 pin |
© 2020 by the author. Licensee MDPI, Basel, Switzerland. This article is an open access article distributed under the terms and conditions of the Creative Commons Attribution (CC BY) license (http://creativecommons.org/licenses/by/4.0/).
Share and Cite
MDPI and ACS Style
Łebkowski, A. Analysis of the Use of Electric Drive Systems for Crew Transfer Vessels Servicing Offshore Wind Farms. Energies 2020, 13, 1466. https://doi.org/10.3390/en13061466
AMA Style
Łebkowski A. Analysis of the Use of Electric Drive Systems for Crew Transfer Vessels Servicing Offshore Wind Farms. Energies. 2020; 13(6):1466. https://doi.org/10.3390/en13061466
Chicago/Turabian StyleŁebkowski, Andrzej. 2020. "Analysis of the Use of Electric Drive Systems for Crew Transfer Vessels Servicing Offshore Wind Farms" Energies 13, no. 6: 1466. https://doi.org/10.3390/en13061466
Note that from the first issue of 2016, this journal uses article numbers instead of page numbers. See further details here.