Abstract
As a result of the lattice mismatch between the oxide itself and the substrate, the high-pressure structural properties of trivalent rare earth (RE)-doped ceria systems help to mimic the compressive/tensile strain in oxide thin films. The high-pressure structural features of Sm-doped ceria were studied by X-ray diffraction experiments performed on Ce1−xSmxO2−x/2 (x = 0.2, 0.3, 0.4, 0.5, 0.6) up to 7 GPa, and the cell volumes were fitted by the third order Vinet equation of state (EoS) at the different pressures obtained from Rietveld refinements. A linear decrease of the vs. trend occurred as expected, but the regression line was much steeper than predicted for oxides, most probably due to the effect of oxygen vacancies arising from charge compensation, which limits the increase of the mean atomic volume () vs. the Sm content. The presence of RE2O3-based cubic microdomains within the sample stiffens the whole structure, making it less compressible with increases in applied pressure. Results are discussed in comparison with ones previously obtained from Lu-doped ceria.
1. Introduction
Trivalent rare earth (RE)-doped ceria systems form a group of widely studied mixed oxides with technologically interesting values of ionic conductivity in the intermediate temperature range (673–973 K), which make them useful as solid electrolytes in solid oxide fuel cells (SOFCs). Ce0.9RE0.1O1.95 oxides (RE = Gd, Sm, Nd) present values of ionic grain conductivity ranging between 5 × 10⁻² and 7 × 10⁻² S cm−1 at 773 K, with a remarkable increase occurring with increases of the RE ionic radius [1]. However, even a slight variation in RE content causes a non-negligible change in ionic conductivity; Ce0.8Gd0.2O1.90, for example, is characterized by a total ionic conductivity of 1 × 10⁻³ S cm−1 at 773 K [2]. Ionic conductivity is in fact affected by many factors such as RE identity, composition, structure and microstructure of the oxide [3,4,5,6,7], and not least by the occurrence of the sample in the bulk or thin film form. With particular reference to this latter issue, thin films are essential when designing SOFC-based portable devices because of the need for fabricating fuel cells on chips [8,9]. Nevertheless, thermodynamic, structural and transport properties of the deposited electrolyte are not necessarily the same as in the bulk material; deposited Gd-doped ceria electrolytes, for instance, present ohmic losses up to 100 times lower than the corresponding oxides in bulk form [8], which is one of the main advantages to using doped ceria thin films. These issues make the investigation of such properties, and comparison with the ones of the bulk materials, of primary importance. In particular, it is known that the thinning of layer thickness often induces a significant ionic conductivity increase in doped ceria due to the oxide/substrate lattice mismatch [10,11], while at the same time causing a significant decrease in the same property due to a larger amount of defects [8]. The aim of this study is to separate these two competitive effects, as the high-pressure behavior of bulk samples can help to simulate the strain at the interface. The application of 5 GPa, for instance, roughly corresponds to a 1% compressive strain, which is not far from the one existing in a 250-nm-thick Gd-doped ceria film deposited on a MgO/SrTiO3 layer [11]. Only a few papers in the literature have discussed the high-pressure structural properties of doped ceria [12,13]. Lattice mismatch is one of the main causes of microstrain at the interface [11,14], but for the sake of completeness it should also be noted that microstrain derives from thermal expansion coefficient mismatch or from properties resulting from processing issues (such as grain size) [8].
Together with Gd- and Nd-doped ceria, Sm-doped ceria is one of the most effective systems of ionic conductivity [1]. Ionic conductivity is strictly related to structural and microstructural issues, and this is the reason why so many papers in recent years have been devoted to the crystallographic properties of this material, even in the light of the non-negligible effects of extrinsic factors (e.g., thermal treatments) on the stability of the various oxide phases [15,16]. A particular attention has been paid to defect aggregations [3,17,18,19,20,21], since ionic conductivity in doped ceria occurs through the hopping of oxygen ions towards the vacancies () created for charge compensation when Ce4+ is partially substituted by RE3+. The mechanism works until the fluorite-type cubic structure of CeO2 (hereafter named F; space group: ; Ce coordination number: 8) is retained (i.e., until the solid solution of RE3+ within the CeO2 matrix is stable). Actually, maximum ionic conductivity for the solid F solution falls well within the stability range; for example, the compositional limit of F in Ce1−xGdxO2−x/2 is located at x ~ 0.2 [22], with its maximum conductivity at x = 0.10–0.15 [4,23]. This evidence is due to the creation of defect aggregates having the cubic structure of sesquioxides RE2O3 (hereafter named C; space group: ; RE coordination number: 6), which hinder the movement of oxygen ions. Due to their nanometric size, C aggregates are invisible to X-ray diffraction until the RE3+ amount reaches a threshold content that is defined by the RE’s identity. On the contrary, C aggregates can also be revealed by Raman spectroscopy, due to the superior sensitivity of the latter technique toward oxygen displacement. Therefore, the position of the upper compositional limit of F as obtained from X-ray diffraction does not necessarily coincide with the limit deriving from Raman spectroscopy (i.e., x ~ 0.3 and ranging between x = 0.2 and 0.3 in Ce1−xSmxO2−x/2 for the former and latter techniques, respectively) [24]. For Sm-doped ceria beyond the F limit, this system presents an intermediate structure between F and C, as F and C are linked to each other through a structure/superstructure relation and—due to the close resemblance of the Ce4+ and Sm3+ ionic sizes (Ce4+, CN:8, r = 0.97 Å; Sm3+, CN:6, r = 0.958 Å [25])—peaks common to the two phases coincide, regardless of the sensitivity of the diffractometer employed [22]. This atomic arrangement, which can be interpreted as a solid solution with the C-based domains acting as guests [24] was named H due to its hybrid character between F and C, and has even been described for other systems, such as Y- [26] and Gd-doped ceria [27]. Moreover, as a direct consequence of the structure/superstructure relation, the H cell parameter is roughly double that of F.
In the framework of a high-pressure structural study of doped ceria, it is very interesting to compare the properties of a system presenting the H phase (such as Sm-doped ceria) to that of a system that—due to ionic dimensional issues—behaves differently. In this respect, Lu-doped ceria (Ce1−xLuxO2−x/2) act as an ideal model: While the CeO2-based solid solution with Lu3+ as a guest forms up to x ~ 0.4 [28], the large ionic size difference (Ce4+, CN:8, r = 0.97 Å; Lu3+, CN:6, r = 0.861 Å [25]) prevents the formation of the H phase and promotes the stability of a (F + C) two-phase field.
In this work the high-pressure structural properties of Sm-doped ceria were studied by analyzing X-ray diffraction patterns collected up to 7 GPa at the XPRESS diffraction beamline of the Elettra Synchrotron radiation facility [29]. The refined cell volumes were fitted to the Vinet equation of state (EoS) [30], and the obtained bulk moduli at zero pressure () were discussed in comparison to the ones obtained for Lu-doped ceria in a previous study [13]. A substantial insensitivity of to structural changes was revealed for both systems, while the compressibility of compositions containing C domains remarkably decreased starting from ~3 GPa. A significant effect of vacancies was also found for the trend of vs. (with being the volume per atom pair).
2. Materials and Methods
2.1. Synthesis
Five compositions belonging to the Ce1−xSmxO2−x/2 system with nominal x = 0.2, 0.3, 0.4, 0.5 and 0.6 were synthesized by oxalate coprecipitation [31,32]. Stoichiometric amounts of Ce (Johnson Matthey ALPHA 99.99% wt.) and Sm2O3 were separately dissolved in HCl (13% vol.), then the two solutions were mixed together. Afterwards, the precipitation of the mixed Ce/Sm oxalate was accomplished by adding a solution of oxalic acid in large excess. Oxalates were filtered, washed and dried for 12 h then thermally treated at 1373 K in air for four days to obtain mixed oxides with a high degree of crystallinity.
2.2. Scanning Electron Microscopy-Energy-Dispersive System (SEM-EDS)
Scanning electron microscopy-energy-dispersive system (SEM-EDS, Oxford Instruments, model 7353 with Oxford-INCA software v. 4.07) was employed to check the overall rare earth contents of all the samples. Pellets of powders pressed and sintered at 1773 K were coated by a graphite layer and analyzed at a working distance of 15 mm, with an acceleration voltage of 20 kV. EDS analyses were carried out on at least six points for each sample.
2.3. High-Pressure Synchrotron X-ray Powder Diffraction (HP-XRPD)
Ambient and high-pressure X-ray powder diffraction acquisitions were done at the XPRESS diffraction beamline of the Elettra Synchrotron radiation facility located in Trieste (Italy) [29]. Data collection was performed by a monochromatic circular beam with a wavelength of 0.4957 Å and a diameter around 50 µm; pressure was applied from 0 to ~7 GPa using a gear-driven Boehler-Almax plate diamond anvil cell (plate DAC) with a large X-ray aperture containing diamonds with a culet size of 500 µm. In order to arrange the sample chamber, 200-µm-thick rhenium gaskets were pre-indented using the plate DAC, thus obtaining a thickness of about 110 µm; a through-hole with a diameter of 200 µm was subsequently drilled by spark erosion at the center of the pre-indented region. Fine powders of the sample were placed inside the sample chamber to obtain diffraction data with minimal preferred orientation effects. Pressure calibration was done either by Cu, making use of the Cu (111) diffraction peak (for samples Sm20 and Sm30), or by ruby, measuring the displacement in the position of its fluorescence lines (for samples Sm40, Sm50 and Sm60). The sample chamber was filled with silicon oil as pressure transmitting medium (PTM), and the diamonds of the anvil cell were subsequently brought into contact with the gasket. The PTM chosen provided good hydrostatic pressure conditions up to the maximum pressure applied in the present study. A schematic representation of the experimental set-up is shown in Figure 1.
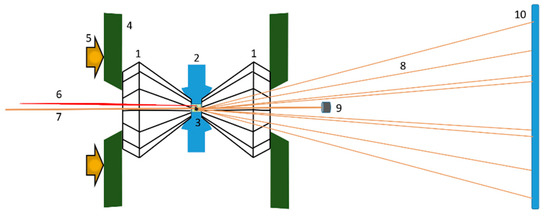
Figure 1.
Scheme of the experimental set-up at the XPRESS beamline. (1) Pair of identical diamonds; (2) metal foil with a hole at the center (sample chamber); (3) sample chamber (sample, ruby, pressure transmitting medium (PTM)); (4) backing plates holding diamonds; (5) force pushing diamonds; (6) laser for ruby fluorescence excitation; (7) incident monochromatic X-ray microbeam; (8) diffracted X-rays; (9) beam stop blocking the direct beam; (10) image plate detector recording the position and intensity of the diffracted X-rays.
The experimental station was equipped with a MAR345 image plate detector, and images of the powder diffraction rings were converted into 2θ-intensity plots by means of the fit 2D software. The angular range spanned between 4° and 30°. Samples were named Sm20_7.54, Sm30_5.23 and so on, according to the nominal Sm atomic percent with respect to the total (Ce + Sm) content and applied pressure.
The FullProf suite [33] was used to refine structural models using the Rietveld method; the evolution of the lattice volume as a function of pressure was modeled through the third order Vinet EoS [30] by means of the EosFit7-Gui software [34]. High-pressure data are discussed in comparison to data collected using the same samples at ambient pressure at the MCX beamline, as described in [24] as well as to the samples of Lu-doped ceria collected at high pressure at the XRD1 beamline [12].
3. Results
3.1. Compositional Characterization
The experimental x of all the samples, as revealed by EDS, was found very close to the stoichiometric value, and results are reported in Table 1. Therefore, the occupancy factors of crystallographic sites hosting lanthanide ions were fixed at the nominal value and not refined during Rietveld cycles. No extra phases were detected, and backscattered images taken on the polished surfaces of all samples did not reveal the presence of any color inhomogeneity, as shown in Figure 2 with reference to sample Sm40.

Table 1.
Mean experimental x values as revealed by EDS analyses.
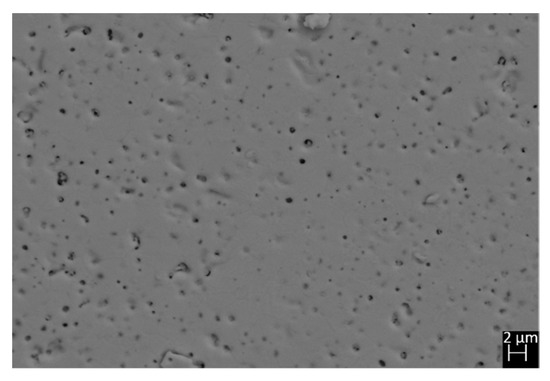
Figure 2.
Microphotograph taken by backscattered electrons on the polished surface of sample Sm40.
3.2. Structural Characterization
Peaks belonging to either the F or H phases were imposed to refine two different structural models according to their composition; namely, the F model for the Sm20 and Sm30 samples, and the H model for the Sm40, Sm50 and Sm60 samples. The F structure consisted of a cubic cell belonging to the space group comprising four formula units per cell [35]; the two atomic positions were occupied by Ce/Sm (0,0,0) and O (1/4, 1/4, 1/4). The H phase was a solid solution of C domains within the CeO2 matrix. The C structure consisted of a cubic cell belonging to the space group and comprising 32 formula units per cell. The atomic rearrangement with respect to F induced the position occupied by rare earths to split into two distinct crystallographic sites. Both the F and the C structural models are reported in the Supplementary Materials.
It is questionable whether the pyrochlore (P) structure even occurred in the studied samples at this stage. Pyrochlore is the name of the (Na,Ca)2Nb2O6(OH,F) mineral, which crystallizes in the space group. It differs from the C structure just in regards to the position of oxygen vacancies, which are located in the next-nearest-neighbor sites with respect to RE3+, while in the C structure they are placed in nearest-neighbor positions. In this sense, the P-type structure represents an alternative arrangement of defects in doped ceria. Due to the different extinction rules of the face-centered lattice of the P structure with respect to the body-centered one of the C, the reflections of the crystallographic planes (331) and (333) + (511) should be visible in the diffraction pattern in case of occurrence of the P phase, albeit with low intensity; since this condition is not fulfilled, we can exclude the presence of P in our samples. This conclusion is also supported by the literature, as is discussed hereafter. In principle, the presence of a Ce2RE2O7 P-type phase in rare earth (RE)-doped ceria cannot be ruled out a priori; D.E.P. Vanpoucke et al. [36], for example, claimed there is a higher stability of P with respect to the F phase for Ce2La2O7 based on density functional theory (DFT) calculations. Relying on the comprehensive theoretical study by L. Minervini and R.W. Grimes [37], Ce2La2O7 has in fact been located at the P/F boundary, and its occurrence in the P phase cannot be excluded. Nevertheless, the stability range of A2B2O7 compounds (being A and B transition metals or lanthanide ions) is reported to depend on the A/B cationic ratio, and all the ceria-based systems doped with lanthanide ions smaller than La (i.e., from Nd to Lu) have been determined to be more stable in the F phase [37]. Even the exhaustive paper by W. Chen and A. Navrotsky [38], which makes use of the atomistic results by L. Minervini et al. [39], states that the formation enthalpies of Ce2RE2O7 become thermodynamically unfavored when decreasing the RE3+ size, being −102 kJ/mol for Ce2La2O7, −3.85 kJ/mol for Ce2Gd2O7 and 175 kJ/mol for Ce2Y2O7. For the sake of completeness, simulations performed by B. Wang et al. [40] showed that stable P defect clusters in Gd-doped ceria are expected to occur only when they form within ceria matrix domains in the sub-nanoscale range (i.e., at very low dopant amounts). On the basis of this experimental evidence, as well the other described considerations, we can thus exclude the occurrence of P phase in the current studied samples.
The location of the F/H boundary being close to x ~ 0.3 in Ce1−xSmxO2−x/2 agrees with previous studies performed using X-ray diffraction on the same system in room [24] and high-temperature [41] conditions. Very interestingly, as briefly mentioned in Section 1, these results differ slightly from the outcome of Raman spectroscopy, which has revealed the presence of a tiny amount of C-based domains even in Sm30 through the occurrence of a weak signal at ~370 cm−1, which was caused by the Sm-O symmetrical stretching mode with Sm in a six-fold coordination [42]. The described discrepancy between data of X-ray diffraction and Raman spectroscopy is not surprising, as it was already observed for other similar systems, such as Tm-doped ceria [43]. This is due to the very high sensitivity of the latter technique toward oxygen displacement, which gives it the ability to clearly discriminate between the F and C structures. On the contrary, X-ray diffraction patterns of the two phases are essentially superimposable, with the only difference being the presence of the weak superstructure peaks in C. In Figure 3, the Rietveld refinement plot of sample Sm50_6.94 is reported as a representative example; the refined parameters and Rietveld agreement factors are collected in Table 2.
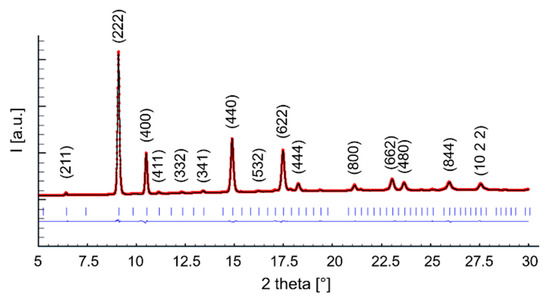
Figure 3.
Rietveld refinement plot of sample Sm50_6.94. The dotted (red) and the continuous (black) lines are the experimental and the calculated diffractograms, respectively; the lower line is the difference curve; vertical bars indicate the calculated positions of Bragg peaks. Miller indexes related to the H structure (space group ) are reported too.
Table 2.
Applied pressure, refined cell parameter and Rietveld agreement factors for each studied sample.
For each diffraction pattern the peak profile was refined by the pseudo-Voigt function, while the background was optimized by linear interpolation of a set of ~70 experimental points. For samples Sm20 and Sm30, the angular regions where peaks of Cu appear were excluded from refinements. In the last cycle, structural parameters (cell parameters; and for the H phase: the Ce/Sm1 x coordinate, the O1 x, y and z coordinates and both the occupancy factor and x coordinate of O2), atomic displacement parameters, the scale factor, five peak parameters and the background points were refined. For each composition, high-pressure data were optimized using atomic positions refined at ambient pressure as starting parameters.
Diffraction patterns collected from sample Sm50 at all the pressure values are shown in Figure 4 as representative examples of the behavior of all the compositions. No additional peaks can be observed by increasing the applied pressure with respect to the ones typical of the F or H structures; on the contrary, as evident from the inset, a shift toward higher diffraction angles occurred, indicating a lattice size reduction due to compression.
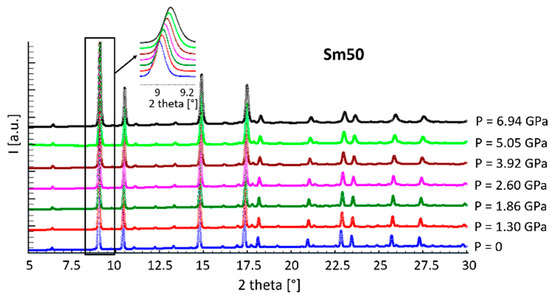
Figure 4.
Diffraction patterns of sample Sm50 at all pressure values.
In Figure 5, the refined values of the lattice volume of each sample are reported as a function of the applied pressure. Within the considered pressure range, the cell volume decreased with pressure, and it can be observed that the trend was roughly linear for sample Sm20, while all the other compositions had a progressively more marked softening of the decrease starting from ~3 GPa, which is in agreement with the compressibility reduction that occurred with increases in applied pressure. No significant differences were observed with changing pressure among the refined values of the Sm1 x coordinate.
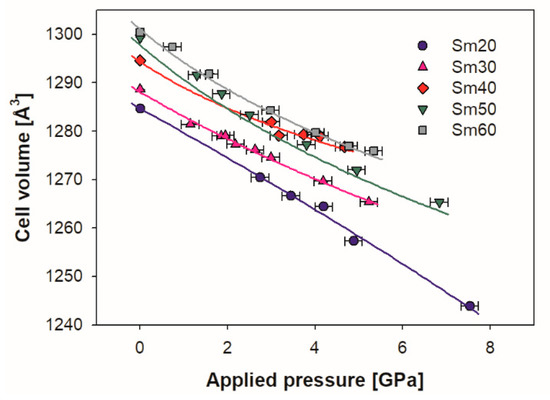
Figure 5.
Evolution with pressure of the Sm-doped ceria cell volume for all the samples; experimental data are fitted by the third order Vinet EoS (continuous lines). Cell volumes of samples Sm20 and Sm30 are multiplied by 8 in order to make them comparable with those of Sm40, Sm50 and Sm60. Vertical error bars are hidden by data markers.
The bulk modulus that occurred at zero pressure () accounts for the resistance of a material to compression, and is defined as
where is the cell volume at P = 0. can be estimated by fitting the refined lattice volumes (or cell parameters) obtained at different applied pressures to the proper equation of state. Several different EoSs were proposed in equations by Murnaghan [44], Birch-Murnaghan [45], Vinet [30] and Poirier-Tarantola [46], all of which were able to correctly predict the bulk modulus at ambient conditions [47]. All the aforementioned EoSs describe and model the pressure-volume correlation of a solid through the bulk modulus and its pressure derivatives. The Vinet EoS, for instance, is an exponential function with the following form:
with
and
In this work experimental data were fitted by the Vinet EoS, and fits of refined cell volumes vs. pressure are reported in Figure 5. The optimized as a function of Sm content appears in Figure 6 together with two values of CeO2 chosen from the literature, which were obtained using the Hartree-Fock method [48] and through X-ray diffraction [49]. It is worth noting that values of CeO2 available in the literature spanned a wide range, according to the employed technique [50]. A roughly linear decrease of with increasing Sm content can be observed in Figure 6.
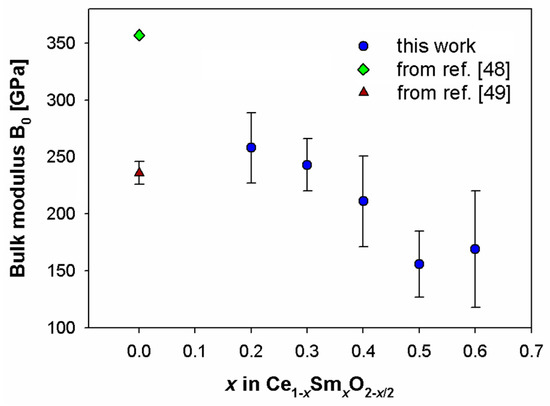
Figure 6.
Zero-pressure bulk modulus (B0) as a function of the Sm content alongside literature data for CeO2 [48,49].
4. Discussion
The dependence of B0 on Sm content can be analyzed and discussed in the light of the fundamental paper by Anderson and Nafe [51], which provides the theoretical background behind the behavior of in oxides. According to this work, a correlation exists between and the mean volume per ion pair (namely , calculated as the volume of a cell divided by the halved number of atoms therein contained). This correlation assumes different forms for ionic crystals and oxides. In particular, the expression
with and as the cationic and anionic charge, respectively, applies to ionic crystals, while
with ranging between 3 and 4, is valid for oxides. A decreasing linear trend is observed in both cases, which accounts for the progressively increasing compressibility of a solid with an increasing mean atomic volume. Relying on Equations (5) and (6), it is thus clear that oxides are characterized by a much stronger dependence of on atomic volume.
In Figure 7, the diagram of as a function of for Sm-doped ceria is shown, with values obtained from the EoS fits, and derived from the refined cell volumes. Firstly, it can be observed that the trend of data is decreasing and roughly linear.
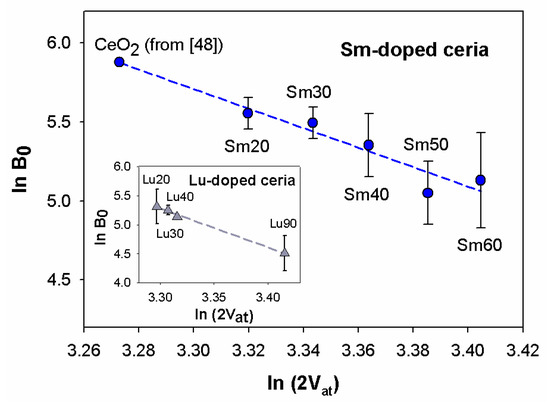
Figure 7.
Trend of as a function of . and values of Sm-doped ceria are obtained from EoS fits and Rietveld refinements, respectively. Data of CeO2 are taken from [48]. Cell volumes of samples Sm20 and Sm30 are multiplied by 8 in order to make them comparable with those of Sm40, Sm50 ad Sm60. Inset: trend of vs. for Lu-doped ceria: data are taken from [13]. In both diagrams the dashed line is the regression line interpolating data. Horizontal error bars are hidden by data markers.
It should be remembered at this point that, similar to all RE-doped ceria systems—where the total number of atoms changes with an increasing amount of RE—a linear correlation exists between the atomic mean volume and the doping ion amount, even in Sm-doped ceria, according to Zen’s law [52]. This issue, widely discussed in [3,24], points to the existence of a solid solution along the whole compositional range, where the guests are Sm3+ ions within the F region and aggregates within the H. As a consequence, the linear decrease in vs. implies a corresponding linear trend in vs. . Therefore, the absence of any discontinuity or slope change at 0.3 ≤ x ≤ 0.4 means that is insensitive to the structural change occurring at the F/H boundary. For the sake of comparison, data deriving from Lu-doped ceria taken from [12] are reported in the inset to Figure 6. values of Lu-doped ceria were obtained by fitting experimental data to the third order Vinet EoS, in analogy with the data treatment performed on Sm-doped ceria. As mentioned above, the Lu-doped ceria system presents different structural regions depending on the Lu content: the F phase up to x ~ 0.4; the (F + C) two-phase field for x ranging between ~0.4 and ~0.8; and a C-based solid solution containing F-structured CeO2 domains at higher x. The occurrence of the two-phase field is due to the large size difference between Ce4+ (CN:8) and Lu3+ (CN:6), which hinders the formation of the H phase. The regular decrease of vs. , observed in the inset to Figure 6, resembles the behavior of Sm-doped ceria, and suggests that even in this system is insensitive to structural changes.
vs. data of both systems can be interpolated by a regression line that satisfactorily fits experimental points (r2 = 0.94 and r2 = 0.99 for Sm- and Lu-doped ceria, respectively), as highlighted in Figure 7. The striking result here is the closeness of the two slopes: and for the Sm- and Lu-doped ceria, respectively. The decreasing trend is thus much steeper than expected for an oxide, according to [51]. This evidence can be most probably be interpreted as a direct consequence of the Ce4+ replacement by Sm3+ or Lu3+, the effects of which are two-fold: on the one hand, they cause an enlargement of the cell due to the incorporation of a larger ion (Sm3+, CN:8, r = 1.079 Å; Lu3+, CN:8, r = 0.977 Å [25]) in place of a smaller one (Ce4+, CN:8, r = 0.97 Å [25]); on the other hand, the introduction of oxygen vacancies is generally considered responsible for lattice shrinkage [53,54,55]. In this respect, Raman spectroscopy offers a precious contribution to comprehension of the vacancies effect, since it is possible to apply a correction to the observed Raman shift of the CeO2 symmetric vibration mode and separate the size from the vacancies effect [53]. Once subtracted from the size effect, the trend of the corrected Raman shifts increases along with increases of the amount of trivalent ions, which can be explained as a consequence of the lattice shrinkage brought about by the introduction of oxygen vacancies. The described result was obtained both for Sm- [24,41] and Gd-doped ceria [24] and can be conceivably predicted for all the RE-doped ceria systems within the F and H phases. From the previous discussion it can thus be expected that mean atomic volume is affected by the two competitive effects, namely, the dopant size and vacancies introduction. Therefore, the mean atomic volume increases with increases in Sm3+ or Lu3+ amounts, but less so than if vacancies were not created. Under these circumstances, a steeper decrease of vs. is expected, and indeed was observed in our samples belonging to both systems with respect to the ones reported in [51].
A further remarkable issue concerning the effect of pressure on cell volume can be inferred from the data reported in Figure 5. Even at a first glance, Sm20 can be distinguished from other compositions due to roughly linear decreases in its cell volume vs. applied pressure, which indicate that the bulk modulus did not present any substantial change as a result of pressure within the considered range. All other samples, on the contrary, showed a progressively less steep decrease with increasing pressure, thus indicating an increase in the bulk modulus and a decrease in compressibility. Moreover, softening of the volume decrease vs. pressure decrease became more and more marked with increasing amounts of Sm. This substantial difference between samples with x < ~ 0.3 and x ≥ ~ 0.3 seems to go hand in hand with the structural modifications occurring at x ~ 0.3, namely, the transition from F to H. Within this scenario, it can thus be deduced that the F phase is more tolerant toward compression with respect to C, or in other words that C-based microdomains tend to stiffen structures and make them less compressible. This conclusion is also corroborated by the general consideration that the fluorite structure of CeO2 is indeed very prone to the replacement of Ce4+ by larger atoms up to a remarkable substitution degree [3]. An F-based solid solution preserving the atomic arrangement of CeO2 is in fact stable in Ce1−xRExO2−x/2 systems (e.g., up to x ~ 0.2 or 0.25 for Gd3+ [28,56]; x ~ 0.25 for Y3+ [26]; x ~ 0.3 for Sm3+ [28] and Er3+ [57]; x ~ 0.4 for Tm3+ [54], Lu3+ [28] and Nd3+ [57]; x ~ 0.5 for Yb3+ [54] and an Nd3+/Dy3+ mixture [58]; and x ~ 0.6 for La3+ [57]). On the contrary, a much narrower stability region occurs for RE2O3-based C-structured solid solutions where RE3+ is partially substituted by Ce4+. For RE ≡ Lu, for example, a maximum 10% substitution by Ce4+ is in fact possible, while for RE ≡ Gd and Sm, the maximum substitution degree of trivalent ions reaches 20% [28].
The stiffening effect of the C phase is further confirmed by the behavior shown in Figure 8 related to the cell volume vs. applied pressure up to 7 GPa observed in Lu-doped ceria, which is based on the experimental results reported in [12]. It can be noticed that samples Lu20, Lu30 and Lu40, crystallizing in the F structure, are characterized by a roughly linear decrease within the pressure range considered; conversely, Lu90, crystallizing in the C structure, presents a softening of the volume decrease already revealed for C-containing compositions belonging to Sm-doped ceria, thus confirming the higher resistance to compression of this structure.
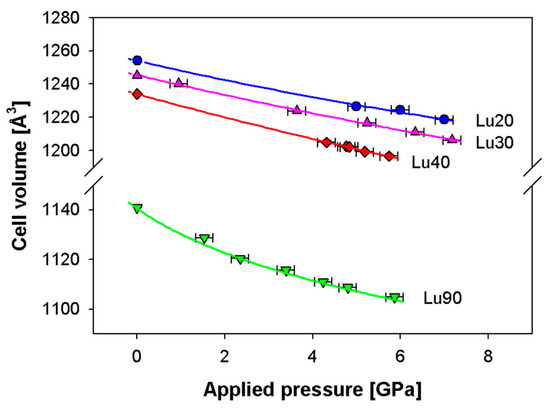
Figure 8.
Dependence of the Lu-doped ceria cell volume vs. applied pressure; experimental data are taken from [13] and fitted by the third order Vinet EoS (continuous lines). Cell volumes of samples Lu20, Lu30 and Lu40 are multiplied by 8 in order to make them comparable with Sm90. Vertical error bars are hidden by data markers.
5. Conclusions
An in situ high-pressure structural investigation was performed by powder X-ray diffraction at the Elettra synchrotron facility on samples belonging to the Ce1−xSmxO2−x/2 system with nominal x = 0.2, 0.3, 0.4, 0.5 and 0.6. Rietveld refinements performed on the collected diffraction patterns provided optimized values of the cell volumes at the different pressures, which were then interpolated through the third order Vinet EoS. The fit allowed refined values of the bulk modulus to be obtained at zero pressure (). Results were discussed in comparison to the ones previously obtained from Lu-doped ceria. Two main conclusions can be drawn from this study.
- -
- The vs. trend provided a linear decrease as expected, but the slope of the regression line was around −6 for both systems, instead of ranging between −3 and −4, which is at odds with predictions for oxides. This evidence can be interpreted considering that a linear correlation exists between the RE3+ content and the oxygen vacancies amount; the rise in the vacancies content occurring with increasing the RE3+ amount causes a lattice shrinkage and limits the increase of the mean atomic volume.
- -
- While samples crystallizing in the F structure showed a roughly linear decrease of the cell volume vs. pressure, the ones containing C-based microdomains demonstrated a softening of cell volume decrease with increasing pressure. This evidence, emerging both from Sm- and Lu-doped ceria, suggests that the presence of C stiffens a structure, making it less and less compressible with increasing pressure.
Supplementary Materials
The following are available online at https://www.mdpi.com/1996-1073/13/7/1558/s1, Table S1: Hybrid (H) structural model compared to the F structure typical of CeO2 and to the C structure typical of sesquioxides of heavy rare earths.
Author Contributions
Conceptualization, C.A., M.M.C. and M.P.; methodology, C.A.; formal analysis, C.A.; investigation, M.P. and B.J.; resources, M.P. and C.A.; data curation, S.M.; writing—original draft preparation, C.A.; writing—review and editing, C.A., S.M., M.M.C., B.J. and M.P.; visualization, S.M. All authors have read and agreed to the published version of the manuscript.
Funding
This research received no external funding.
Acknowledgments
The Elettra Synchrotron Radiation Facility is acknowledged for the provision of beam time. B.J. acknowledges IISc Bangalore and ICTP Trieste for the award of IISc-ICTP fellowship.
Conflicts of Interest
The authors declare no conflict of interest.
References
- Omar, S.; Wachsman, E.D.; Jones, J.L.; Nino, J.C. Crystal structure-ionic conductivity relationships in doped ceria. J. Am. Ceram. Soc. 2009, 92, 2674–2681. [Google Scholar] [CrossRef]
- Artini, C.; Pani, M.; Lausi, A.; Masini, R.; Costa, G.A. High temperature structural study of Gd-doped ceria by synchrotron X-ray diffraction (673 K ≤ T ≤ 1073 K). Inorg. Chem. 2014, 53, 10140–10149. [Google Scholar] [CrossRef] [PubMed]
- Presto, S.; Artini, C.; Pani, M.; Carnasciali, M.M.; Massardo, S.; Viviani, M. Ionic conductivity and local structural features in Ce1−xSmxO2−x/2. Phys. Chem. Chem. Phys. 2018, 20, 28338–28345. [Google Scholar] [CrossRef]
- Steele, B.C.H. Appraisal of Ce1−xGdyO2−y/2 electrolytes for IT-SOFC operation at 500 °C. Solid State Ion. 2000, 129, 95–110. [Google Scholar] [CrossRef]
- Artini, C. RE-doped ceria systems and their performance as solid electrolytes: A puzzling tangle of structural issues at the average and local scale. Inorg. Chem. 2018, 57, 13047–13062. [Google Scholar] [CrossRef]
- Coduri, M.; Checchia, S.; Longhi, M.; Ceresoli, D.; Scavini, M. Rare earth doped ceria: The complex connection between structure and properties. Front. Chem. 2018, 6, 526. [Google Scholar] [CrossRef]
- Artini, C.; Presto, S.; Massardo, S.; Pani, M.; Carnasciali, M.M.; Viviani, M. Transport properties and high temperature Raman features of heavily Gd-doped ceria. Energies 2019, 12, 4148. [Google Scholar] [CrossRef]
- Rupp, J.L.M.; Infortuna, A.; Gauckler, L.J. Thermodynamic stability of gadolinia-doped ceria thin film electrolytes for micro-solid oxide fuel cells. J. Am. Ceram. Soc. 2007, 90, 1792–1797. [Google Scholar] [CrossRef]
- Taniguchi, I.; Van Landschoot, R.C.; Schoonman, J. Electrostatic spray deposition of Gd0.1Ce0.9O1.95 and La0.9Sr0.1Ga0.8Mg0.2O2.87 thin films. Solid State Ion. 2003, 160, 271–279. [Google Scholar] [CrossRef]
- Burbano, M.; Marrocchelli, D.; Watson, G.W. Strain effects on the ionic conductivity of Y-doped ceria: A simulation study. J. Electroceram. 2014, 32, 28–36. [Google Scholar] [CrossRef]
- Kant, K.M.; Esposito, V.; Pryds, N. Strain induced ionic conductivity enhancement in epitaxial Ce0.9Gd0.1O2−δ thin films. Appl. Phys. Lett. 2012, 100, 033105. [Google Scholar] [CrossRef]
- Rainwater, B.H.; Velisavljevic, N.; Park, C.; Sun, H.; Waller, G.H.; Tsoi, G.M.; Vohra, Y.K.; Liu, M. High pressure structural study of samarium doped CeO2 oxygen vacancy conductor—Insight into the dopant concentration relationship to the strain effect in thin film ionic conductors. Solid State Ion. 2016, 292, 59–65. [Google Scholar] [CrossRef]
- Artini, C.; Joseph, B.; Costa, G.A.; Pani, M. Crystallographic properties of Lu-doped ceria, Ce1−xLuxO2−x/2, at pressures up to 7 GPa. Solid State Ion. 2018, 320, 152–158. [Google Scholar] [CrossRef]
- Lee, K.-R.; Ahn, K.; Chung, Y.-C.; Lee, J.-H.; Yoo, H.-I. Lattice distortion effect on electrical properties of GDC thin films: Experimental evidence and computational simulation. Solid State Ion. 2012, 229, 45–53. [Google Scholar] [CrossRef]
- Spiridigliozzi, L.; Ferone, C.; Cioffi, R.; Accardo, G.; Frattini, D.; Dell’Agli, G. Entropy-stabilized oxides owning fluorite structure obtained by hydrothermal treatment. Materials 2020, 13, 558. [Google Scholar] [CrossRef]
- Sarkar, A.; Loho, C.; Velasco, L.; Thomas, T.; Battacharya, S.S.; Hahn, H.; Djenadic, R. Multicomponent equiatomic rare earth oxides with a narrow band gap and associated praseodymium multivalenc. Dalton Trans. 2017, 46, 12167–12176. [Google Scholar] [CrossRef] [PubMed]
- Coduri, M.; Masala, P.; Allieta, M.; Peral, I.; Brunelli, M.; Biffi, C.A.; Scavini, M. Phase transformations in the CeO2-Sm2O3 system: A multiscale powder diffraction investigation. Inorg. Chem. 2018, 57, 879–891. [Google Scholar] [CrossRef]
- Artini, C.; Nelli, I.; Pani, M.; Costa, G.A.; Caratto, V.; Locardi, F. Thermal decomposition of Ce-Sm and Ce-Lu mixed oxalates: Influence of the Sm- and Lu-doped ceria structure. Thermochim. Acta 2017, 651, 100–107. [Google Scholar] [CrossRef]
- Omar, S.; Wachsman, E.; Nino, J. Higher conductivity Sm3+ and Nd3+ co-doped ceria-based electrolyte materials. Solid State Ion. 2008, 178, 1890–1897. [Google Scholar] [CrossRef]
- Acharya, S.A.; Gaikwad, V.M.; D’Souza, S.W.; Barman, S.R. Gd/Sm dopant-modified oxidation state and defect generation in nano-ceria. Solid State Ion. 2014, 260, 21–29. [Google Scholar] [CrossRef]
- Nitani, H.; Nakagawa, T.; Yamanouchi, M.; Osuki, T.; Yuya, M.; Yamamoto, T.A. XAFS and XRD study of ceria doped with Pr, Nd and Sm. Mater. Lett. 2004, 58, 2076–2081. [Google Scholar] [CrossRef]
- Artini, C.; Costa, G.A.; Pani, M.; Lausi, A.; Plaisier, J. Structural characterization of the CeO2/Gd2O3 mixed system by synchrotron X-ray diffraction. J. Solid State Chem. 2012, 190, 24–28. [Google Scholar] [CrossRef]
- Tianshu, Z.; Hing, P.; Huang, H.; Kilner, J. Ionic conductivity in the CeO2–Gd2O3 system (0.05 ≤ Gd/Ce ≤ 0.4) prepared by oxalate coprecipitation. Solid State Ion. 2002, 148, 567–573. [Google Scholar] [CrossRef]
- Artini, C.; Pani, M.; Carnasciali, M.M.; Buscaglia, M.T.; Plaisier, J.; Costa, G.A. Structural features of Sm- and Gd-doped ceria studied by synchrotron X-ray diffraction and μ-Raman spectroscopy. Inorg. Chem. 2015, 54, 4126–4137. [Google Scholar] [CrossRef]
- Shannon, R.D. Revised effective ionic radii and systematic studies of interatomic distances in halides and chalcogenides. Acta Cryst. A 1976, 32, 751–767. [Google Scholar] [CrossRef]
- Coduri, M.; Scavini, M.; Allieta, M.; Brunelli, M.; Ferrero, C. Defect structure of Y-doped ceria on different length scales. Chem. Mater. 2013, 25, 4278–4289. [Google Scholar] [CrossRef]
- Coduri, M.; Scavini, M.; Pani, M.; Carnasciali, M.M.; Klein, H.; Artini, C. From nano to microcrystals: Effect of different synthetic pathways on defects architecture in heavily Gd-doped ceria. Phys. Chem. Chem. Phys. 2017, 19, 11612–11630. [Google Scholar] [CrossRef]
- Artini, C.; Pani, M.; Carnasciali, M.M.; Plaisier, J.R.; Costa, G.A. Lu-, Sm- and Gd-doped ceria: A comparative approach to their structural properties. Inorg. Chem. 2016, 55, 10567–10579. [Google Scholar] [CrossRef]
- Lotti, P.; Milani, S.; Merlini, M.; Joseph, B.; Alabarse, F.; Lausi, A. Single-crystal diffraction at the high-pressure Indo-Italian beamline Xpress at Elettra, Trieste. J. Synchrot. Radiat. 2020, 27, 222–229. [Google Scholar] [CrossRef]
- Vinet, P.; Smith, J.R.; Ferrante, J.; Rose, J.H. Temperature effects on the universal equation of state of solids. Phys. Rev. B 1987, 35, 1945–1953. [Google Scholar] [CrossRef]
- Artini, C.; Costa, G.A.; Carnasciali, M.M.; Masini, R. Stability fields and structural properties of intra rare earths perovskites. J. Alloy Compd. 2010, 494, 336–339. [Google Scholar] [CrossRef]
- Artini, C.; Costa, G.A.; Masini, R. Study of the formation temperature of mixed LaREO3 (RE≡Dy, Ho, Er, Tm, Yb, Lu) and NdGdO3 oxides. J. Therm. Anal. Calorim. 2011, 103, 17–21. [Google Scholar] [CrossRef]
- Rodriguez-Carvajal, J. Recent advances in magnetic structure determination by neutron powder diffraction. Phys. B Condens. Matter 1993, 192, 55–69. [Google Scholar] [CrossRef]
- Gonzalez-Platas, J.; Alvaro, M.; Nestola, F.; Angel, R. EosFit7-GUI: A new graphical user interface for equation of state calculations, analyses and teaching. J. Appl. Cryst. 2016, 49, 1377–1382. [Google Scholar] [CrossRef]
- Eyring, L. The binary rare earth oxides. In Handbook on the Physics and Chemistry of Rare Earths; Gschneidner, K.A., Jr., Eyring, L., Eds.; North Holland: Amsterdam, The Netherlands, 1979; Volume 3, pp. 337–399. [Google Scholar]
- Vanpoucke, D.E.P.; Bultinck, P.; Cottenier, S.; Van Speybroeck, V.; Van Driessche, I. Density functional theory study of La2Ce2O7: Disordered fluorite versus pyrochlore structure. Phys. Rev. B 2011, 84, 054110. [Google Scholar] [CrossRef]
- Minervini, L.; Grimes, R.W. Disorder in pyrochlore oxides. J. Am. Ceram. Soc. 2000, 83, 1873–1878. [Google Scholar] [CrossRef]
- Chen, W.; Navrotsky, A. Thermochemical study of trivalent-doped ceria systems: CeO2-MO1.5 (M = La, Gd, and Y). J. Mater. Res. 2006, 21, 3242–3251. [Google Scholar] [CrossRef]
- Minervini, L.; Zacate, M.O.; Grimes, R.W. Defect cluster formation in M2O3-doped CeO2. Solid State Ion. 1999, 116, 339–349. [Google Scholar] [CrossRef]
- Wang, B.; Lewis, R.J. Cormack, A.N. Computer simulations of large-scale defect clustering and nanodomain structure in gadolinia-doped ceria. Acta Mater. 2011, 59, 2035–2045. [Google Scholar] [CrossRef]
- Artini, C.; Carnasciali, M.M.; Viviani, M.; Presto, S.; Plaisier, J.R.; Costa, G.A.; Pani, M. Structural properties of Sm-doped ceria electrolytes at the fuel cell operating temperatures. Solid State Ion. 2018, 315, 85–91. [Google Scholar] [CrossRef]
- Ubaldini, A.; Carnasciali, M.M. Raman Characterisation of powder of cubic RE2O3 (RE=Nd, Gd, Dy, Tm, and Lu), Sc2O3 and Y2O3. J. Alloy Compd. 2008, 454, 374–378. [Google Scholar] [CrossRef]
- Artini, C.; Carnasciali, M.M.; Costa, G.A.; Plaisier, J.R.; Pani, M. A novel method for the evaluation of the Rare Earth (RE) coordination number in RE-doped ceria through Raman spectroscopy. Solid State Ion. 2017, 311, 90–97. [Google Scholar] [CrossRef]
- Murnaghan, F.D. The compressibility of media under extreme pressures. Proc. Natl. Acad. Sci. USA 1944, 30, 244–247. [Google Scholar] [CrossRef] [PubMed]
- Birch, F. Finite elastic strain of cubic crystals. Phys. Rev. B 1947, 71, 809–824. [Google Scholar] [CrossRef]
- Poirier, J.P.; Tarantola, A. A logarithmic equation of state. Phys. Earth Planet Int. 1998, 109, 1–8. [Google Scholar] [CrossRef]
- Pavese, A. Pressure-volume-temperature equations of state: A comparative study based on numerical simulations. Phys. Chem. Miner. 2002, 29, 43–51. [Google Scholar] [CrossRef]
- Hill, S.E.; Catlow, C.R.A. A Hartree-Fock periodic study of bulk ceria. J. Phys. Chem. Solids 1993, 54, 411–419. [Google Scholar] [CrossRef]
- Gerward, L.; Staun Olsen, J. Powder diffraction analysis of cerium oxide at high pressure. Powder Diffr. 1993, 8, 127–130. [Google Scholar] [CrossRef]
- Gerward, L.; Staun Olsen, J.; Petit, L.; Vaitheeswaran, G.; Kanchana, V.; Svane, A. Bulk modulus of CeO2 and PrO2 – An experimental and theoretical study. J. Alloy Compd. 2005, 400, 56–61. [Google Scholar] [CrossRef]
- Anderson, O.L.; Nafe, J.E. The bulk modulus-volume relationship for oxides compounds and related geophysical problems. J. Geophys. Res. 1965, 70, 3951–3963. [Google Scholar] [CrossRef]
- Zen, E. Validity of “Vegard’s law”. Am. Mineral. 1956, 41, 523–524. [Google Scholar]
- McBride, J.R.; Hass, K.C.; Pointdexter, B.D.; Weber, W.H. Raman and X-ray studies of Ce1−xRExO2−y, where RE=La, Pr, Nd, Eu, Gd, and Tb. J. Appl. Phys. 1994, 76, 2435–2441. [Google Scholar] [CrossRef]
- Mandal, B.P.; Grover, V.; Roy, M.; Tyagi, A.K. X-ray diffraction and Raman spectroscopic investigation on the phase relations in Yb2O3- and Tm2O3-substituted CeO2. J. Am. Ceram. Soc. 2007, 90, 2961–2965. [Google Scholar] [CrossRef]
- Kossoy, A.; Wang, Q.; Korobko, R.; Grover, V.; Feldman, Y.; Wachtel, E.; Tyagi, A.K.; Frenkel, A.I.; Lubomirsky, I. Evolution of the local structure at the phase transition in CeO2-Gd2O3 solid solutions. Phys. Rev. B 2013, 87, 054101. [Google Scholar] [CrossRef]
- Scavini, M.; Coduri, M.; Allieta, M.; Brunelli, M.; Ferrero, C. Probing complex disorder in Ce1−xGdxO2−x/2 using the pair distribution function analysis. Chem. Mater. 2012, 24, 1338–1345. [Google Scholar] [CrossRef]
- Horlait, D.; Claparède, L.; Clavier, N.; Szencnekt, S.; Dacheux, N.; Ravaux, J.; Podor, R. Stability and structural evolution of CeIV1−xLnIIIxO2−x/2 solid solutions: A coupled μ-Raman/XRD approach. Inorg. Chem. 2011, 50, 150–161. [Google Scholar] [CrossRef]
- Artini, C.; Gigli, L.; Carnasciali, M.M.; Pani, M. Structural properties of the (Nd,Dy)-doped ceria system by synchrotron X-ray diffraction. Inorganics 2019, 7, 94. [Google Scholar] [CrossRef]


© 2020 by the authors. Licensee MDPI, Basel, Switzerland. This article is an open access article distributed under the terms and conditions of the Creative Commons Attribution (CC BY) license (http://creativecommons.org/licenses/by/4.0/).