Single-Cell Tests to Explore the Reliability of Sofc Installations Operating Offshore


Abstract
:1. Introduction
- To which extent individual cells will be degraded by the presence of salt (NaCl) in the feed to an SOFC cathode, and the underlying reasons for any such degradation.
- The effect of oxygen depletion in the air supply to a cell.
2. Experimental
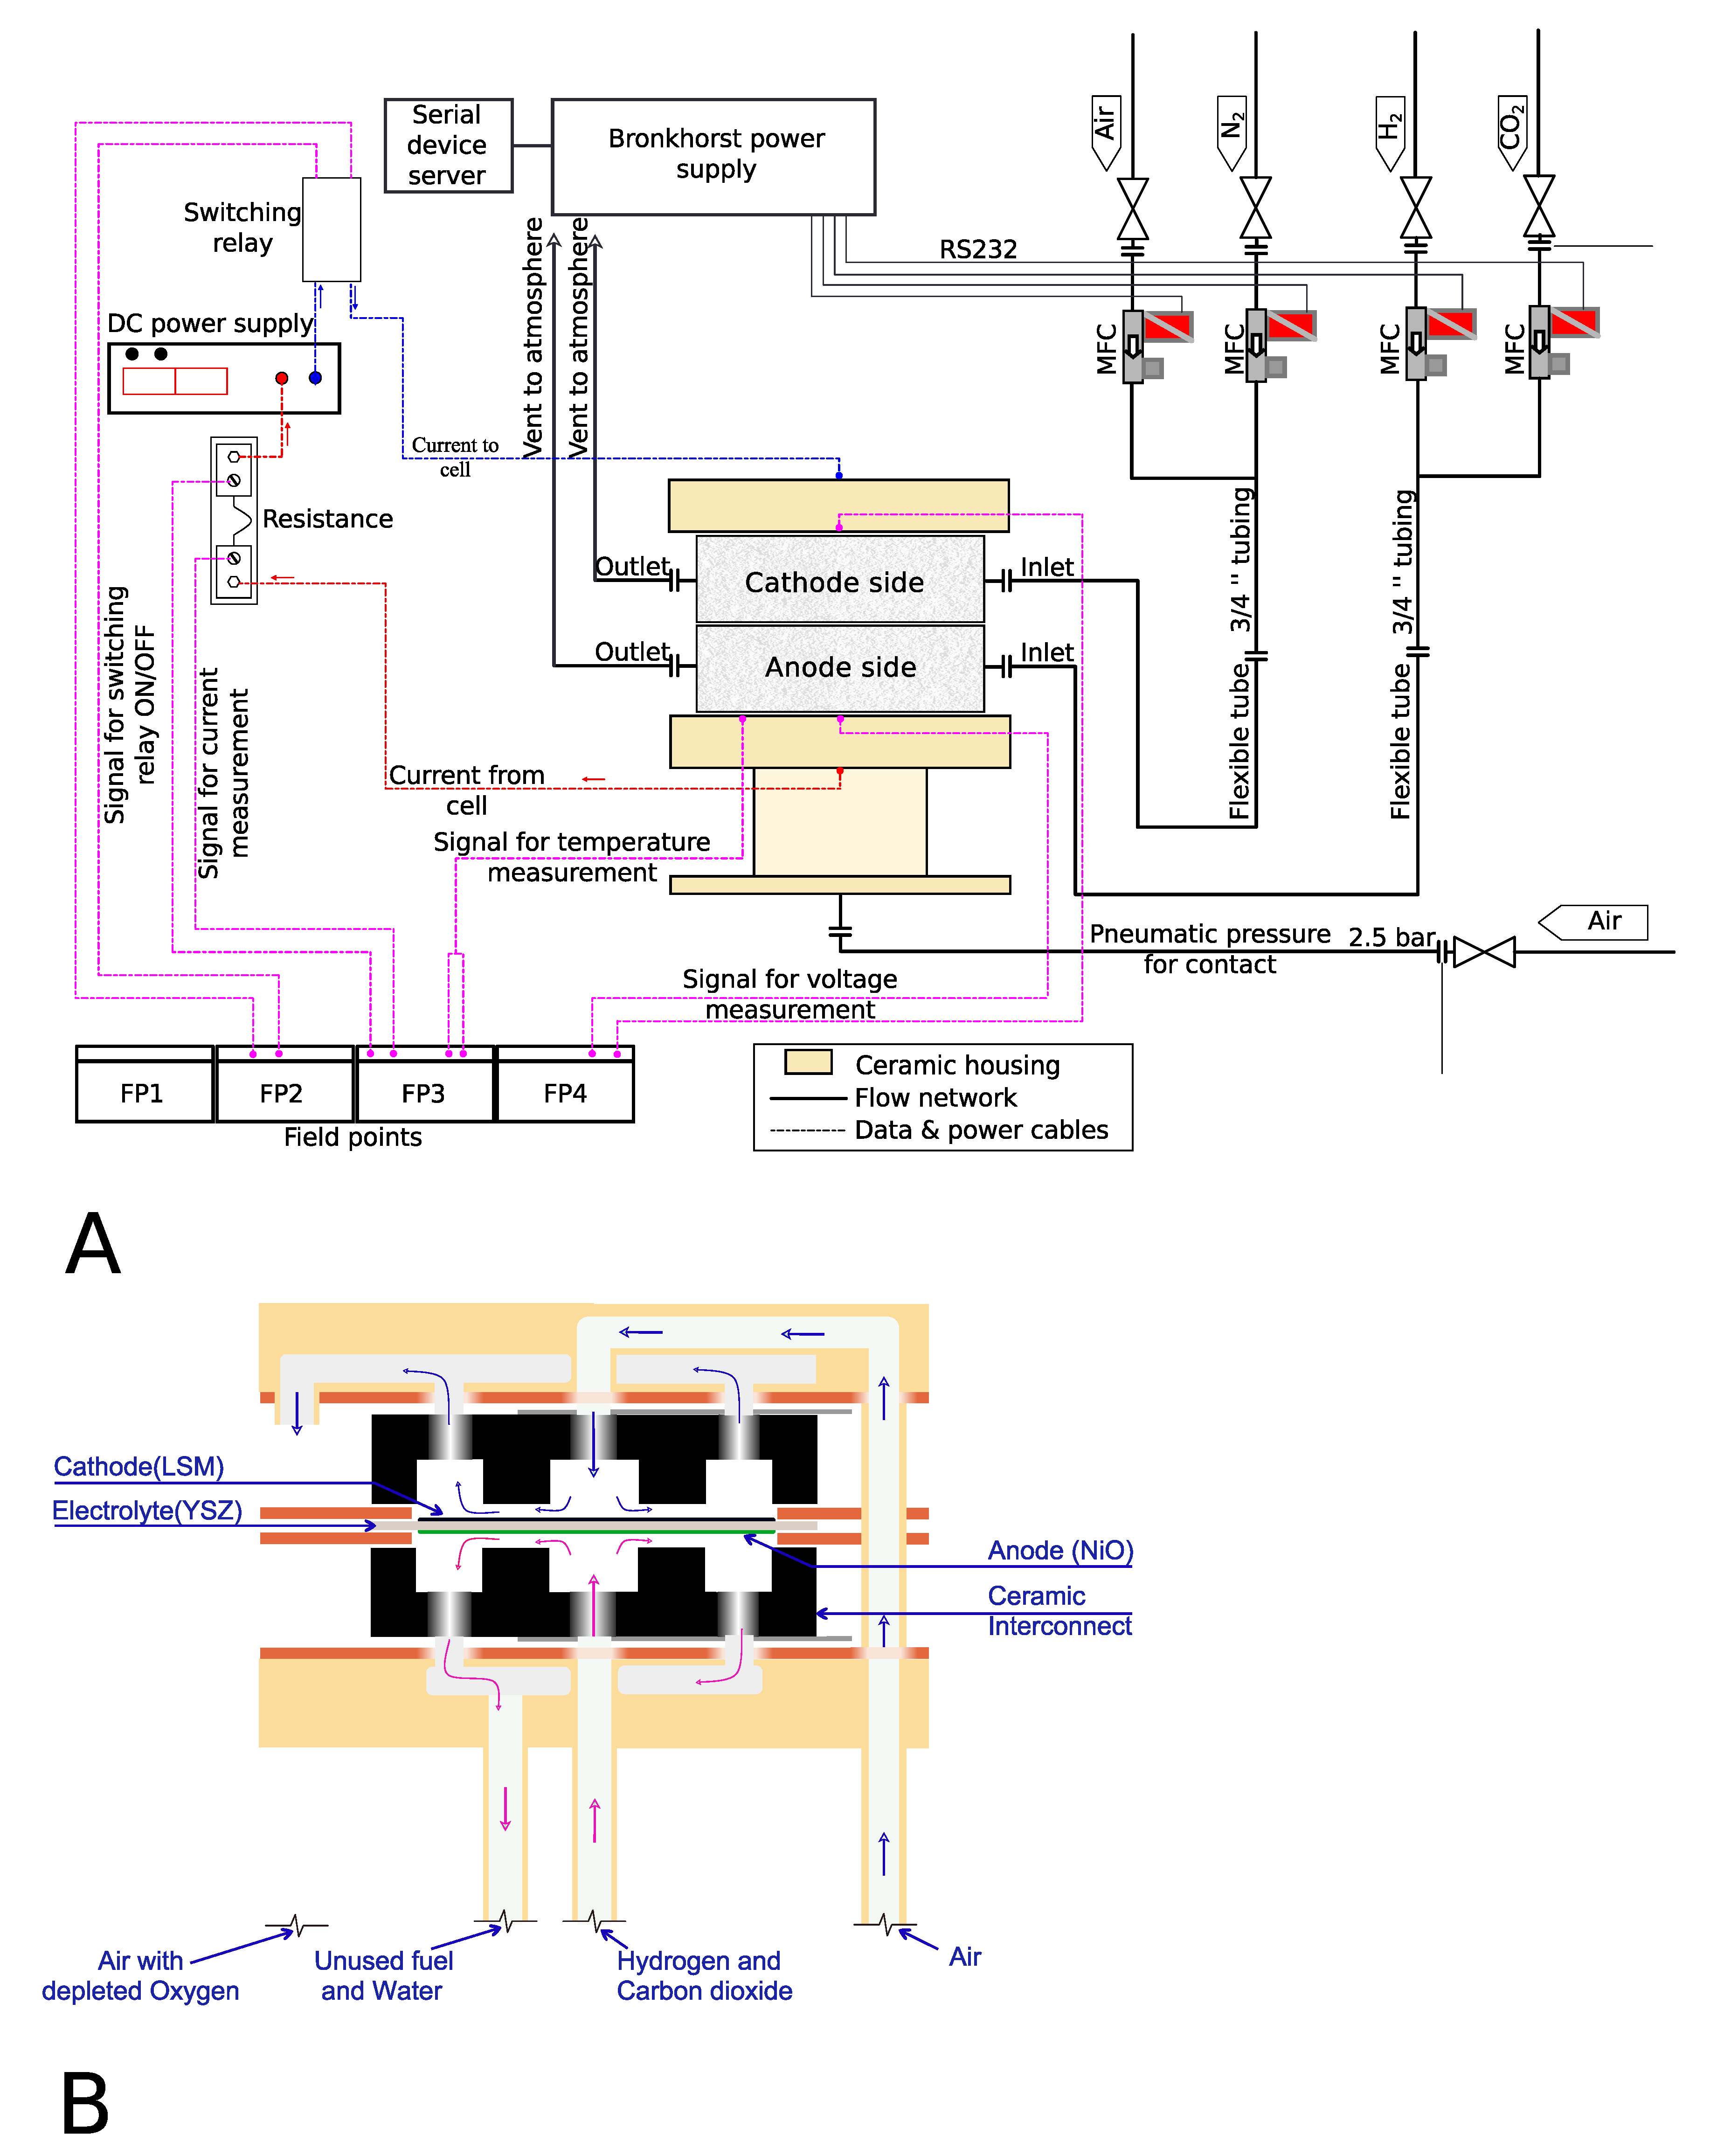
2.1. Test Set-Up
2.1.1. Oven
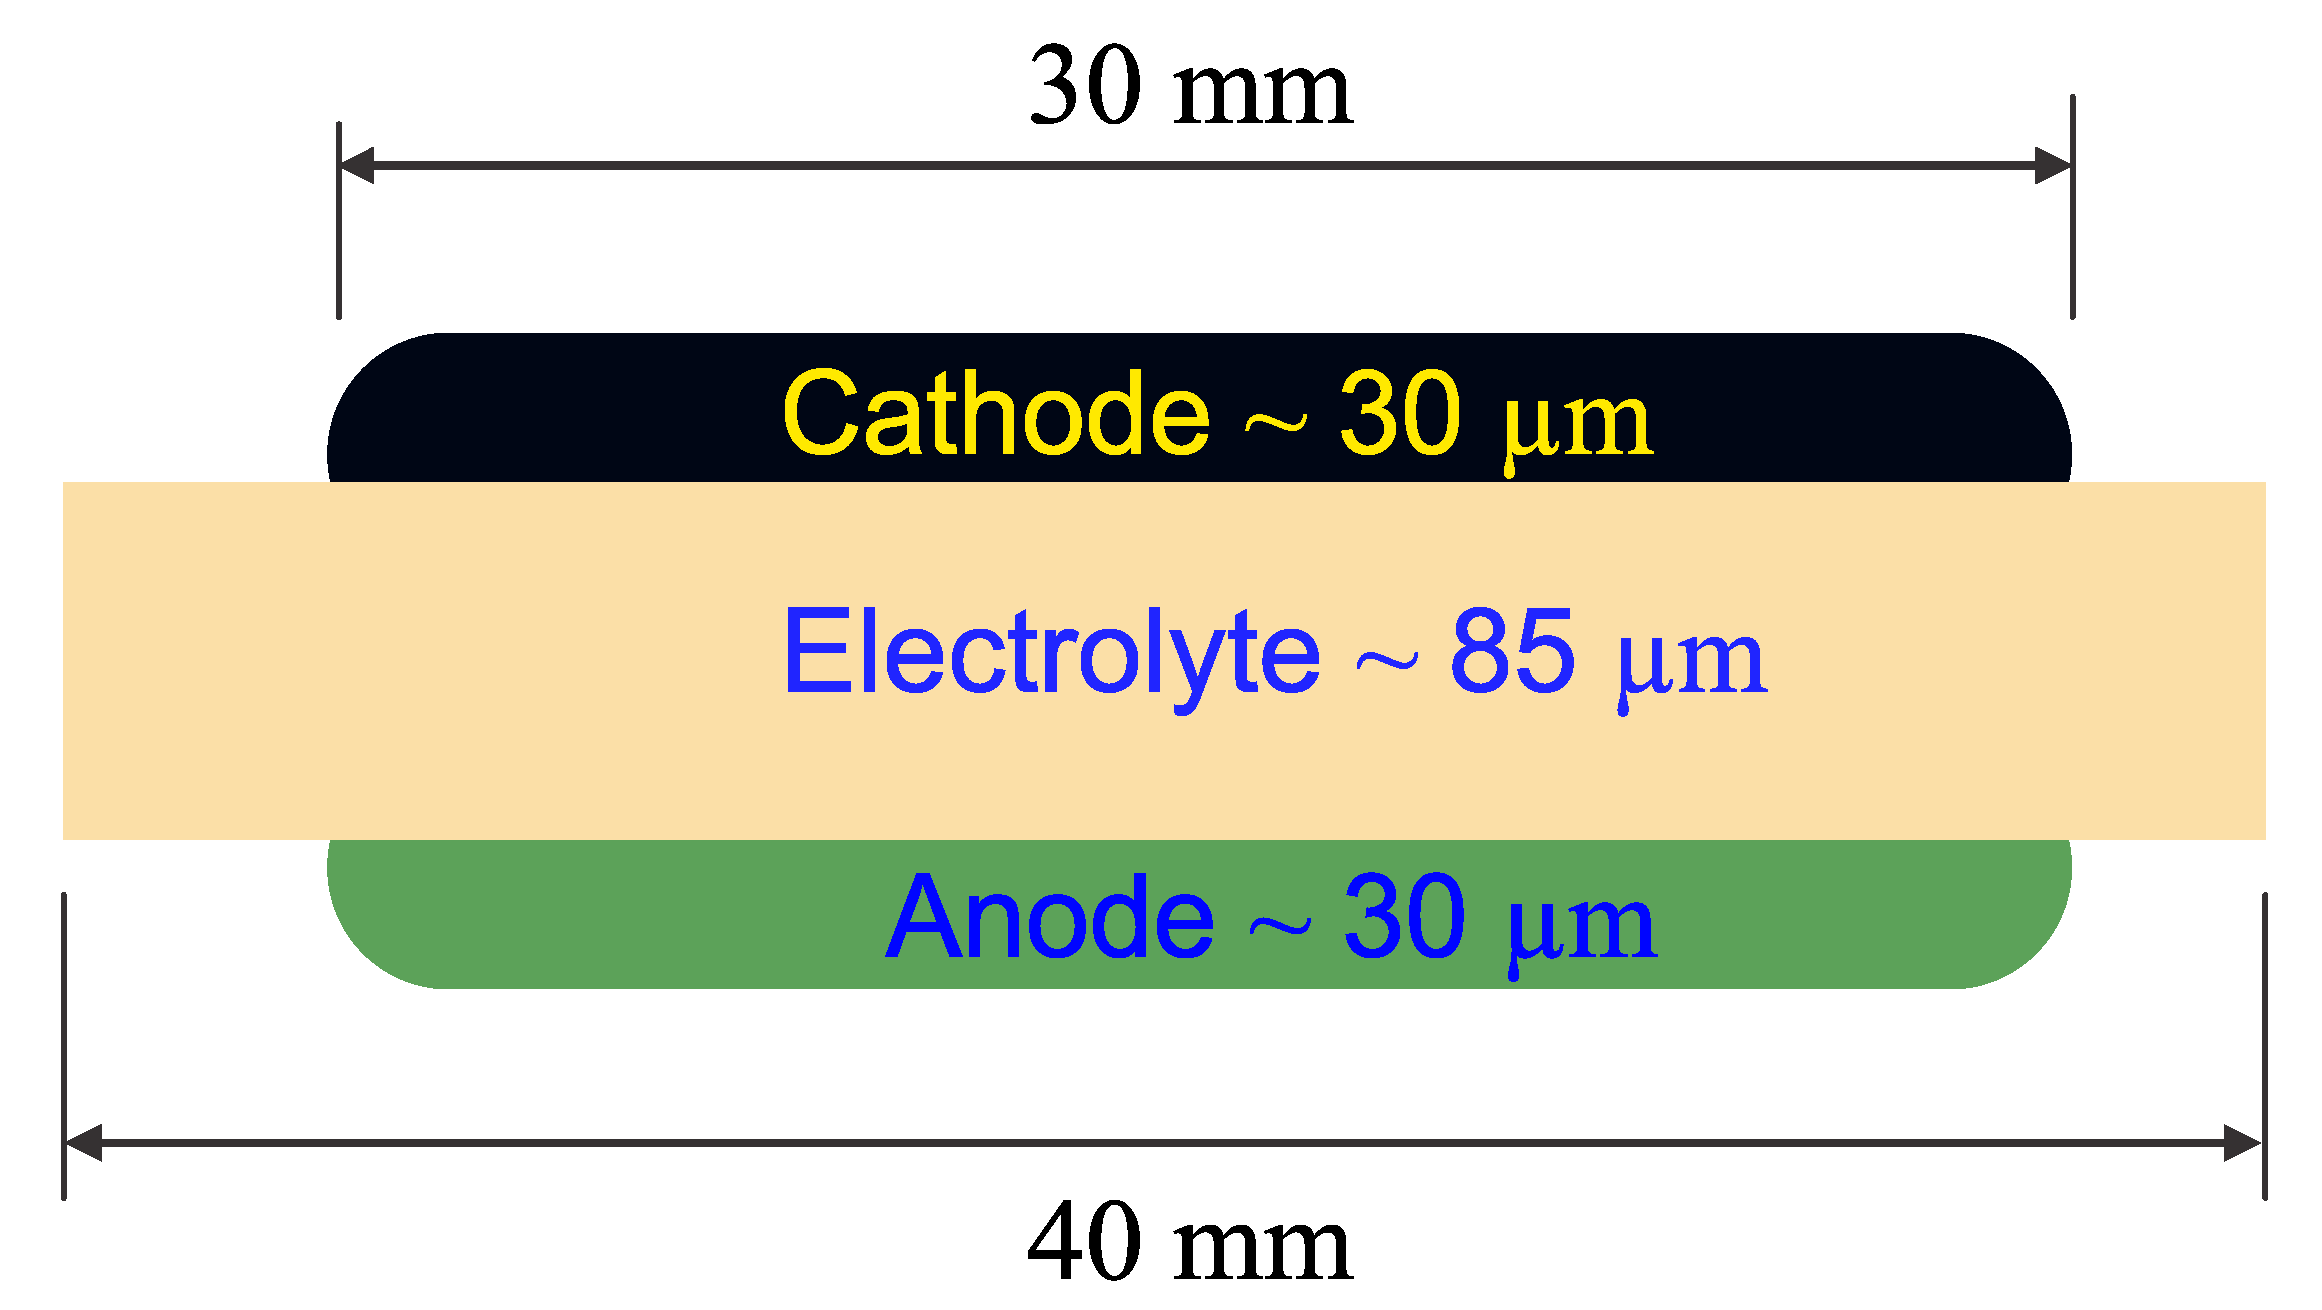
2.1.2. The Cell Itself
- High power density
- Robust in nature for long term usage and in redox environments
2.1.3. Gas Handling System
2.1.4. Field Points
2.1.5. Data Acquisition
2.1.6. Current-Collection Layers
2.1.7. Characterization of the Layers
2.2. Method
2.2.1. Short-Term Salt Degradation Tests
2.2.2. Long-Term Salt Degradation Tests
2.2.3. Oxygen Depletion Tests
3. Results and Discussion
3.1. Salt Degradation Tests
3.1.1. Short-Term Salt Degradation Tests
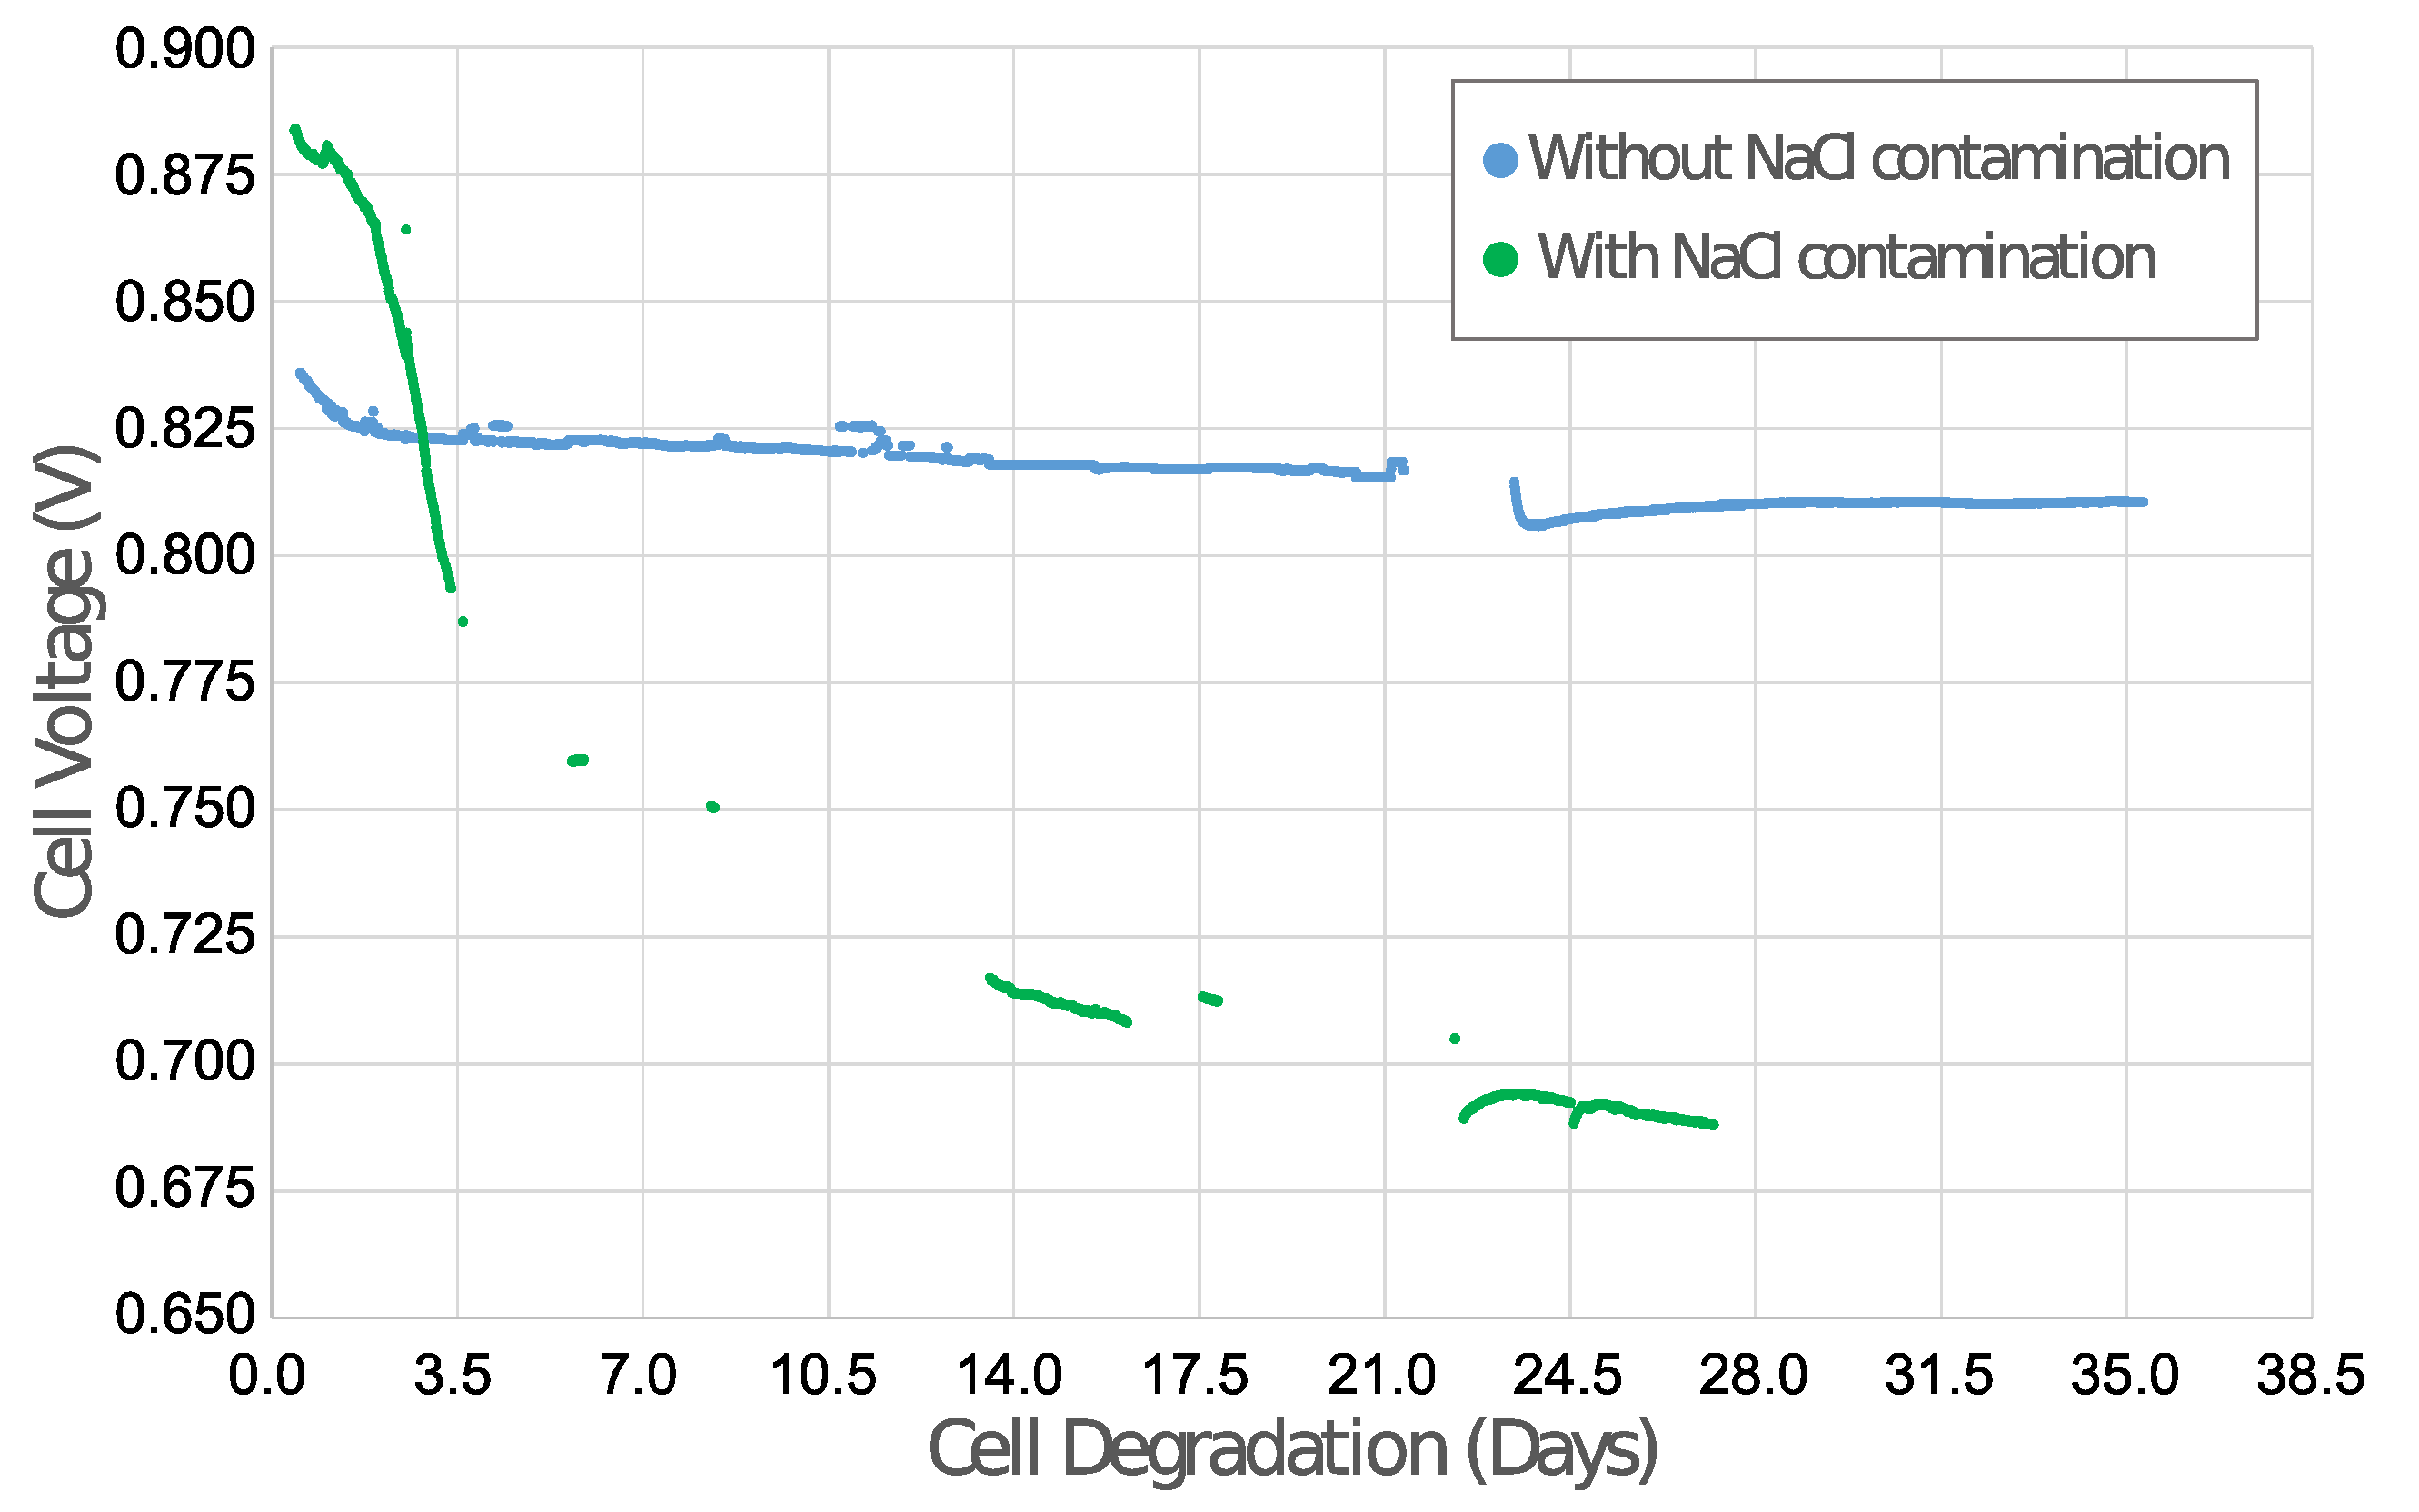
3.1.2. Long-Term Salt Degradation Tests
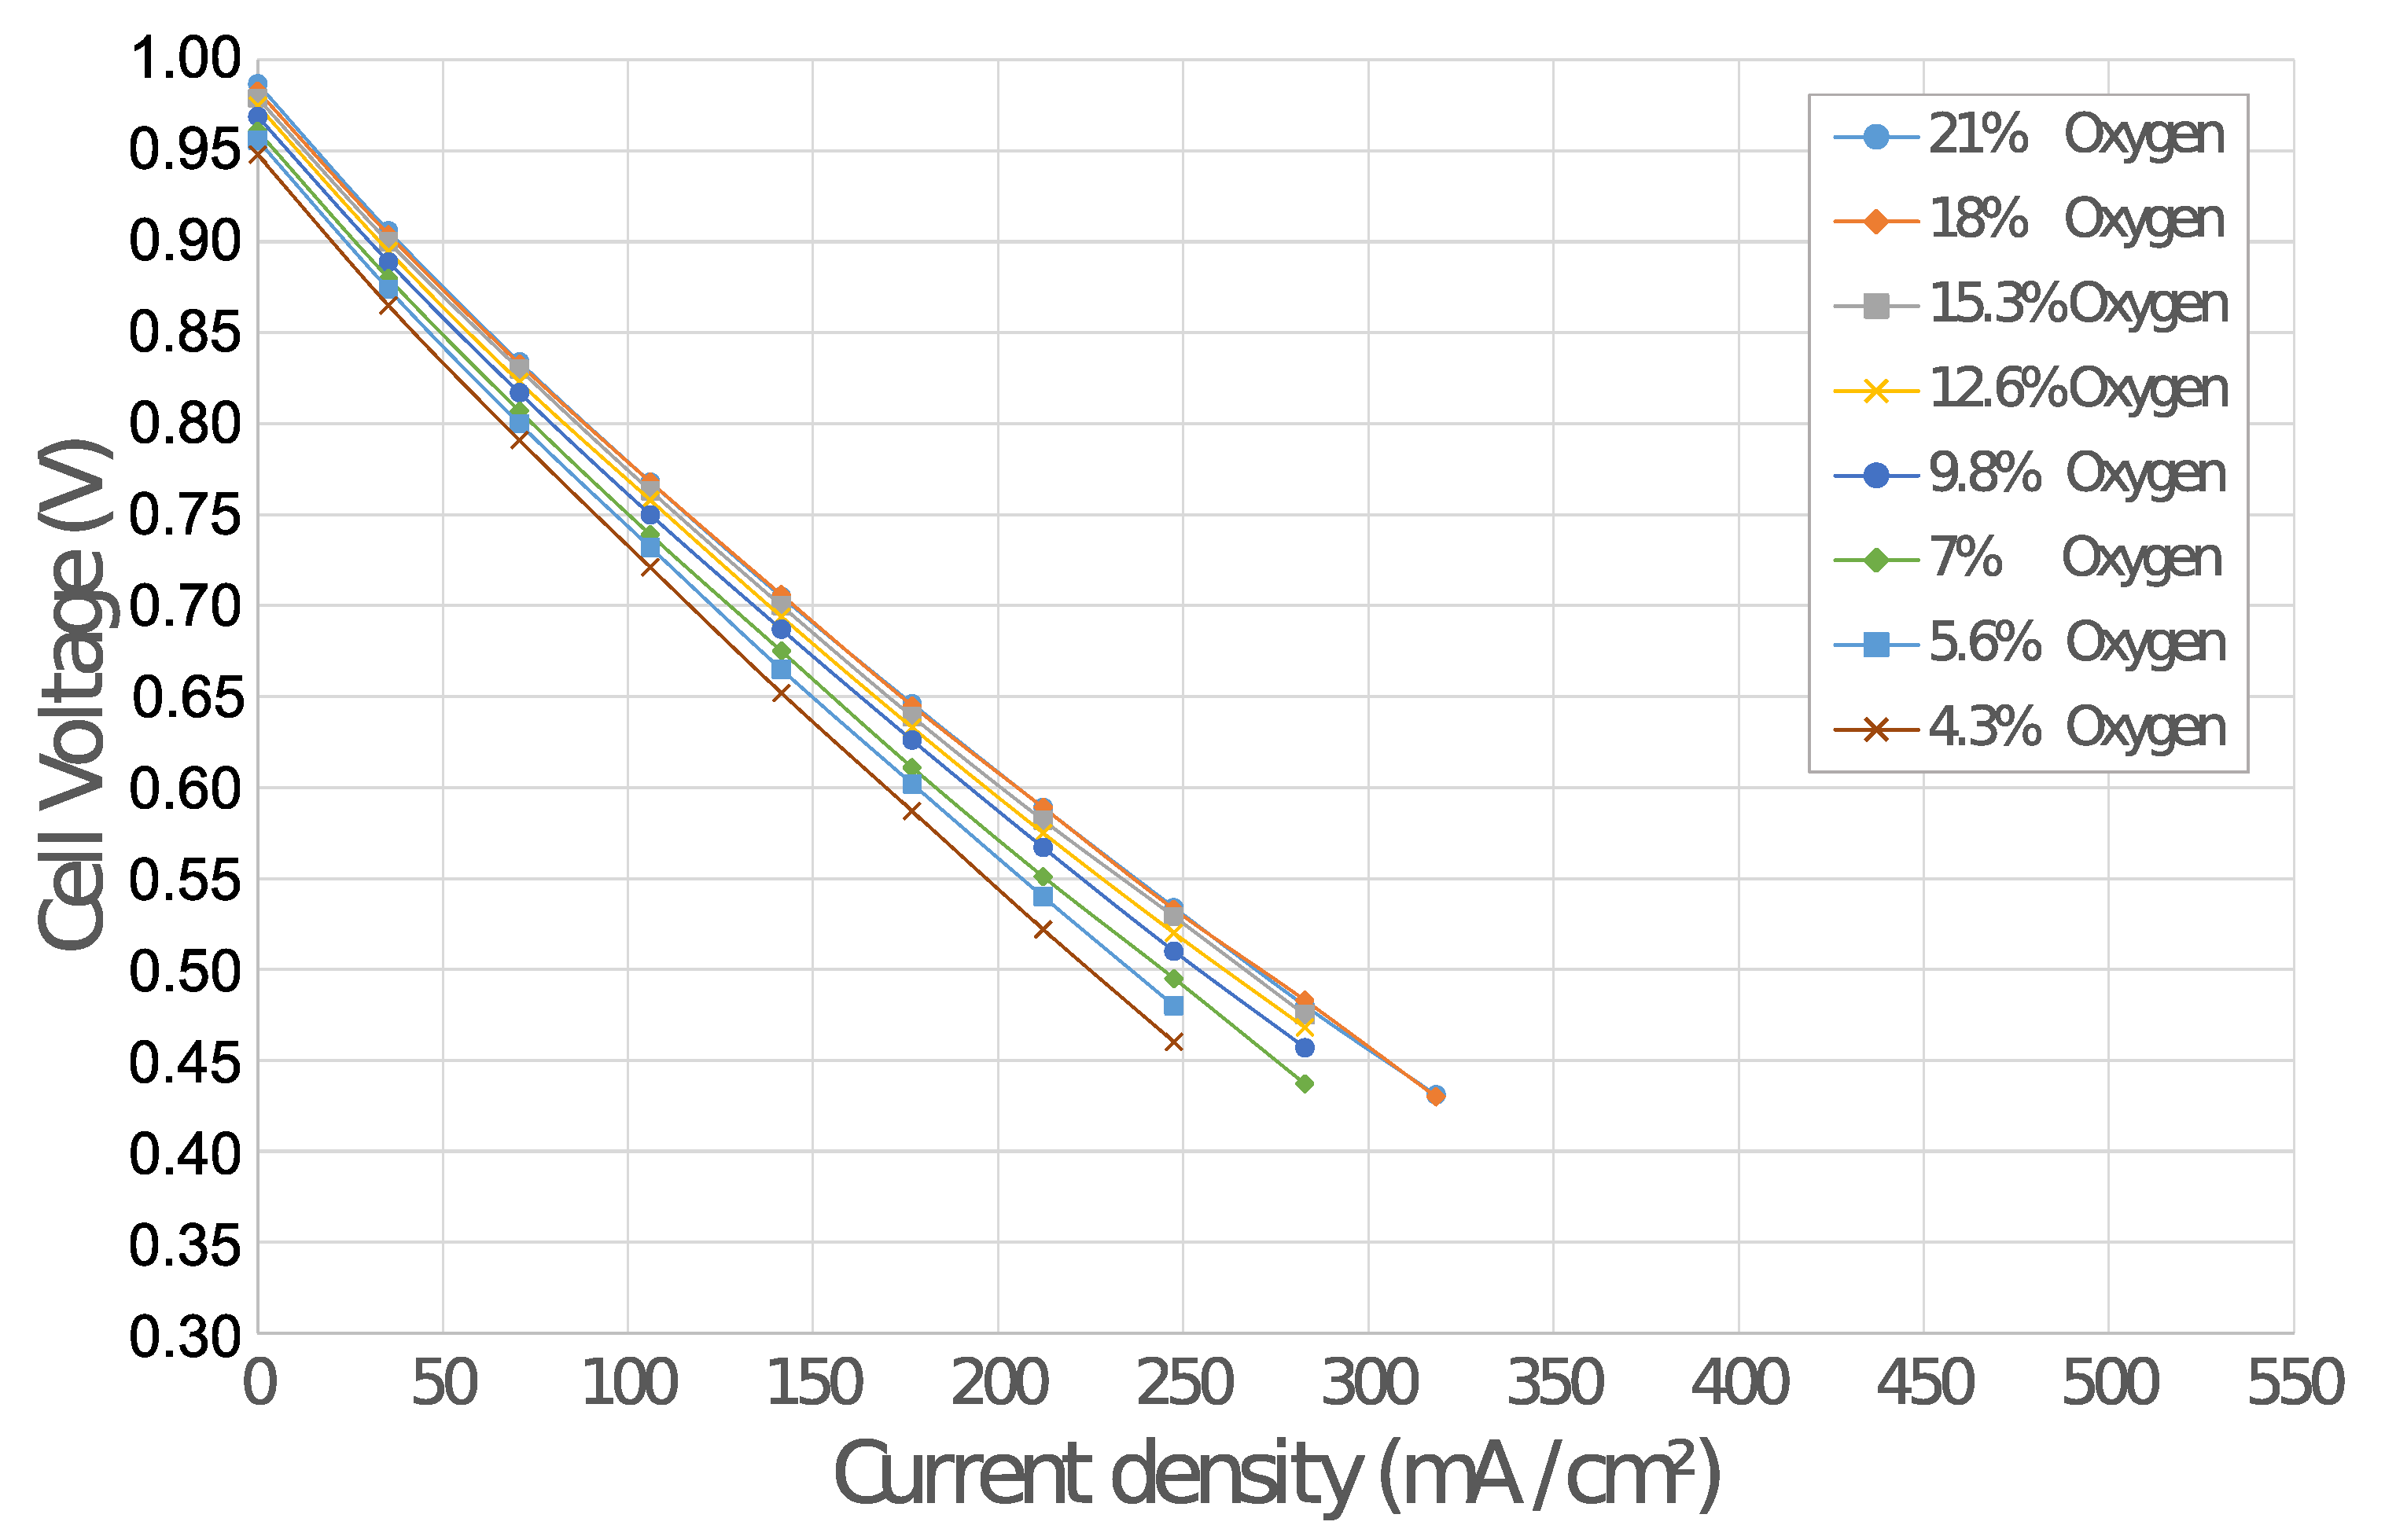
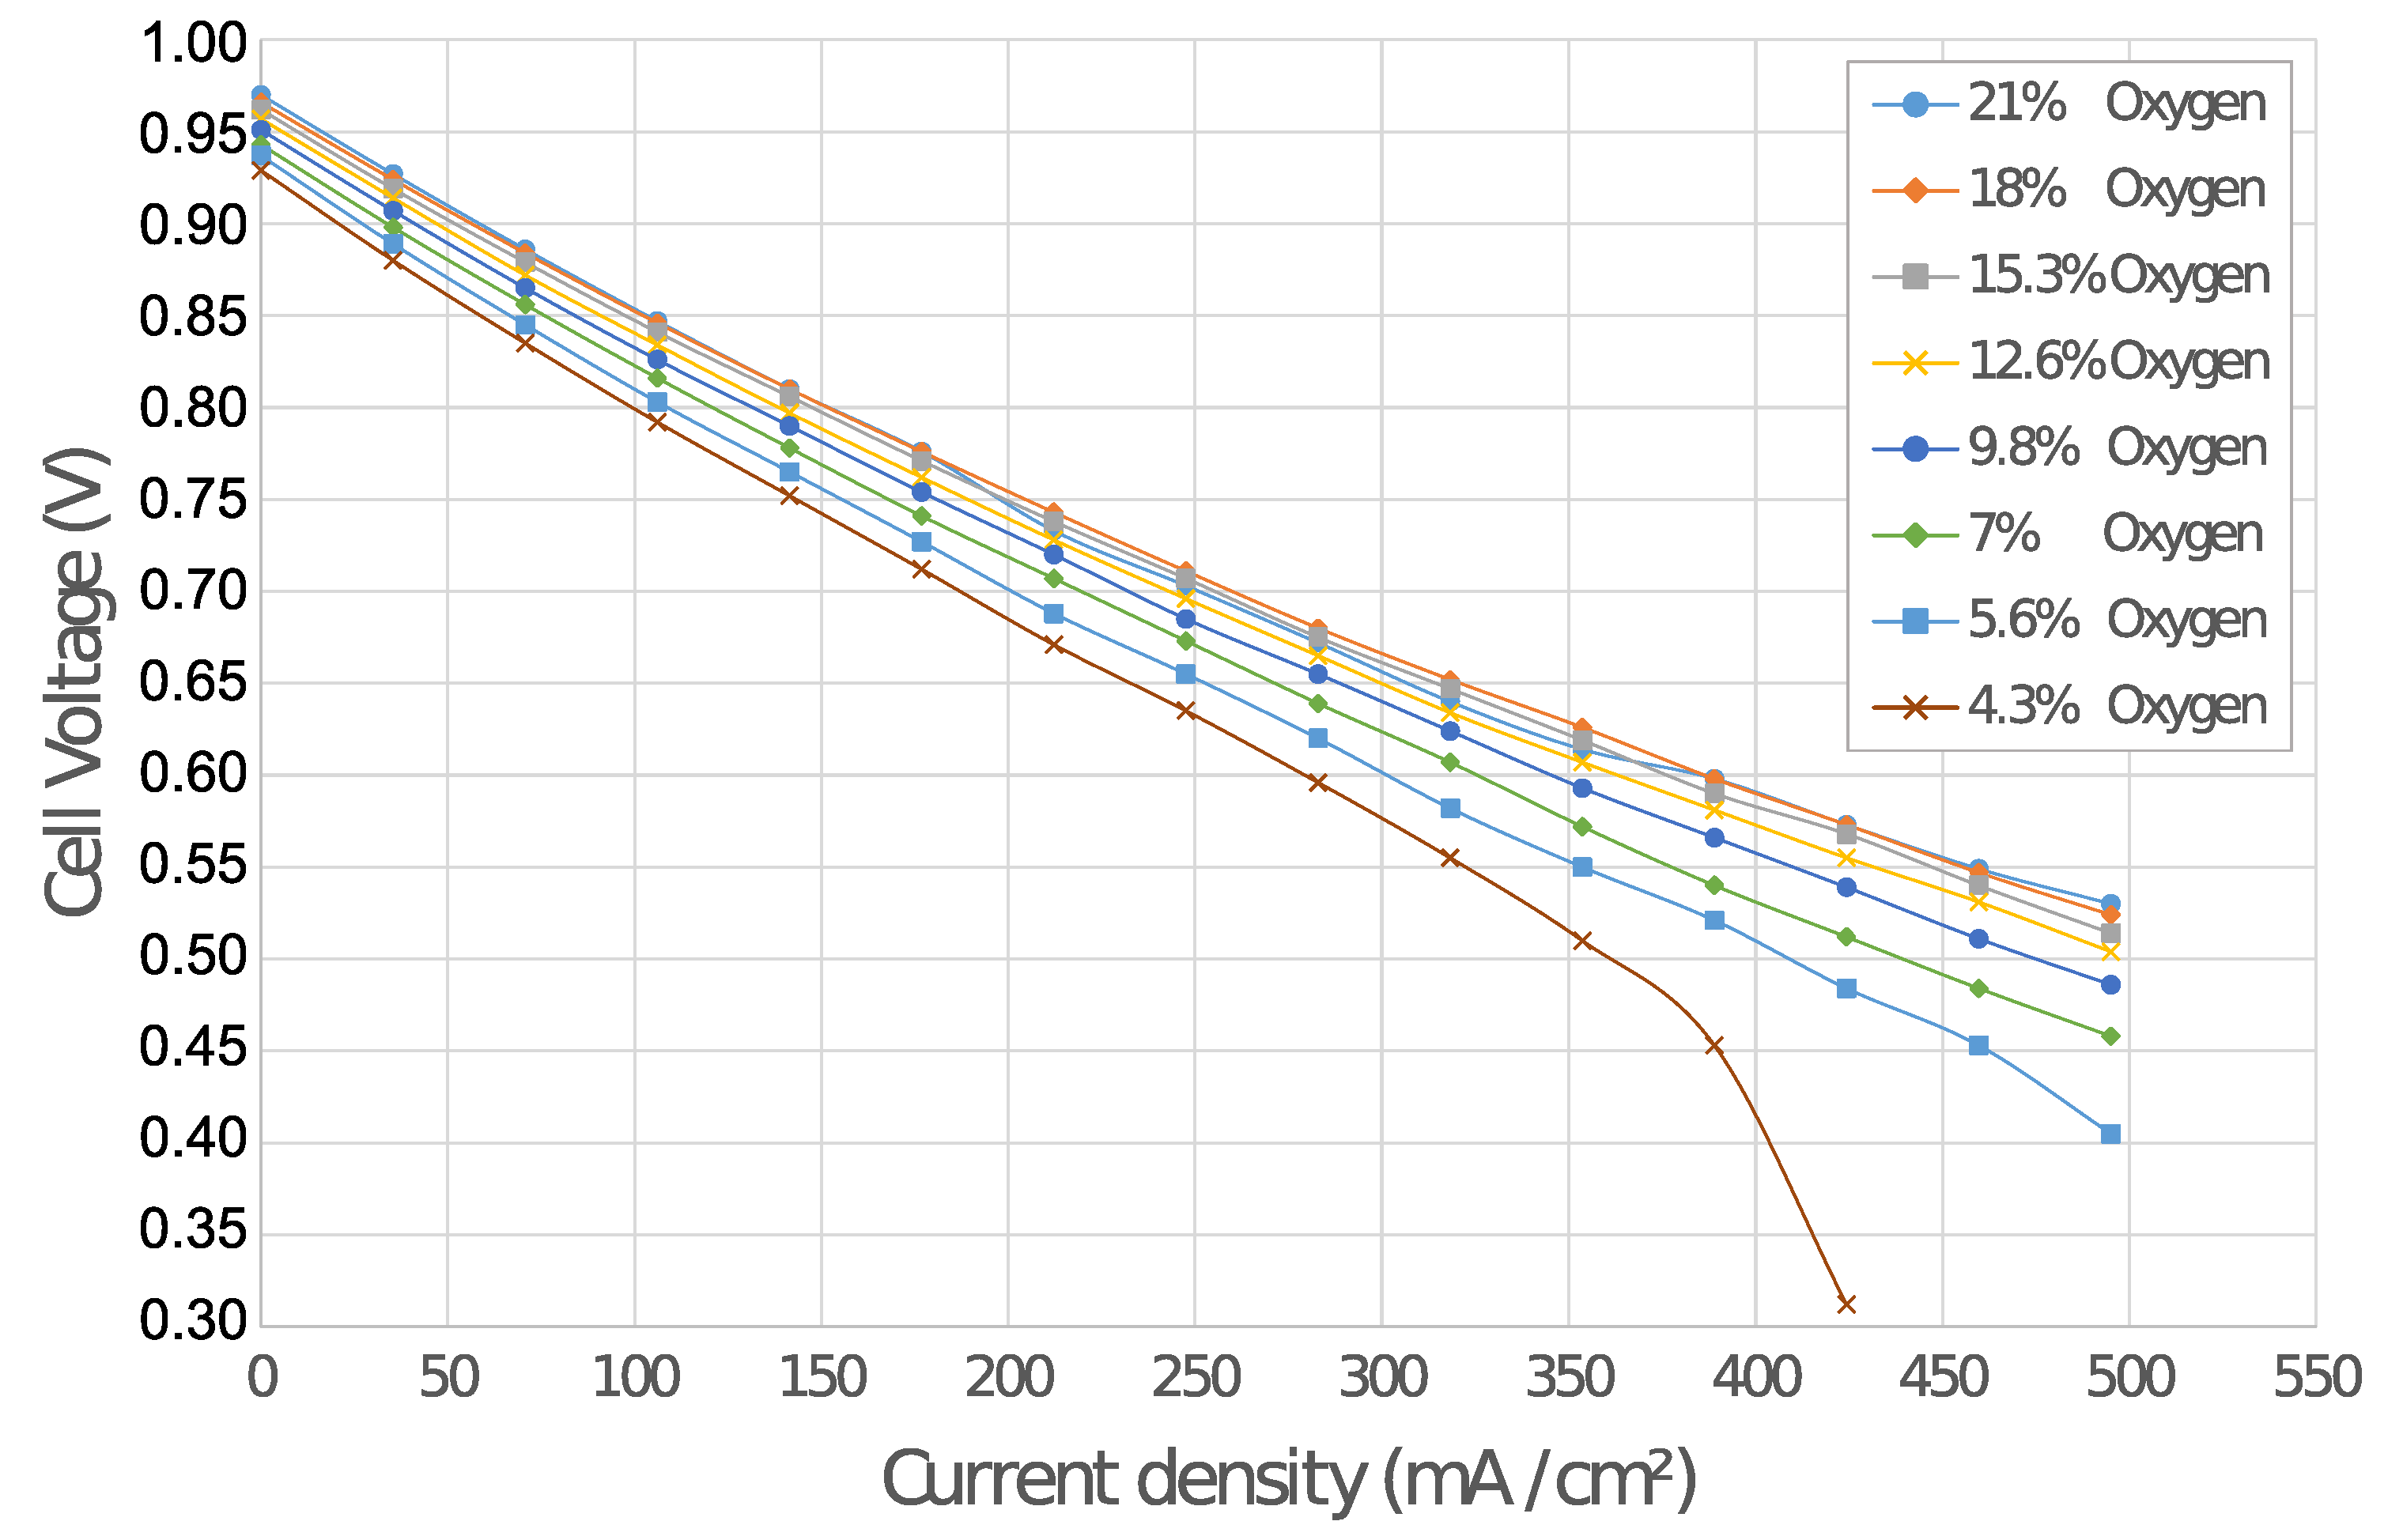
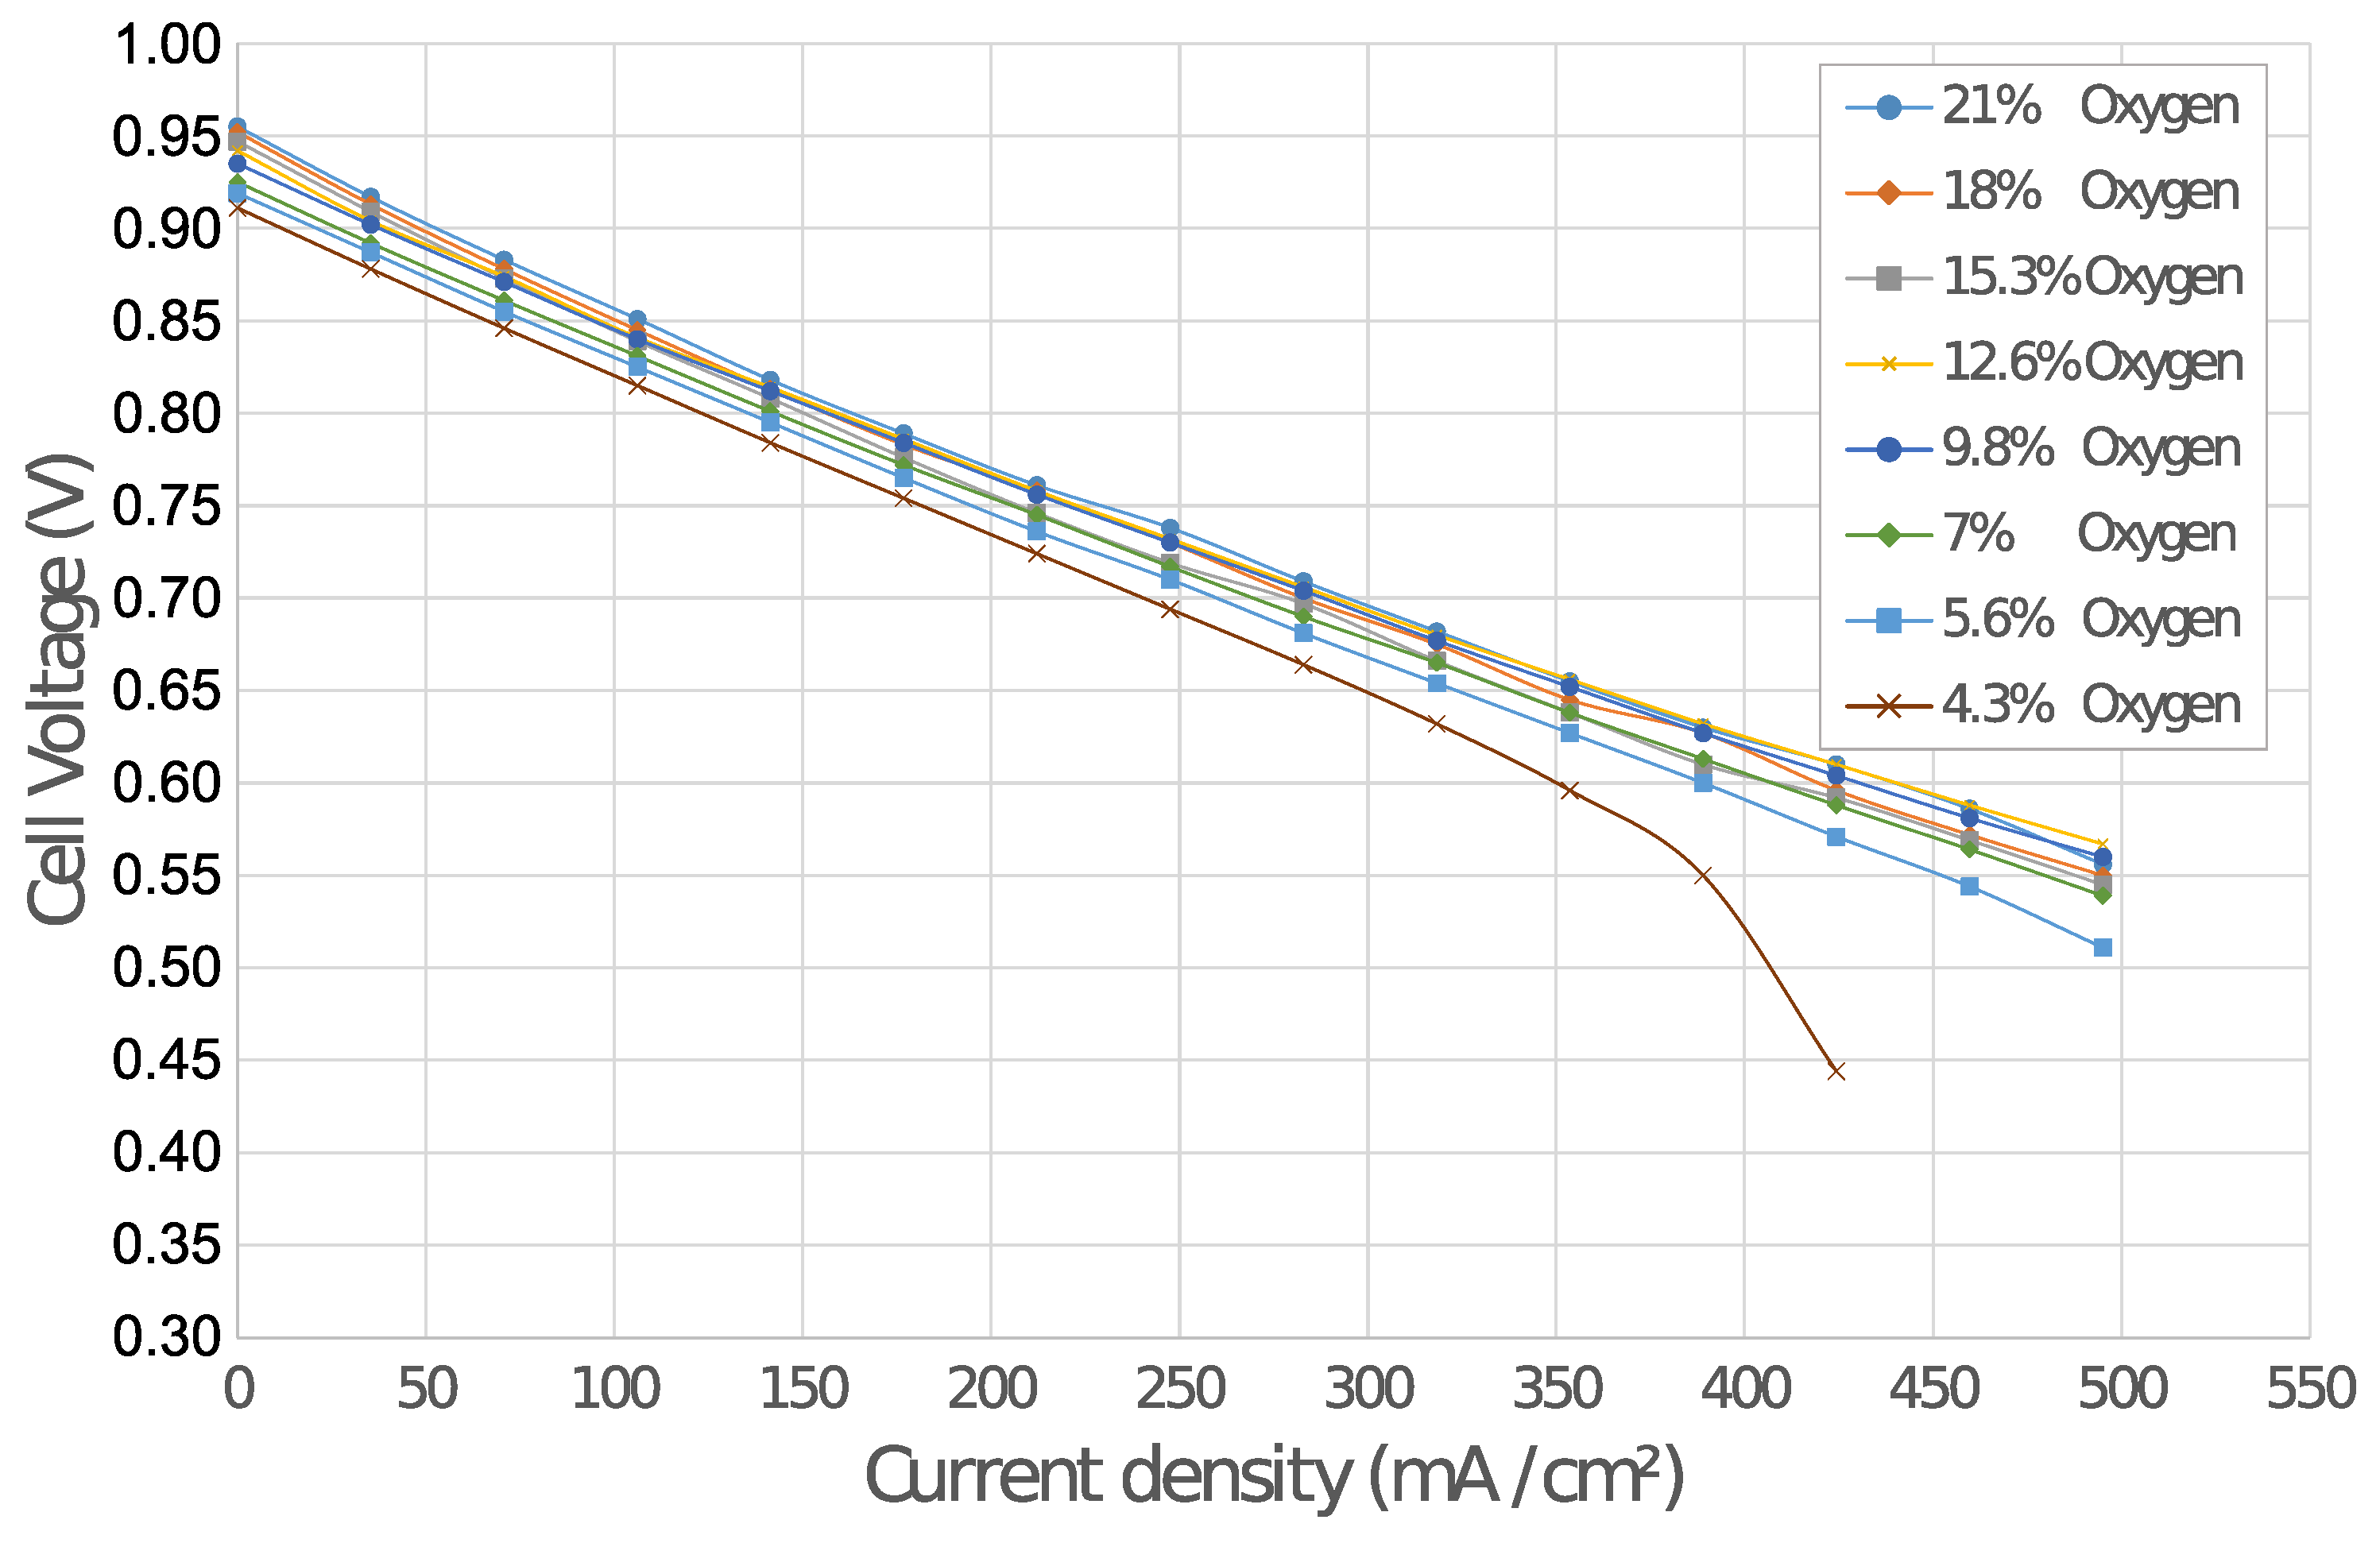
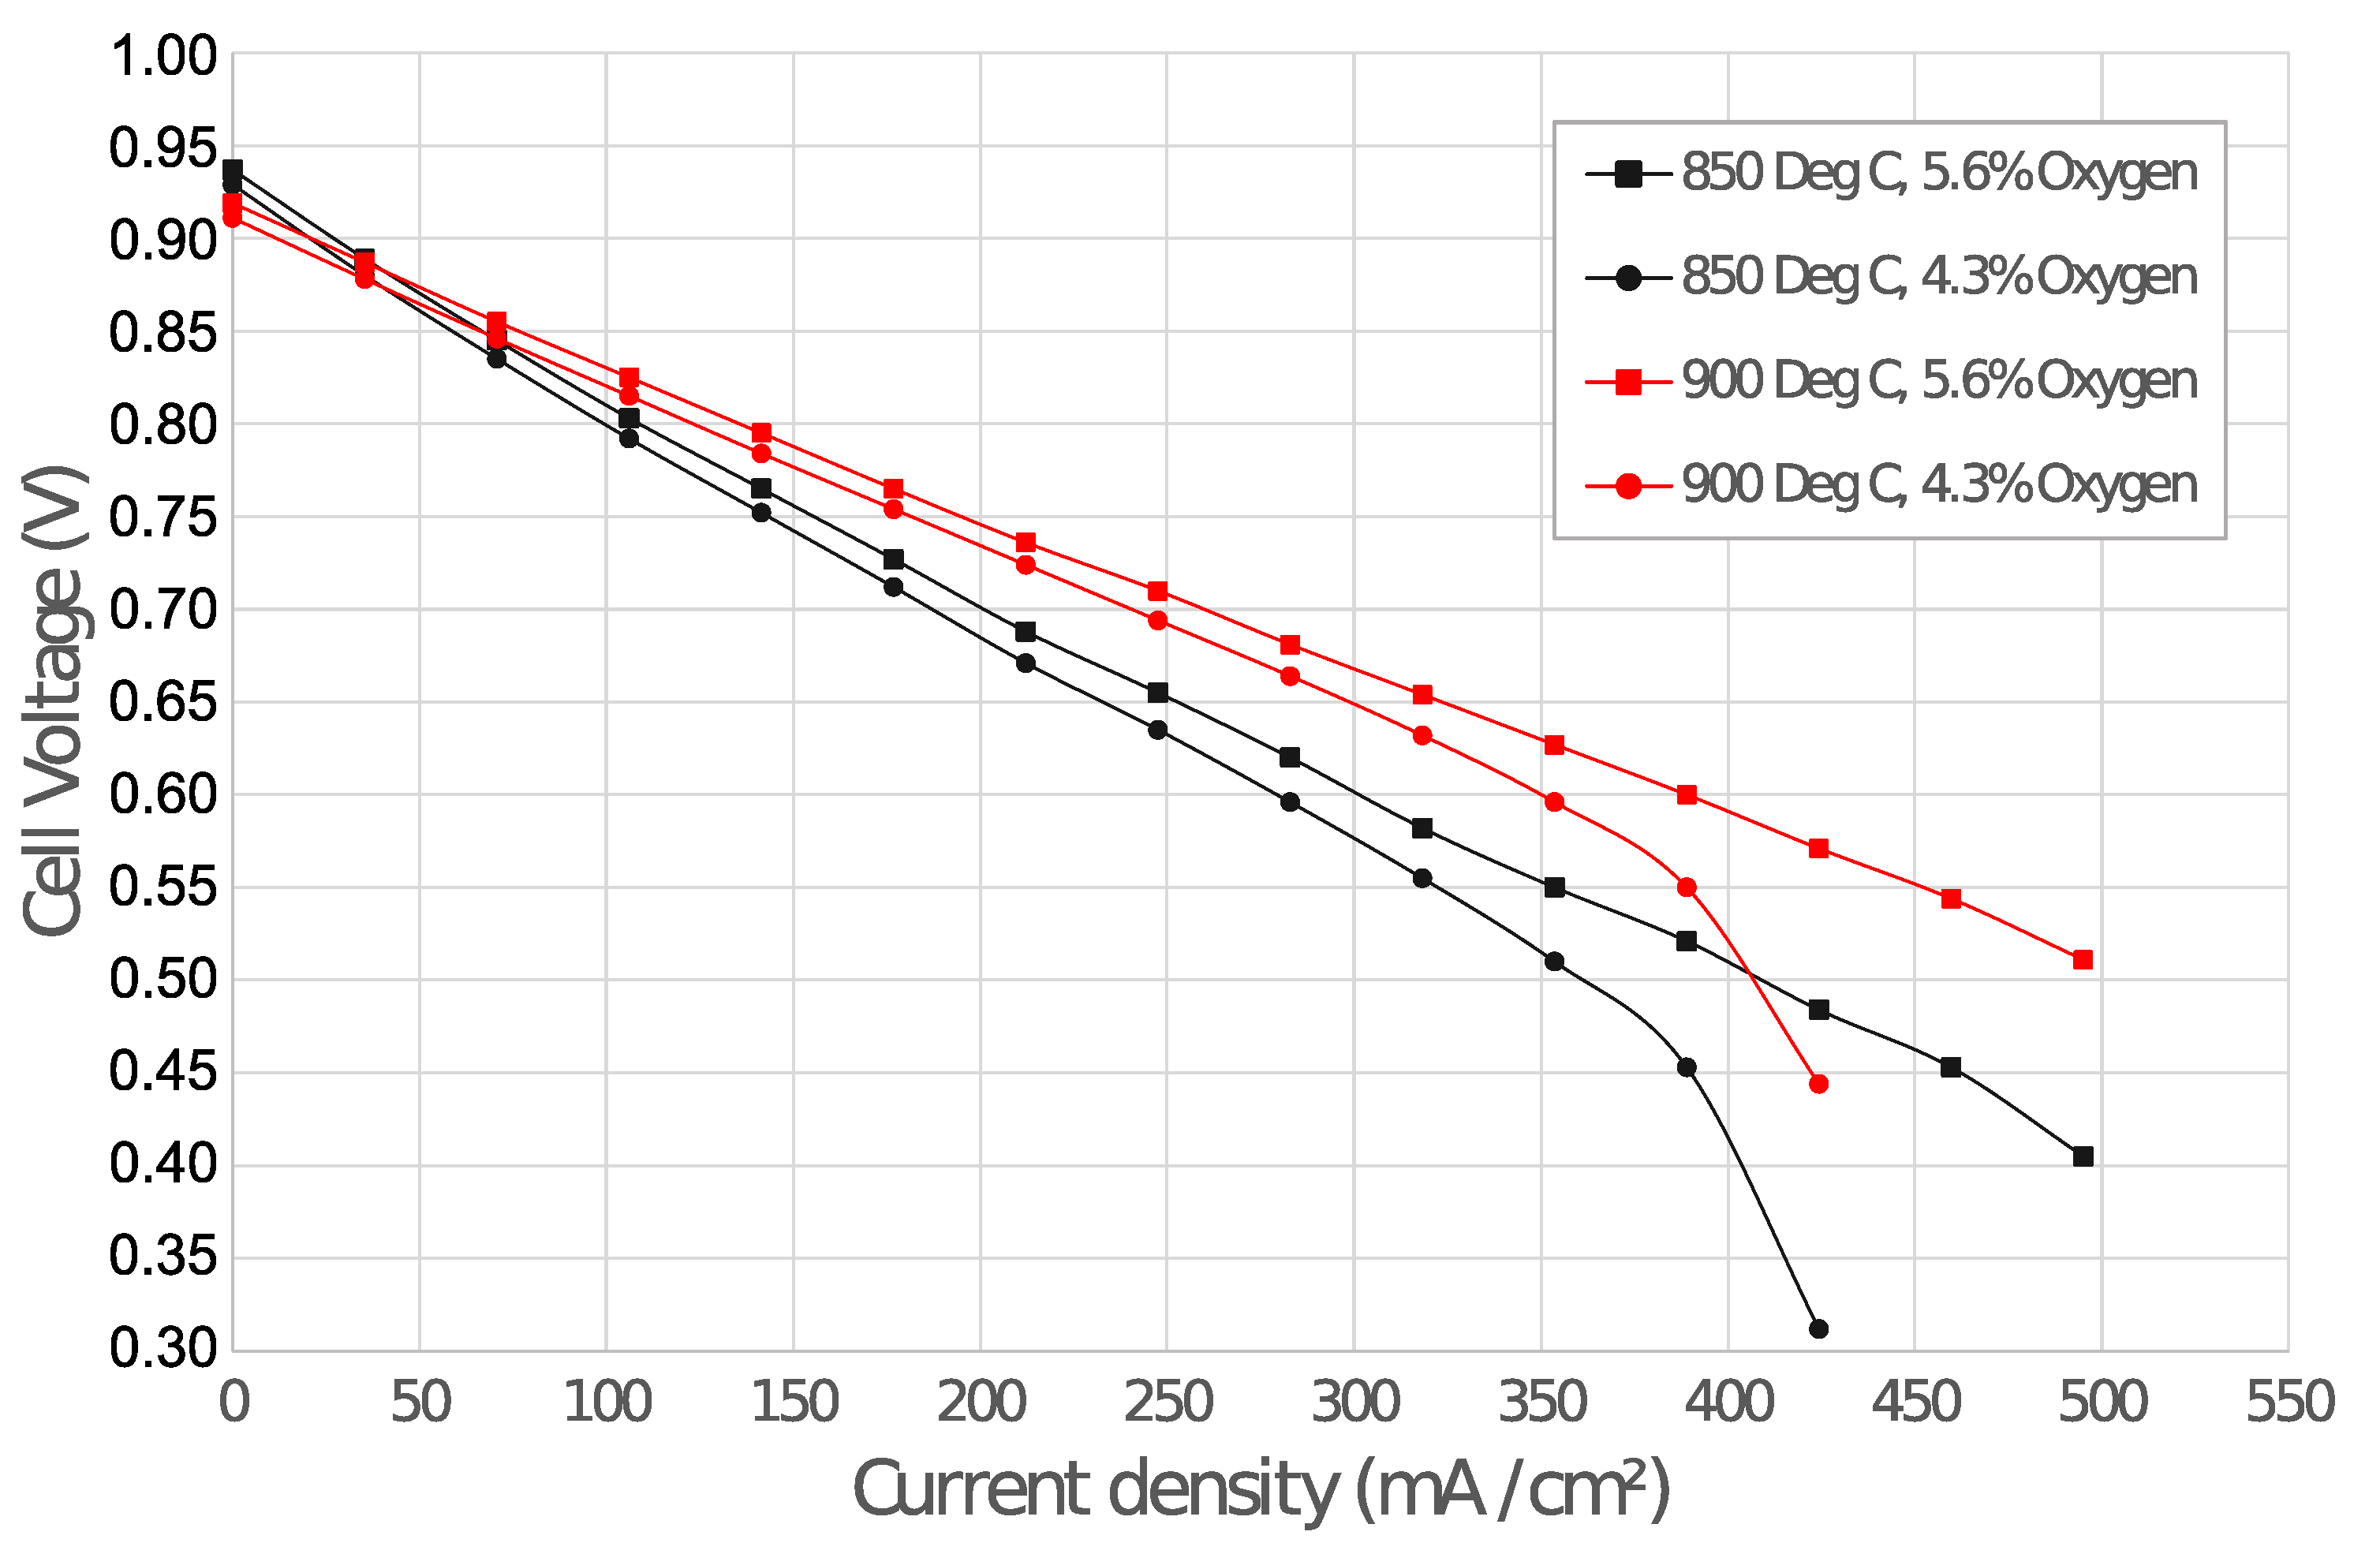
3.2. Oxygen Depletion Tests
- Characterising the open circuit voltage (OCV) of the cell to ensure that there was very little cross-leak or electronic conductivity in the electrolyte and that the components were sealed properly [17].
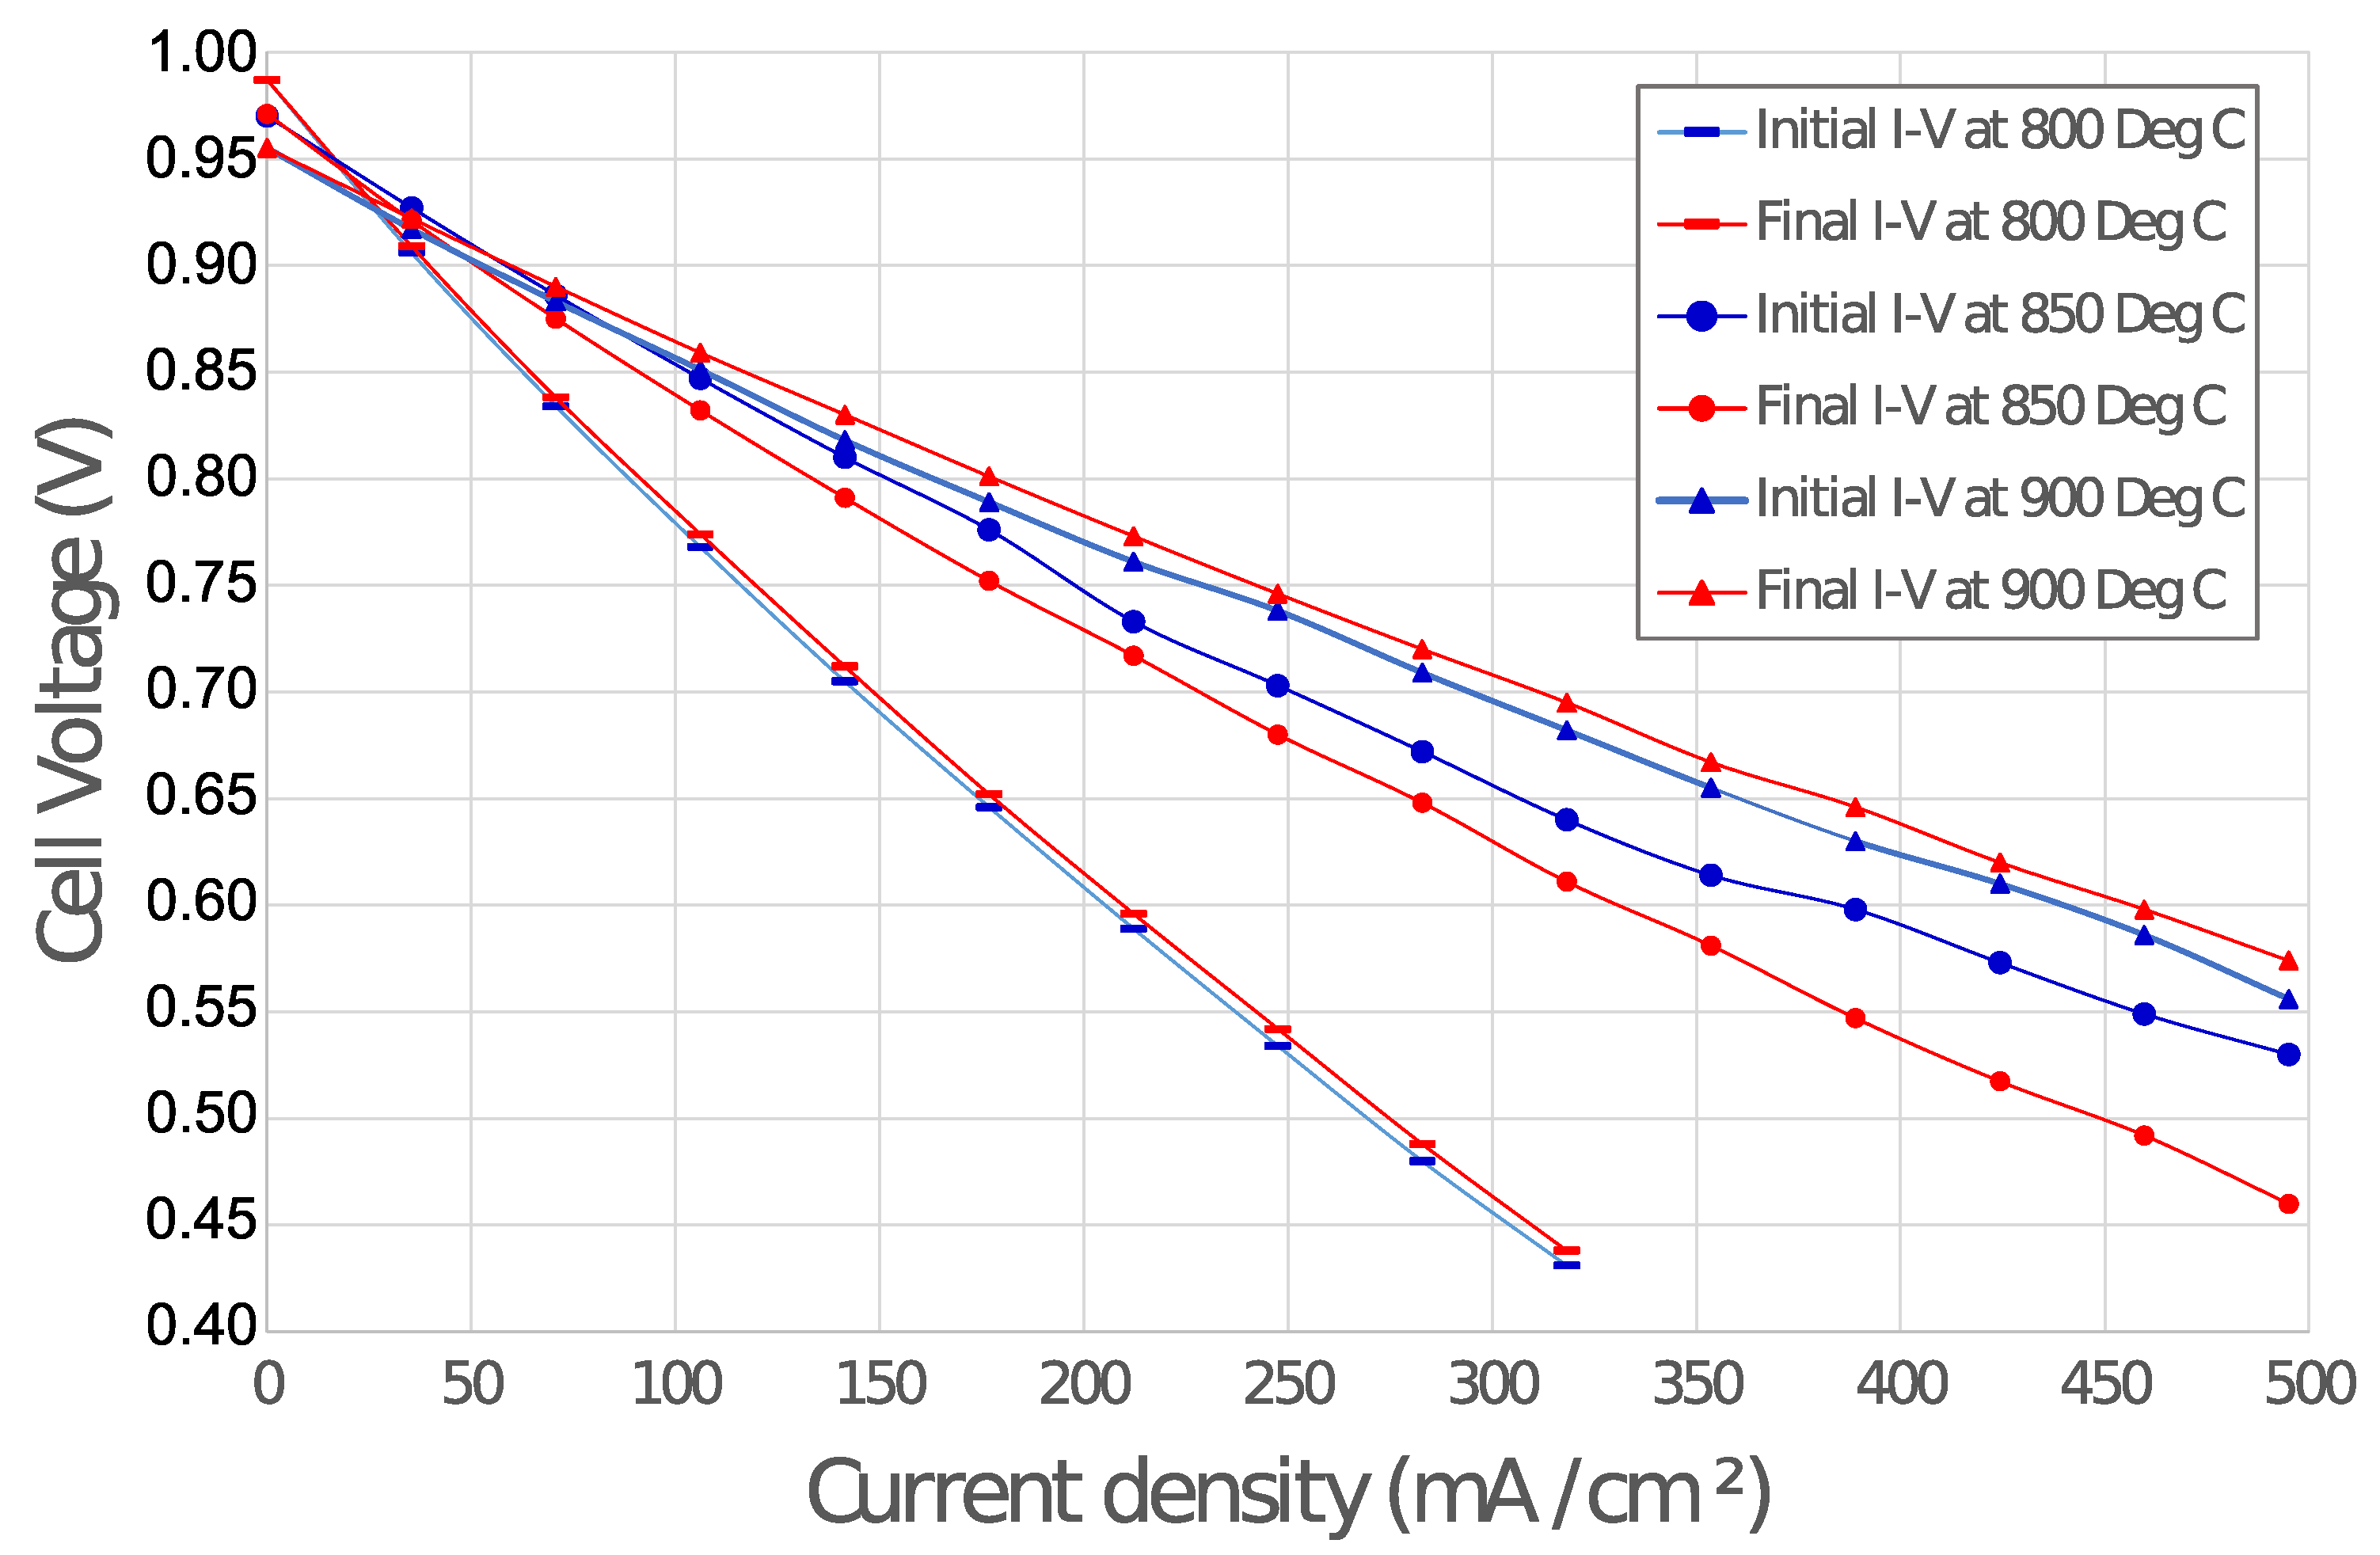
- Examining the shape of the I-V curve at a specific temperature in order to determine the amount of the polarizations: activation, ohmic and (importantly) concentration polarization at the cathode due to varying oxygen partial pressure at three temperatures (800 C, 850 C and 900 C).
- Studying the electrochemical performance of the cell at high current density and at reducing partial pressure of oxygen.
4. Further Discussion
5. Conclusions
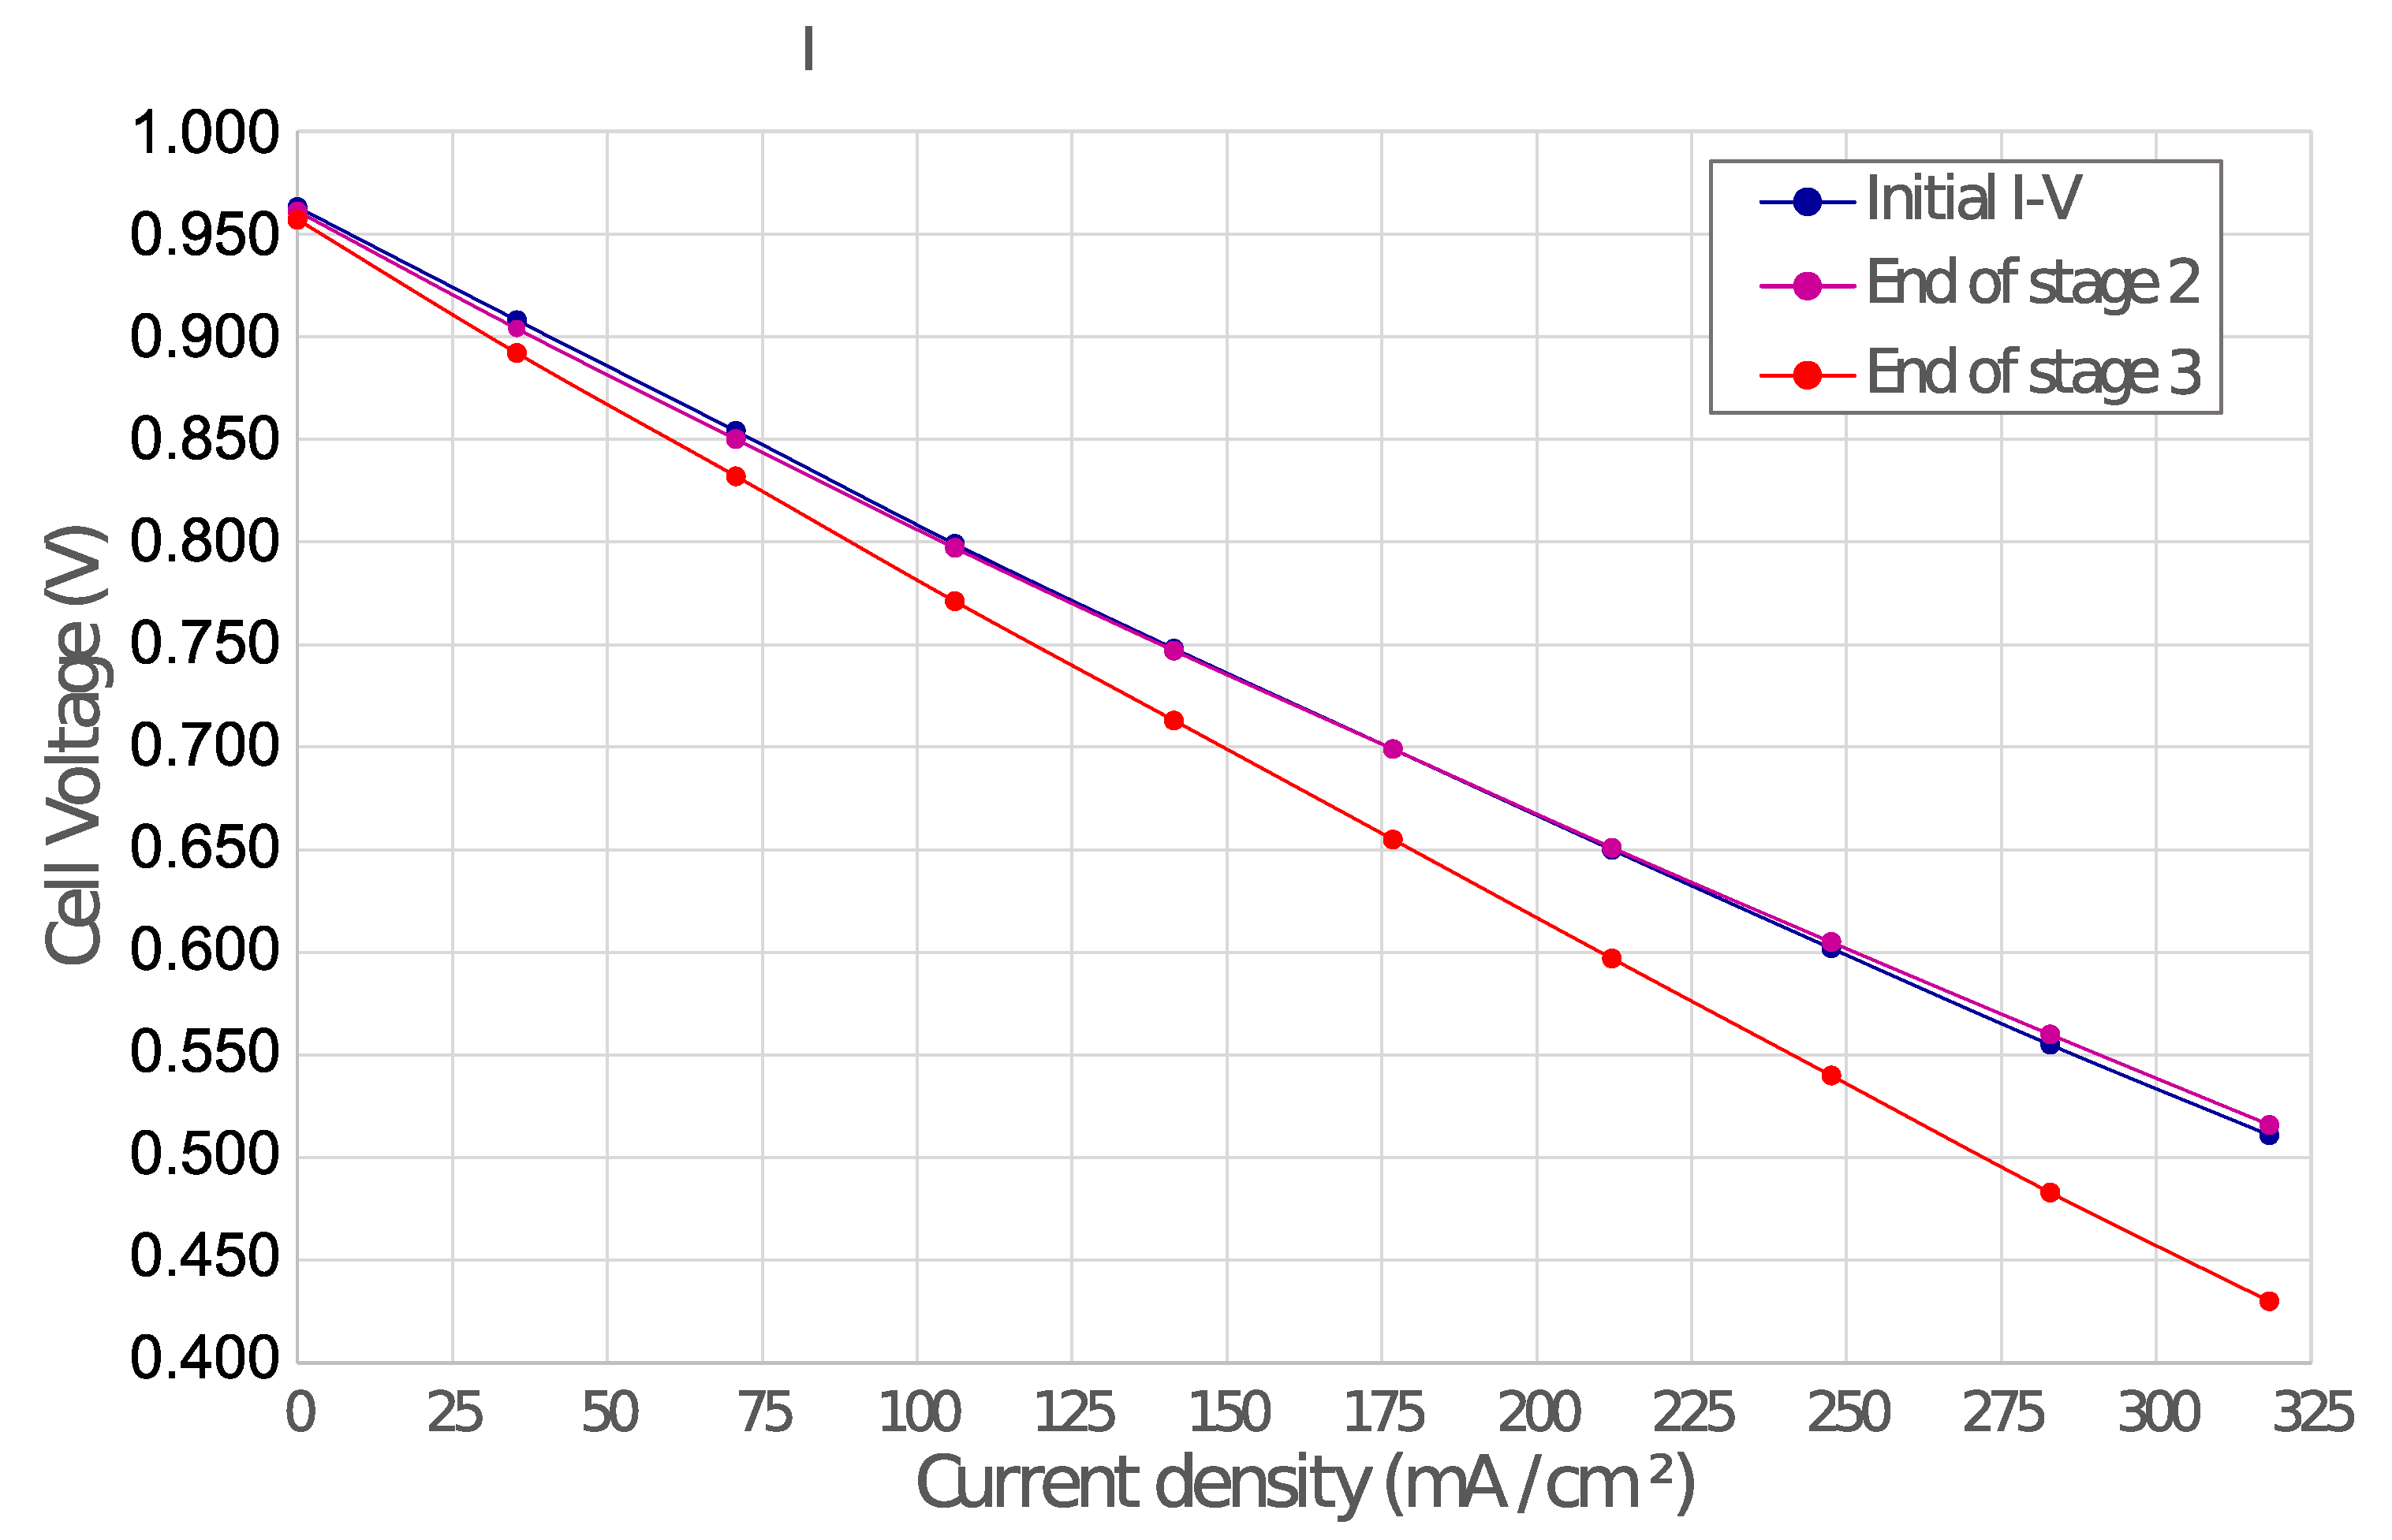
- When the experiments were conducted without any salt contamination (both short-term and long-term), the final I-V curve of the cell was very close to that of the reference I-V characteristics observed immediately after reducing the anode showing that the testing method itself did not lead to significant degradation of the cell.
- During the short-duration tests, when salt crystals were introduced at the rate of 250 ppm, there was a drop in cell voltage by 25 mV. The SEM images after operating the cell with salt contamination for about 50 h, did not show any sign of delamination, but salt is detectable in the cathode microstructure.
- During the long-duration testing, when salt was introduced at the rate of 1 ppm, a drop in cell voltage of 200 mV was seen. The SEM images show that after operating the cell with salt contamination for about 660 h, delamination had taken place. This indicates that there is a severe and irreversible degradation of the cell when salt pollutes the cathode for a long period.
- As the operating temperature of the cell is increased from 800 C to 900 C, the contribution to losses from ohmic polarization decreases. An electrolyte supported cell (YSZ) should therefore be operated at higher temperatures.
- The effect of decreasing oxygen partial pressure is more significant when the oxygen concentration is decreased below 12.6%. The fall in cell voltage at higher current densities and very low oxygen concentration indicates the development of concentration polarisation.
- While using air as an oxidant (21% ), after operating the cell at reducing partial pressure, it is observed that the cell recovers immediately and there is very little difference in cell losses after testing when compared to before. When testing at 850 C the cell was starved of oxygen to a greater extent (4% ) and in this case a significant drop in voltage due to the experimental program having been carried out was seen. The existence of a threshold low oxygen concentration, beyond which the cell appears to be damaged irreversibly, and the reason for the existence of such a threshold is worth further investigation.
Author Contributions
Funding
Acknowledgments
Conflicts of Interest
References
- Ormerod, R.M. Solid oxide fuel cells. Chem. Soc. Rev. 2003, 32, 17–28. [Google Scholar] [CrossRef]
- Nakajo, A.; Mueller, F.; Brouwer, J.; van Herle, J.; Favrat, D. Mechanical reliability and durability of SOFC stacks. Part I: Modelling of the effect of operating conditions and design alternatives on the reliability. Int. J. Hydrog. Energy 2012, 37, 9249–9268. [Google Scholar] [CrossRef] [Green Version]
- Liu, R.; Wang, D.; Jing, L.; Wang, L.; Bai, X. NaCl Effect on SOFC Cathode. In Proceedings of the International Conference on Civil, Materials and Environmental Sciences (CMES 2015), London, UK, 14–15 March 2015. [Google Scholar]
- Cayan, F.N.; Zhi, M.J.; Pakalapati, S.R.; Celik, I.; Wu, N.Q.; Gemmen, R. Effects of coal syngas impurities on anodes of solid oxide fuel cells. J. Power Sources 2008, 185, 595–602. [Google Scholar] [CrossRef]
- Bao, J.; Krishnan, G.N.; Jayaweera, P.; Perez-Mariano, J.; Sanjurjo, A. Effect of various coal contaminants on the performance of solid oxide fuel cells: Part I. Accelerated testing. J. Power Sources 2009, 193, 607–616. [Google Scholar] [CrossRef]
- Cheng, Z.; Zha, S.W.; Liu, M.L. Influence of cell voltage and current on sulfur poisoning behavior of solid oxide fuel cells. J. Power Sources 2007, 172, 688–693. [Google Scholar] [CrossRef]
- Haga, K.; Adachi, S.; Shiratori, Y.; Itoh, K.; Sasaki, K. Poisoning of SOFC anodes by various fuel impurities. Solid State Ion. 2008, 179, 1427–1431. [Google Scholar] [CrossRef]
- Horita, T.; Kishimoto, H.; Yamaji, K.; Brito, M.E.; Xiong, Y.P.; Yokokawa, H.; Hori, Y.; Miyachi, I. Effects of impurities on the degradation and long-term stability for solid oxide fuel cells. J. Power Sources 2009, 193, 194–198. [Google Scholar] [CrossRef]
- Yan, M.; Fu, P.; Chen, Q.Y.; Wang, Q.W.; Zeng, M.; Pandit, J. Electrical Performance and Carbon Deposition Differences between the Bi-Layer Interconnector and Conventional Straight Interconnector Solid Oxide Fuel Cell. Energies 2014, 7, 4601–4613. [Google Scholar] [CrossRef] [Green Version]
- Xiong, Y.P.; Yamaji, K.; Horita, T.; Yokokawa, H.; Akikusa, J.; Eto, H.; Inagaki, T. Sulfur poisoning of SOFC cathodes. J. Electrochem. Soc. 2009, 156, B588–B592. [Google Scholar] [CrossRef]
- Mikkola, M.S.; Rockward, T.; Uribe, F.A.; Pivovar, B.S. The effect of NaCl in the cathode air stream on PEMFC performance. Fuel Cells 2007, 7, 153–158. [Google Scholar] [CrossRef]
- Rotureau, D.; Viricelle, J.P.; Pijolat, C.; Caillol, N.; Pijolat, M. Development of a planar SOFC device using screen-printing technology. J. Eur. Ceram. Soc. 2005, 25, 2633–2636. [Google Scholar] [CrossRef]
- Hildenbrand, N.; Boukamp, B.A.; Nammensma, P.; Blank, D.H. Improved cathode/electrolyte interface of SOFC. Solid State Ion. 2011, 192, 12–15. [Google Scholar] [CrossRef]
- Goodhew, P.J.; Humphreys, J.; Beanland, R. Electron Microscopy and Analysis; CRC Press: Boca Raton, FL, USA, 2000. [Google Scholar]
- Thambiraj, N.; Suciu, C.; Waernhus, I.; Vik, A.; Hoffmann, A.C. SOFC cathode degradation due to salt contamination. ECS Trans. 2017, 78, 915–925. [Google Scholar] [CrossRef]
- Suciu, C.; Hoffmann, A.C.; Dorolti, E.; Tetean, R. NiO/YSZ nanoparticles obtained by new sol-gel route. Chem. Eng. J. 2008, 140, 586–592. [Google Scholar] [CrossRef]
- Waldbillig, D.; Wood, A.; Ivey, D.G. Electrochemical and microstructural characterization of the redox tolerance of solid oxide fuel cell anodes. J. Power Sources 2005, 145, 206–215. [Google Scholar] [CrossRef]
- Yonekura, T.; Tachikawa, Y.; Yoshizumi, T.; Shiratori, Y.; Ito, K.; Sasaki, K. Exchange Current Density of Solid Oxide Fuel Cell Electrodes. ECS Trans. 2011, 35, 1007–1014. [Google Scholar]
- Bevc, F. Advances in solid oxide fuel cells and integrated power plants. Proc. Inst. Mech. Eng. Part A: J. Power Energy 1997, 211, 359–366. [Google Scholar] [CrossRef]
- Shekhawat, D., II; Spivey, J.J.; Berry, D.A. Fuel Cells: Technologies for Fuel Processing: Technologies for Fuel Processing; Elsevier: Amsterdam, The Netherlands, 2011. [Google Scholar]
- Sasaki, K.; Tamura, J.; Hosoda, H.; Lan, T.N.; Yasumoto, K.; Dokiya, M. Pt–perovskite cermet cathode for reduced-temperature SOFCs. Solid State Ion. 2002, 148, 259–271. [Google Scholar] [CrossRef]
- Tietz, F. Peculiarities in the thermal expansion behavior of ceramic fuel cell materials. In Advances in Science and Technology; Techna: Faenza, Italy, 1999; pp. 61–70. [Google Scholar]


| Cathode: | Air | 600 mL/min | 0 mL/min | |
| Anode: | 250 mL/min | 75 mL/min |
| pt. | B-K | C-K | O-K | Na-K | Al-K | Ca-K | Sc-K | Mn-K | Ni-K | Sr-L | Zr-L | La-L |
|---|---|---|---|---|---|---|---|---|---|---|---|---|
| 1 | 7.77 | 7.47 | 0.00 | 15.76 | 3.75 | 45.36 | 8.50 | 11.38 | ||||
| 2 | 1.85 | 11.67 | 0.25 | 1.90 | 0.32 | 28.72 | 5.30 | 7.66 | 42.33 | |||
| 3 | 1.36 | 10.66 | 0.26 | 0.45 | 0.27 | 30.36 | 4.04 | 7.77 | 44.82 | |||
| 4 | 1.56 | 13.64 | 0.44 | 30.16 | 1.23 | 8.89 | 30.26 | |||||
| 6 | 2.03 | 17.86 | 0.91 | 28.66 | 8.99 | 42.04 | ||||||
| 7 | 0.65 | 2.47 | 27.27 | 0.30 | 3.55 | 12.36 | 2.64 | 34.78 | 15.99 | |||
| 8 | 0.85 | 2.88 | 29.39 | 0.28 | 2.83 | 10.94 | 0.64 | 2.05 | 34.99 | 15.15 |
© 2020 by the authors. Licensee MDPI, Basel, Switzerland. This article is an open access article distributed under the terms and conditions of the Creative Commons Attribution (CC BY) license (http://creativecommons.org/licenses/by/4.0/).
Share and Cite
Thambiraj, N.; Waernhus, I.; Suciu, C.; Vik, A.; Hoffmann, A.C. Single-Cell Tests to Explore the Reliability of Sofc Installations Operating Offshore. Energies 2020, 13, 1624. https://doi.org/10.3390/en13071624
Thambiraj N, Waernhus I, Suciu C, Vik A, Hoffmann AC. Single-Cell Tests to Explore the Reliability of Sofc Installations Operating Offshore. Energies. 2020; 13(7):1624. https://doi.org/10.3390/en13071624
Chicago/Turabian StyleThambiraj, Nelson, Ivar Waernhus, Crina Suciu, Arild Vik, and Alex C. Hoffmann. 2020. "Single-Cell Tests to Explore the Reliability of Sofc Installations Operating Offshore" Energies 13, no. 7: 1624. https://doi.org/10.3390/en13071624
APA StyleThambiraj, N., Waernhus, I., Suciu, C., Vik, A., & Hoffmann, A. C. (2020). Single-Cell Tests to Explore the Reliability of Sofc Installations Operating Offshore. Energies, 13(7), 1624. https://doi.org/10.3390/en13071624