Abstract
The city of Stockholm is close to hitting the capacity limits of its power grid. As an additional challenge, electricity has been identified as a key resource to help the city to meet its environmental targets. This has pushed citizens to prefer power-based technologies, like heat pumps and electric vehicles, thus endangering the stability of the grid. The focus of this paper is on the district of Hammarby Sjöstad. Here, plans are set to switch from district heating to heat pumps. A previous study verified that this choice will cause overloadings on the electricity distribution grid. The present paper tackles this problem by proposing a new energy storage option. By considering the increasing share of electric vehicles, the potential of using the electricity stored in their batteries to support the grid is explored through technical performance simulations. The objective was to enable a bi-directional flow and use the electric vehicles’ (EVs)’ discharging to shave the peak demand caused by the heat pumps. It was found that this solution can eliminate overloadings up to 50%, with a 100% EV penetration. To overcome the mismatch between the availability of EVs and the overloadings’ occurrence, the minimum state of charge for discharging should be lower than 70%.
1. Introduction
Sweden has adopted the ambitious goal of becoming a zero carbon emission society by 2045 [1]. Within this context, the energy sector has attracted a special attention because it accounts for more than 70% (including transport) of total greenhouse gas emissions [2]. When looking at the internal electricity mix of this country [3,4], electricity is promoted as a clean resource and thus a promising option to achieve the 2045 target. As a consequence, in Stockholm, citizen-driven initiatives work to promote the installation of distributed residential heat pumps (HPs) and the adoption of electric vehicles (EVs) [5]. A real example is represented by Hammarby Sjöstad, which is a residential neighborhood constituted by multi-apartment buildings. This district is currently connected to the city’s district heating (DH) network, but projects are already approved for some customers to switch to their own domestic HP.
On an opposite side, this electrification trend is challenged by a structural problem that impacts the power grid system in Stockholm. In fact, the electricity transmission to the city is close to its maximum power capacity. This means that the distribution system operators (DSOs) are being forced to impose power limits on the distribution grid [6]. Thus, the connection of new loads, like HPs and EVs, could soon be impossible. If capacity expansion investments are to be avoided or delayed, alternative solutions should be quickly found.
A promising option is offered by energy storage [7]. This technology can shift loads in time by charging when surplus energy supply is available and discharging during periods of peak demand. This can be done on both the heat and on the electricity sides, depending on the type of energy storage technology used.
For this paper, the focus was set on the electric power side by considering the electricity storage potential in the batteries of EVs. In this context, an EV is regarded not only as a load to the power grid but also as an extended capacity for supply. This is based on the vehicle-to-grid (V2G) concept. V2G technology enables a bi-directional flow between an EV’s battery and the grid [8,9,10,11]. Thus, both the charging and discharging of electrical energy are allowed.
The background of this study was linked to a real initiative called “Charge at Home” (“Ladda Hemma” in the original Swedish). Within this context, several housing associations in Hammarby Sjöstad were encouraged and assisted in the process of installing EV charging infrastructures in their buildings. The study presented in this paper explores the potential of enabling a V2G bi-directional flow at these stations. By assuming that distributed domestic HPs are installed in Hammarby Sjöstad, the objective was to use the electricity stored in the EVs’ batteries to cover the peak power demand generated by these HPs. The main challenges were the availability of EVs parked at the stations and the level of charge of their batteries.
The importance of this study was stressed by a previous assessment that the installation of distributed HPs in Hammarby Sjöstad will cause overloadings on the local electricity distribution grid [12]. This was found by assuming that DSOs would impose a maximum loading limit equal to 100% for each grid’s cable. The possibility of using the thermal mass of the buildings as thermal energy storage (TES) by controlling the thermostats of the apartments was also studied. Despite the implementation of this solution, grid overloadings were still detected. The present work builds on this last outcome by verifying how much V2G technology can further contribute to balance grid overloadings.
Several papers have analyzed the possibility of using V2G for peak shaving and avoiding grid upgrades. Most of them [13,14,15,16,17,18] proposed optimal control algorithms by looking at costs and emissions. Some of them also took battery degradation [19,20], market composition [21], and incentives [22] into account. The studies of [23,24] combined the capacity provision market with the spinning reserve. The authors of [25] showed the advantage of combining a V2G peak shaving strategy with a domestic battery and a photovoltaic (PV) system.
Despite the broad perspective, none of these papers considered the potential synergies and impacts between the power, transport, and heating sectors.
The authors of [26] implemented V2G with a time-of-use tariff. This study also showed the impact of considering the indoor temperature of buildings as a constraint on the supply dispatch of a micro-grid. However, their perspective was limited to one building.
The energy hub presented in [27] included the heating and cooling demands of a residential community. How the implementation of V2G can impact electricity and cooling prices was shown. However, impact and synergies among these energy carries were not considered from a technical standpoint.
Given these literature gaps, one objective of this paper was to propose a district-level perspective on potential synergies among the heating, electricity, and transport sectors. To approach this sector-coupling problem, the co-simulations of dedicated models [12,28] and stochastic profiles were combined. Thus, the technical performances of technologies belonging to these different sectors were linked.
Here, the focus was on the case of a multi-apartments neighborhood located in Stockholm, Hammarby Sjöstad. By taking into account that distributed HPs can overload the local grid (reference scenario from [12] as a main objective, this paper aimed at estimating the potential of V2G to alleviate this problem (V2G integration scenario). This was done by using the energy stored in the EV’s batteries to shave the HPs’ peak power demand.
2. Case Study
The case study presented in this paper corresponded to a specific area in Hammarby Sjöstad, as shown in Figure 1. All the buildings in this area are connected to a single medium-to-low voltage transformer substation. The conceptual illustration of the case study area in Figure 1 sketches the current type of energy infrastructure in the neighborhood. The multi-apartment buildings are connected to a DH network for space heating and domestic hot water purposes. The installed capacity is about 1.2 MW for a total of 94,555 m2 of heated area. Electricity is provided by a low voltage distribution grid (400 V) that covers a capacity of about 1.6 MW.

Figure 1.
The case study area: a conceptual illustration and a satellite view BB: building block; DH: district heating.
Within the scope of the scenarios later described in Section 3, the buildings are grouped in 22 building blocks (BB) according to the energy declaration documents of the corresponding housing associations [29]. As reported in Table 1, the BBs are identified through their heated area.

Table 1.
Square meters of heated area for each BB.
The choice of a limited area was motivated by the focus of the study, which was to show the potential of peak power demand management by using V2G technology. This could be easily replicated to show the impact on the whole neighborhood (or beyond).
3. Scenarios
3.1. Reference Scenario
The reference scenario for the present work was taken from a previous study presented in [12]. Given the interest of a few housing associations (Section 1), the focus was to assess the technical feasibility of replacing a DH network with domestic-distributed HPs. Since the sole installation of the distributed HPs was shown to cause overloadings on the electricity distribution grid, a demand response solution was further assessed. The thermal mass of the buildings was used as TES to alleviate the grid from the overloadings caused by the HPs. A positive contribution was shown with a reduction of the heat demand dependence from a DH of 6%, compared to the case without the thermal mass control. Furthermore, up to 50% fewer overloadings were detected at the HP level. However, it was also highlighted that a full disconnection from the DH network was not possible given the current infrastructure capacity. These outcomes [12] represented the reference scenario for the present study.
3.2. V2G Integration Scenario
In the present paper, the reference scenario was extended by assessing the potential of V2G technology as a way to further support the electricity distribution grid. A simplified illustration of this concept is shown in Figure 2. For the sake of simplicity, a BB is represented as one building, though it can also correspond to a group of buildings. The V2G charging/discharging station is located upstream of each HP installation. The EVs’ charging/discharging patterns were based on stochastic profiles. These were generated according to the assumptions described in Section 4.
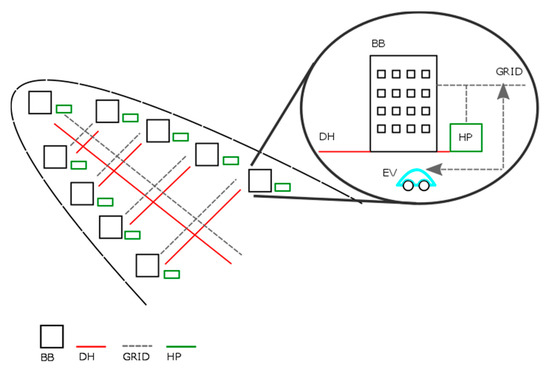
Figure 2.
Conceptual illustration of the case study within the vehicle-to-grid (V2G) scenario. HP: heat pump; EV: electric vehicle.
The EVs’ parking stations are located in the BBs, in line with the “Charge at Home” initiative (Section 1). In this scenario, as illustrated in Figure 2, both charging and discharging processes—and thus V2G—were enabled in each BB. The aim was to cover the grid overloadings by performing peak shaving with the electricity stored in the EVs’ batteries. This study considered a 100% penetration of the EVs. Furthermore, the EVs’ charging was assumed to happen overnight with no overloadings. More specific assumptions are described in Section 4.
4. Models
Different combinations of models were used to represent the two scenarios described in Section 2. These models are discussed in detail in the following sub-sections.
4.1. Models for the Reference Scenario
This sub-section briefly highlights that, from a modeling and simulation perspective, a co-simulation method [28,30] was used to assess the interaction between the loading of the electricity distribution grid, the heat supply from HPs and a DH network, and the indoor temperature of residential buildings. Figure 3 sums up the modeling tools that were used for each system involved in the scenarios. The scheme also shows the main heat (red lines), power flows (black lines), and control signals (blue dashed lines).
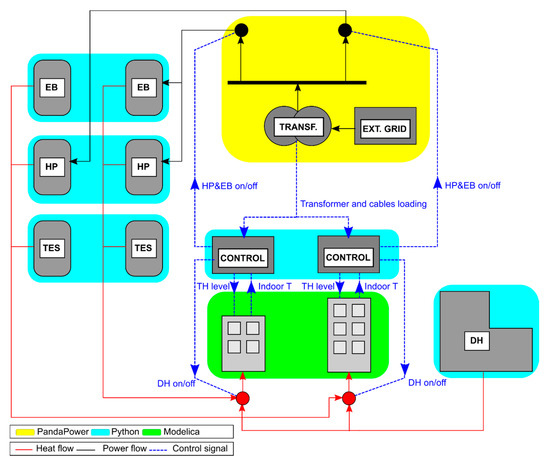
Figure 3.
Co-simulation scheme for the reference scenario (EB: electrical backup; TH: thermostat).
The co-simulation environment allowed us to capture two feedback loop signals. On one hand, the loading status of the grid was checked to decide whether the HPs could be operated. An overloading signal was generated when 100% of the capacity was reached. On the other hand, the indoor temperature of the BBs was monitored to decide if the thermostat set point could be changed to load/unload the thermal mass. In this case, the indoor temperature was to be maintained within the range of 20 ± 0.5 °C.
The following models were implemented for this reference scenario:
- A power flow model for the electricity distribution grid. An open source tool called Pandapower [31] was used for this purpose.
- A reduced order model for the thermal demand of the BBs. This model is part of the Modelica Buildings library [32], maintained by the International Building Performance Association (IBPSA).
- A Python model based on a coefficient of performance formula [33] for the HPs.
- Python models based on energy balance equations for the DH, the TES, and the electrical backup units.
- A Python in-house operation logic for the control of the heating supply.
These models were used within a one year simulation with an hourly time step. A detailed explanation, parameters, variables, and assumptions for all the models are provided in [12].
4.2. Models for the V2G Integration Scenario
Concerning the V2G integration scenarios, two models were combined:
- The grid overloading power profiles generated as a result of the reference scenario for the critical cables.
- Stochastic driving patterns for the EVs owned by the inhabitants of Hammarby Sjöstad, assuming a 100% penetration of this technology.
Regarding the first model, a critical day was selected (10th January) from the reference scenario, together with the identified critical cables. With reference to this day, the overloading power for each critical cable was obtained by subtracting the power corresponding to a 100% loading of each critical cable from the actual loading. For the hours that did not present overloadings, the overloading power was set to zero.
In this study, the analysis was extended to all cables, including the parallel ones. Figure 4 shows the one-line diagram of the electricity distribution grid of the case study. The four red-highlighted cables are the ones that were identified as critical in the reference scenario. Two of these cables corresponded to bundled parallel cables. The corresponding labels are listed as the following:
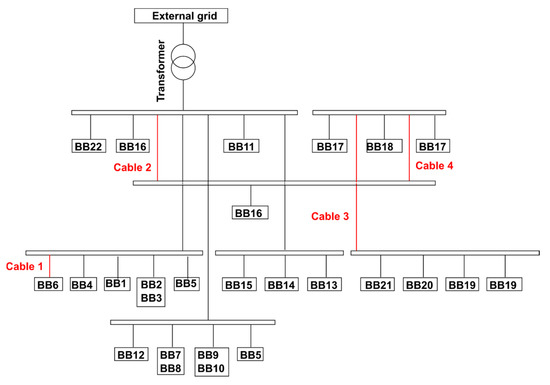
Figure 4.
One-line diagram of the case study 400 V grid.
- Cable 1—LU 1
- Cable 2—Llugnw24, Llugnw26, Llugnw27
- Cable 3—Luddnw3
- Cable 4—Llugnw6, Llugnw7
The stochastic driving patterns of the EVs were generated by means of an in-house, Python-based model. Table 2 summarizes the main inputs to the model, with the related references for the assumptions. These values were considered valid for the selected location. The number of cars per person referred to statistical data of a typical Stockholm neighborhood. To determine the density of inhabitants, it was reasonably assumed that two people could live in 48 m2. The level of penetration of EVs was related to a future case, in line with the current trend of an increasing EV market share [34]. These three inputs were used by the model to determine the number of EVs per each BB.
Table 2.
Inputs to the in-house EVs’ driving profile model. Soc: state of charge.
From further statistical data, it was possible to assume average driving kilometers and speeds. The state of charge (SoC) of an EV, which refers to the charge level of its battery, was constrained by charging and discharging limits. An EV had to be charged if its SoC was below 50%, while charging was prevented if its SoC was over 90%. This is mainly due to technical performance reasons of the battery. Discharging to the grid was enabled when an EV’s SoC was over 80%. Since this represented a key parameter for the present study, a sensitivity analysis was performed for values between 70% and 90% of the minimum SoC for discharging. The number of charging stations for each BB and the number of trips per day referred to the context of a residential neighborhood. This was also in line with the initiative “Charge at Home,” presented in Section 1. Thus, the two trips represented a way to work and a way back to home. The potential charging/discharging of an EV could happen after these two trips were completed each day.
Assumed initial hourly profiles for the share of cars starting a trip at a certain hour were taken as a further input to the model. These profiles were randomized using the parameters’ ranges presented in Table 2.
Given all these inputs (Table 2), the in-house Python model performed three main steps:
- The total number of vehicles was allocated to each BB proportionally to the number of inhabitants and to the number of cars per person.
- The starting times for the cars’ trips were randomized around an initial value defined per each hour of the day [36]. The “random” Python module was used for this purpose.
- The daily trips for each car were simulated by assigning, on a random basis (“random” module), the travel distances, the speed boundaries, and the initial SoC.
The main outputs of the model were:
- The number of cars per each station (or BB).
- The share of each cars’ brand per each station (or BB).
- The starting and ending times of each trip per each car.
- The end-of-the-day SoC per each car.
- The available power hourly profile per each car per each station (or BB).
Finally, the EVs’ available power profiles were combined with the overloading power profiles taken from the reference scenario. The objective was to estimate the potential of V2G to alleviate the grid overloadings caused by the installation of the distributed HPs. Thus, a peak power shaving strategy was implemented by using the electricity stored in the EV’s batteries. This was done by overlapping the two hourly profiles along the selected critical day. In particular, a V2G discharging service was activated when the following combination of events occurred:
- A potential overloading was detected on an upstream cable.
- One or more EVs were parked with an SoC over 80% at a corresponding charging/discharging station.
The validity of the results was bound to the assumption that the EV’s driving patterns did not present large differences from one day to the other. This was considered reasonable for a residential district, like Hammarby Sjöstad.
Since it was expected that the assumption for the minimum SoC for discharging played a relevant role, a sensitivity analysis was conducted for minimum SoC values equal to 70%, 75%, 80%, 85%, and 90%.
5. Results
Within the scope of the present paper, the results are presented and discussed in Figure 4 and in the remainder of this section.
Figure 4 highlights the cables that were found to be still critical within the reference scenario. This means that, despite the utilization of the thermal mass of the BBs as a TES device, not all the grid overloadings, caused by the HPs, could be compensated for [12]. This was mainly due to the constraints in terms of thermal mass capacity of each BB and indoor temperature comfort. The latter was assumed to 20 ± 0.5 °C. By introducing V2G technology, according to the models discussed in Section 4.2, the objective was to explore the technical potential of EVs’ batteries to provide further capacity to the grid. In this way, it could be shown how V2G can help covering these remaining overloadings generated by the HPs’ demand peak.
Concerning the V2G integration scenario, Table 3 shows the number of EVs that were assigned to each BB. This outcome was based on the parameters presented in Table 2, regarding the number of cars per person, the number of people per BB’s heated square meters, and the share of EVs in the studied area.
Table 3.
Number of EVs per each BB.
In terms of electricity discharging to the grid, the number of EVs reported in Table 3 shows the total availability of EVs when no constraints about trips and SoC were considered. However, within the V2G integration scenario, the EVs were firstly required to be parked at their BBs’ stations after completing two daily trips (to and from work). Secondly, their SoC had to be above 80%. Based on these constraints, Figure 5 illustrates the EVs’ availability when back from work, i.e., after the second daily trip. When looking at the number of EVs parked (top graph in Figure 5), it could be verified that the cars were driven back from work along the day, and, around 6 p.m., most of them were parked at home. However, since an SoC higher than 80% was also required, the actual, much lower, EVs’ availability is shown in the bottom graph of Figure 5. For example, at the charging station of BB16, at 6 p.m., only 25% of the parked EVs could discharge electricity to the grid.
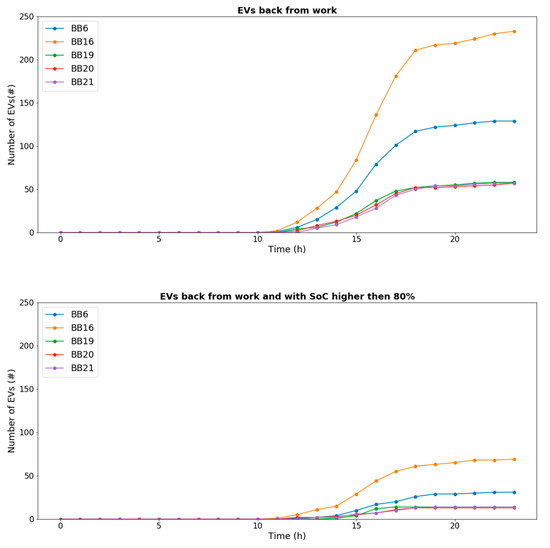
Figure 5.
EVs’ availability at each BB station during the selected critical day.
Figure 6 illustrates the impact of the EVs’ availability for V2G on the grid’s overloadings. In this figure, the reference scenario (without V2G integration) and the V2G integration scenario are compared over the selected critical day. The comparison is done by showing the percentage overloading performance for each critical cable. The loading performance below 100% is not shown in order to set the focus on the overloadings only.
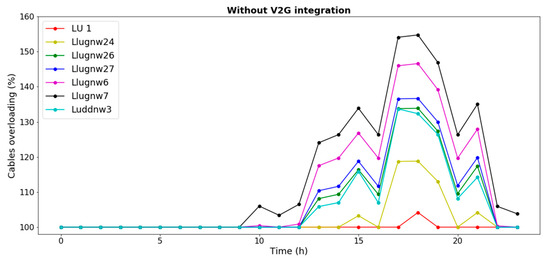
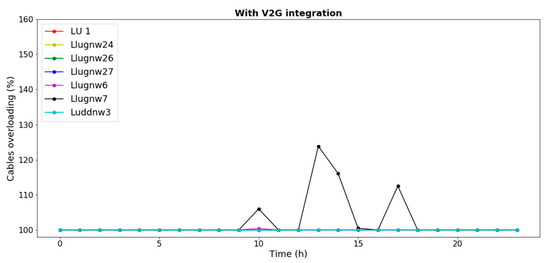
Figure 6.
Cables overloading performance day before and after the integration of V2G.
As it can be noticed in Figure 6, the overloadings were concentrated during the late afternoon and during the evening. This is reasonable since the studied area is mainly a residential one, so people are at work during the day hours.
The integration of V2G helped to alleviate the overloadings by shaving the peak demand generated by the HPs. All the cables, except Llugnw6 and Llugnw7, fully benefited from this new system with no overloadings left. The other cables remained critical, especially before 6 p.m., when most of the cars were still away from the parking stations. This means that, with a 100% level of EV penetration in the neighborhood, the discharge of electricity from EVs’ batteries could cover the amplitudes of the critical power peaks. The time matching between overloadings and the EVs’ availability remained a challenge.
From the perspective of the main objective of the case study, Figure 7 shows the relation between the cables and each BB and, thus, each distributed HP unit. Considering that this analysis was related to a critical day (representative according to the assumption in Section 4.2), it can be concluded that the integration of V2G has the potential to fully enable the installation of HPs in BB6, BB19, BB20, and BB21. Concerning the other BBs, further measures should be implemented. For example, if a grid upgrade is to be either avoided or delayed, a different V2G operation logic should be tested. The implementation of smart control devices based on forecasting methods is a suggestion for future work.
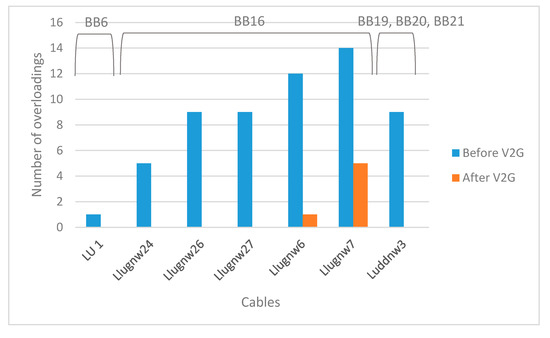
Figure 7.
Cables overloadings over the selected critical day.
Finally, in order to assess the relevance of the assumption for the minimum SoC for discharging, a sensitivity analysis is presented for values equal to 70%, 75%, 80%, 85%, and 90%. It was found that the availability of cars with a minimum SoC of 70% allowed for the covering of all the overloadings during the selected critical day. However, this is expected to increase the following charging requirements, which should be further tested. On the opposite side, no cars were available when the minimum SoC was set to 90%, so none of the overloadings could be balanced. As an example, Figure 8 shows the results of this sensitivity analysis at 5 p.m. during the selected day for all the critical cables. At this specific hour, a minimum SoC of 75% already solved the overall criticality. However, the cable Llgnw7 was still overloaded by about 8% at 1 p.m.
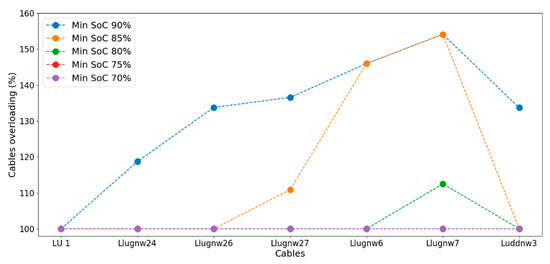
Figure 8.
Cables’ overloadings at 5 p.m. for different minimum SoC values for discharging.
As a more general conclusion, it can be stated that the approach presented in this paper can play a relevant role as a decision support tool for city planners, energy utilities, and engaged citizens. A district-level perspective linked to a sector-coupling approach (heating, electricity, and transport) can unlock the implementation of innovative technologies like active thermal mass and V2G.
6. Conclusions
In this paper, a district level perspective was applied on an integrated energy infrastructure problem where the electricity, heating, and transport sectors were interconnected.
Hammarby Sjöstad, a residential neighborhood in Stockholm, was selected as a relevant case. A previous study assessed that the plan of installing distributed domestic HPs will overload the local electricity distribution grid. The criticality of this situation can be improved, but not be solved, by using the thermal mass of the buildings as TES.
In the present work, V2G was presented as a new solution to further support the grid. This technology enables a bi-directional flow of electricity between the EVs’ batteries and the grid. The aim was to explore the potential of V2G to perform peak power demand shaving by discharging electricity to the grid. The objective was to compensate for the overloadings caused by the HPs.
The technical performance simulation over a representative critical day demonstrated that, with a 100% penetration of EVs, the available power for discharging could cover all the overloadings’ amplitudes. However, because of the time mismatch between the cars’ availability and the need for balancing, only some cables could be completely relieved. This means that only the buildings connected to these cables could install residential HPs.
This conclusion is strongly dependent on the minimum SoC set for discharging. The study was conducted with a minimum SoC value of 80%. It was further shown that lowering this parameter to 70% could help solving the overall overloading problem. However, this is expected to have an impact on the following charging requirements, which should be further studied.
As future research, a model predictive control logic should be investigated in order to solve the time mismatch challenge. Furthermore, the validity of the results should be tested against potential daily EVs’ driving patterns variations. A sensitivity analysis regarding the penetration level of EVs and their SoC boundaries for charging is also suggested.
Finally, the approach used in this study shows that city planners, energy utilities, and engaged citizen can benefit from taking a district-to-city level perspective on integrated energy systems.
Author Contributions
Conceptualization, M.A., and M.T.; methodology, M.A.; software, M.A. and M.T.; validation, M.A. and M.T.; formal analysis, M.A.; writing—original draft preparation, M.A.; writing—review and editing, M.T., M.A. and B.L.; visualization, M.A.; supervision, M.T. and B.L. All authors have read and agreed to the published version of the manuscript.
Funding
This research received no external funding.
Conflicts of Interest
The authors declare no conflict of interest.
References
- Allerup, J. Sweden’s Climate Act and Climate Policy Framework. Available online: http://www.swedishepa.se/Environmental-objectives-and-cooperation/Swedish-environmental-work/Work-areas/Climate/Climate-Act-and-Climate-policy-framework-/ (accessed on 15 October 2019).
- IEA. Sweden 2019 Review; IEA: Paris, France, 2019. [Google Scholar]
- Duveau, T.; Tewes, N. Climate Scorecard Sweden; WWF and Allianz: Frankfurt, Germany, 2009. [Google Scholar]
- Moro, A.; Lonza, L. Electricity carbon intensity in European Member States: Impacts on GHG emissions of electric vehicles. Transp. Res. Part. D Transp. Environ. 2017, 64, 5–14. [Google Scholar] [CrossRef] [PubMed]
- Electricity Hammarby Sjöstad 2.0. Available online: http://hammarbysjostad20.se/?lang=en (accessed on 12 December 2019).
- Pasichnyi, O.; Wallin, J.; Kordas, O. Data-driven building archetypes for urban building energy modelling. Energy 2019, 181, 360–377. [Google Scholar] [CrossRef]
- IEA. Nordic Energy Technology Perspectives 2016. In Energy Technology Policy Diver; IEA: Paris, France, 2016; p. 269. [Google Scholar]
- Choi, W.; Wu, Y.; Han, D.; Gorman, J.; Palavicino, P.C.; Lee, W.; Sarlioglu, B. Reviews on grid-connected inverter, utility-scaled battery energy storage system, and vehicle-to-grid application-Challenges and opportunities. In Proceedings of the 2017 IEEE Transportation Electrification Conference, Chicago, IL, USA, 22–24 June 2017; pp. 203–210. [Google Scholar]
- Yilmaz, M.; Krein, P.T. Review of the impact of vehicle-to-grid technologies on distribution systems and utility interfaces. IEEE Trans. Power Electron. 2013, 28, 5673–5689. [Google Scholar] [CrossRef]
- Steward, D. Critical Elements of Vehicle-to- Grid (V2G) Economics; NREL: Golden, CO, USA, 2017. [Google Scholar]
- IRENA. Innovation Outlook: Smart Charging for Electric Vehicles; IRENA: Abu Dhabi, UAE, 2019. [Google Scholar]
- Arnaudo, M.; Topel, M.; Laumert, B. Techno-economic analysis of demand side flexibility to enable the integration of distributed heat pumps within a Swedish neighborhood. Energy 2020, 195, 117012. [Google Scholar] [CrossRef]
- Saber, A.Y.; Venayagamoorthy, G.K. Plug-in vehicles and renewable energy sources for cost and emission reductions. IEEE Trans. Ind. Electron. 2011, 58, 1229–1238. [Google Scholar] [CrossRef]
- Chukwu, U.C.; Mahajan, S.M. V2G electric power capacity estimation and ancillary service market evaluation. In Proceedings of the 2011 IEEE Power & Energy Society General Meeting, Detroit, MI, USA, 24–28 July 2011; pp. 1–8. [Google Scholar]
- Wang, Z.; Wang, S. Grid power peak shaving and valley filling using vehicle-to-grid systems. IEEE Trans. Power Deliv. 2013, 28, 1822–1829. [Google Scholar] [CrossRef]
- Kumar, A.; Bhalla, V.; Kumar, P. Impact of Plug-in Hybrid Electric Vehicles Integrated with Economic Unit Commitment of Power system. In Proceedings of the 2017 IEEE Transportation Electrification Conference (ITEC-India), Pune, India, 13–16 December 2017. [Google Scholar]
- Shinde, P.; Swarup, K.S. Optimal Electric Vehicle charging schedule for demand side management. In Proceedings of the 2016 First International Conference on Sustainable Green Building Communities, Chennai, India, 18–20 December 2016. [Google Scholar]
- Yang, Z.; Liao, Q.; Tang, F.; Peng, S.; Fang, F.; Xu, Y. Dispatch of EV Loads in Active Distribution Network Considering Energy Storage Characteristic. In Proceedings of the 2017 IEEE Conference on Energy Internet and Energy System Integration (EI2), Beijing, China, 26–28 November 2017. [Google Scholar]
- Debnath, U.K.; Ahmad, I.; Habibi, D.; Saber, A.Y. Energy storage model with gridable vehicles for economic load dispatch in the smart grid. Int. J. Electr. Power Energy Syst. 2015, 64, 1017–1024. [Google Scholar] [CrossRef]
- Ahmadian, A.; Sedghi, M.; Mohammadi-Ivatloo, B.; Elkamel, A.; Aliakbar Golkar, M.; Fowler, M. Cost-Benefit Analysis of V2G Implementation in Distribution Networks Considering PEVs Battery Degradation. IEEE Trans. Sustain. Energy 2018, 9, 961–970. [Google Scholar] [CrossRef]
- Jain, P.; Jain, T. Development of V2G and G2V Power Profiles and Their Implications on Grid Under Varying Equilibrium of Aggregated Electric Vehicles. Int. J. Emerg. Electr. Power Syst. 2016, 17, 101–115. [Google Scholar] [CrossRef]
- Freeman, G.M.; Drennen, T.E.; White, A.D. Can parked cars and carbon taxes create a profit? The economics of vehicle-to-grid energy storage for peak reduction. Energy Policy 2017, 106, 183–190. [Google Scholar] [CrossRef]
- Gough, R.; Dickerson, C.; Rowley, P.; Walsh, C. Vehicle-to-grid feasibility: A techno-economic analysis of EV-based energy storage. Appl. Energy 2017, 192, 12–23. [Google Scholar] [CrossRef]
- White, C.D.; Zhang, K.M. Using vehicle-to-grid technology for frequency regulation and peak-load reduction. J. Power Sources 2011, 196, 3972–3980. [Google Scholar] [CrossRef]
- Mahmud, K.; Morsalin, S.; Kafle, Y.R.; Town, G.E. Improved peak shaving in grid-connected domestic power systems combining photovoltaic generation, battery storage, and V2G-capable electric vehicle. In Proceedings of the 2016 IEEE International Conference on Power Systems Technology, Wollongong, NSW, Australia, 28 September–1 October 2016; pp. 1–4. [Google Scholar]
- Wang, Z.; Tang, Y.; Chen, X.; Men, X.; Cao, J.; Wang, H. Optimized daily dispatching strategy of building-integrated energy systems considering vehicle to grid technology and room temperature control. Energies 2018, 11, 1287. [Google Scholar] [CrossRef]
- Lin, H.; Liu, Y.; Sun, Q.; Xiong, R.; Li, H.; Wennersten, R. The impact of electric vehicle penetration and charging patterns on the management of energy hub–A multi-agent system simulation. Appl. Energy 2018, 230, 189–206. [Google Scholar] [CrossRef]
- Puerto, P. zerOBNL. Available online: https://github.com/IntegrCiTy/zerobnl (accessed on 26 October 2018).
- Boverket Ska Din Byggnad ha en Energideklaration? Available online: https://www.boverket.se/sv/energideklaration/energideklaration/ (accessed on 27 June 2019).
- Puerto, P.; Widl, E.; Page, J. ZerOBNL: A framework for distributed and reproducible co-simulation. In Proceedings of the 2019 7th Workshop on Modeling and Simulation of Cyber-Physical Energy System, Montreal, QC, Canada, 15 April 2019; pp. 1–6. [Google Scholar]
- Pandapower. Available online: https://pandapower.readthedocs.io/en/v1.6.0/about.html (accessed on 11 October 2018).
- Open Modelica Thermal Zone Reduced Order Models. Available online: https://build.openmodelica.org/Documentation/IBPSA.ThermalZones.ReducedOrder.RC.UsersGuide.html (accessed on 14 October 2019).
- Patteeuw, D.; Helsen, L. Combined design and control optimization of residential heating systems in a smart-grid context. Energy Build. 2016, 133, 640–657. [Google Scholar] [CrossRef]
- Bunsen, T.; Cazzola, P.; D’Amore, L.; Gorner, M.; Scheffer, S.; Schuitmaker, R.; Signollet, H.; Tattini, J.; Paoli, J.T.L. Global EV Outlook 2019 to Electric Mobility; OECD: Paris, France, 2019; p. 232. [Google Scholar]
- Statistikmyndigheten SCB Statistikdatabasen. Available online: http://www.statistikdatabasen.scb.se/pxweb/sv/ssd/ (accessed on 1 February 2020).
- Trafikverket Öppna Data från Trafikverket. Available online: https://www.trafikverket.se/tjanster/Oppna_data/ (accessed on 1 February 2020).
- Liu, Z.; Wu, Q.; Nielsen, A.H.; Wang, Y. Day-ahead energy planning with 100% electric vehicle penetration in the nordic region by 2050. Energies 2014, 7, 1733–1749. [Google Scholar] [CrossRef]
© 2020 by the authors. Licensee MDPI, Basel, Switzerland. This article is an open access article distributed under the terms and conditions of the Creative Commons Attribution (CC BY) license (http://creativecommons.org/licenses/by/4.0/).