Article

Future Renewable Fuel Mixes in Transport in Germany under RED II and Climate Protection Targets

1
DBFZ Deutsches Biomasseforschungszentrum Gemeinnützige GmbH, Torgauer Straße 116, D-04347 Leipzig, Germany
2
Department of Bioenergy, Helmholtz Centre for Environmental Research—UFZ, Permoserstraße 15, 04318 Leipzig, Germany
*
Author to whom correspondence should be addressed.
Energies 2020, 13(7), 1712; https://doi.org/10.3390/en13071712
Submission received: 6 March 2020 / Revised: 27 March 2020 / Accepted: 30 March 2020 / Published: 3 April 2020
(This article belongs to the Special Issue Prospects of Biomass-Based Biofuels)

Abstract

:
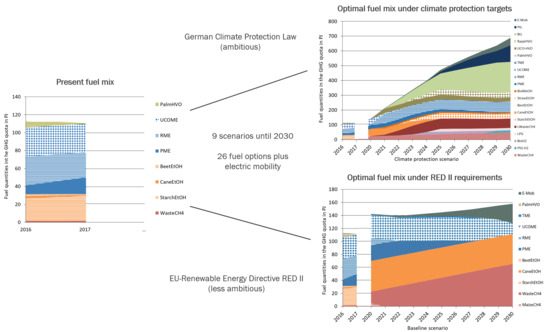
With the Renewable Energy Directive 2018/2001 (RED II), adopted in December 2018, the EU is continuing the political framework for the use of renewable energy sources in the transport sector for the period from 2021 to 2030. At the same time, the German federal government has set a target of reducing greenhouse gas (GHG) emissions in the transport sector by at least 40% to 42% by 2030 compared to the 1990 GHG level. To investigate the possible effects of the European and national requirements on the German GHG quota, cost-optimal fuel mixes were modelled to achieve the GHG targets of 26 fuel options in each of the nine different scenarios. The results show clear differences between the scenarios that implement the RED II targets (including 14% renewables in transport by 2030) and those that implement the climate protection target (40–42% GHG reduction compared to 1990 by 2030). If only the minimum requirements of RED II are met, the German climate protection target is clearly missed without further measures. In order to achieve the climate protection target, a significant reduction in the final energy consumption in transport is required, as well as a very high GHG quota of 34.5%, meaning a high proportion of renewables of ca. 40% and using almost all the fuel options considered.

Graphical Abstract

1. Introduction

The recent reports of the Intergovernmental Panel on Climate Change (IPCC) [1,2] once again showed the necessity for significant reductions of GHG emissions in the energy, transport and agricultural sectors to reach the targets of the Paris Agreement [3]. The IPCC showed that 20%–40% of human beings live in regions where the temperature has already risen to more than 1.5 °C above pre-industrial levels [1]. In many regions, this global warming has led to increases in the frequency and intensity of extreme weather events, which has impacted food security and terrestrial ecosystems through desertification and land degradation, for example [2]. Although the 2019 GHG emissions in Germany decreased in total, the GHG emissions caused by transportation continued to rise [4]. In 2018, the German transport sector emitted 162 Mio t CO2-eq. This is a reduction of only 1% compared with the GHG emissions of 1990 (163 Mio t CO2-eq.) [5]. In the transport sector, the key to climate protection is the simultaneous, drastic reduction of energy demand and a massive increase in renewable energies. However, in 2019, the share of renewable energies in the entire transport sector in Germany was only 5.8% [6].
At EU level, the general frame for the usage of renewables in transport until 2030 is set with the Renewable Energy Directive 2018/2001/EU (RED II). Among many requirements in RED II, particularly significant ones are the minimum share of renewable energies of 14%, the minimum share of advanced biofuels of 0.2%/1%/3.5% in 2022/2025/2030 and the upper limit for biofuels produced from food and feed crops of 7%. In addition, biofuels based on used cooking oil and animal fats are limited to 1.7% of the final energy consumption in road and rail transport [7]. The effort sharing regulation ESR 2018/842 [8] also sets binding annual emission reductions by the European member states from 2021 to 2030 for the non-Emissions Trading System (ETS) sectors. Germany has recently started the process of implementing the RED II and ESR into national laws and regulations. In this context, the German target for reducing GHG emissions in transport by 40%–42% by 2030, as compared to 1990, is mandatory [9,10].
Currently, the existing Renewable Energy Directive 2009/28/EC (RED) [11] and Fuel Quality Directive 98/70/EC (FQD) [12] are setting the frame for renewable fuels in transport until 2020. Both are implemented in Germany by means of a GHG-based quota, which started in 2015. This means that fuel suppliers are obligated to sell the respective biofuel with its fossil counterpart gasoline or diesel (which is usually done through blending). The resulting fuel mix is set to achieve a 3.5%/4%/6% GHG mitigation compared to the fossil gasoline and diesel mix, for the entire fuel sector from 2015/2017/2020 onwards. The target continues after 2020 at the level of 6%. It is very likely that the GHG quota will be continued from 2021 onwards, respectively, and further CO2-related instruments will come into action. More details on the political framework and the development of the fuel market within the national frame conditions can be seen in [13].
For the German context, different systemic scenario modelling studies have been performed. They consider the development of the transport sector inter alia, including different mixes of competitive fuels or different transport modes under climate and other targets until 2030/2050, like [14,15,16,17,18,19,20,21,22,23,24]. A meta-analysis done by Wietschel et al. [25] summarises the objectives, methods, results and recommendations of 14 different national and international studies focusing on energy and transport, with an emphasis on avoiding and shifting traffic, as well as the role of electric mobility and synthetic fuels. They concluded that further research and development activities, a defined regulatory framework and finance strategies for advanced fuels, such as hydrogen and synthetic fuels, as well as a more detailed knowledge of raw material availability are still needed to achieve climate protection targets.
However, a competition optimisation model, considering a multitude of fuel options with detailed technology data in different possible scenarios for the development and design of the German GHG quota, under the actual frame of RED II and climate protection targets, has not yet been carried out.
Against this background, there are two key questions to be addressed for the detailed investigation:
  • In the case of a direct implementation of the EU RED II framework and under other varying frame assumptions into the German GHG based quota by 2030, which optimal fuel mixes and GHG emissions emerge?
  • Which optimal fuel mix and measures would be required to reach the target of the German climate protection target in transport by 2030?
For politicians and other relevant decision-makers, this study can provide a basis for the further development of an overall strategy for the use of renewable fuels in transport.

2. Materials and Methods

Identifying optimal fuel mixes for road and rail transport within the German GHG quota and their associated GHG reductions until 2030 depends highly on the fuel options considered, the scenario conditions defined and the assumptions made within modelling.

2.1. Fuel Options

Essentially, there are three regulations that determine which fuel options can be taken into account within the German GHG quota: the RED II [7] and the German thirty-seventh and thirty-eighth Federal Emissions Control Act [26,27]. Accordingly, the following fuel options were considered as potentially being in the German GHG quota in this study:
  • Advanced biofuels (from feedstocks according to Annex IX, Part A of RED II)
  • Biofuels from used cooking oil and animal fats (according to Annex IX, Part B of RED II)
  • Conventional biofuels from food and feed crops
  • Renewable non-biogenic fuels (power-to X (PtX)-options)
  • E-vehicles in road transport
  • Fossil fuel options such as liquefied natural gas (LNG), compressed natural gas (CNG), liquefied petroleum gas (LPG) and H2 from fossil fuels.
Twenty-six competing fuel options were considered for this study. They are listed in Table 1 with their maximum blending limits according to the current national fuel standards [28,29,30] and the classification of RED II [7] and the thirty-seventh and thirty-eighth Federal Emissions Control Act [26,27]. For gaseous fuels, the maximum proportions of the final energy consumption have been defined, as stated in [31]. Electric mobility, as the twenty-seventh fuel option, is integrated in each optimal fuel mix per scenario, in line with the German government’s target of 6 or 10 million vehicles by 2030 [32], but without competing with the other twenty-six fuel options. Aviation fuels are not considered, since the regulations of RED II are not binding for them.

2.2. Scenarios

Within the study, nine different scenarios were considered. Scenario 1 represents the baseline scenario. It implements the requirements of RED II [7], the thirty-seventh and thirty-eighth Federal Emissions Control Act [26,27] and the 6 million electric vehicles target by 2030 of the Federal Government. In addition, a slightly lower final energy consumption in transport in 2030 compared to the model base year 2016 (2301 PJ) is assumed [6,21].
The contrary Scenario 6 represents the climate protection scenario in which the requirements of RED II [7] and the thirty-seventh and thirty-eighth Federal Emissions Control Act [26,27] are likewise implemented, but with the addition that the more ambitious climate protection target of a 40% GHG reduction in 2030 [9] compared to 1990 has to be achieved.
Scenarios 2–5 represent variations of the baseline scenario and Scenarios 7–9 represent variations of the climate protection scenario. The variations of the contrary Scenarios 1 and 6 cover a large range of possible future developments in the fuel market from 2020 to 2030. By varying the individual parameters in the various scenarios, their sensitivities were examined, and the robustness of the results was increased.
In Scenario 2, assuming a significantly reduced final energy consumption, a substantial expansion of electric mobility, to approx. 10 million electric vehicles (approx. 50 PJ) [23], and a simultaneous, sharp increase in the share of renewable energies in the electricity mix to 65% in 2030 [32], then only a low GHG quota (5.3%) remains for biofuels, non-biogenic renewable and fossil fuels.
In Scenario 3, the assumptions of a rising final energy consumption by 2030 (+20% compared with the baseline scenario), a low share of electric mobility of 3 PJ (10% of the baseline scenario) and a conservative value of 45% for the share of renewable energies in the electricity mix result in a higher GHG quota (8.1%) for biofuels, non-biogenic renewable and fossil fuels.
In contrast to the other scenarios, Scenario 4 assumes that commodity prices will rise at different rates (5% for cultivated biomass, straw and used cooking oils; 2.5% for animal fats and forest residues; and a constant price for residual and waste materials for biomethane production).
Scenario 5 examines the question of how the fuel mix develops within the GHG quota if the phase-out of biofuels with a high iLUC risk cannot be legally implemented and palm oil-based fuels, for example, continue to count towards the GHG quota.
In Scenario 7, the standard blending limits for ethanol and methanol to petrol, for biodiesel, and HVO, BtL and PtL to diesel fuel are abolished. It is assumed that the aforementioned fuel options can be blended up to 100%. Here, possible additional costs for changes to the engine design in the existing vehicle fleet are not taken into account.
In Scenario 8, the share of gaseous fuels in the fuel mix is left at the 2016 level of about 0.25% of the energy consumption in transport [6].
Scenario 9 examines the question of whether the climate protection target can be achieved if only the domestic biomass potentials are used for the production of biofuels. Biomass imports are excluded in this scenario.
Depending on the target (RED II minimum target or climate protection target), the final energy consumption in transport, the development of electric mobility and the share of renewable energies in the electricity mix, the base and climate protection scenarios and their variations result in different model GHG quotas that can be met by biofuels, non-biogenic renewable fuels and fossil fuels. The scenario-specific GHG quota represents the GHG abatement target for the modelling. Table 2 shows the key data of the baseline and climate protection scenarios. The key data of the variation scenarios are summarised in Table 3.

2.3. Modelling

The modelling of fuel competition for fulfilling RED II requirements and climate protection targets was performed in BENOPT (BioEnergy OPTimisation model, developed at the Helmholtz Centre for Environmental Research—UFZ, Department Bioenergy). BENOPT is a fully deterministic, bottom-up, perfect foresight linear optimisation model [34,35]. It optimises the investment and production of different fuel options under the given scenario-specific restrictions, with goal functions of minimising total costs or/and maximising GHG abatement. The model has a yearly resolution and is parametrised for Germany, with the current capacities and productions as a basis for the beginning. Input data (feedstocks, power, heat, conversion efficiencies and by-products) coupled with costs as well as investment, operation, and maintenance costs for the different fuel options are used as a basis for the model’s internal calculation of capital and production costs according to [36]. The GHG abatement of the options in this work come from the literature and was used as input.
In this study, the RED II requirements for land road transport as well as DIN norms for possible drop-in fuel shares set the main demand-side restrictions. Biomass and arable land potentials and restrictions as described in Section 2.4 set feedstock limitations.
Both cost and GHG abatement goal functions were used. First, the GHG abatement target was set to either the scenario-specific model GHG quota, or if this was not possible to reach under the specified restrictions, the maximal possible in any given year through maximising the GHG abatement. This was then used as a hard target for the cost optimal model run. When optimising the costs while fulfilling GHG abatement targets (GHG quota), the deciding factor for which fuel options are competitive within the GHG quota is their GHG abatement cost.

2.4. Data and Assumptions

The RED II requirements as mentioned in the introduction set the base conditions. Additional following assumptions and restrictions were made for the modelling:
  • Upstream Emission Reduction (UER) measures according to [33] and electricity in rail transport are out of scope.
  • The development of electric mobility is set exogenously and integrated into the fuel mix without competition, and is thus not part of the modelling.
  • The electricity available for electric mobility and for the production of electricity-based fuels is not limited.
  • Grid electricity is used for the use of electric mobility. Only the share of renewable energies in the electricity mix is counted towards the GHG quota.
  • According to RED II, the use of electricity in road transport is credited to the GHG quota by four times its energy content.
  • The production of electricity-based fuels takes place in favoured areas for the production of renewable energies. It is assumed that this electricity is generated at 0.05 Euro/kWh [37].
  • The upper limit for biofuels from food and feed is 6.5% of the final energy consumption (with reference to the thirty-eighth Federal Emissions Control Act [27]; unlike RED II [7], which allows 7%).
  • Advanced biofuels from feedstocks according to Annex IX, Part A of RED II are considered to be twice their energy content in the GHG quota. The minimum share for them without double counting is 0.1% in 2021, 0.5% in 2025 and 1.75% in 2030 of the final energy consumption, according to RED II [7].
  • The share of fuels with a high risk of indirect land-use change (e.g., palm oil-based fuels) will be set to 0% by the end of 2030, in accordance with RED II [7] (so-called phase-out).
  • The share of methane gas in the fuel mix increases from 1% in 2020 to 3% of the final energy consumption in 2030.
  • For crops, the prices were calculated in reference to a wheat price baseline according to a methodology elaborated in [38], where all crops have to achieve the same profit per hectare as the baseline crop, considering differing production costs and yields.
  • To avoid additional uncertainties, annual increases in feedstock prices, energy taxes and economic learning effects resulting from cumulatively constructed plants are not taken into account in Scenarios 1–3 and 5–9.
  • The GHG emissions decrease fuel-specifically until 2030, assuming an increasing share of renewable energies and increasing efficiencies in the upstream and main chain technologies.
  • The efficiencies of the technologies develop according to their maturity levels until 2030.
  • Biomass imports are possible for Scenarios 1–8. The biogenic residues wood, straw, used food and animal fats can be used up to 2.5 times the domestic potential, under the assumption that (i) these goods have a high enough energy density to be economically and viably transported, and (ii) they are available from and in neighbouring countries. The allowed arable land area for biofuel production of 2 million hectares is based on the recent arable land usage for this purpose [39]. This area sets the upper limit for how much is allowed to be used in the model; what is grown on the area is decided endogenously within the model, and the area does not have to be used.
  • Direct fuel imports are limited to the current level of globally traded volumes, e.g., for sugarcane ethanol.
  • The maximum annual fuel capacity increase of the fuel production facilities is 50% and 0.1 PJ for advanced fuels that did not have any production capacity in the previous year.
  • Biodiesel from animal fats is not excluded from the GHG quota in Germany, as was previously the case. However, the starting capacities for scenario modelling are set to zero for the model base year 2016.
All input and output data relevant for modelling in BENOPT are presented in the Supplementary File, Table S1.
The data come from different sources:
  • Mobilisable technical potentials for feedstocks are taken into account according to the DBFZ resource database [40].
  • The fuel quantities for 2016 and 2017 shown in the fuel mix diagrams of the scenarios are taken from the evaluation and experience report of the German Federal Agency for Agriculture and Food [41].
  • The costs and efficiencies of the fuel technologies at the beginning (2016) are based on studies conducted by DBFZ and UFZ, as well as other technical literature [35,3742,4344,4546,47,48].
  • Raw material prices are derived from the statistics of [49,50] and the data processing of [51,52,53,54,55,56]. The base year is 2016. In the case of strongly fluctuating prices, the arithmetic mean of the years 2013 to 2017 was used.
  • The plant capacities of the base year 2016 were taken from [42].
  • The specific GHG emissions for the fuels reported so far in the GHG quota were taken from [41]. For the other fuels, the GHG values were taken from Annex V of RED II [7]. The GHG values for electricity-based fuels and fossil fuels were taken from the thirty-eighth Federal Emissions Control Act [27].

3. Results

In the following, the modelled fuel mixes within the GHG quota between 2020 and 2030 and the associated GHG reductions for the baseline scenario and the climate protection scenario are presented. The fuel quantities for 2016 and 2017 in the diagrams represent real data, for comparison with the model results. The optimal fuel mixes in the scenarios are then summarized in a common chapter (see also the Supplementary File: Tables S2–S10).

3.1. Baseline Scenario

Figure 1 shows that biomethane from residual and waste materials is the largest renewable fuel component in 2030 due to the feedstock availability and its low GHG abatement costs. Residual and waste-based biomethane alone exceeds the minimum share for advanced fuels. However, the growing gas market assumed here (gas share of 3% of the final energy consumption in 2030 compared to 0.25% in 2016 [6]) assumes an expansion of biomethane production capacities and the corresponding utilisation infrastructure (filling stations and gas vehicles). The use of biomethane from residual and waste materials as an advanced biofuel has the greatest potential for GHG reductions (Figure 2). Bioethanol from sugarcane has the second highest share in the fuel mix in 2030 due to its low GHG abatement costs and no import limitations. Thus, the result is only valid if enough ethanol is exported beyond South America’s own consumption and if it is available for the European market. If the import rate for sugarcane ethanol remains at the relatively low level of 2017 (3.6 PJ corresponds to 1.6% of the amount of bioethanol used in Germany [41]), starch-based ethanol would appear in the fuel mix according to the ranking of the GHG abatement costs. The use of sugarcane ethanol as a conventional biofuel could reduce the second largest amount of GHG in 2030 (Figure 3). Palm oil-based biodiesel (PME) would no longer be present in the fuel mix even before the phase-out, and rapeseed oil-based biodiesel (RME) would only be present in the fuel mix until 2022. Both have excessively high GHG abatement costs compared with the best gaseous and bioethanol options. Thus, used cooking oil-based biodiesel (UCOME) with 17 PJ would be the only blending option for diesel in 2030. In 2017, 32 PJ UCOME were still present in the fuel mix according to [57] (see Figure 2).
In 2030, domestic conventional biofuels only appear in the fuel mix of the GHG quota if sugarcane ethanol imports remain at a constant or only slightly higher level. PtX options are the least competitive due to the highest production costs and thus do not emerge in the optimal fuel mix. For the fossil fuels LPG, CNG and LNG, low GHG mitigation leads to low competitiveness. Electric mobility is firmly defined in the fuel mix with 6 million electric vehicles and thus with approx. 30 PJ included outside the competitive situation, as described in Section 2. With a 55% renewable energy share in the power mix, a large proportion of the electricity generated in Germany comes from coal-fired power generation. Therefore, the specific GHG emissions for electric mobility are relatively high and the share of GHG reduction due to electric mobility is relatively small. Overall, meeting only the minimum requirements of the RED II, the climate protection target would clearly be missed. The fact that a share of 6.6% of renewable energies is sufficient to achieve the RED II targets of 14% renewable energy in transport, due to the possibility of multiple crediting of some renewable energy sources, shows the low ambition of the RED II targets.

3.2. Climate Protection Scenario

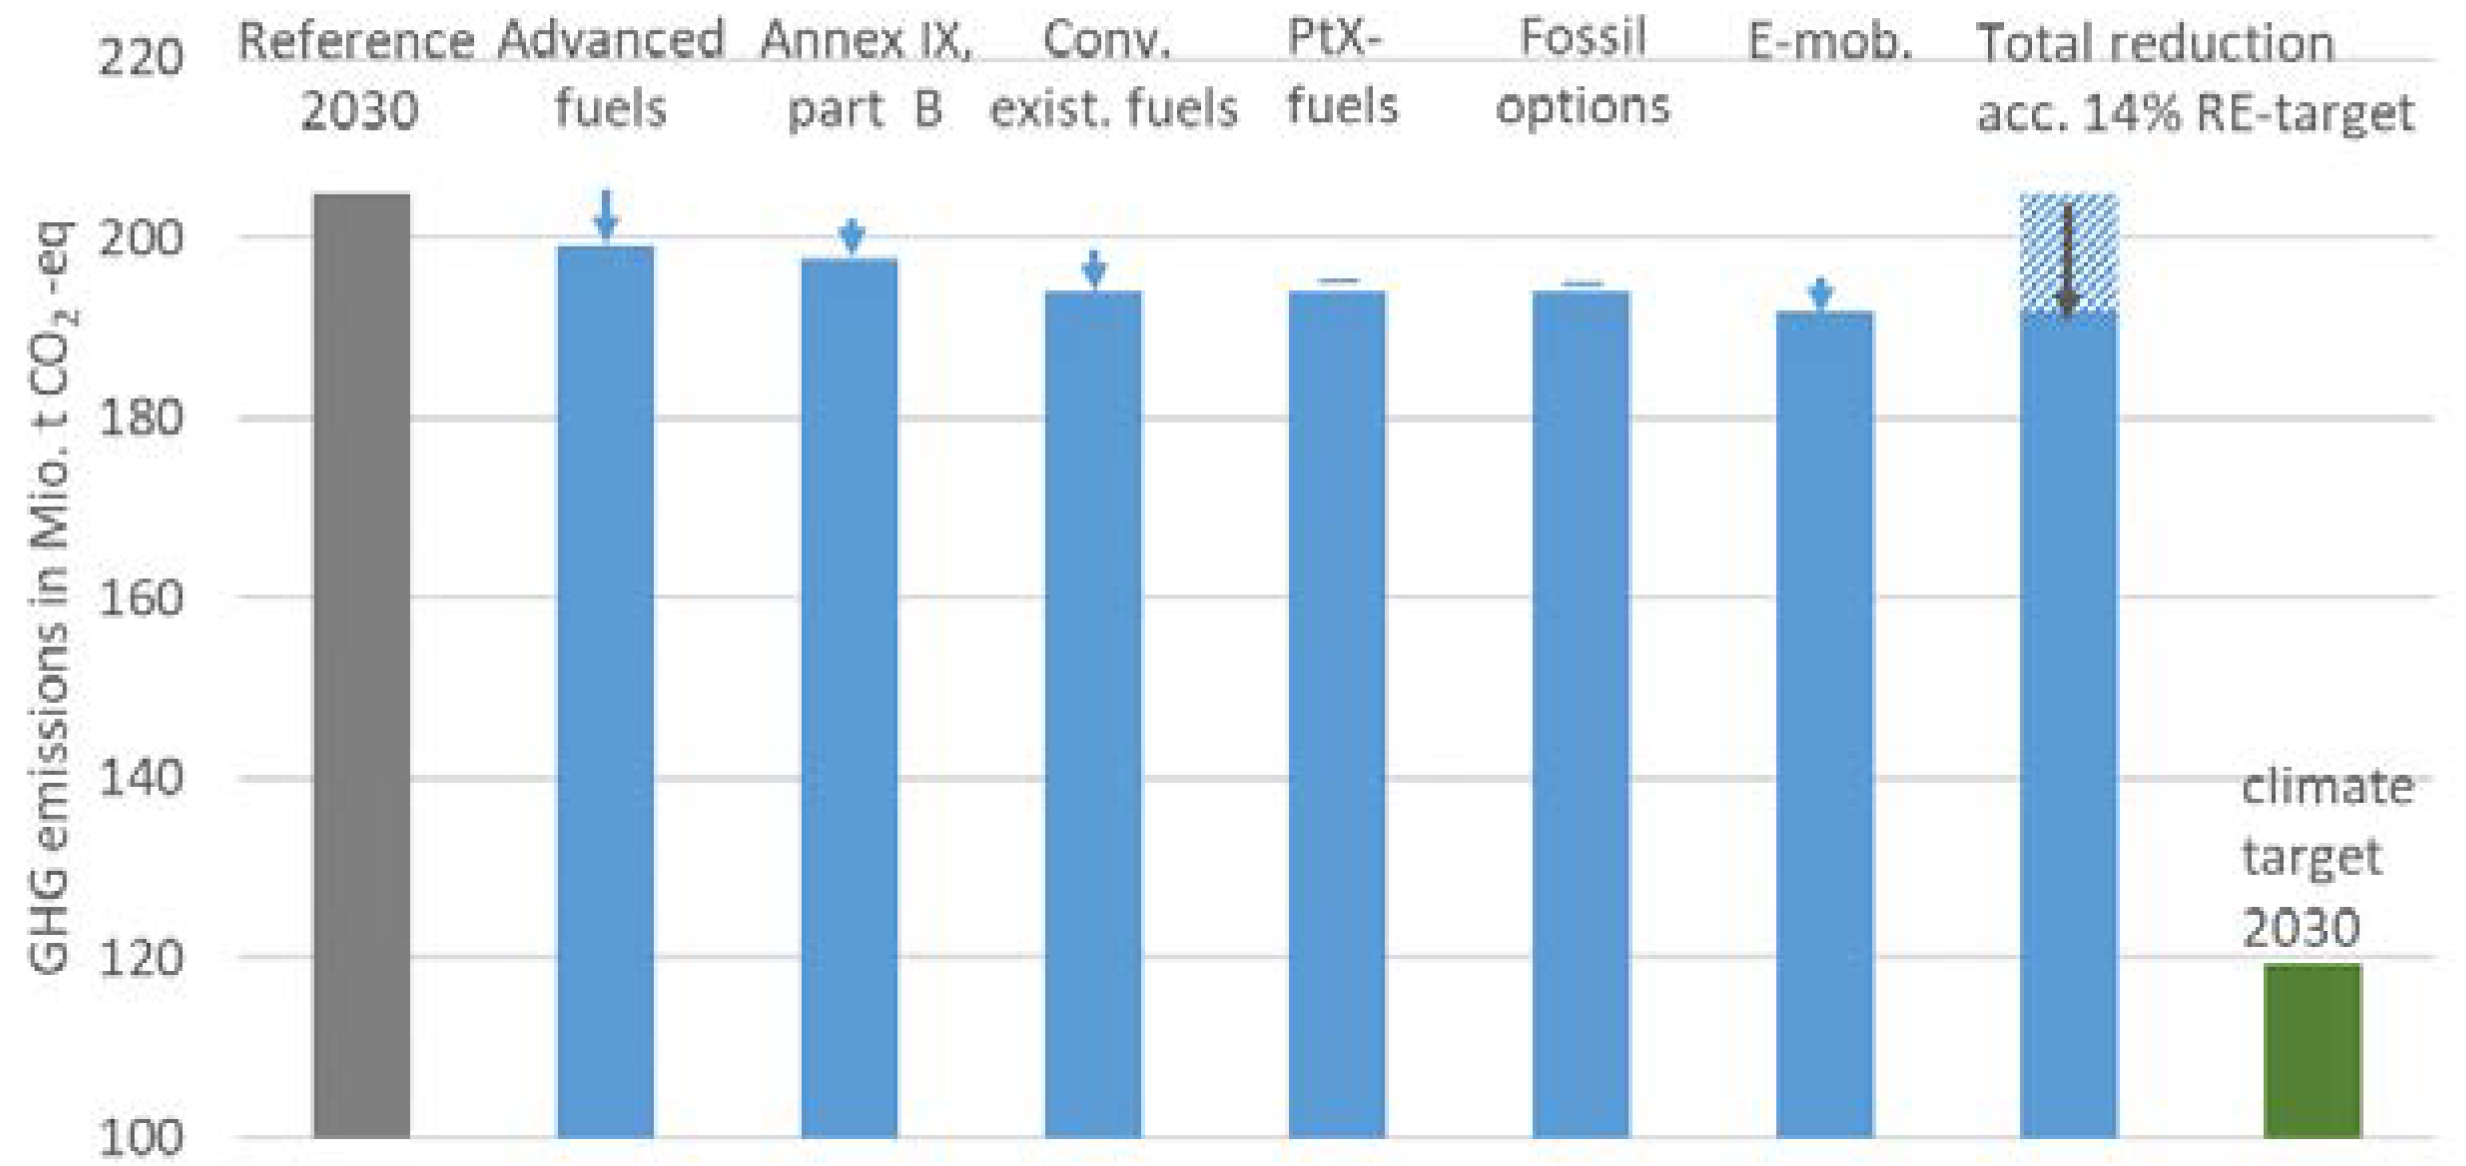
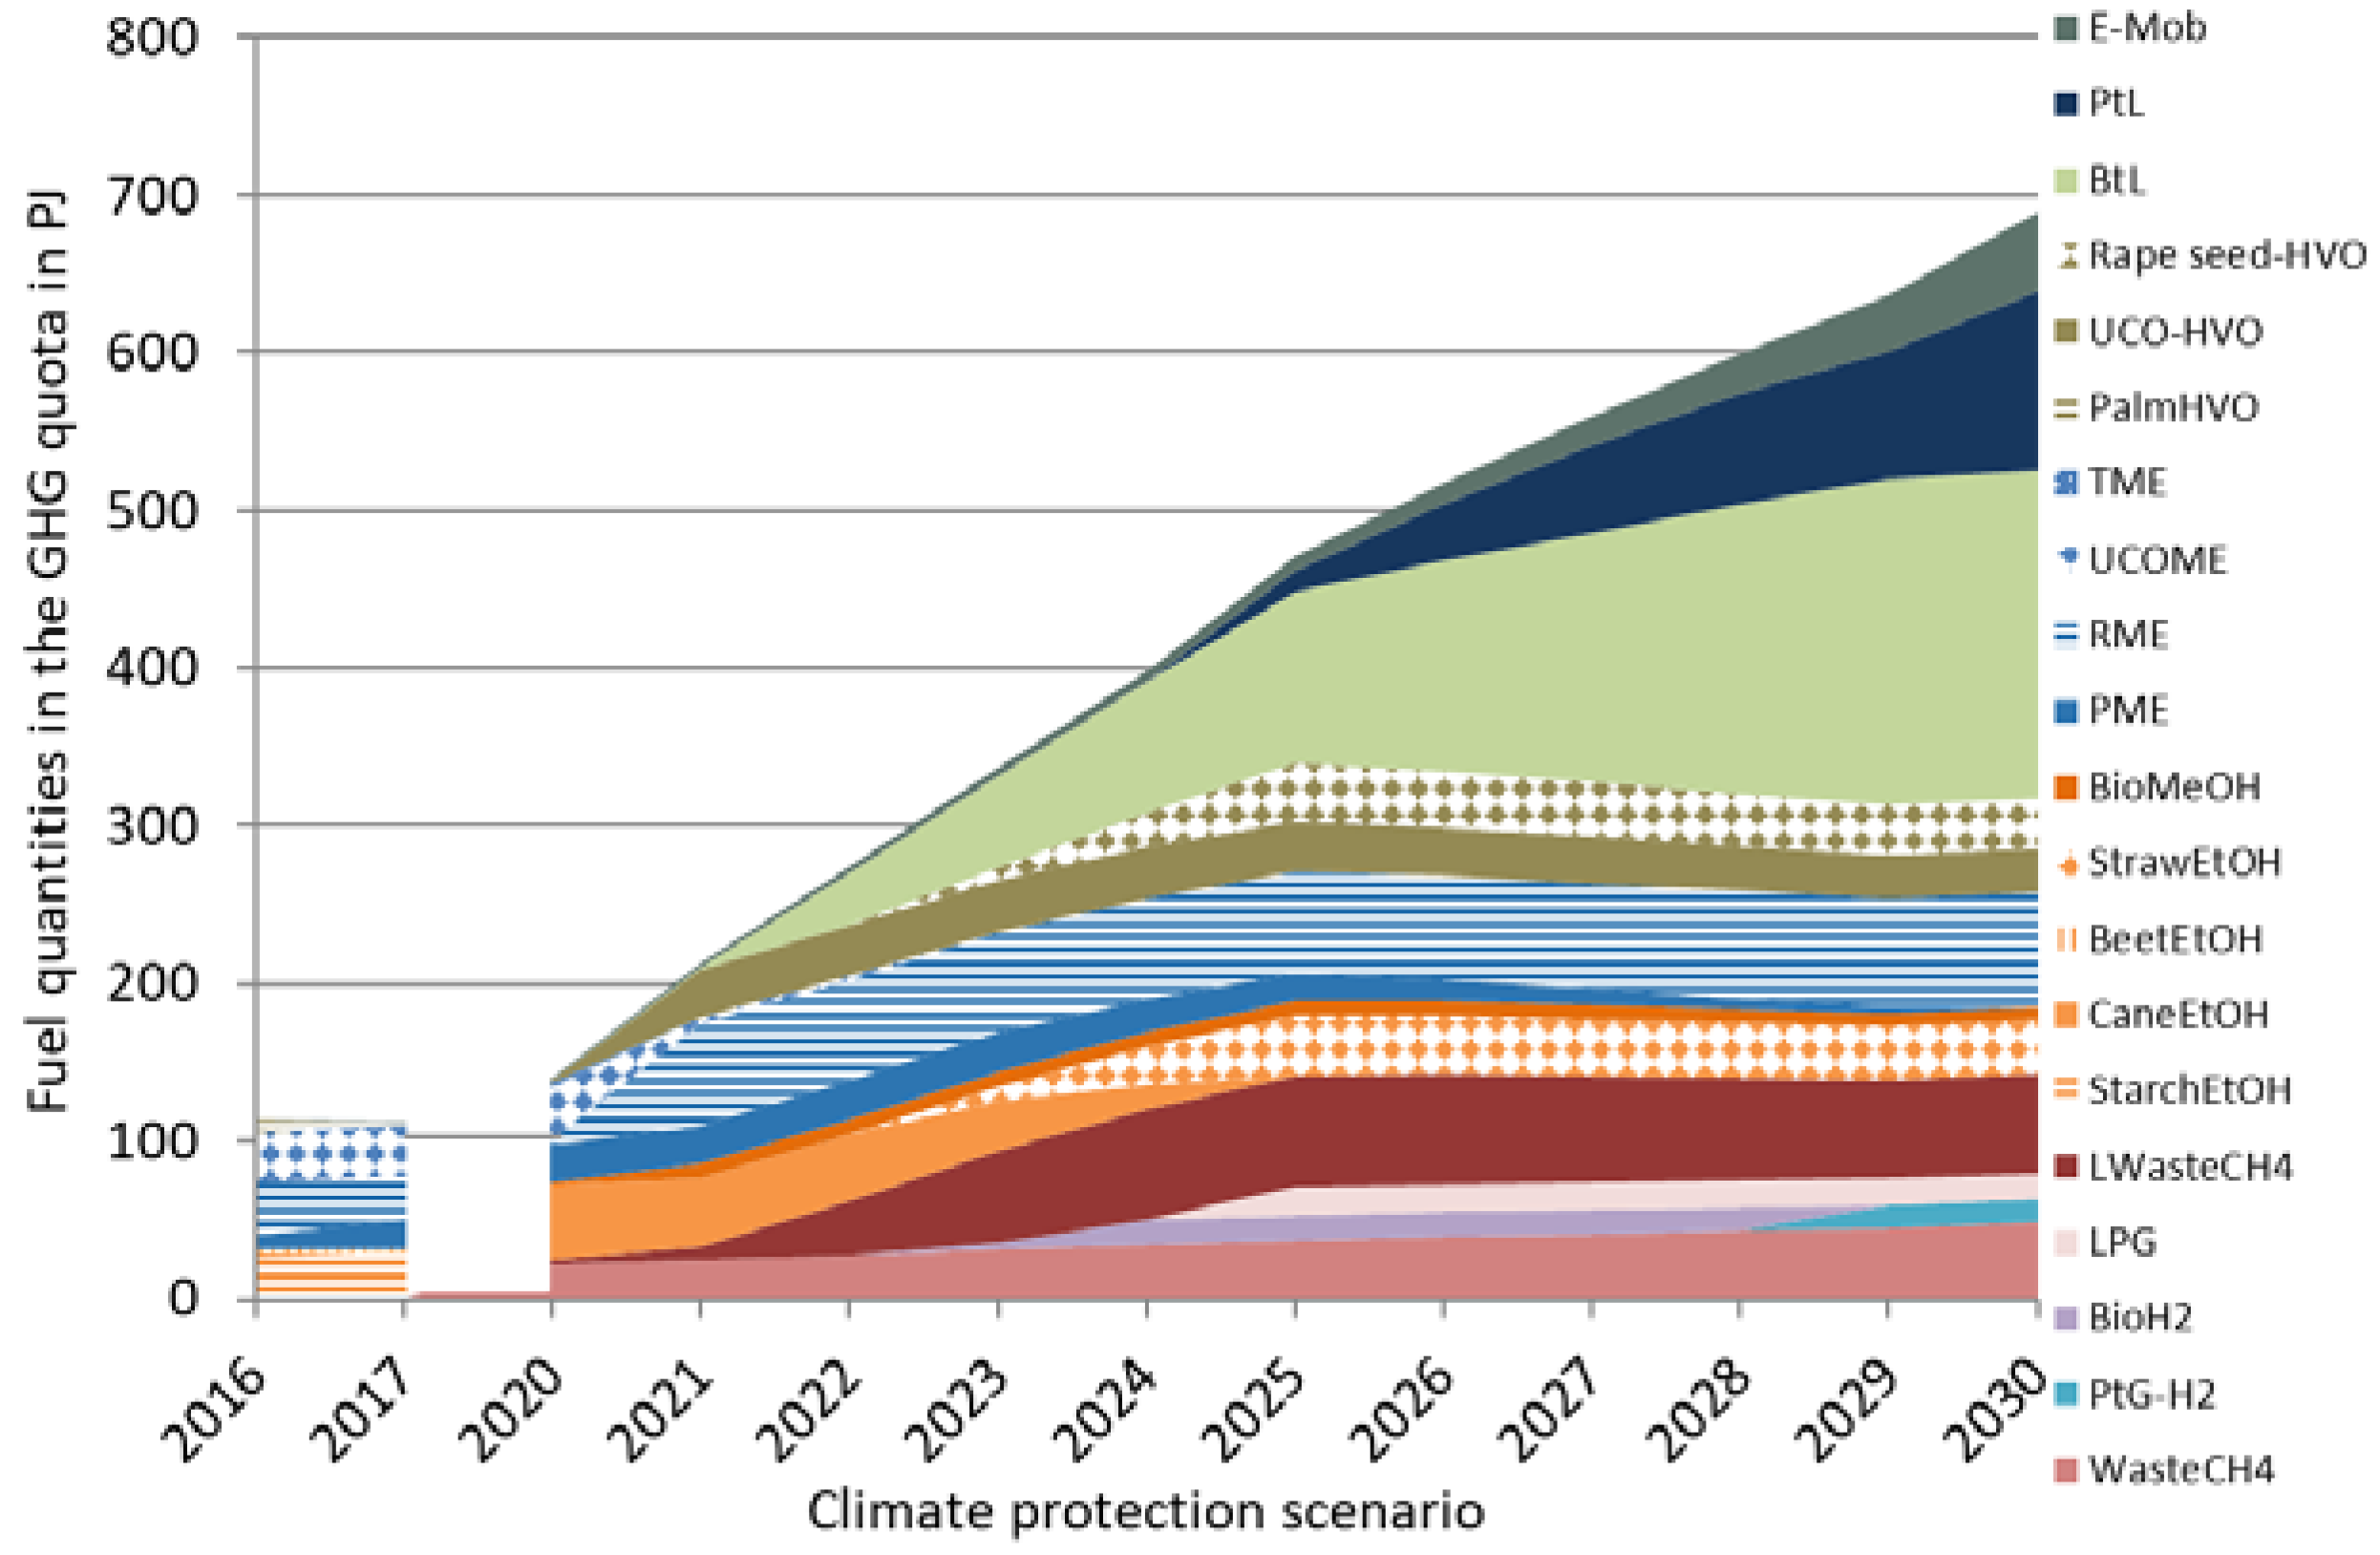
Figure 3 shows that, in addition to a strong reduction in energy consumption, the climate protection scenario requires a large number of fuel options in the mix to achieve the climate protection target. In addition, restrictions, such as biomass potential, blending walls, gas fuel demand and upper limits for conventional biofuels and feedstocks in Annex IX, Part B, are fully exploited. Even the most expensive option, PtL, appears in the mix, since it is the option with the lowest restrictions (electricity availability and blending wall) and the limits have been reached for all other fuel options. For the production of 113 PJ PtL in 2030, however, approx. 70 TWh of renewable electricity is required. This would correspond to approx. 14% of German electricity consumption in 2018 [58]. In the climate protection scenario, PtX fuels, together with electric mobility, would contribute approx. 22% (based on the energy content) in the fuel mix to meet the GHG quota in 2030.
BtL has the largest amount of fuel in the mix due to the high possible blending wall of 26% and a relatively high potential of forest residues. Figure 3 shows that plants for the production of advanced biofuels and electricity-based fuels, such as BtL, PtL and straw-ethanol plants, would have to be built and commissioned as early as 2021 in order to build up sufficient capacity by 2030. Sugarcane ethanol will no longer appear in the mix from 2025, as straw ethanol is the best unrestricted non-food and non-feed-based option for gasoline. The area under cultivation is used for growing rapeseed for biodiesel and HVO production. In total, the renewable energy share in transport in the climate protection scenario is 40%. With a total 689 PJ of fuels in the GHG quota in 2030 (2017: 112 PJ, see Figure 3) and the optimum fuel mix, the climate protection targets for transport by 2030 could be achieved. The largest share of GHG reductions is achieved by reducing the final energy consumption in transport and using advanced biofuels (Figure 4). A smaller share of GHG reduction is achieved through the use of PtL, followed by the use of fuel from food and feed plants, electric mobility and fuels from used cooking oils (UCOME) and animal fats (TME).

3.3. Results of the Other Scenarios

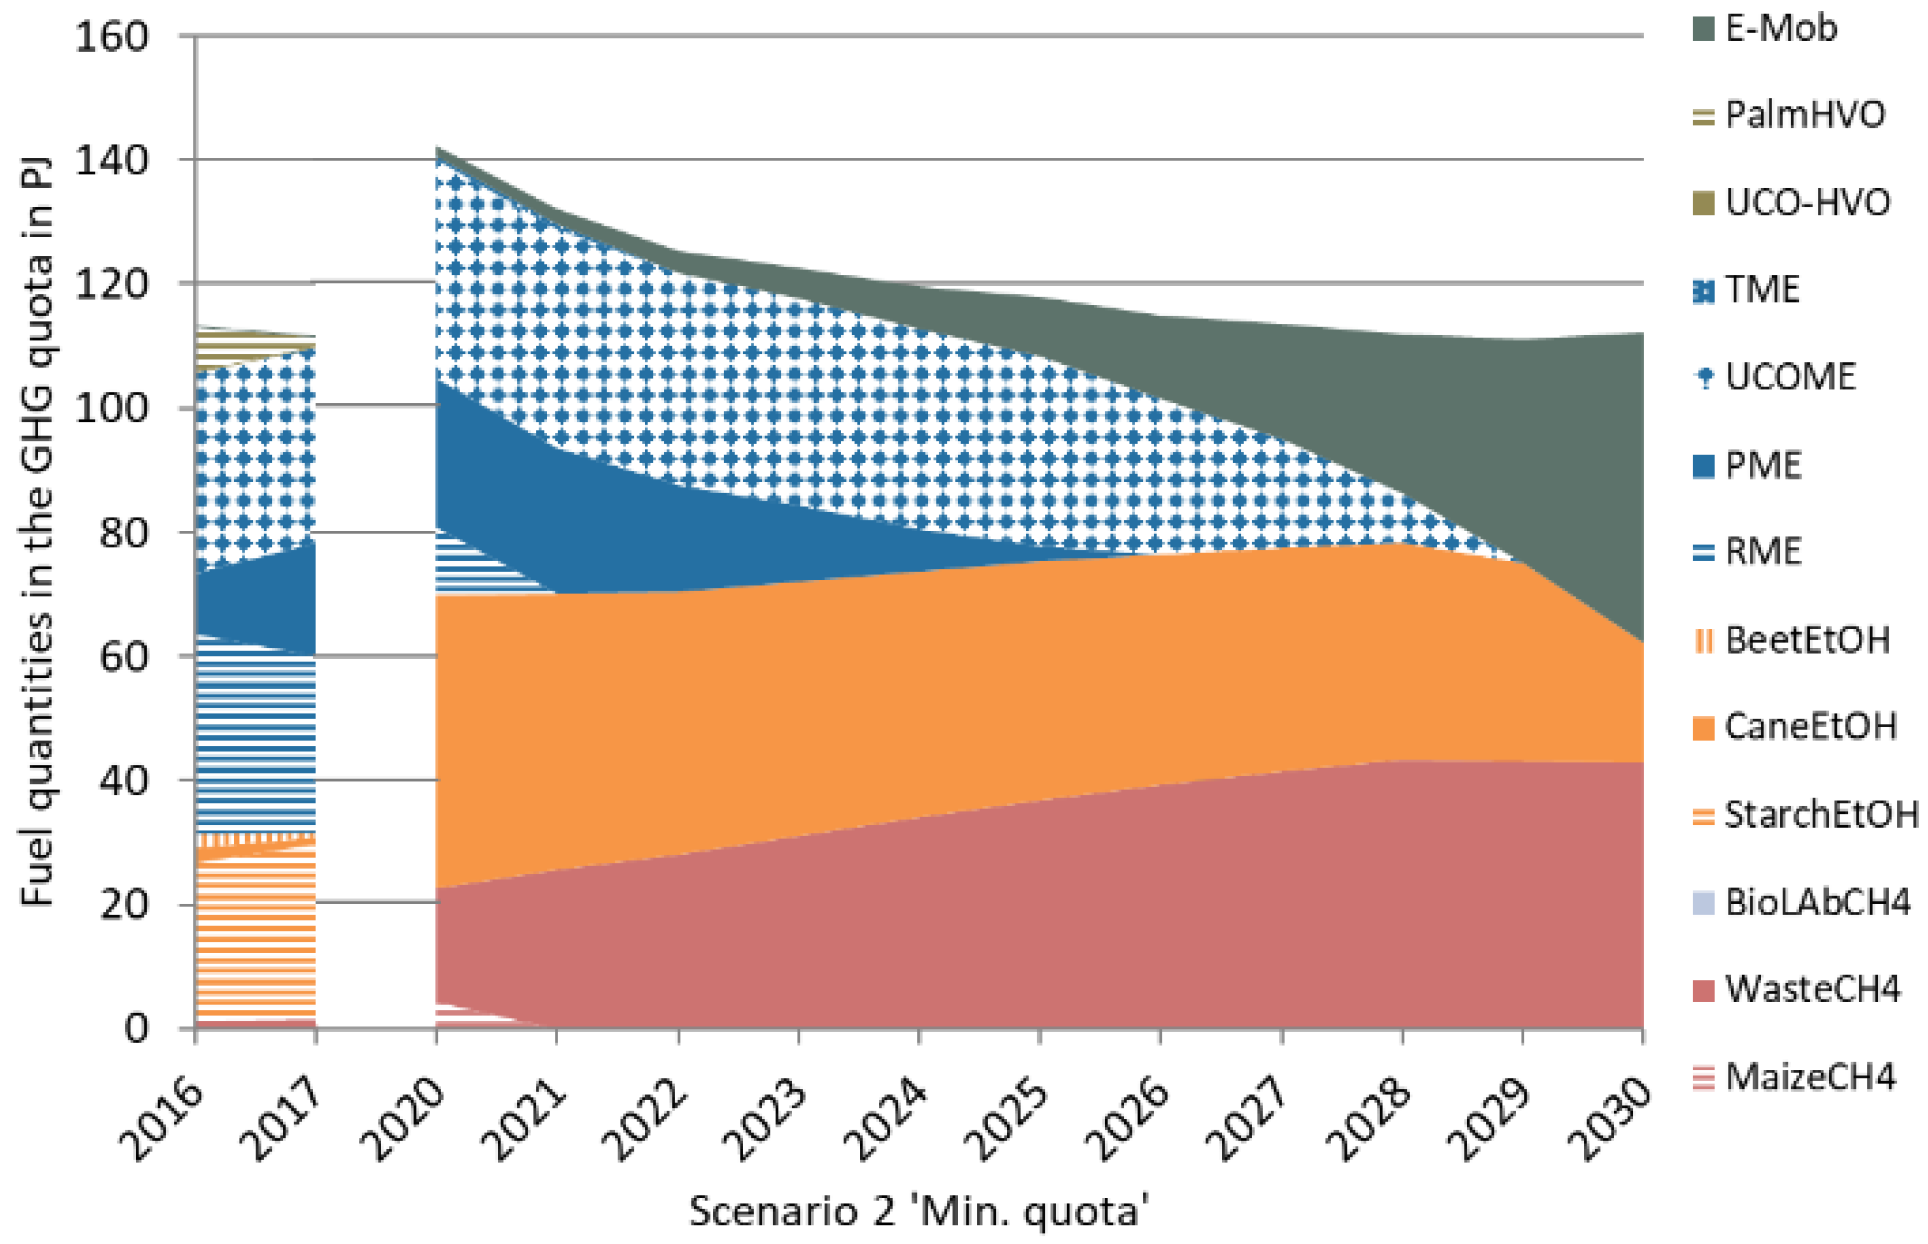
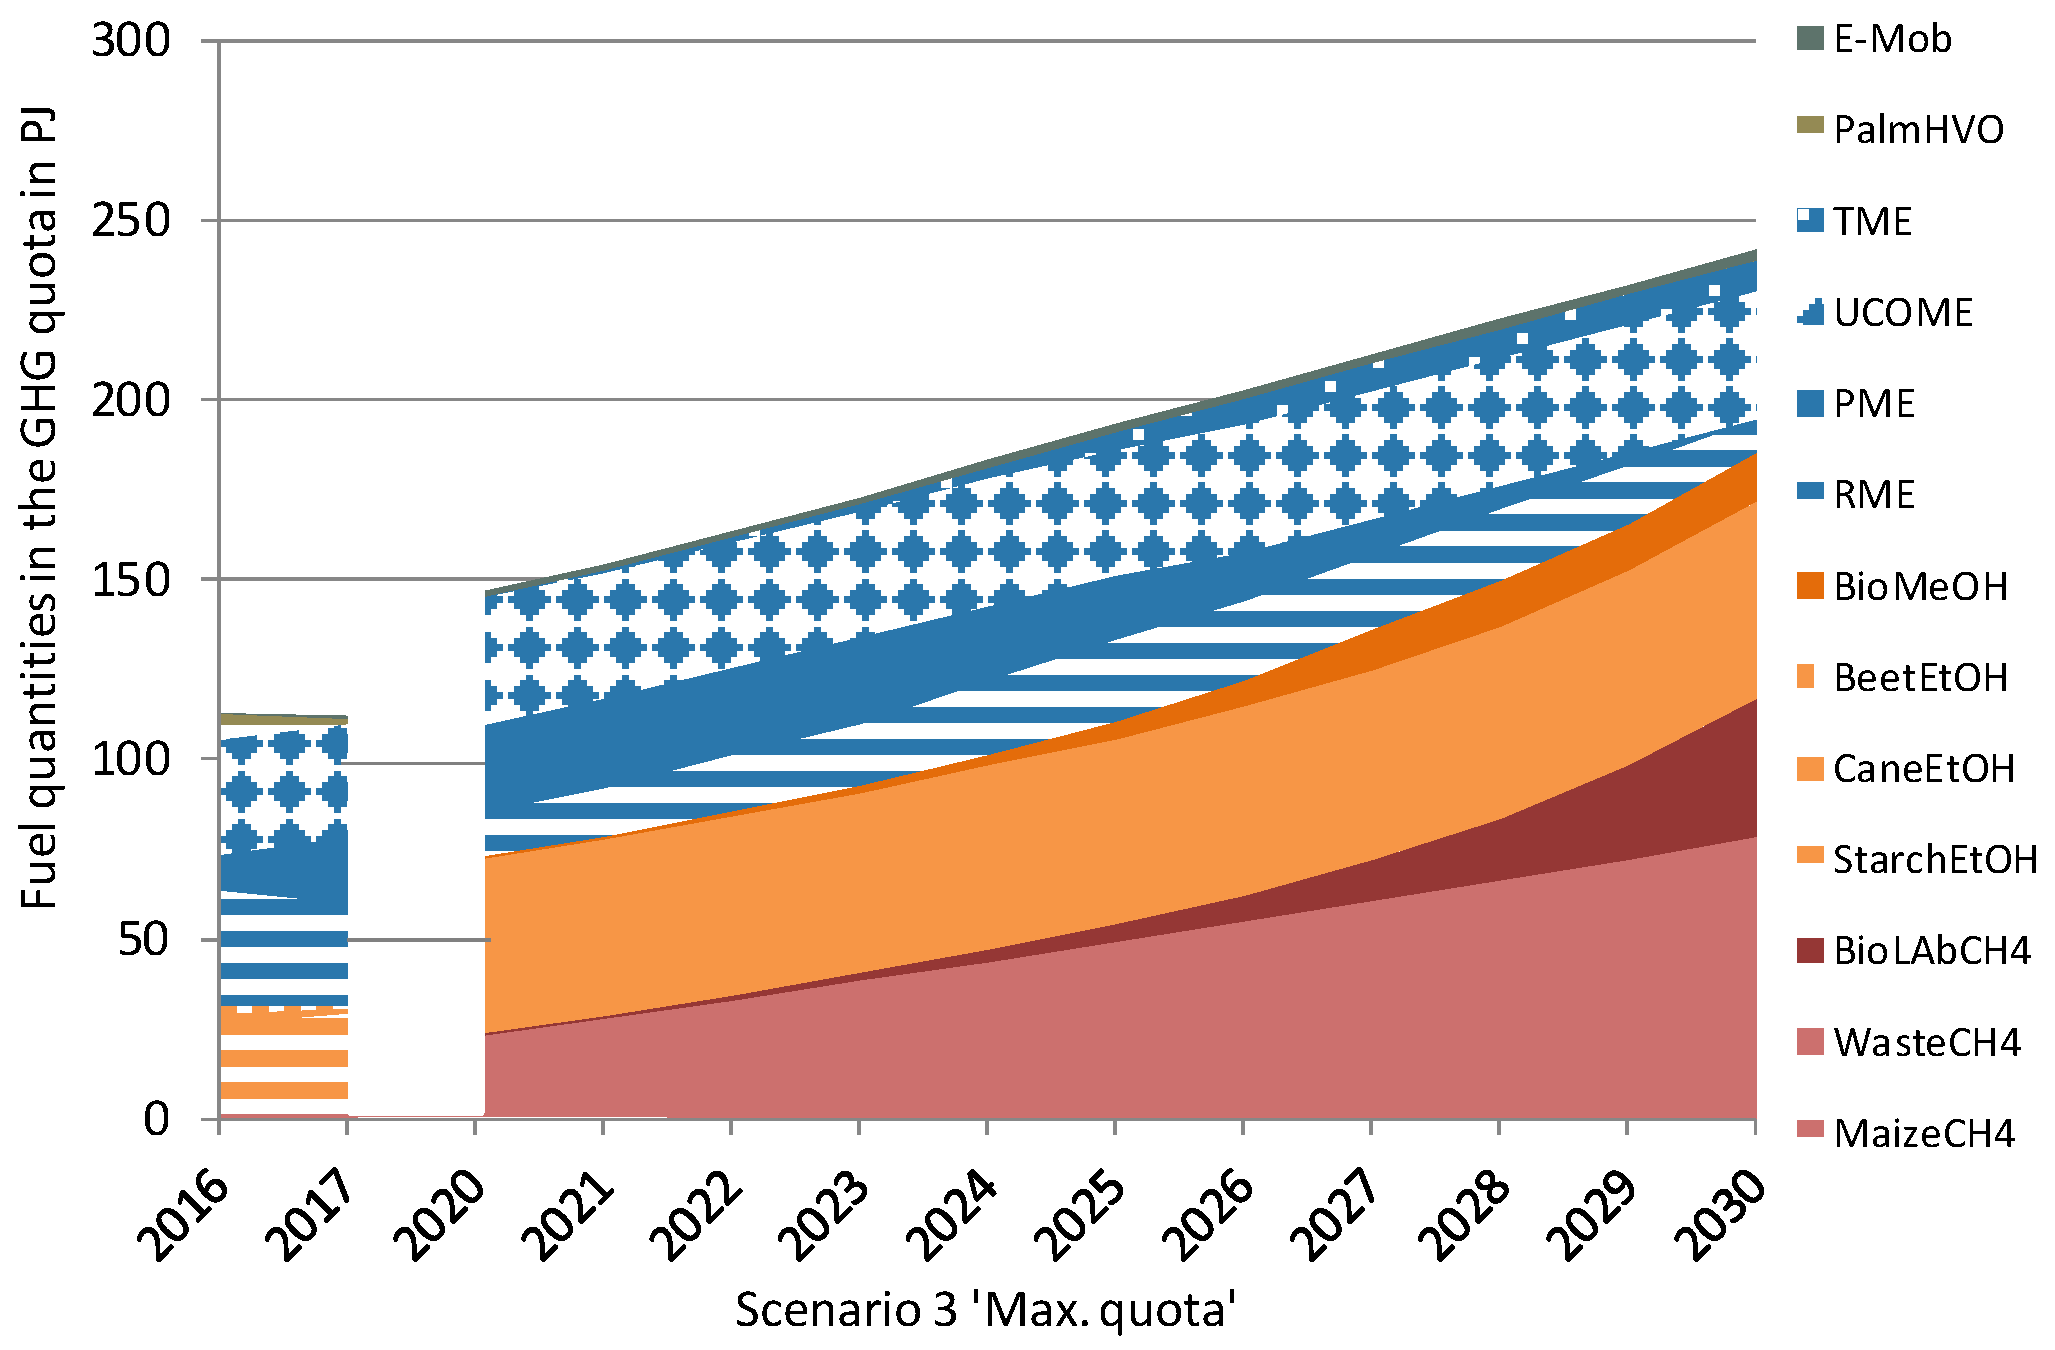
If the baseline scenario is varied by increasing electric mobility to 10 million electric vehicles by 2030 and greatly reducing the final energy consumption, thus minimising the GHG quota for biofuels, PtX and fossil fuels to 3.5% (Scenario 2, see Figure 5), only the two most competitive options, biomethane from residual and waste materials and sugarcane ethanol, would need to remain in the fuel mix alongside electric mobility in 2030. If, on the other hand, the proportion of electric mobility remains relatively low at 600,000 electric vehicles in 2030, and the final energy consumption rises by 2030, the GHG quota for biofuels, electricity-based and fossil fuels would rise to 8.1% under the RED II conditions (Scenario 3, Figure 6). In the higher GHG quota, liquefied biomethane from residual and waste materials, biomethanol as well as additional quantities of TME and RME would be represent in the optimal fuel mix until 2030, in addition to the quantities in the baseline scenario.
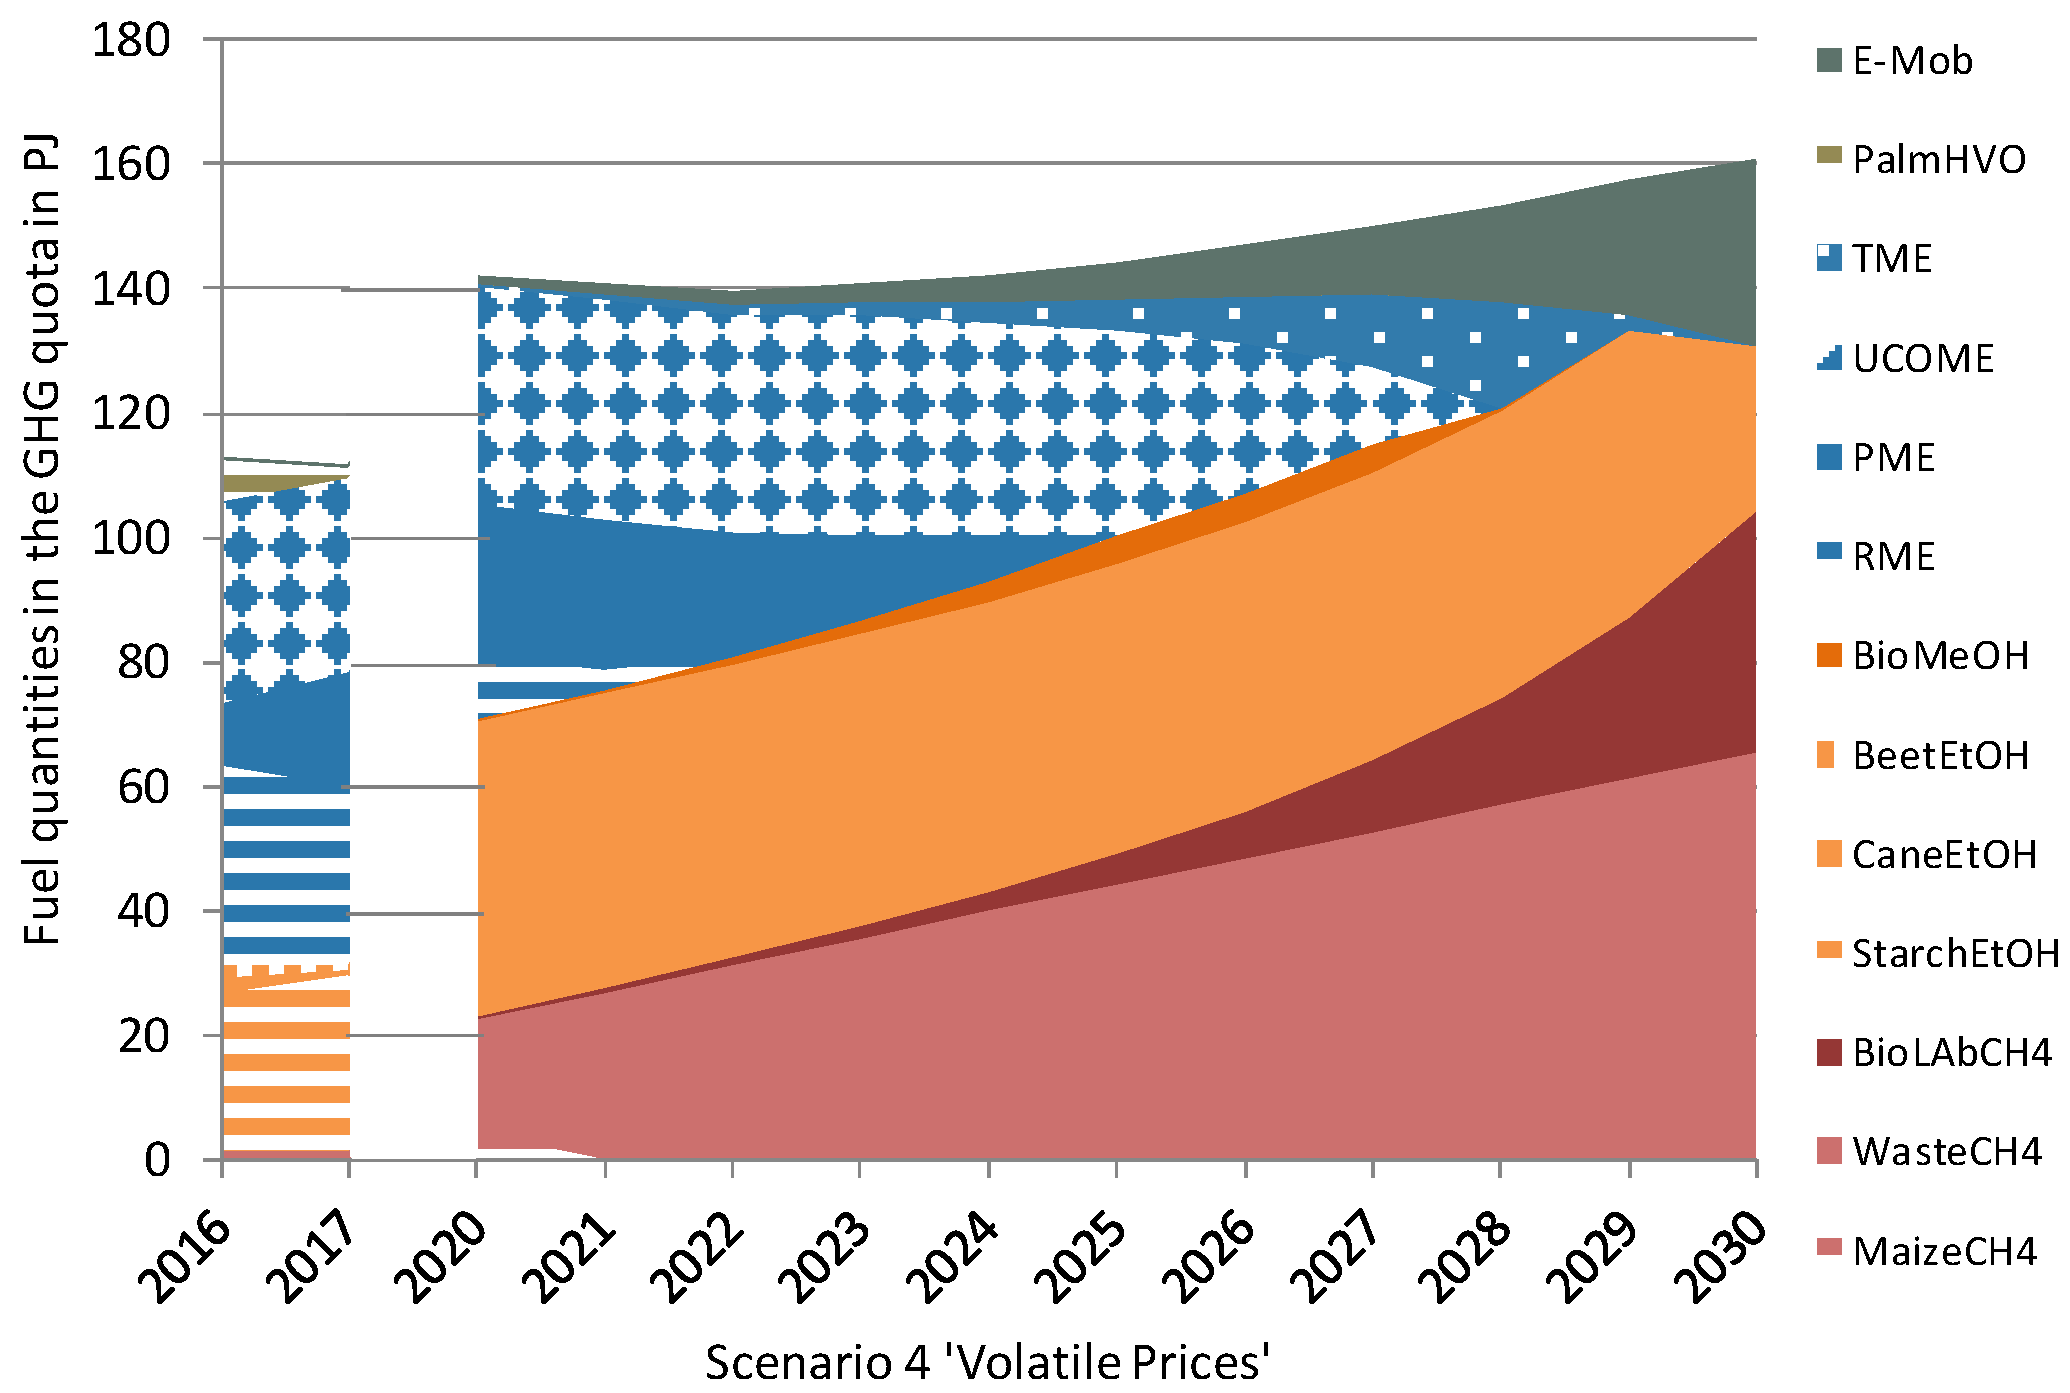
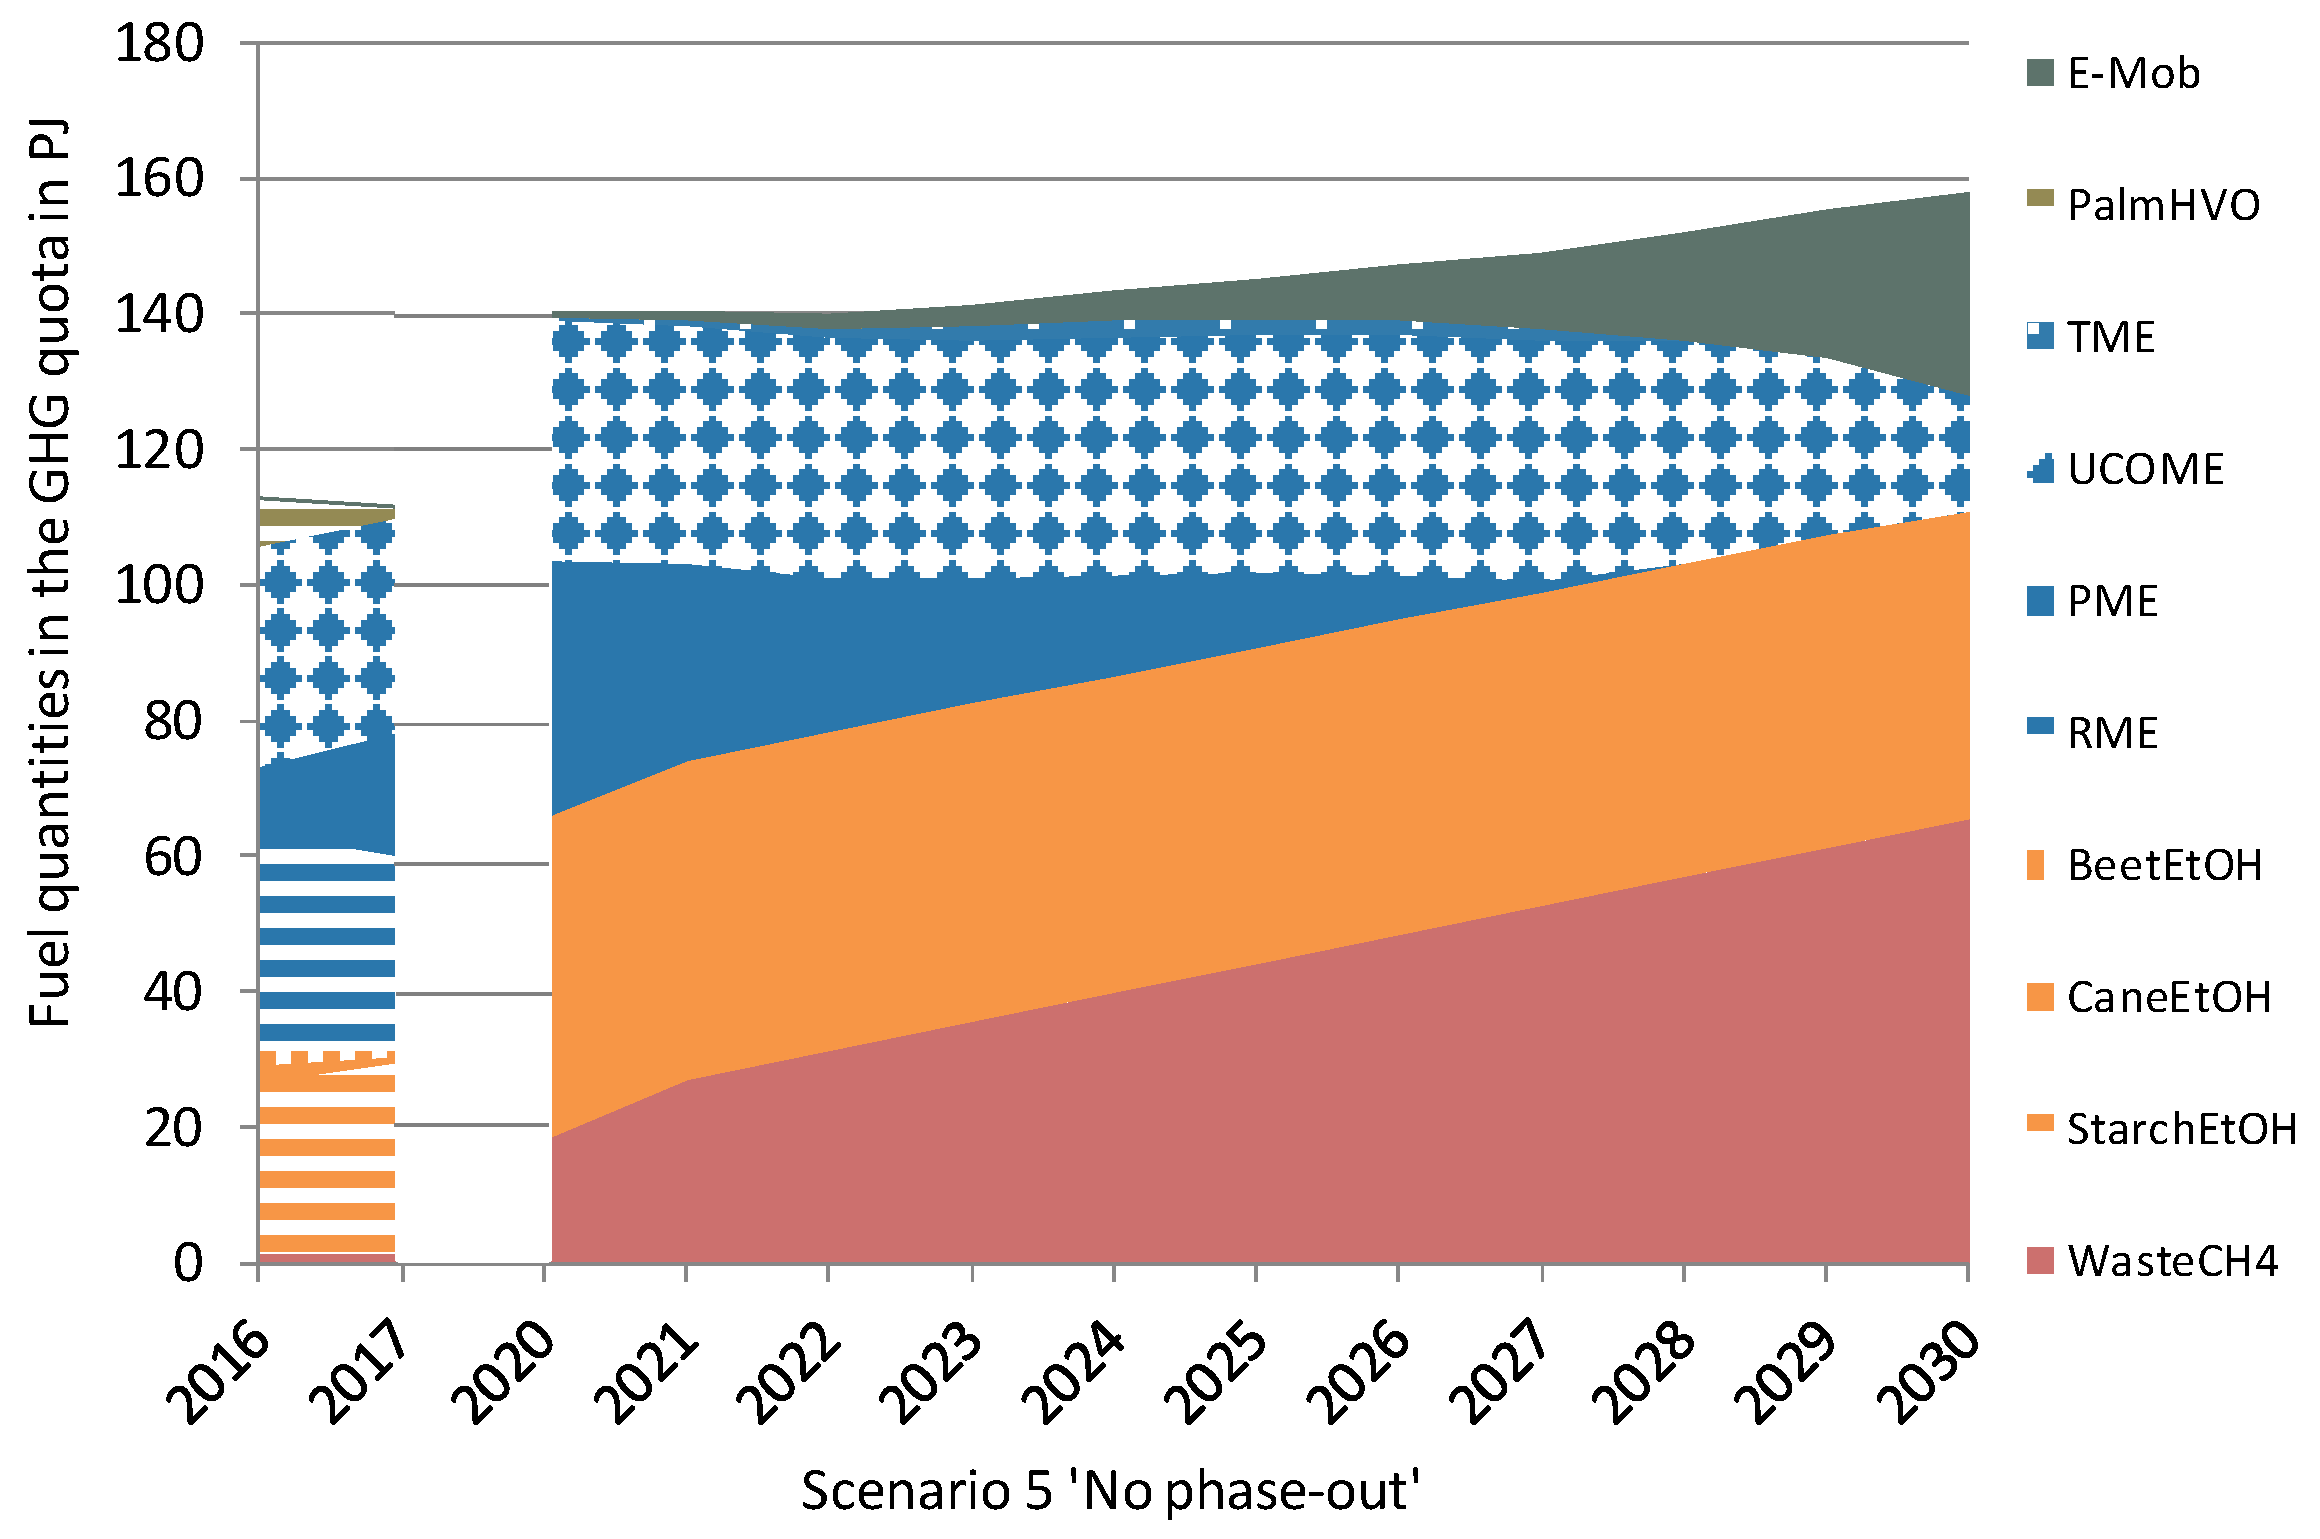
If the baseline scenario is varied via increases in feedstock prices, e.g., 5% for cultivated biomass, straw and used cooking oils, 2.5% for animal fats and forest residues and a constant price for residual and waste materials for biomethane production (Scenario 4, see Figure 7), the fuel mix changes compared to the baseline scenario. In this case, liquefied biomethane from residual and waste materials, biomethanol and larger quantities of TME also appear. If it is assumed, contrary to the baseline scenario, that a phase-out of palm oil-based fuels cannot be legally enforced (Scenario 5, see Figure 8), RME, which appears alongside PME in the baseline scenario from 2020 to 2023, would now be displaced by the more competitive PME. From 2027, PME is no longer competitive compared with biomethane from residues and waste materials, sugarcane ethanol and UCOME, and is eliminated from the mix even without a politically forced phase-out.
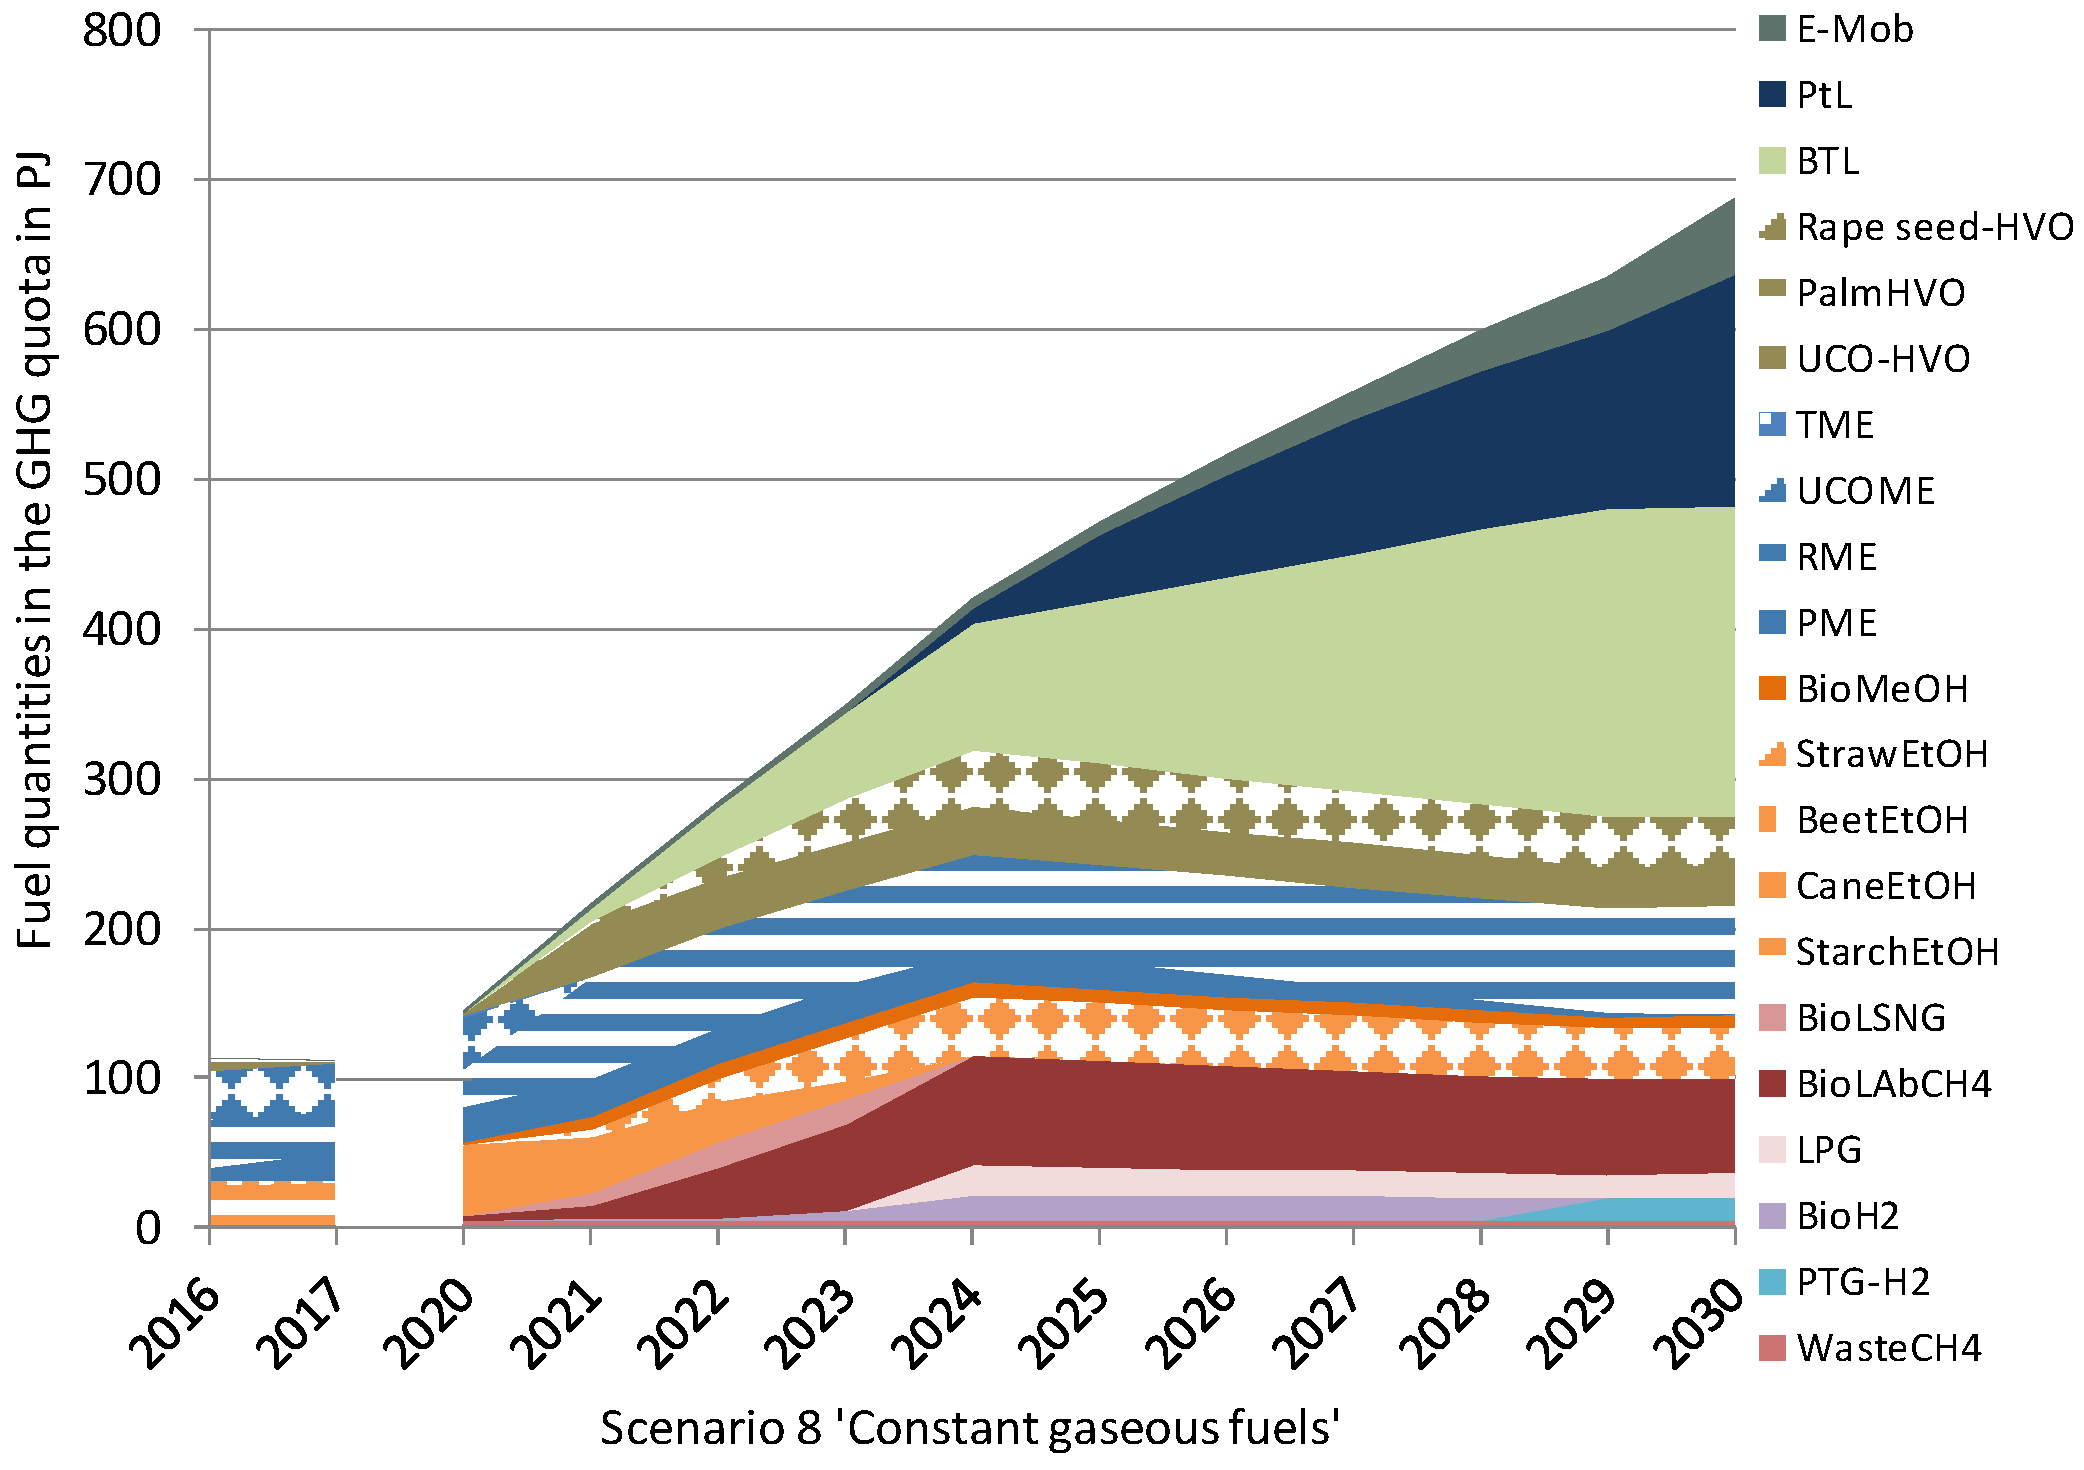
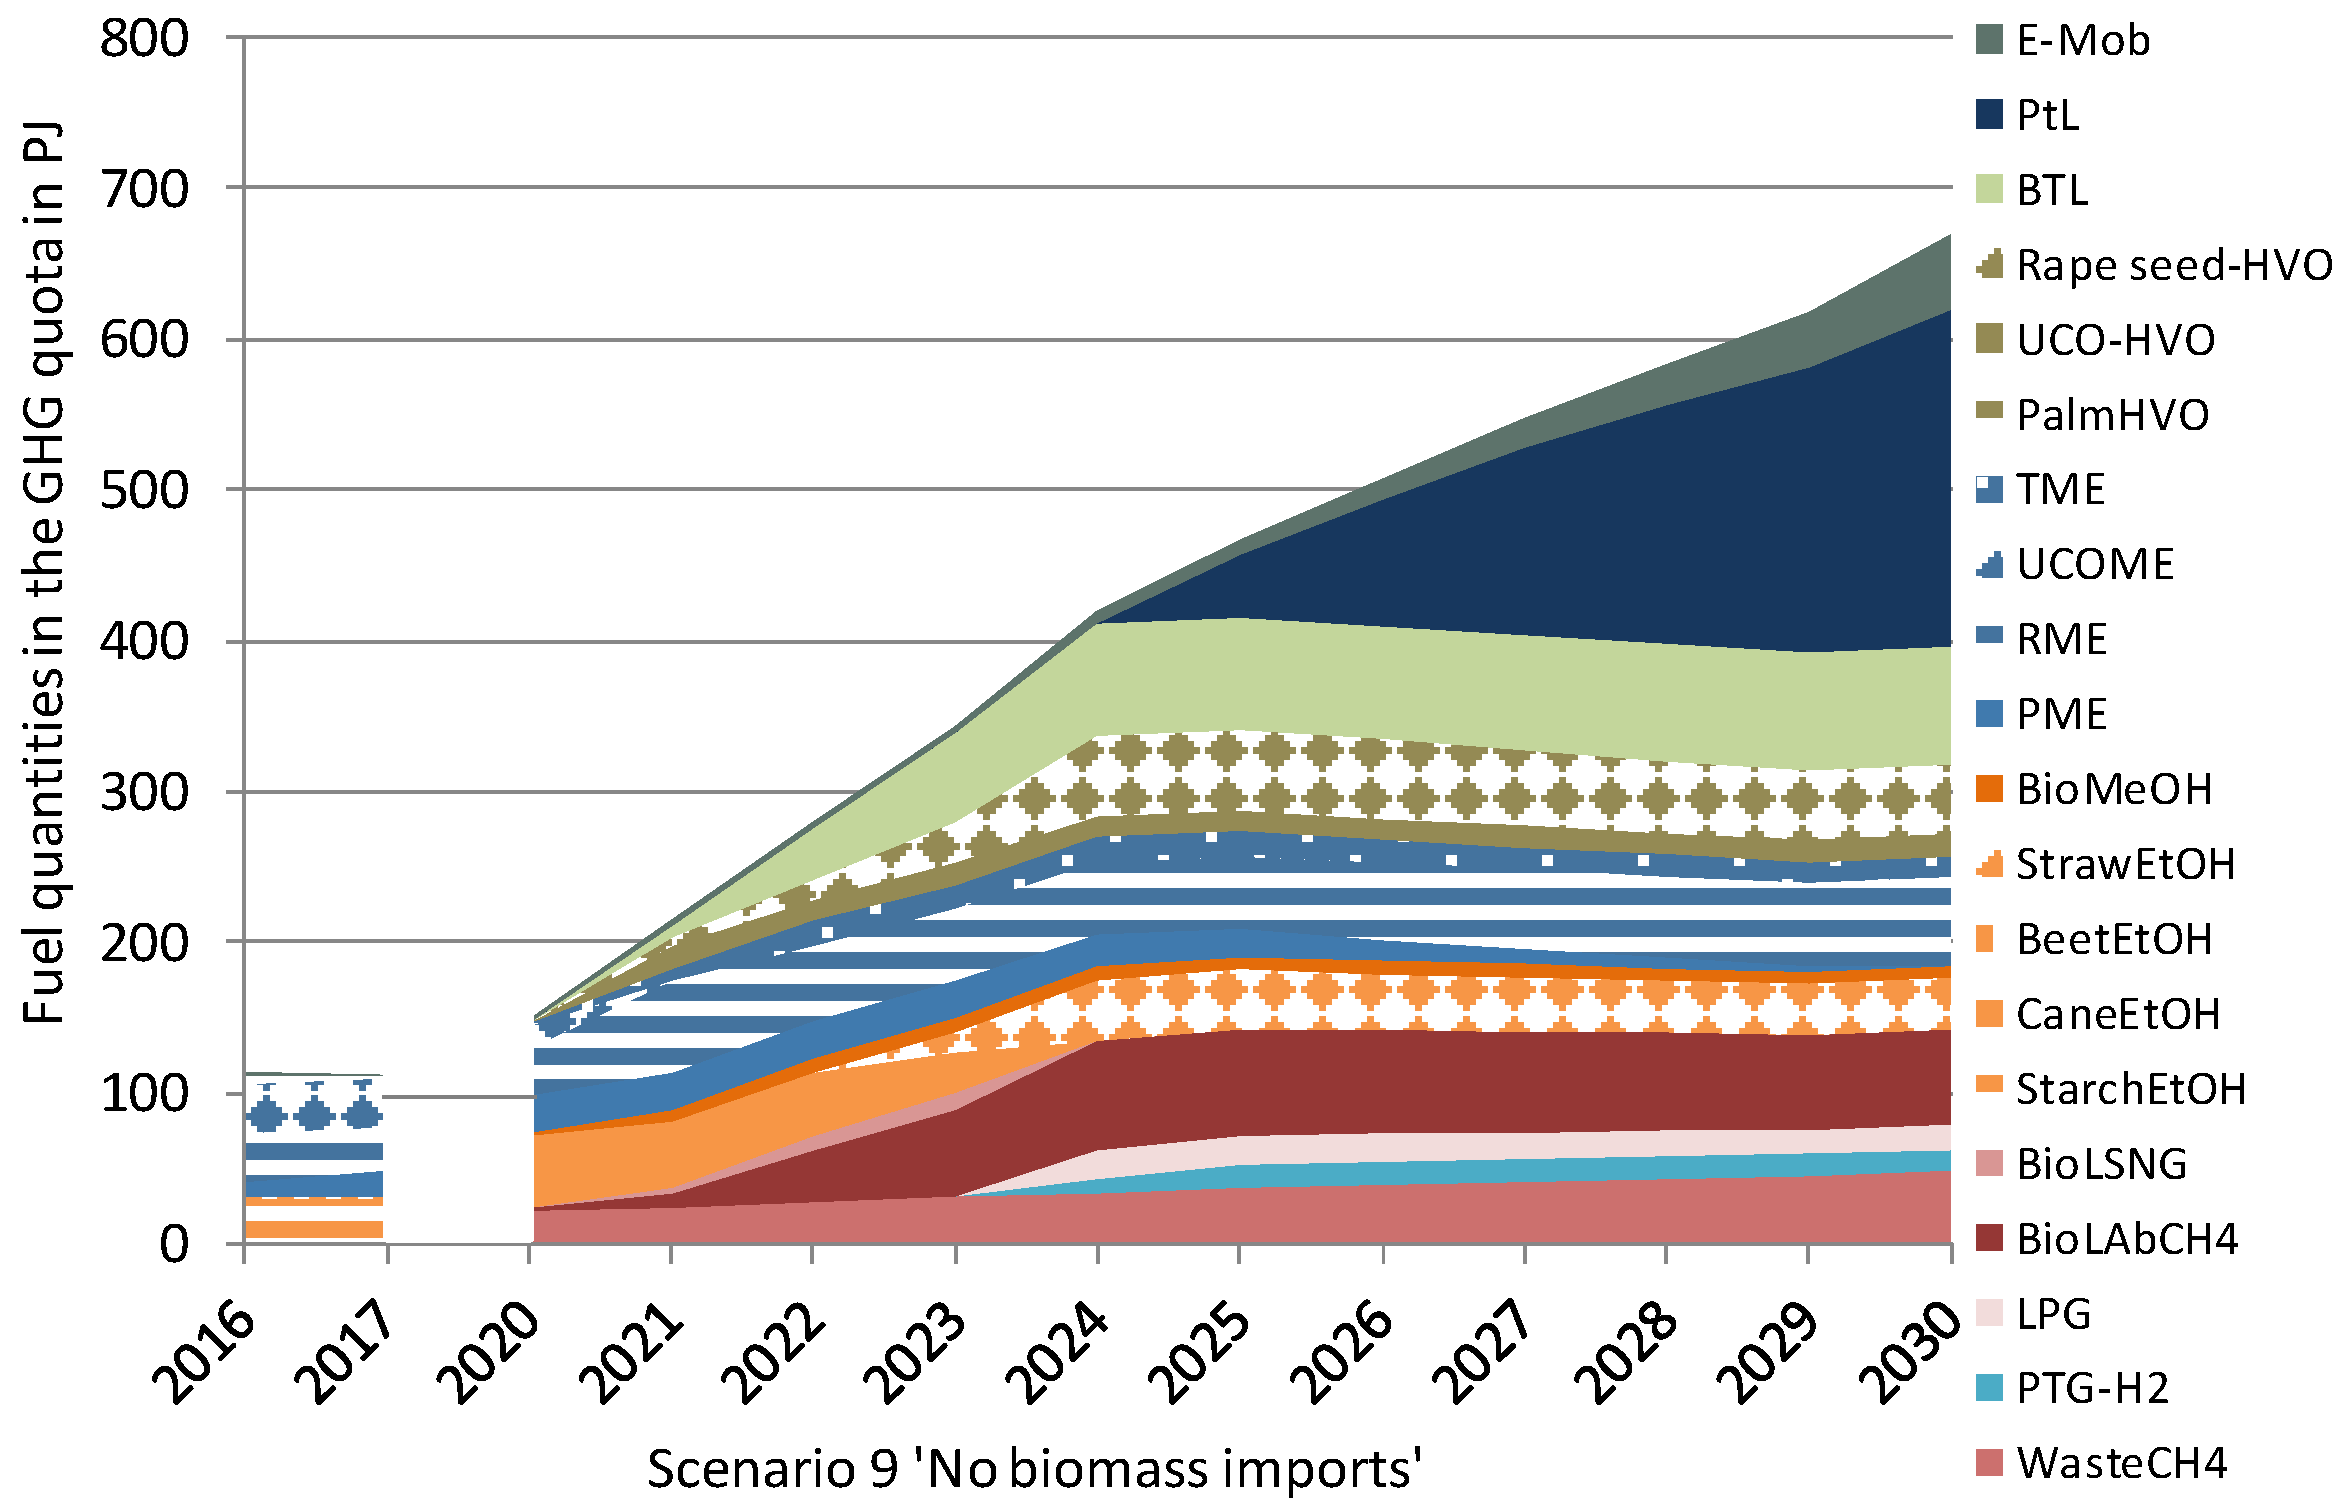
If the climate protection scenario is varied by removing the current blending walls for methanol, ethanol, FAME and HVO/BtL/PTL (Scenario 7, see Figure 9), the climate protection target is much easier to achieve. The more competitive ethanol/methanol options would then prevail over less competitive diesel, HVO and BtL options. If the climate protection scenario is varied differently by keeping the current methane gas share in transport constant at 0.25% [6] (Scenario 8, see Figure 10), biomethane from waste and residual materials would be replaced by PtL, as all other options are limited by their biomass potential or blending walls. If only indigenous biomass is used in the climate protection scenario (import of electricity from favoured areas is still possible) (Scenario 9, see Figure 11), lower amounts of BtL would be in the fuel mix due to the lower amount of forest residues available. PtL would fill this gap. This would require 138 TWh of renewable electricity (equivalent to 27% of the electricity consumption in Germany in 2018 [58]). The lower available potentials of used cooking oil lead to lower UCO–HVO quantities compared to the climate protection scenario. Higher rapeseed-based HVO volumes will replace these. Due to the upper limit for conventional biofuels, this reduces the amount of RME. In return, more TME would be present in the optimal fuel mix by 2030.

4. Discussions

The scenarios show the potential range of future renewable fuel mixes in transport in Germany under RED II and climate protection targets.
Scenarios 1–5 show the low ambitions of the RED II targets. Only relatively small quantities of renewable energies are sufficient to reach the 14% minimum share. Due to the possibilities of multiple crediting for some renewable fuel options, a share of 6.6% of renewable energies is sufficient to achieve the RED target in the base scenario. If, as in the baseline scenario and Scenarios 2–5, only the minimum RED II requirement of 14% renewable energies in the transport sector is set as the target, the German climate protection target (a 40–42% reduction in GHG emissions compared with 1990) will, by a large margin, not be reached. However, it should be mentioned that the RED II was adopted as part of the European Clean Energy Package, aiming at increasing the share of renewable energies throughout Europe. It was not primarily focused on achieving climate protection targets. Until 2020, the reduction of GHG emissions in the transport sector is regulated by the FQD [12]. However, a recast analogue to the RED has not yet taken place, but the EU Commission’s proposal for a European Climate Law is currently under discussion.
For achieving the climate protection target of at least a 40% GHG reduction (Scenarios 6–9), the final energy consumption in transport must be significantly reduced. Furthermore, a very high GHG quota (34.5% or 32.5% with or without UER measures and electricity in rail transport, respectively) and ca. 40% of renewable energies is required in transport. Furthermore, under the given frame of conditions, the use of (almost) all fuel options is necessary. PtX-fuels and electric mobility alone are far from sufficient, even with optimistic expansion paths. As it is shown in the results, advanced (bio)fuel production plants, including BtL/PtL, must be built and put into operation by 2021, at the latest, in order to have sufficient capacity by 2030. Even the use of the most expensive option (PtL) is required. Due to the lack of sub-quota in RED II, it requires separate funding. Even the sub-quota in the thirty-eighth Federal Emissions Control Act [27], which is open for PtX in Germany, is not sufficient without further incentives. The results also show that the import of biogenic waste materials and/or renewable electricity from favoured areas will be necessary in order to achieve the climate protection targets in Germany. In addition, it is necessary to develop the methane gas market, and/or where appropriate, to raise the blending walls above the current fuel standards.
For PtX, the input power for the electrolysis process needs to be almost fully renewable in order to achieve a GHG benefit compared to its fossil fuel counterparts. If imports are assumed to not play a significant role, national PtX would be the main compensating option, for which the renewable power capacities set the limit. Renewable power is most efficiently used directly in the power grid and, therefore, surplus power that could otherwise not be utilized in the power grid would be the main source for PtX. In order for this option to play a significant role, a substantial increase in wind and solar power capacity would be required, and it is questionable whether sufficiently large national surplus power capacities are available for producing fuels before 2030.
Assuming a lower demand for biogas in the electricity sector due to lower electricity production costs for renewable electricity from wind and solar, the biogas potential, together with the high GHG reduction potentials, could be used for rapid decarbonisation in the transport sector. This is a further argument for increasing the gas share in the transport sector.
The climate protection programme 2030 of 20 September 2019 states that the development of liquid and gaseous regenerative fuels from biomass and their large-scale production in biogas and synthesis plants should be supported in order to use them in certain segments of the transport sector in the medium and long term [10]. This must be backed very promptly with concrete investment incentives. In addition, the current instrument for climate protection in transport, the GHG quota, must be designed in such a way that conventional and advanced fuels do not lose out in competition with each other. All options are needed for climate protection.
The CO2 pricing instrument mentioned in the Climate Cabinet’s Key Issues Paper [59] is intended to make fossil fuels more expensive by adding a price premium to them and to favour and promote renewable energy sources. However, the drop-in biofuels currently on the market are blended according to currently applicable technical standards. Here, the consumer needs an alternative with no or lower shares of fossil fuels to cover their mobility demand. This would require testing the increase of blending walls or pure biofuels.
At the same time, however, it must be stressed that the model results are based on the assumptions previously described and the data used. For each fuel option, for example, only one GHG value, cost value and efficiency value was determined for the model start time. In practice, there are large ranges. Considering these, in addition to the already complex BENOPT model, would make the model results more difficult to interpret. More sensitivity analyses should be performed in future work. In addition to legal restrictions and biomass and land availability, GHG mitigation costs were the sole decisive criterion for the competitiveness of fuels within the GHG quota. In practise, other additional factors, e.g., concerning the market design and governance aspects of the future energy sector [60], promote or inhibit market entry of fuel options, which should be taken into account in further studies in the modelling. Furthermore, the fundamental availability of biomass does not mean that it can actually be mobilised fully and economically. Current research projects are also underway in this area [61,62,63]. However, in principle, this study attempted to increase the robustness of the statements in the scenarios over the range of different possible developments up to 2030.

5. Conclusions

The study shows that the RED II targets are not very ambitious. The minimum share of 14% renewable energies in the transport sector by 2030 is quite low. In addition, there is the possibility of multiple credits for some renewable fuel options. This means that a share of 6.6% of renewable energies is sufficient to achieve the RED II target in the base scenario. In Scenarios 1–5, where only the minimum requirement of the RED II was implemented, the German climate protection target is clearly missed. The climate protection targets for transport can be achieved by significantly reducing the final energy consumption while increasing the GHG quota to approx. 34.5%. As shown in Scenarios 6–9, this would require that almost all renewable fuel options be considered, to reach a share of approx. 40%.
In order to achieve the climate targets, a stable political framework is necessary. In this context, concrete investment incentives are needed from the German federal government to commercially implement the required amounts of advanced and PtX fuels. In addition, to enable a sustainable expansion of the production of PtX fuels and electric mobility, the German government must commit itself to a substantial expansion of wind and solar energy capacities. Furthermore, increased blending walls or pure biofuels could help to achieve the climate targets and would offer more sustainable alternatives for the consumers. All in all, climate targets are achievable if we use our manifold technical possibilities and if we are ready for behavioural changes, such as reducing traffic.

Supplementary Materials

The excel file named Article_energies_Meisel_Supplementary file is uploaded as supplementary material. The following are available online at https://www.mdpi.com/1996-1073/13/7/1712/s1, Table S1: InputData-Model; Table S2: S1-Scenario 1, Table S3: S2-Scenario2, Table S4: S3-Scenario3, Table S5: S4-Scenario4, Table S6: S5-Scenario5, Table S7: S6-Scenario6, TableS8: S7-Scenario7, TableS9: S8-Scenario8, Table S10: S9-Scenario9.

Author Contributions

Conceptualization, K.M., M.M., K.N., S.M., D.T. and F.M.-L.; methodology, M.M., K.N. and K.M.; data curation, M.M., K.M., K.N., F.M.-L. and S.M.; formal analysis, K.M., M.M. and K.N.; validation, F.M.-L., S.M., D.T.; writing—original draft preparation, K.M., M.M. and F.M.-L.; writing—review and editing, K.M., M.M., S.M., F.M.-L. and D.T.; visualization, M.M. and K.M.; supervision: S.M., F.M.-L. and D.T.; project administration, K.M. All authors have read and agreed to the published version of the manuscript.

Funding

This research was funded by the Federal Ministry of Food and Agriculture (BMEL: 22401416).

Acknowledgments

We gratefully acknowledge Katrina Chan for language support and three anonymous reviewers for helpful remarks.

Conflicts of Interest

The authors declare no conflict of interest. The funder had no role in the design of the study; in the collection, analyses or interpretation of data; in the writing of the manuscript, or in the decision to publish the results.

References

  1. International Panel of Climate Change. Summary for Policymakers. In Global Warming of 1.5 °C. an IPCC Special Report on the Impacts of Global Warming of 1.5 °C above Pre-Industrial Levels and Related Global Greenhouse Gas Emission Pathways, in the Context of Strengthening the Global Response to the Threat of Climate Change, Sustainable Development, and Efforts to eradicate Poverty; International Panel of Climate Change: Geneva, Switzerland, 2018. [Google Scholar]
  2. International Panel of Climate Change. Climate Change and Land: An IPCC Special Report on Climate Change, Desertification, Land Degradation, Sustainable Land Management, Food Security, and Greenhouse Gas Fluxes in Terrestrial Ecosystems, Summary for Policy Makers; International Panel of Climate Change: Geneva, Switzerland, 2019. [Google Scholar]
  3. United Nations. Paris Agreement; United Nations: New York, NY, USA, 2015. [Google Scholar]
  4. Agora Energiewende. The German Power Market: State of Affairs in 2019; Agora Energiewende: Berlin, Germany, 2020. [Google Scholar]
  5. Federal Ministry for the Environment, Nature Conservation and Nuclear Safety. Climate Protection in Figures: The Transport Sector; Federal Ministry for the Environment, Nature Conservation and Nuclear Safety: Bonn, Germany, 2019. [Google Scholar]
  6. Federal Ministry of Transport and Digital Infrastructure. Transport in Figures 2019/2020. 48. Jahrgang; Federal Ministry of Transport and Digital Infrastructure: Berlin, Germany, 2019. [Google Scholar]
  7. European Parliament and Council of the European Union. Directive (EU) 2018/2001 of the European Parliament and of the Council of 11 December 2018 on the Promotion of the Use of Energy from Renewable Sources (Recast): RED II; European Parliament and Council of the European Union: Brussels, Belgium, 2018.
  8. European Parliament and Council of the European Union. Regulation (EU) 2018/842 of the European Parliament and of the Council of 30 May 2018 On binding Annual Greenhouse Gas Emission Reductions by Member States from 2021 to 2030 Contributing to Climate Action to Meet Commitments under the Paris Agreement and amending Regulation (EU) No 525/2013; European Parliament and Council of the European Union: Brussels, Belgium, 2018.
  9. Federal Ministry for the Environment, Nature Conservation and Nuclear Safety. Climate Protection Plan 2050: Climate Protection Policy Principles and Goals of the Federal Government; Federal Ministry for the Environment, Nature Conservation and Nuclear Safety: Bonn, Germany, 2016. [Google Scholar]
  10. Federal Ministry for the Environment, Nature Conservation and Nuclear Safety. Climate Protection Programme 2030 of the Federal Government to implement the Climate Protection Plan 2050; Federal Ministry for the Environment, Nature Conservation and Nuclear Safety: Bonn, Germany, 2019. [Google Scholar]
  11. European Parliament and Council of the European Union. Directive 2009/28/Ec of the European Parliament and of the Council of 23 April 2009 on the Promotion of the use of Energy from Renewable Sources and Amending and Subsequently Repealing Directives 2001/77/EC and 2003/30/EC; European Parliament and Council of the European Union: Brussels, Belgium, 2009.
  12. European Parliament and Council of the European Union. Directive 2009/30/ec of the European Parliament and of the Council of 23 April 2009 Amending Directive 98/70/EC as Regards the Specification of Petrol, Diesel and Gas-Oil and Introducing a Mechanism to Monitor and Reduce Greenhouse gas Emissions and Amending Council Directive1999/32/EC as Regards the Specification of Fuel Used by Inland Waterway Vessels and Repealing Directive 93/12/EEC; European Parliament and Council of the European Union: Brussels, Belgium, 2009.
  13. Naumann, K.; Schröder, J.; Müller-Langer, F.; Oehmichen, K.; Remmele, E.; Thundeke, K.; Etzold, H.; Rakshy, T.; Schmidt, P. Monitoring Biokraftstoffsektor, 4th ed.; DBFZ Deutsches Biomasseforschungszentrum gemeinnützige GmbH: Leipzig, Germany, 2019. [Google Scholar]
  14. Deutsche Energie-Agentur GmbH. Dena Study. Integrated Energy Transition: Impulses to Shape the Energy System up to 2050, Report of the Results and Recommended Course of Action; Deutsche Energie-Agentur GmbH. Dena Study: Berlin, Germany, 2018. [Google Scholar]
  15. Leopoldina; acatech; UNION der Deutschen Akademien der Wissenschaften; BDI; Dena. Focusing Expertise, Shaping Policy—Energy transiTion Now! Essential Findings of the Three Baseline Studies into the Feasibility of the Energy Transition by 2050 in Germany. 2019. Available online: https://www.dena.de/fileadmin/dena/Dokumente/Themen_und_Projekte/Energiesysteme/dena-Leitstudie/2019-08-28_Studienvergleich_ENG.pdf (accessed on 2 April 2020).
  16. Öko-Institut e.V.; Fraunhofer ISI. Climate Protection Scenario 2050; Öko-Institut e.V.: Freiburg, Germany, 2016. [Google Scholar]
  17. Leopoldina; acatech; UNION der Deutschen Akademien der Wissenschaften. Coupling the Different Energy Sectors—Options for the Next Phase of the Energy Transition; 2018; Available online: https://energiesysteme-zukunft.de/en/publications/position-paper/coupling-the-different-energy-sectors/ (accessed on 2 April 2020).
  18. Boston Consulting Group (BCG), Prognos. Climate Paths for Germany; Boston Consulting Group (BCG), Prognos: Boston, MA, USA, 2018. [Google Scholar]
  19. Agora Energiewende. Climate Protection in Transport: Measures to Achieve the Sectoral Target for 2030; Agora Energiewende: Berlin, Germany, 2018. [Google Scholar]
  20. European Commission. EU Reference Scenario 2016: Energy, Transport and GHG Emissions, Trends to 2050; European Commission: Brussels, Belgium, 2016. [Google Scholar]
  21. Öko-Institut, e.V.; DLR; IFEU; INFRAS AG. RENEWBILITY III: Options for Decarbonising the Transport Sector; Öko-Institut e.V.: Freiburg, Germany, 2016. [Google Scholar]
  22. Umweltbundesamt. Climate Protection in Transport—Need for Action in the Wake of the Paris Climate Agreement: Report as Part of the Project Climate Change Mitigation in Transport until 2050. 2017. Available online: https://www.google.com.hk/url?sa=t&rct=j&q=&esrc=s&source=web&cd=1&ved=2ahUKEwimjbXh0cvoAhUHw4sBHW2WAJUQFjAAegQIAxAB&url=https%3A%2F%2Fwww.umweltbundesamt.de%2Fsites%2Fdefault%2Ffiles%2Fmedien%2F1410%2Fpublikationen%2F2017-11-03_texte_97-2017_climate-protection-transport.pdf&usg=AOvVaw3GzusK1a-z3T6e46ZbsvJo (accessed on 2 April 2020).
  23. Umweltbundesamt. Greenhouse-Gas-Nautrality in Germany until 2050: Policy Paper to the RESCUE-Study. 2019. Available online: https://www.google.com.hk/url?sa=t&rct=j&q=&esrc=s&source=web&cd=1&ved=2ahUKEwi_x4aV0svoAhU1zIsBHbq2CJUQFjAAegQIBRAB&url=https%3A%2F%2Fwww.umweltbundesamt.de%2Fen%2Frescue%2Fbackground-greenhouse-gas-neutrality&usg=AOvVaw13hYXbzWQNvOkeUsX1jr1I (accessed on 2 April 2020).
  24. Federal Network Agency and Federal Cartel Office. Monitoring Report 2018; Federal Network Agency and Federal Cartel Office: Paris, France, 2019.
  25. Wietschel, M.; Kluschke, P.; Oberle, S.; Ashley-Belbin, N. Overview Study: Evaluation of Studies and Scenarios of Energy System Analysis with Focus on “Mobility”; 2018; Available online: https://um.baden-wuerttemberg.de/fileadmin/redaktion/m-um/intern/Dateien/Dokumente/5_Energie/SDA/Studie_Energiesystemanalyse_Mobilitaet.pdf (accessed on 4 March 2020).
  26. Federal Government. Thirty-seventh Ordinance on the Implementation of the Federal Immission Control Act (Verordnung zur Anrechnung von Strombasierten Kraftstoffen und Mitverarbeiteten Biogenen Ölen auf die Treibhausgasquote 37. BimSchV); Federal Government: Washington, DC, USA, 2017.
  27. Federal Government. Thirty-Eighth Ordinance on the Implementation of the Federal Immission Control Act (Verordnung zur Festlegung Weiterer Bestimmungen zur Treibhausgasminderung bei Kraftstoffen—38. BImSchV); Federal Government: Washington, DC, USA, 2017.
  28. German Institute for Standardization e.V. DIN EN 590:2017-10, 2017: Kraftstoffe Dieselkraftstoff Anforderungen und Prüfverfahren. Deutsche Fassung EN 590:2013+A1:2017; German Institute for Standardization e.V.: Berlin, Germany, 2017. [Google Scholar]
  29. German Institute for Standardization e.V. DIN EN 228:2017-08, 2017: Kraftstoffe Unverbleite Ottokraftstoffe-Anforderungen und Prüfverfahren, Deutsche Fassung EN 228:2012+A1:2017; German Institute for Standardization e.V.: Berlin, Germany, 2017. [Google Scholar]
  30. German Institute for Standardization e.V. Automotive Fuels-Paraffinic Diesel Fuel from Synthesis or Hydrotreatment Requirements and Test Methods, German Version EN 15940:2016+A1:2018+AC:2019; German Institute for Standardization e.V.: Berlin, Germany, 2019. [Google Scholar]
  31. Kreyenberg, D.; Lischke, A.; Bergk, F.; Duennebeil, F.; Heidt, C.; Knörr, W.; Raksha, T.; Schmidt, P.; Weindorf, W.; Naumann, K.; et al. Renewable Energies in Transport. Potentials and Development Perspectives of Different Renewable Energy Sources and Energy Consumption of the Transport Modes; Berlin, Germany, 2015; Available online: https://www.bmvi.de/SharedDocs/DE/Anlage/G/MKS/mks-kurzstudie-ee-im-verkehr.pdf?__blob=publicationFile (accessed on 3 April 2020).
  32. CDU, CSU, SPD. Coalition Agreement between CDU, CSU und SPD. 2018. Available online: https://www.cdu.de/sites/default/files/media/dokumente/koalitionsvertrag.pdf (accessed on 2 April 2020).
  33. Federal Government. Ordinance on the Crediting of Upstream Emission Reductions against the Greenhouse Gas Quota (Upstream-EmissionsminderungsVerordnung UERV); Federal Government: Washington, DC, USA, 2018.
  34. Millinger, M.; Meisel, K.; Thrän, D. Greenhouse gas abatement optimal deployment of biofuels from crops in Germany. Transp. Res. Part D Transp. Environ. 2019, 2019, 265–275. [Google Scholar] [CrossRef]
  35. Millinger, M. Systems Assessment of Biofuels. Modelling of Future Cost and Greenhouse Gas Abatement Competitiveness between Biofuels for Transport on the Case of Germany. Ph.D. Thesis, Universität Leipzig, Leipzig, Germany, 2018. [Google Scholar]
  36. Millinger, M.; POnitka, J.; Arendt, O.; Thrän, D. Competitiveness of advanced and conventional biofuels: Results from least-cost modelling of biofuel competition in Germany. Energy Policy 2017, 2017, 394–402. [Google Scholar] [CrossRef]
  37. Schmidt, P.R.; Zittel, W.; Weindorf, W.; Raksha, T. Renewables in Transport 2050: Empowering a Sustainable Mobility Future with zero Emission Fuels from Renewable Electricity; Frankfurt am Main, Germany, 2016; Available online: http://www.lbst.de/news/2016_docs/FVV_H1086_Renewables-in-Transport-2050-Kraftstoffstudie_II.pdf (accessed on 3 April 2020).
  38. Millinger, M.; Thrän, D. Biomass price developments inhibit biofuel investments and research in Germany: The crucial future role of high yields. J. Clean. Prod. 2018, 2018, 1654–1663. [Google Scholar] [CrossRef]
  39. Fachagentur für Nachwachsende Rohstoffe e.V. Entwicklung der Anbaufläche für Nachwachsende Rohstoffe; Fachagentur für Nachwachsende Rohstoffe e.V.: Gulzow, Germany, 2019. [Google Scholar]
  40. Deutsches Biomasseforschungszentrum Gemeinnützige GmbH. DBFZ Ressourcendatenbank. Available online: Webapp.dbfz.de (accessed on 2 April 2020).
  41. Federal Agency for Agriculture and Food. Evaluation and Experience Report for 2017; Federal Agency for Agriculture and Food: Bonn, Germany, 2018. [Google Scholar]
  42. Naumann, K.; Oehmichen, K.; Remmele, E.; Thuneke, K.; Schröder, J.; Zeymer, M.; Meisel, K. Monitoring Biokraftstoffsektor, 3rd ed.; Biomasseforschungszentrum: Leipzig, Germany, 2016. [Google Scholar]
  43. Jens, P.; Oliver, A.; Volker, L.; Jaqueline, D.; Walter, S.; Andreas, O.; Martin, Z.; Arne, G.; Franziska, M.; Marco, K.; et al. Bioenergy Technologies: Conversion Paths for Energetic Biomass Use in the 21st Century; 2015; Available online: https://www.energetische-biomassenutzung.de/fileadmin/media/6_Publikationen/fh_technologie_web_small.pdf (accessed on 3 April 2020).
  44. Zech, K.; Grasemann, E.; Oehmichen, K.; Kiendl, I.; Schmersahl, R.; Rönsch, S.; Seiffert, M.; Müller-Langer, F.; Weindorf, W.; Funke, S.; et al. HY-NOW. Evaluation of Processes and Technologies for the Supply of Hydrogen Based on Biomass; Leipzig, Germany, 2014; Available online: https://www.dbfz.de/fileadmin/user_upload/Referenzen/DBFZ_Reports/DBFZ_Report_19.pdf (accessed on 3 April 2020).
  45. Dietrich, S.; Oehmichen, K.; Zech, K.; Müller-Langer, F.; Majer, S.; Kalcher, J.; Naumann, K.; Wirkner, R.; Pujan, R.; Braune, M.; et al. Feasibility Analysis for a PTG HEFA Hybrid Refinery in Germany; Leipzig, Germany, 2017; Available online: https://www.bmvi.de/SharedDocs/DE/Anlage/G/MKS/machbarkeitsanalyse-ptg-hefa-hybridraffinerie.pdf?__blob=publicationFile (accessed on 3 April 2020).
  46. Müller-Langer, F. Analyse und Bewertung Ausgewählter Zukünftiger Biokraftstoffoptionen auf der Basis Fester Biomasse: DBFZ Report Nr. 9; Technische Universität Hamburg-Harburg: Hamburg, Germany, 2012. [Google Scholar]
  47. Majer, S.; Helka, J.; Etzold, H. Assessment of Biomass Potentials from Waste and Residues for Advanced Fuels: Potentials; Economic and Environmental Performance: Leipzig, Germany, 2018. [Google Scholar]
  48. Losordo, Z.; McBride, J.; van Hooyen, J.; Wenger, K.; Willies, D.; Froehlich, A.; Macedo, I.; Lynd, L. Cost competitive second-generation ethanol production from hemicellulose in a Brazilian sugarcane biorefinery. Biofpr 2016, 10, 589–602. [Google Scholar] [CrossRef]
  49. Food and Agriculture Organization of the United Nations. FAOSTAT. Production of Crops. Available online: http://www.fao.org/faostat/en/#data/QC (accessed on 4 March 2020).
  50. Europäische Kommission. EUROSTAT. Energiestatistik. Available online: https://ec.europa.eu/eurostat/de/data/database (accessed on 4 March 2020).
  51. F.O. Licht. Plants & Projects. In F.O. Lichts World Ethanol & Biofuels Report, Volumes in the year 2013–2017. Available online: https://www.agra-net.com/agra/world-ethanol-and-biofuels-report/ (accessed on 4 October 2017).
  52. Agrarmarkt Informations-Gesellschaft mbH. Available online: https://www.agrarheute.com/tag/agrarmarkt-informations-gesellschaft-mbh-ami (accessed on 27 November 2018).
  53. finanzen.net. Rohstoffe. Available online: https://www.finanzen.net/rohstoffe (accessed on 26 November 2018).
  54. top agrar online. Nachrichten und Preise für die Landwirtschaft. Available online: https://www.topagrar.com/ (accessed on 2 April 2020).
  55. Methanex. Methanex Methanol Price Sheet. Available online: https://www.methanex.com/sites/default/files/methanol-price/Mx-Price-Sheet%20-%20Feb%2028%2C%202019.pdf (accessed on 27 November 2018).
  56. C.A.R.M.E.N. Preisentwicklung bei Waldhackschnitzeln. Available online: https://www.forstpraxis.de/waldhackschnitzel-preise/ (accessed on 27 March 2019).
  57. Federal Agency for Agriculture and Food. Evaluation and experience report for 2018: Biomassestrom-Nachhaltigkeitsverordnung Biokraftstoff-Nachhaltigkeitsverordnung; Federal Agency for Agriculture and Food: Bonn, Germany, 2019. [Google Scholar]
  58. Federal Environment Agency. Development of Electricity Consumption by Sector. 2019. Available online: https://www.umweltbundesamt.de/daten/energie/stromverbrauch (accessed on 3 April 2020).
  59. Bundesregierung. Gesetz zur Einführung eines Bundes-Klimaschutzgesetzes und zur Änderung weiterer Vorschriften vom 12.12.2019. 2019. Available online: https://www.bgbl.de/xaver/bgbl/start.xav?startbk=Bundesanzeiger_BGBl&start=//*[@attr_id=%27bgbl119s0010.pdf%27]#__bgbl__%2F%2F*%5B%40attr_id%3D%27bgbl119s2513.pdf%27%5D__1585554588506 (accessed on 2 April 2020).
  60. Thrän, D.; Schaubach, K.; Majer, S.; Horschig, T. Governance of sustainability in the Germanbiogas sector—adaptive management ofthe Renewable Energy Act betweenagriculture and the energy sector. Energy Sustain. Soc. 2020, 10, 3. [Google Scholar] [CrossRef]
  61. Brosowski, A.; Bill, R.; Thrän, D. Transport of Goods Powered by Cereal Straw: Temporal and Spatial Biomass Availability for Future Bio-LNG Production in Germany. Energy Sustain. Soc. Submiss. in press.
  62. Moosmann, D.; Majer, S.; Ugarte, S.; Ladu, L.; Wurster, S.; Thrän, D. Strengths and gaps of the EU frameworks for the sustainability assessment of biobased products and bioenergy. Energy Sustain. Soc. Submiss. in press.
  63. Majer, S.; Wurster, S.; Moosmann, D.; Ladu, L.; Sumfleth, B.; Thrän, D. Gaps and Research Demand for Sustainability Certification and Standardisation in a Sustainable Bio-Based Economy in the EU. Sustainability 2018, 10, 2455. [Google Scholar] [CrossRef] [Green Version]
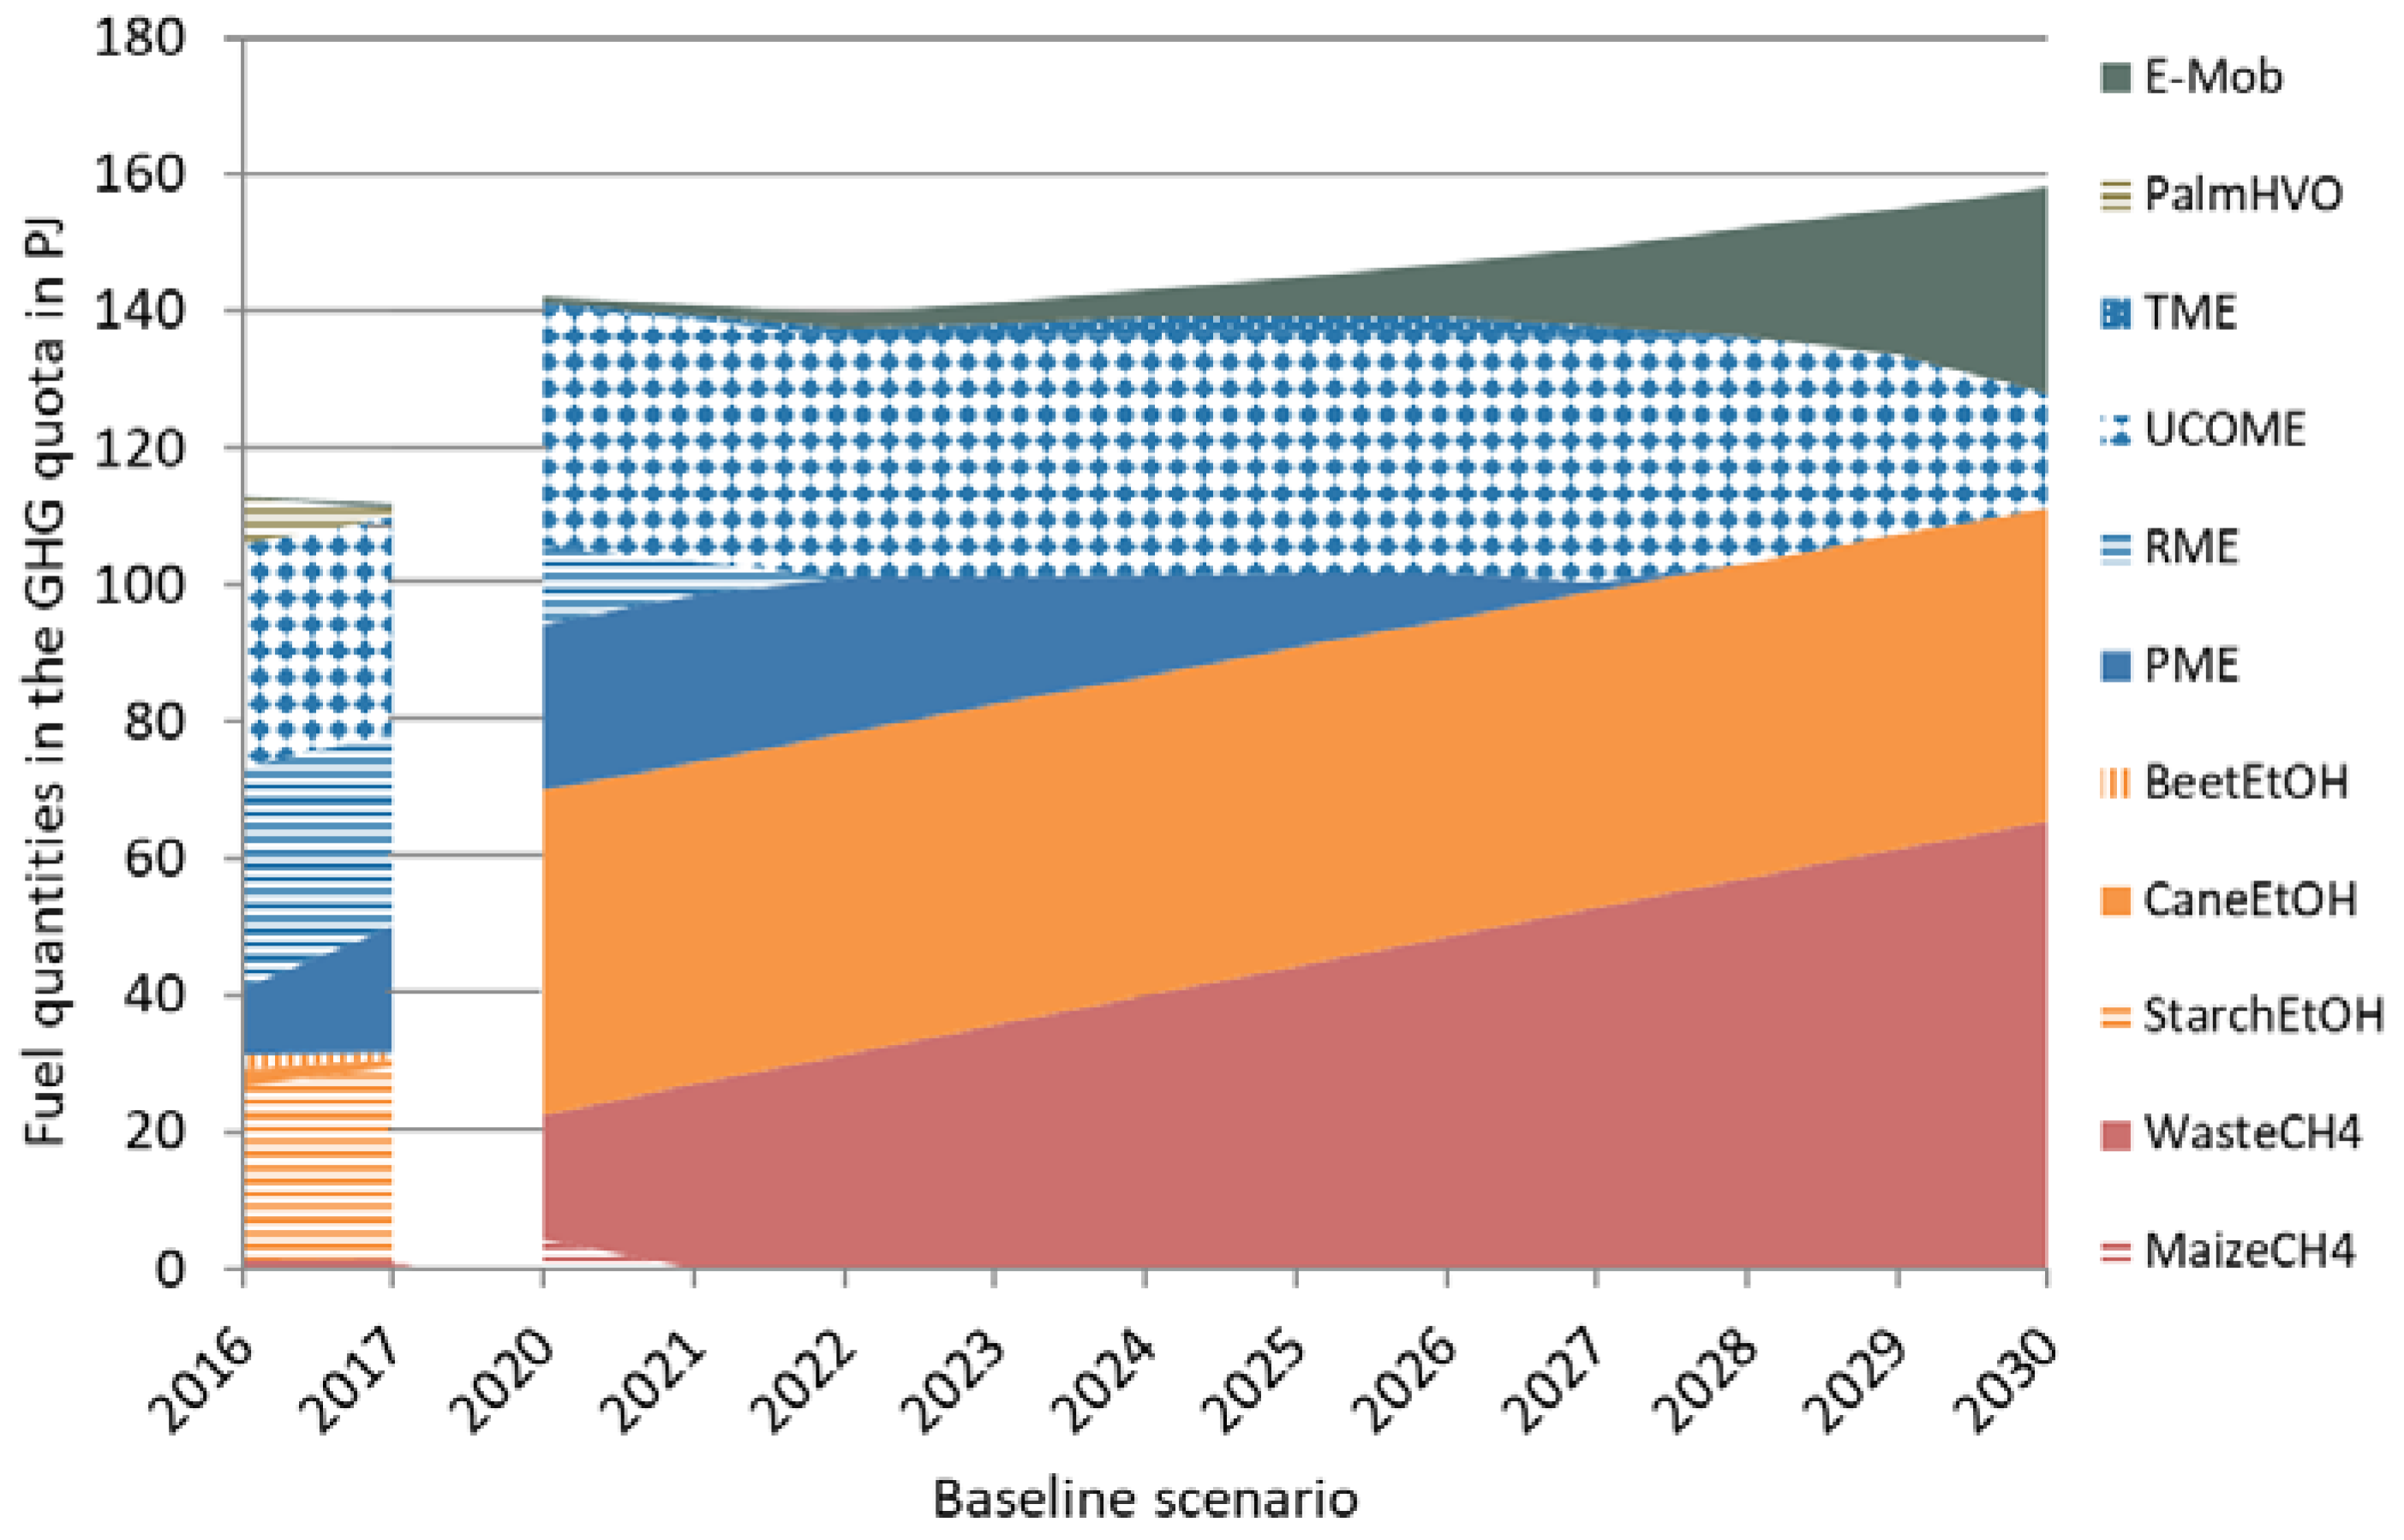
Figure 1. Optimal fuel mix in the baseline scenario (Scenario 1).
Energies 13 01712 g001
Figure 2. GHG reductions through the use of the fuels in the baseline scenario fuel mix.
Energies 13 01712 g002
Figure 3. Optimal fuel mix in the climate protection scenario (Scenario 6).
Energies 13 01712 g003
Figure 4. GHG reductions through the use of the fuels in the climate protection scenario fuel mix.
Energies 13 01712 g004
Figure 5. Optimal fuel mix in the minimum quota scenario (Scenario 2).
Energies 13 01712 g005
Figure 6. Optimal fuel mix in the maximum quota scenario (Scenario 3).
Energies 13 01712 g006
Figure 7. Optimal fuel mix in the “Volatile prices” scenario (Scenario 4).
Energies 13 01712 g007
Figure 8. Optimal fuel mix in the “No phase-out” scenario (Scenario 5).
Energies 13 01712 g008
Figure 9. Optimal fuel mix in the “No blending limits” scenario (Scenario 7).
Energies 13 01712 g009
Figure 10. Optimal fuel mix in the “Constant gaseous fuels” scenario (Scenario 8).
Energies 13 01712 g010
Figure 11. Optimal fuel mix in the “No biomass imports” scenario (Scenario 9).
Energies 13 01712 g011
Table 1. Classification of the fuel options and their blending limits.
Fuel OptionsBiofuels from Food/FeedAnnex IX,
Part A
Annex IX,
Part B
Power
to X
Fossil
Diesel fuels
FAME
(max. 7% vol.)
RME, PME, SoyFAME UCOME, TME
HVO, BtL, PtL
(max. 26% vol.)
Rape seed/
PalmHVO
BtLUCO-HVOPtL
Petrol fuels
Ethanol
(max.10% vol.)
Beet/Starch/-CaneEtOHStrawEtOH
Methanol
(max. 3% vol.)
BioMeOH
Gas fuels
Gaseous fuels
(max. 1-3% FEC)
MaizeCH4SNG, WasteCH4 PtG-CH4CNG
LPG
(max. 1% FEC)
LPG
Liquid methane
(max. 3.9% FEC)
LSNG, LWaste4 LNG
Hydrogen
(max. 0.9% FEC)
Bio-H2 PtG-H2
(BtL—Biomass to liquid, CH4—Methane, CNG—Compressed natural gas, EtOH—Ethanol, FAME—Fatty acid methyl ester, FEC—Final energy consumption, H2—Hydrogen, HVO—Hydrotreated vegetables oil, LNG—Liquefied natural gas, LPG—Liquefied Petroleum Gas, L—Liquefied, MeOH—Methanol, PME—Palm oil methyl ester, PtG/L—Power to gas/liquid, RME—Rapeseed oil methyl ester, SNG—Synthetic natural gas, TME—Tallow methyl ester, UCO—Used cooking oil, UCOME—Used cooking oil methyl ester, W—Waste).
Table 2. Key data of the baseline and the climate protection scenario (RE = renewable energy; FEC = final energy consumption; UER = measures of Upstream Emission Reduction according to [33]).
Feature for 2030Baseline Scenario S1Climate Protection Scenario S6
RegulationRED IIRED II, Climate protection plan
Target14% renewable energies40% GHG reduction ct.1990
FEC (PJ)21781620
Electric mobility (PJ)30 (6 Mio. vehicles)50 (10 Mio. vehicles)
RE in electricity mix (%)5565
Model GHG quota (%) (w/o UER, electricity in rail traffic)5.332.5
Table 3. Key data of the variation scenarios (RE = renewable energy; FEC = Final energy consumption, red. = reduction).
Feature for 2030S2S3S4S5S7S8S9
Target14% RE14% RE14% RE14% RE40% GHG red.40% GHG red.40% GHG red.
FEC (PJ)1620261421782178162016201620
Electric
mobility (PJ)
5033030505050
RE in electri-city mix (%)65455555656565
Model GHG
quota (%)
3.58.15.35.332.532.532.5
CharacteristicMin. QuotaMax. QuotaVolatile pricesNo phase outNo blending limitConst. gaseous fuelsNo biomass imports