Article

Analytical Solution for Coupled Diffusion Induced Stress Model for Lithium-Ion Battery

Department of Mechanical and Aerospace Engineering, Politecnico di Torino, Corso duca degli Abruzzi 24, 10129 Torino, Italy
*
Author to whom correspondence should be addressed.
These authors contributed equally to this work.
Energies 2020, 13(7), 1717; https://doi.org/10.3390/en13071717
Submission received: 17 January 2020 / Revised: 16 March 2020 / Accepted: 31 March 2020 / Published: 4 April 2020
(This article belongs to the Special Issue Energy Storage Systems for Electric Vehicles)

Abstract

:
Electric cycling is one of the major damage sources in lithium-ion batteries and extensive work has been produced to understand and to slow down this phenomenon. The damage is related to the insertion and extraction of lithium ions in the active material. These processes cause mechanical stresses which in turn generate crack propagation, material loss and pulverization of the active material. In this work, the principles of diffusion induced stress theory are applied to predict concentration and stress field in the active material particles. Coupled and uncoupled models are derived, depending on whether the effect of hydrostatic stress on concentration is considered or neglected. The analytical solution of the coupled model is proposed in this work, in addition to the analytical solution of the uncoupled model already described in the literature. The analytical solution is a faster and simpler way to deal with the problem which otherwise should be solved in a numerical way with finite difference method or a finite element model. The results of the coupled and uncoupled models for three different state of charge levels are compared assuming the physical parameters of anode and cathode active material. Finally, the effects of tensile and compressive stress are analysed.

Graphical Abstract

1. Introduction

Lithium-ion batteries are actually one of the most widespread rechargeable energy-storage systems [1]. They have a large field of application from small electronic systems up to electric vehicles in automotive and industrial applications [2,3]. Indeed, they can span a great capacity and power range with a good energy density and long lifetime.
Safety and batteries performance have been analysed through modelling and experimental tests in the last decades [4,5]. Progressive damage with charge/discharge cycles is the major weak point of lithium ion cells, since it affects the lifetime considerably [6]. The lithium ions are stored/withdrawn in the active material of the electrodes through insertion/extraction processes. These processes must be studied at a micrometre scale, at which active material of both electrodes appears as a particulate matter, as depicted in Figure 1a. Insertion/extraction processes induce expansion/contraction of the active material particles, and in turn mechanical stress which damage the electrode structure. The electrode damage causes indirectly the increase of solid electrolyte interface (SEI) growth which in turn affects the battery performance and the available capacity [7]. Stress and strain due to insertion/extraction processes are recently investigated via in-situ measurements in battery electrodes [8,9,10]. However, the lack of experimental stress measurements in active material particles does not allow to validate the results derived in this work.
These type of stresses are described originally by Prussin [11] as chemical stress or diffusion induced stress (DIS), which manages the interaction between chemical and mechanical problem. Later, Larché and Cahn [12,13] and Chu and Lee [14,15] studied the interaction between thermodynamic of diffusion and stress.
Several continuum models of diffusion induced stress were proposed in the last decade, each of them highlights some particular features. The models mainly divide in two groups: the coupled models consider the influence of the hydrostatic stress on the lithium ions diffusion, namely “pressure diffusion effect”, and the uncoupled models neglect this effect.
Cheng and Verbrugge presented an uncoupled model for stress evolution in spherical particle in Reference [16] and they studied the effect of surface mechanics in nanometre particles, showing that tensile stress may be significantly reduced in magnitude or even be reverted to a state of compression with small particle radius [17].
Christensen and Newman were among the first to study DIS models applied to lithium ions cell [18,19,20] deriving a stand-alone electrode particle model. Meanwhile, Zhang et al. performed a numerical implementation of coupled DIS problem, and studied the influence of the aspect ratio of an ellipsoidal particle of lithium manganese oxide (LMO) on stress [21]. Later they studied the stresses which arise both from concentration gradient and heat generation in cathode particles, assumed as ellipsoidal with varying aspect ratio [22]. The basis of DIS theory applied to lithium-ion cells are clearly explained in Reference [23,24,25] for different geometry domain. Recently Bagheri et al. presented the numerical results of coupled DIS problem for galvanostatic and potentiostatic insertion in spherical LMO particle [26]. Eshghinejad et al. presented a continuum model which couples diffusion and mechanics of ions intercalation for non-dilute solutions [27], according to Haftbaradaran et al. [28], and solved it with a finite elements (FE) model. Eshghinejad et al. highlighted that compressive stress results in lower lithium ions solubility and thus lower achievable capacity. Recently Wu et al. extended the study of diffusion induced stress to the interaction with other particles. Indeed, they developed a three-dimensional particle network model in a FE platform and a multiscale model which considers the stress in the particle as the superposition of the concentration gradient induced stress and the stress which comes from the interaction with other particles [29].
Tensile hoop stress due to insertion/extraction processes is the driving force for the analytical crack propagation model described by Deshpande et al. [30]. The authors described the capacity reduction rate due to electrolyte decomposition on the new free surfaces created by the cracks. Other works performed numerical analysis to predict crack propagation in active material with a stochastic approach [31] and considering the effect of current rate [32]. Grantab et al. developed a numerical method for studying lithiation-induced crack propagation in silicon nanowires that accounts for the effects of pressure-diffusion on the stress, and compared the results with an uncoupled model [33].
A continuum model of diffusion-mechanical problem in spherical geometry is presented in this paper. The model described in Section 2 gives a tool to estimate the stresses and strains in active material particles during lithiation/delithiation on the basis of particle size and mechanical properties with specific assumptions. Furthermore the model takes into account the hydrostatic stress influence on lithium diffusion, namely the “pressure diffusion effect”, which couples mechanical and diffusive problem. The hydrostatic stress effect is highlighted comparing the results of the coupled and uncoupled model, which considers or neglects the stress influence, respectively. The definition of an equivalent diffusion coefficient which accounts for the hydrostatic stress effect allows to derive an analytical solution even for the coupled model, still not available in literature, as far as the authors know. The results of the analytical model are compared with numerical results in literature in Section 3. Furthermore, lithium concentration and stress are derived in galvanostatic insertion and extraction with different state of charge (SOC) for anode and cathode insertion material in Section 3. It is highlighted that tensile stresses are the driving force for crack propagation, and thus solid electrolyte interface (SEI) growth and capacity fade. On the other hand, compressive stresses induce a reduction of lithium flux which in turn affects the achievable capacity.

2. Problem Formulation

The mechanical stresses which arise in the active material particles are directly linked to lithium intercalation/de-intercalation phenomena which occur over charge/discharge cycling. For this reason, this model works just for intercalation materials, and not for conversion material, such as Silicon, since lithium ions would interact with host material differently. The particle is assumed spherical, isotropic and linear elastic, and the current density is assumed uniform all over the particle surface. These assumptions make the problem axisymmetric, leading to a one-dimensional problem in the radial coordinate. A couple of boundary conditions are given: traction-free condition is applied on the outer surface of the particle, thus neglecting the interaction with surroundings, and a fixed central point is imposed to prevent rigid body motion.
The lithium ions diffuse gradually in the particle during insertion and extraction. The ions diffusion makes the lithium concentration inhomogeneous along the particle radius, as shown in Figure 1b,c.
The concentration gradient causes a mechanical stress state in analogy to temperature gradient. Therefore, the areas with greater concentration gradient are affected by larger deformation compared to the areas where the gradient is lower. Therefore, a diffusion-elastic problem must be studied, since the stress state described by the elastic problem depends on the concentration level which is described by the diffusive problem.
The concentration level in insertion and extraction affects the sign of the stresses. Referring to insertion in Figure 1b, the greater concentration of the outer layers causes a tensile radial stress all over the particle because the surface expands more than the core. The hoop stress is compressive in the outer layers and tensile in the core because the greater deformation of the surface is prevented by the core. In extraction (Figure 1c) the particle shrinks, and the radial stress is compressive because the concentration level decreases along the radius. The hoop stress is tensile in the surface and compressive in the core because the greater expansion of the core is prevented by outer layers which are characterized by a lower concentration level.

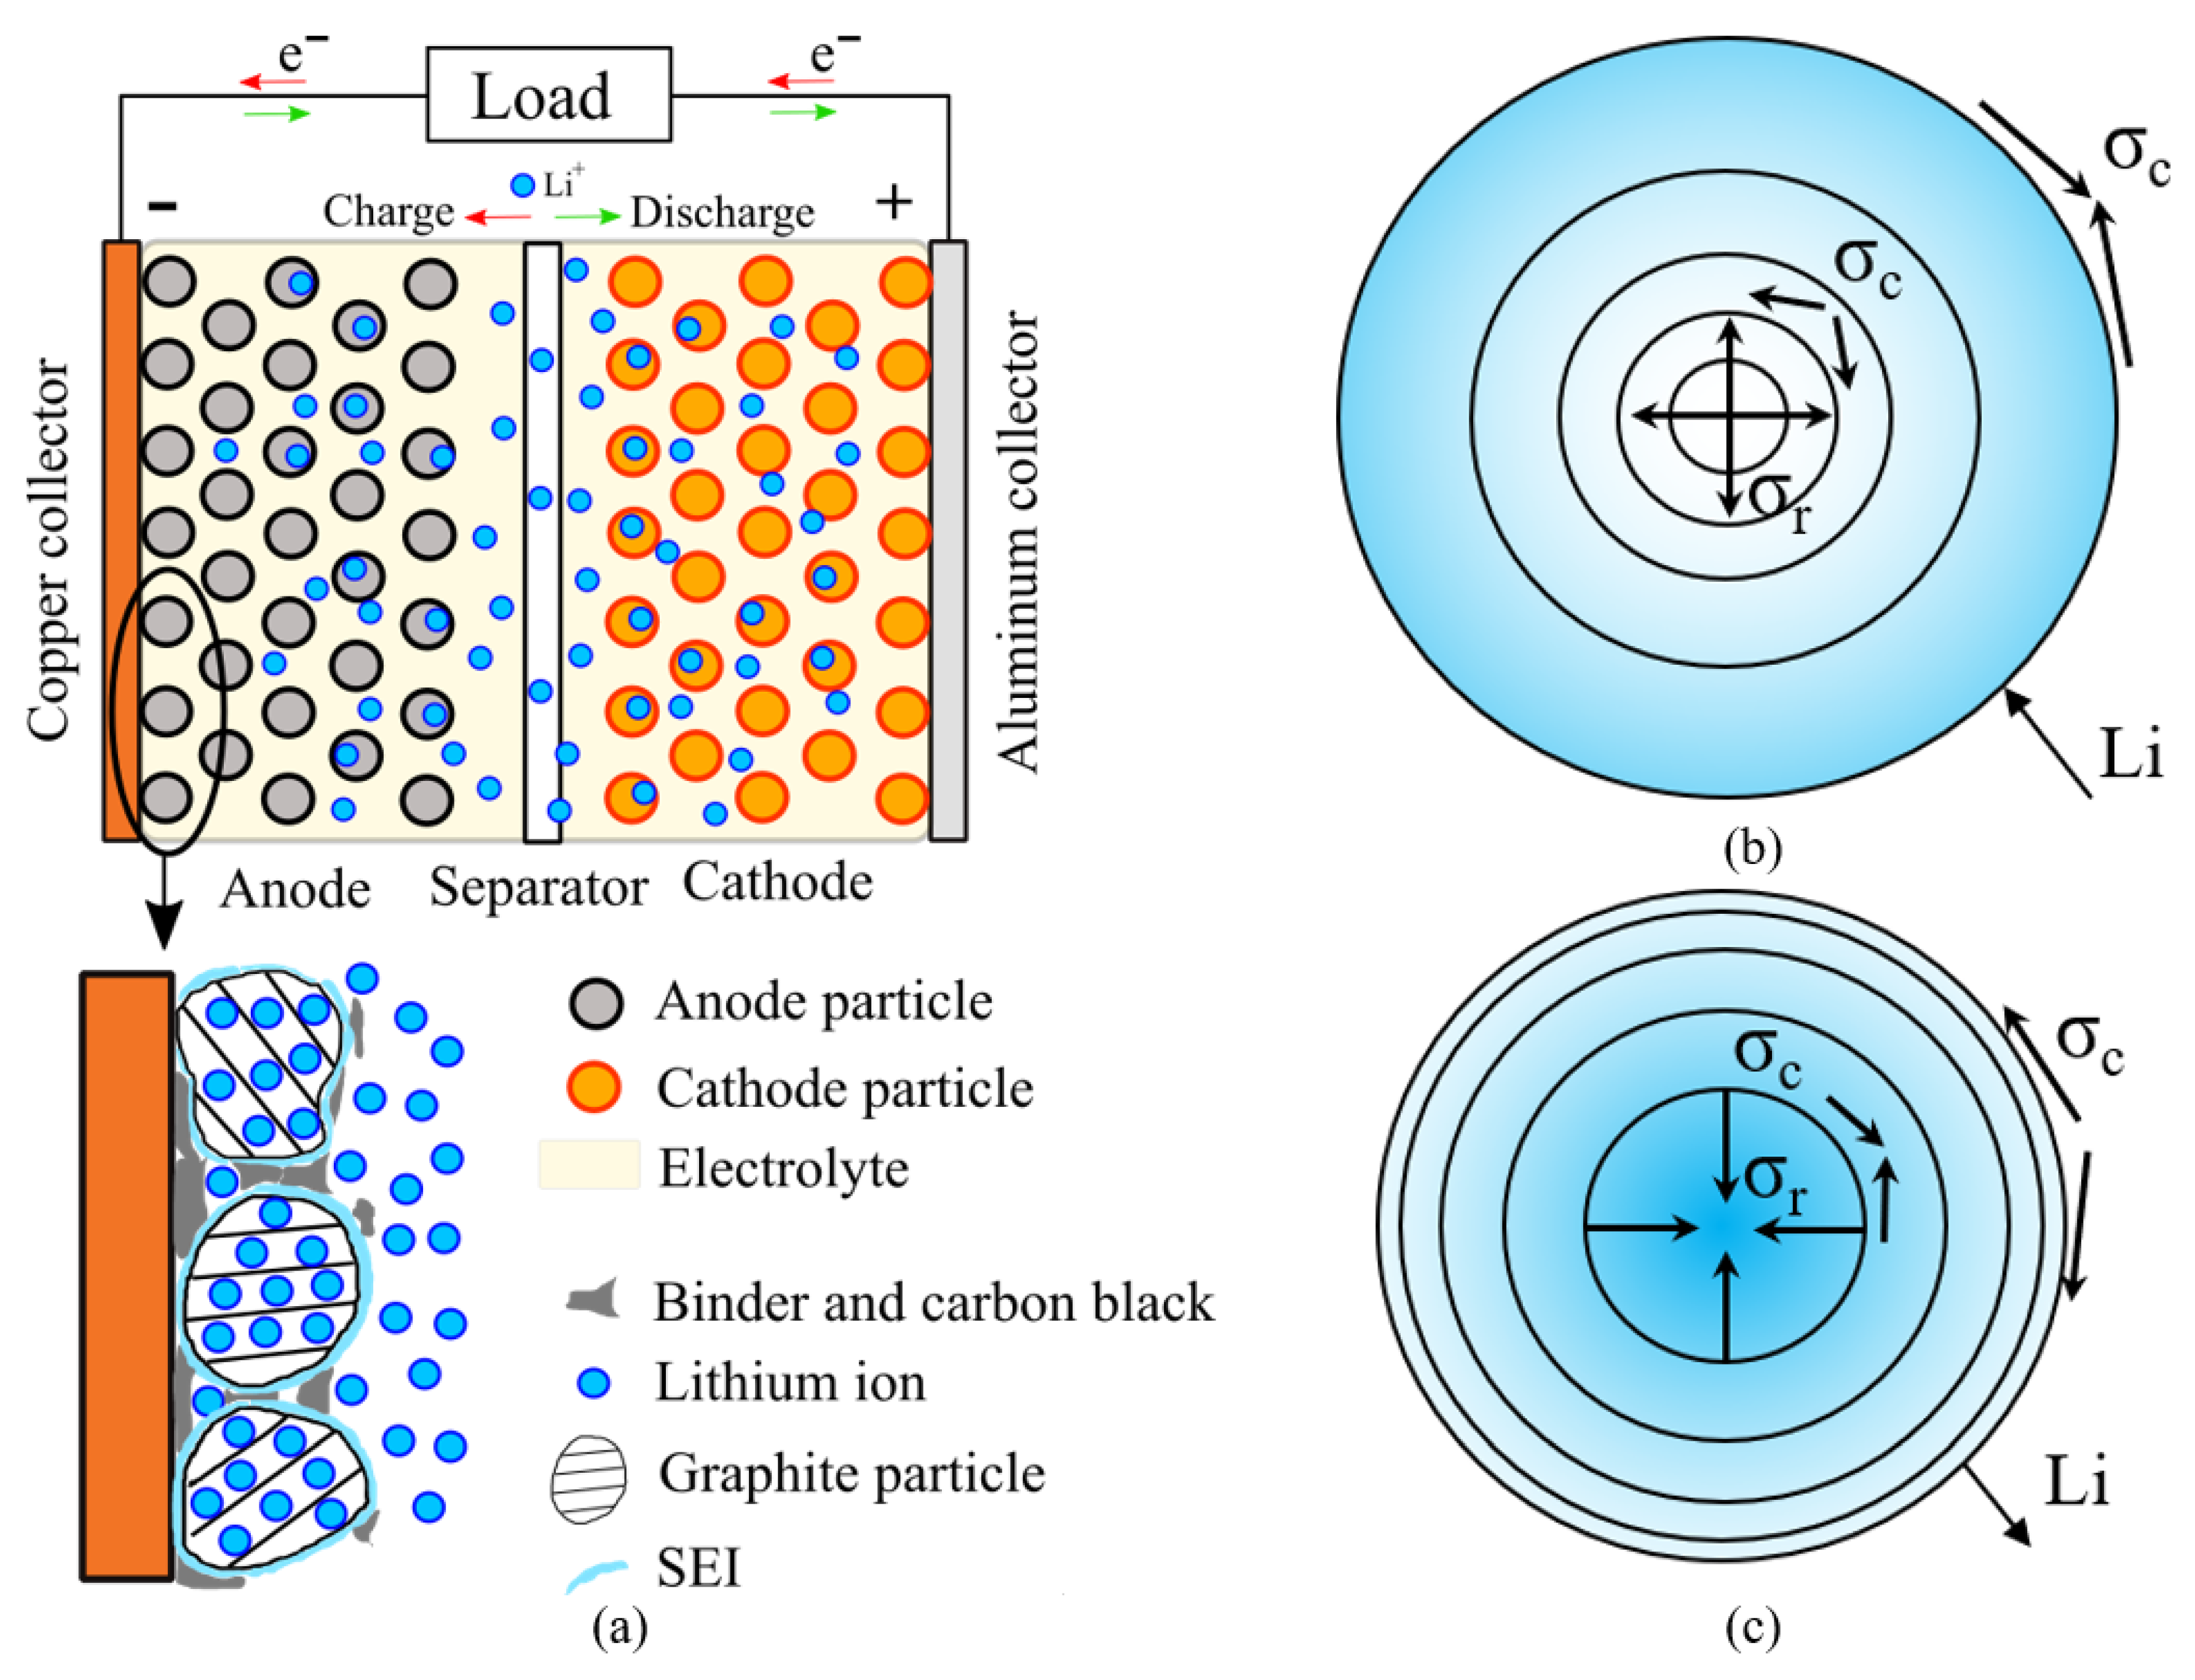
2.1. Mechanical Problem

Strains are characterized by an elastic and a chemical contribution, which is expressed according to Prussin [11] in Equation (1).
ε c h = Ω 3 C ( r ) ,
where Ω is the partial molar volume, which describes the volume variation of the solution host material and intercalated lithium. C is the lithium concentration field within the particle. The total strain is expressed as the sum of elastic strain and chemical strain [11], so the constitutive equations are expressed in spherical coordinates in Equations (2) and (3).
ε r = 1 E σ r 2 ν σ c + Ω C 3 ,
ε c = 1 E ( 1 ν ) σ c ν σ r + Ω C 3 ,
where E and ν are the Young modulus and Poisson ratio. The last term in Equations (2) and (3) couples the mechanical and chemical aspects. It is worth noting that this expression is written in analogy to an elastic-thermal problem, so the diffusivity part of the equation is totally equivalent to a thermal problem if the concentration field is replaced by the temperature and the partial molar volume is replaced by thermal expansion coefficient.
It is useful to rearrange the constitutive equations in terms of stresses for later purposes:
σ r = E ε r Ω C 3 ( 1 ν ) + 2 ν ε c Ω C 3 ( 1 + ν ) ( 1 2 ν ) ,
σ c = E ε c Ω C 3 + ν ε r Ω C 3 ( 1 + ν ) ( 1 2 ν ) .
The congruency equations, which relate strain and displacement are:
ε r = d u d r ,
ε c = u r .
The characteristic time of solid elastic deformation is much smaller than the diffusion of atoms in solids, for this reason the mechanical equilibrium is reached much faster than the diffusive one, and the elastic problem is treated as a quasi-static problem: the transient is not considered, and the equilibrium is assumed to be reached instantaneously.
The mechanical equilibrium equation over a spherical domain is given by Equation (8) according to References [16,17,26,34].
d σ r d r + 2 r σ r σ c = 0 .
The mechanical stress state within a spherical particle is completely described by the set of Equations (4)–(8). The elastic problem is solved for the displacement replacing the congruency equations (Equations (6) and (7)) in the constitutive ones (Equations (4) and (5)), and the latter in the equilibrium equation (Equation (8)).
This leads to a second order differential equation (Equation (9)) depending on displacement and concentration field.
d 2 u d r 2 + 2 r d u d r 2 u r 2 = 1 + ν 1 ν Ω 3 d C d r .
Equation (9) is solved for the displacement integrating it twice. A first integration leads to:
d u d r + 2 u r + 0 r 2 u r 2 d r 0 r 2 u r 2 d r = 1 + ν 1 ν Ω 3 C ( r ) + C 1 .
The displacement field is got in Equation (11) multiplying Equation (10) for r 2 , integrating another time and rearranging the terms.
u ( r ) = 1 + ν 1 ν Ω 3 1 r 2 0 r C ( r ) r 2 d r + C 1 3 r + C 2 r 2 .
The constants C 1 and C 2 are obtained imposing the boundary condition for r = 0 and r = R . The first boundary condition is null displacement at the center of the sphere which leads to C 2 = 0 . This result is obtained solving lim r 0 u ( r ) , since Equation (11) is not defined for r = 0 .
The second boundary condition is derived from the behaviour on the surface. When free expansion is considered, the radial stress must vanish on the surface. This condition is got solving Equation (12) according to the constitutive equation (Equation (4)).
( d u d r r = R 1 3 Ω C ( R ) ( 1 ν ) + 2 ν u ( R ) R 1 3 Ω C ( R ) = 0 .
The displacement and its derivative valued for r = R are replaced in Equation (12). Then Equation (12) is solved for C 1 , leading to:
C 1 = 2 1 2 ν 1 ν Ω R 3 0 R C ( r ) r 2 d r .
At this stage all the boundary conditions are set, and the displacement field is expressed in Equation (14).
u ( r ) = Ω 3 ( 1 ν ) ( 1 + ν ) 1 r 2 0 r C ( r ) r 2 d r + 2 ( 1 2 ν ) r R 3 0 R C ( r ) r 2 d r .
Therefore Equation (14) is replaced in the congruency equations (Equations (6) and (7)) and radial and hoop strains are obtained in Equation (15).
ε r ( r ) = 1 + ν 1 ν Ω 3 2 r 3 0 r C ( r ) r 2 d r + C ( r ) + 2 Ω 3 1 2 ν 1 ν 1 R 3 0 R C ( r ) r 2 d r ε c ( r ) = 1 + ν 1 ν Ω 3 1 r 3 0 r C ( r ) r 2 d r + 2 3 Ω 1 2 ν 1 ν 1 R 3 0 R C ( r ) r 2 d r .
Then, the stresses are derived replacing the strain equations (Equation (15)) in the constitutive ones (Equations (4) and (5)).
σ r ( r ) = 2 Ω 3 E 1 ν 1 R 3 0 R C ( r ) r 2 d r 1 r 3 0 r C ( r ) r 2 d r σ c ( r ) = Ω 3 E 1 ν 2 R 3 0 R C ( r ) r 2 d r + 1 r 3 0 r C ( r ) r 2 d r C ( r ) .
Finally, the hydrostatic stress, defined according to Equation (17), is obtained. The value of hydrostatic stress is the coupling factor between elastic and diffusion in the diffusive problem.
σ h ( r ) = σ 1 + σ 2 + σ 3 3 = σ r + 2 σ c 3 = 2 Ω E 9 ( 1 ν ) 3 R 3 0 R C ( r ) r 2 d r C ( r ) .
The results of the mechanical problem, namely the displacement, the strains and the stresses in Equations (14)–(17) depend on the concentration field, that is solved in the diffusion problem.

2.2. Diffusive Problem

The diffusive equation is derived with the thermodynamic approach described by Chu and Lee [15] and later adopted by most of the works concerning stress in intercalation materials [21,22,23,24,25,26]. Chemical potential gradient is the driving force for mass transport. The chemical potential of a solute in an ideal solution subjected to stress is written in Equation (18) according to Chu and Lee [15].
μ = μ 0 + R g T l n ( C ) σ h Ω ,
where μ 0 is a constant, R g the universal constant of gasses, C the concentration field, T the temperature, σ h the hydrostatic stress experienced by the particle and Ω the partial molar volume. The expression of chemical potential in Equation (18) is formulated for dilute solution and does not take into account non ideality: namely the lithium migrates among interstitial sites and the structure of the host material is not modified by the intercalation process. The flux of lithium ions inside the particle due to the chemical potential is expressed in Equation (19) according to Reference [15].
J = M C μ r ,
where M is the mobility of the solute.
The mass conservation law of lithium ions in radial coordinate is introduced in Equation (20) [15].
C t + 1 r 2 ( r 2 J ) r = 0

2.3. Uncoupled Problem

At first the uncoupled problem is solved, so the hydrostatic stress term in the chemical potential expression in Equation (18) is neglected, allowing to decouple the elastic problem from the diffusive one.
This simplified version of chemical potential is replaced in Equation (19). Therefore, the lithium ions flux is expressed as Equation (21).
J = D C r
where D is the diffusion coefficient, defined as D = M R g T .
Finally Equation (21) is replaced in the mass conservation law (Equation (20)), and the diffusion equation in radial coordinate is derived in Equation (22).
C t = D r 2 r r 2 C r
Diffusion Equation (22) is written in perfect analogy with thermal diffusion, if concentration field is replaced by the temperature one.
Equation (22) is associated to a couple of boundary conditions which describe two possible cell operations: constant voltage (potentiostatic operation, Equation (23)) or constant current (galvanostatic operation, Equation (24)).
A constant lithium concentration equal to C R is imposed at the cell boundary over time with potentiostatic operation. The diffusion Equation (22) has a singularity for r = 0 , so the second boundary condition prescribes a finite concentration value at the centre of the sphere. Finally, a constant initial concentration value C 0 is prescribed for t = 0 across the domain.
C t = D r 2 r r 2 C r C ( r , 0 ) = C 0 , for 0 r R C ( R , t ) = C R , for t 0 C ( 0 , t ) = f i n i t e , for t 0
A constant lithium flux, proportional to the current density, is applied on the external surface of the particle over time in galvanostatic operation. The lithium flux goes from the particle surface radially toward the centre, so the flux must be zero for r = 0 . An initial concentration value C 0 is present all over the particle, as defined before.
C t = D r 2 r r 2 C r C ( r , 0 ) = C 0 , for 0 r R C ( r , t ) r | r = R = I F D , for t 0 C ( r , t ) r | r = 0 = 0 , for t 0
The solutions of the problem in Equations (23) and (24) are derived analytically by variable separation. However the solutions are well known in the literature [16] and are reported in Equation (25) for potentiostatic operation and in Equation (26) for galvanostatic operation.
C ( r , t ) C R C 0 C R = 2 n = 1 ( 1 ) n + 1 π n x s i n ( n π x ) e n 2 π 2 τ ,
C ( r , t ) = C 0 + I R F D 3 τ + x 2 2 3 10 2 x n = 1 s i n ( λ n x ) λ n 2 s i n ( λ n ) e λ n 2 τ .
The solutions are normalized according to the dimensionless characteristic time expressed as τ = D t / R 2 and to the radial position x = r / R . λ n are the positive roots of the transcendent equation λ n = t a n ( λ n ) . C R is the concentration value on the particle surface, C 0 is the initial concentration, F is the Faraday constant, I is the current density and R is the radius of the particle.
The concentration solutions in Equations (25) and (26) are replaced in Equations (14)–(17) to get displacement, strains and stress expressions for the uncoupled model.

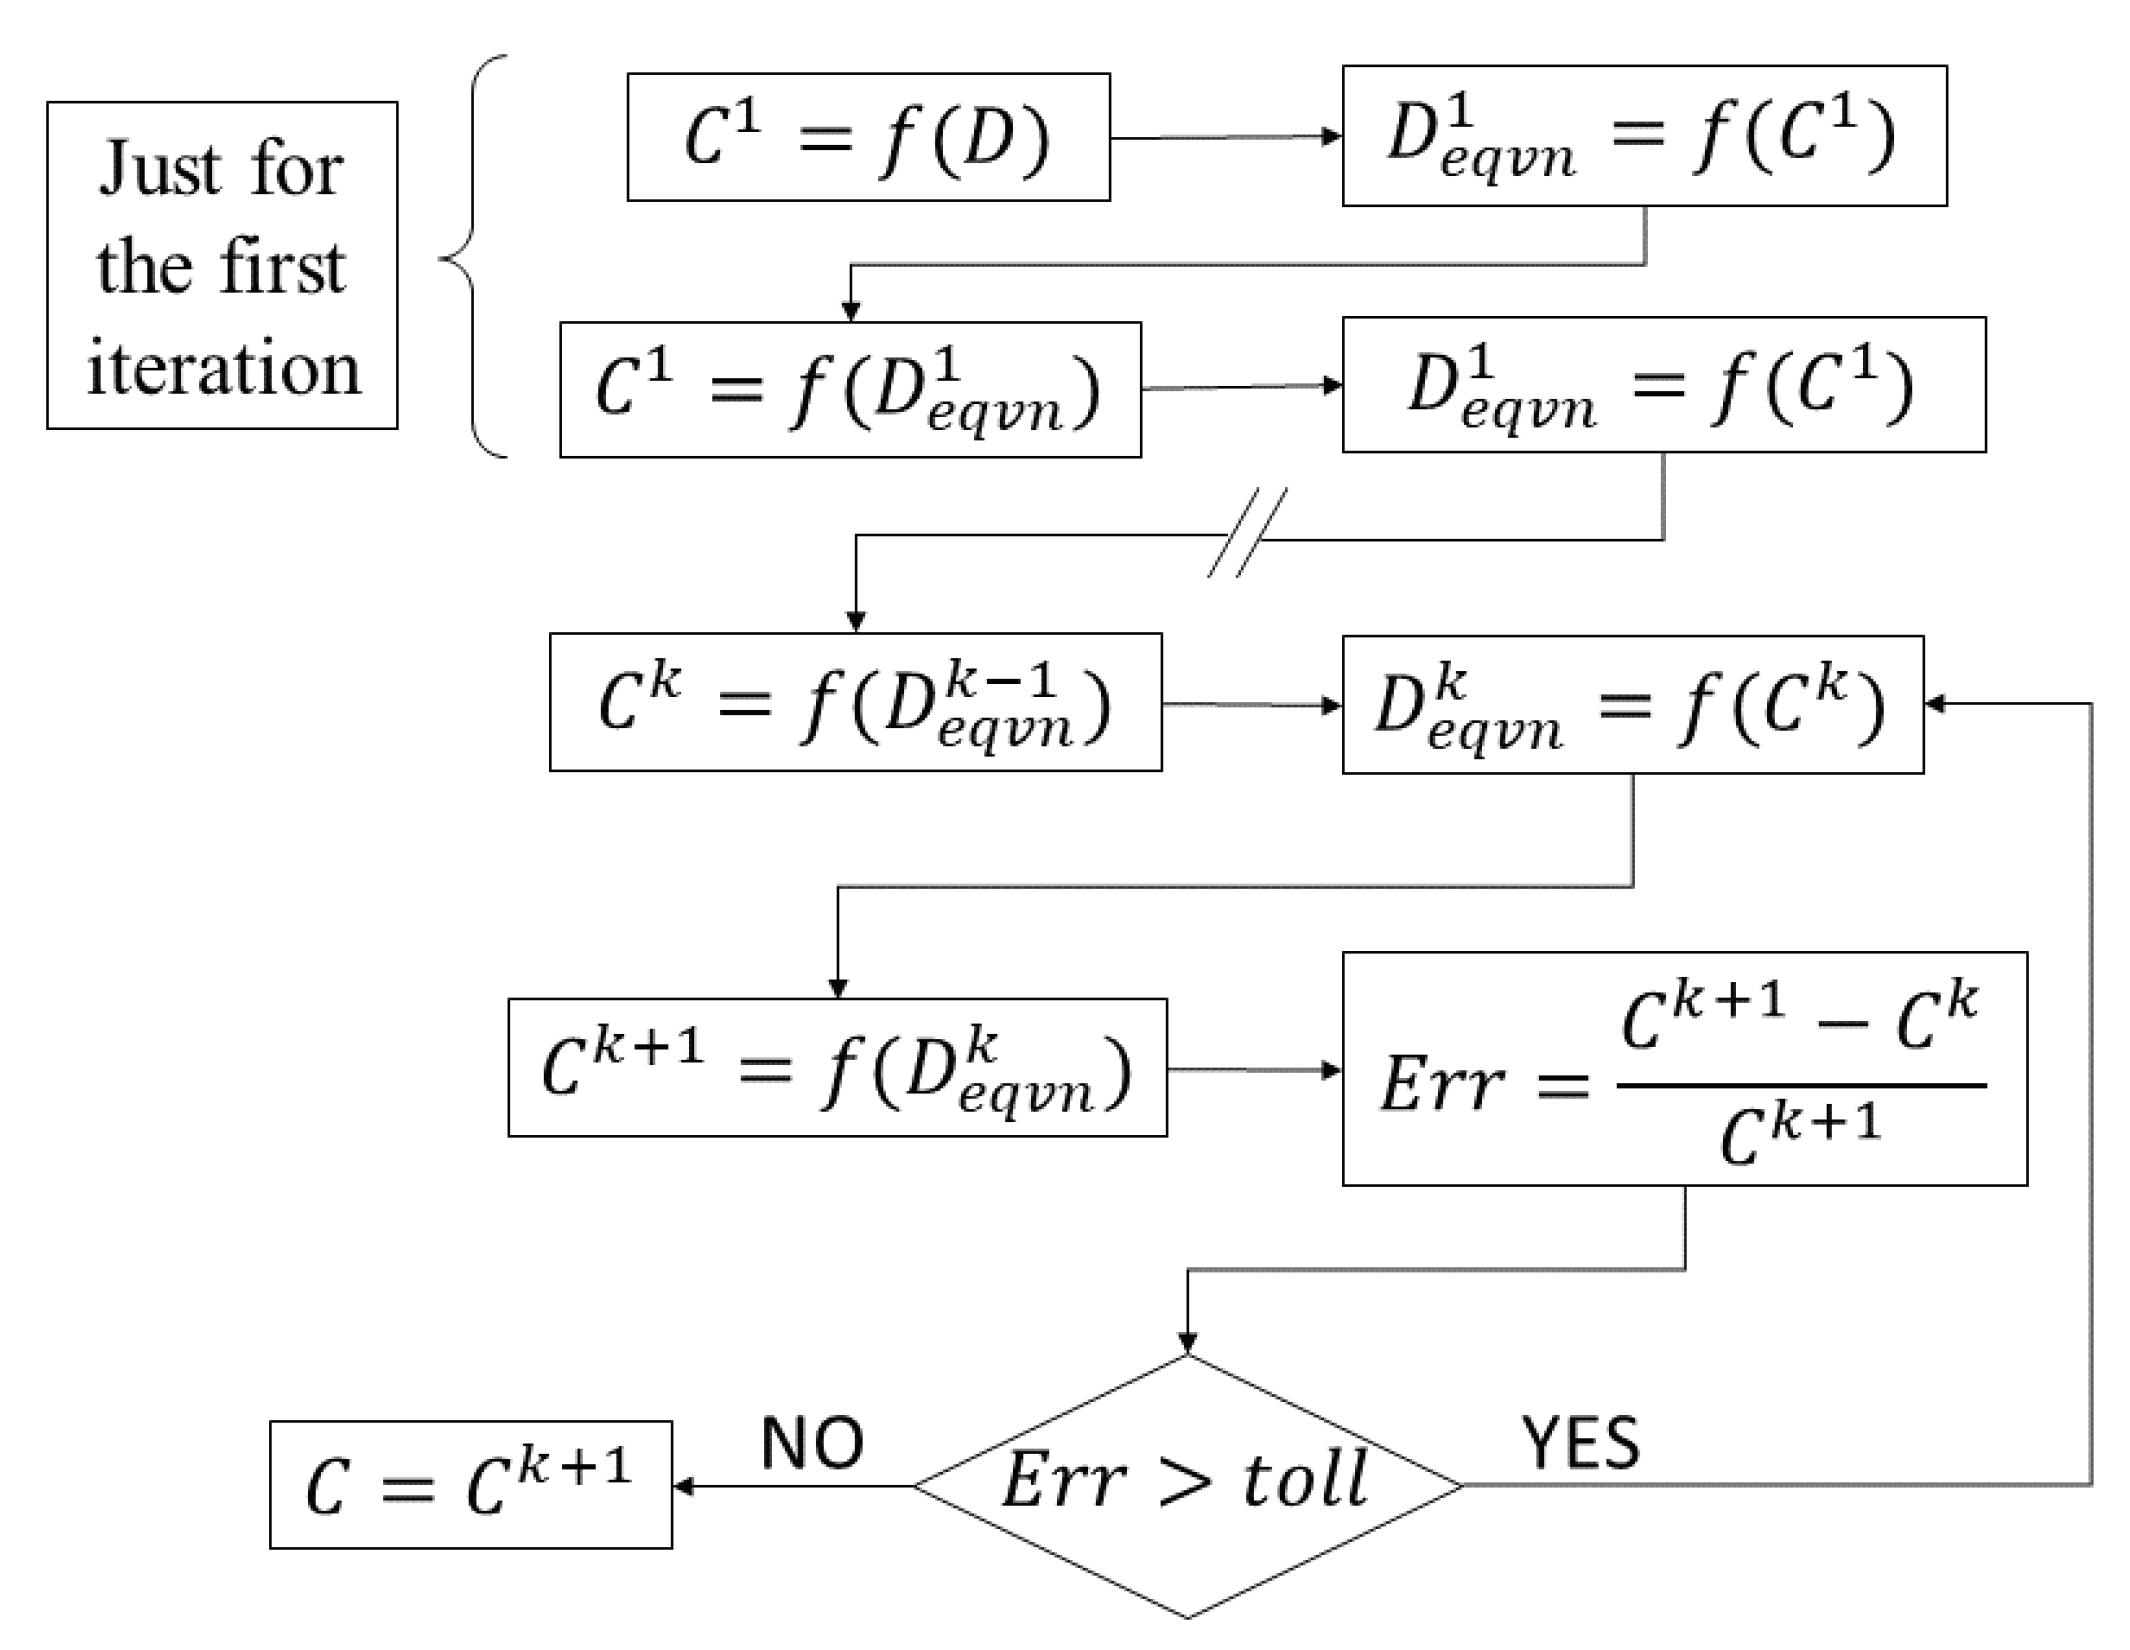
2.4. Coupled Problem

The lithium ion flux for the coupled problem reported in Equation (27) is obtained by replacing the chemical potential (Equation (18)) in lithium flux (Equation (19)).
J = D C r Ω C R T σ h r .
Finally, the concentration equation for the coupled problem is derived in Equation (28) replacing Equation (27) in the mass conservation law (Equation (20)).
C t = D 2 C r 2 + 2 r C r Ω R g T C r σ h r Ω C R g T 2 σ h r 2 + 2 r σ h r .
Equation (28) cannot be solved analytically as Equation (22), so the flux expression in Equation (27) is rearranged in order to obtain an expression similar to Equation (21) which brings back to a concentration equation analogue to Equation (22), whose analytical solution is already known.
The term σ h r in Equation (27) is written according to the chain rule method as: σ h r = σ h C C r . Then the hydrostatic stress in Equation (17) is differentiated with respect to the concentration: σ h C = 2 Ω E 9 ( 1 ν ) . Finally, the lithium flux is expressed in Equation (29) factoring the term C r .
J = D 1 + 2 Ω 2 E C 9 R g T ( 1 ν ) C r
Equation (29) is similar to the expression of lithium ions flux derived for the uncoupled problem (Equation (21)), but the diffusion coefficient is multiplied by a new factor. So, the equivalent diffusion coefficient for the coupled problem is introduced in Equation (30), in accordance with Chu and Lee [15].
D e q v n ( r ) = D 1 + 2 Ω 2 E C 9 R g T ( 1 ν ) = D ( 1 + k · C ) .
The equivalent diffusion coefficient is composed by the physical diffusion coefficient D and by an artificial contribution k · C due to the hydrostatic stress effect. This factor is always greater than one, both for material with positive and negative fraction molar volume. Thus, hydrostatic stress effect always enhances lithium diffusion decreasing the concentration gradient within the particle.
This result can be derived even with general boundary conditions on the surface, that is, a general form of C 1 . The displacement in Equation (11) as a function of C 1 ( C 2 = 0 ) is replaced in the expression of the radial and hoop stress, and the hydrostatic stress is calculated according to Equation (17). After some calculations it gives:
σ h ( r ) = 2 Ω E 9 ( 1 ν ) C ( r ) + C 1 3 ( 1 ν ) 2 ( 1 ν ) Ω
Even in this condition the derivative of the hydrostatic stress with respect to the concentration has the same value computed before, leading to the same artificial diffusion contribution.
Lithium ion flux of the coupled problem in Equation (32) is formally similar to the flux of the uncoupled problem in Equation (21): namely it is equal to a coefficient multiplied for the derivative of the concentration with respect to the radius.
J = D e q v n C r
This observation allows to derive the same diffusion equation of the uncoupled problem (Equation (22)) introducing the new diffusion coefficient D e q v instead of the physical diffusion coefficient. Therefore, the same solutions derived for the uncoupled problem can be used also for the coupled one replacing the physical diffusion coefficient with the equivalent diffusivity.
The concentration solutions reported in Equations (25) and (26) become non-linear because the equivalent diffusion coefficient depends itself on concentration. Thus, an iterative calculation, described in Figure 2 must be performed as follows:
  • The concentration field is calculated according to the physical diffusion coefficient.
  • The equivalent diffusion coefficient is calculated for each radial position with the concentration function.
  • A new concentration function is computed with the equivalent diffusion coefficient computed in the previous iteration.
The iterations go on until the maximum difference between the concentration computed in the kth iteration and k 1 th is below a certain threshold. This iterative computation converges in few iterations to a stable value.
Once the concentration field is obtained, it is replaced in Equations (14)–(17) to get displacement, strains and stresses expressions for the coupled model.

3. Results and Discussion

In this section, the numerical results derived with the model explained in Section 2 are presented. The concentration functions for galvanostatic and potentiostatic insertion are compared with the results available in literature derived through numerical simulation. Then, concentration and stress function computed with the analytical model are presented in case of galvanostatic operation. The comparison between the coupled and uncoupled model highlights the hydrostatic stress influence on lithium diffusion. The results are derived according to the physical parameters reported in Table 1 and Table 2, referring to anode and cathode materials.

3.1. Compatibility between Model Assumptions and Real Material

Graphite and lithium manganese oxide (LMO) are chosen as case study for anode and cathode intercalation materials respectively. The compatibility between the assumptions of the analytical model and real active materials is discussed in this section. The linear elastic assumption is respected for all the insertion materials, because they show slight deformation. There are two aspects to discuss: geometry and homogeneity assumptions.
About the geometry assumption, it is necessary to understand how a sphere is capable to represent the random geometry of the active material particles. For some materials, such as NMC or graphite the real particle geometry is close to a sphere, as showed by SEM images in Reference [37,38,39], but for other materials, such as LMO or LCO, particles shape is more elongated and irregular. However, a modelling approach must overcome the statistical variation of the samples and give reasonable and general results which can be valid for the entire samples population. For this reason, an ideal geometry which can be extended and representative of all the other particles is adopted in this work, according the following reasoning. Simulations confirm that greater particle size results in higher stress, because of longer diffusion path. Hence, the radius is chosen so that the ideal spherical particle adopted in simulation circumscribes the mean real particle, once the statistical distribution of the particle size of a powder is known. In this manner, it is possible to give a safe estimation of the stress in the powder particles based on their size, overcoming the limit of the random distribution of the particles shapes. The results of the simulation at least overestimate the real stress in the particles of a powder, since a bigger spherical equivalent particle is used to simulate all the different particles shapes present in a powder.
For what concerns different ideal geometries, Zhang et al. studied the influence of the aspect ratio of an ellipsoidal LMO particle on the stress [21,22]. The results show that the stresses computed with aspect ratios different from one (one corresponds to the sphere) are ± 10 % of the stress computed with spherical geometry. Hence, spherical geometry minimizes the error due to the statistical distribution of the particle shape [21].
Some works analysed the stress over a realistic particle geometry extracted from SEM images [40,41,42,43]. The results show that the main difference between realistic particle and ideal spherical particle resides in the stress concentrations in notches. In future works, it is meaningful to study a generalized notch factor, based on the statistical analysis of powder samples, which can be representative of the notching effect of different active material particles. Indeed, stress concentration due to notching effect causes cracks propagation: the main reason for electrode damage and capacity fade.
Moreover, a recent work [44] demonstrated how the assumptions of spherical geometry and isotropic and linear elastic material are accurate for LCO and graphite, since they found a good agreement between the macroscopic deformation predicted by their numerical model and the experimental measurements conducted on pouch cell. Finally, spherical assumption is widely accepted among several works [20,21,22,26,45].
The second aspect concerns the homogeneity assumption. This aspect can be still divided in two issues: phase transition during Li insertion and inhomogeneity of primary particles. Phase transition occurs in some materials when lithium content exceeds the equilibrium concentration. Lithium ions begin to intercalate in different type of interstices above the equilibrium concentration, modifying the crystallographic structure: this leads to a stress and concentration jump between the two phases because they are characterized by different physical parameters. Christensen et al. pointed out that LMO shows a single phase in the 4V plateau, and the transformation in cubic-tetragonal phase occurs with deep discharge [20]. In LCO, which has a negative partial molar volume, Li poor phase has a larger partial molar volume than the lithium rich phase [46]. Therefore, as the second phase starts to form during the discharge process, the magnitude of stress starts to decrease—phase change leads to a safer condition in this case.
However, a simple general approach which considers phase transition in our model is the following: it is necessary to change the physical parameters according to the concentration level with a moving boundary concept. When the concentration level exceeds the equilibrium concentration of a phase in a certain radial position, equilibrium concentration and physical parameters (Young modulus, Poisson ratio and especially partial molar volume) must be changed with the physical parameters of the new phase. During insertion the “boundary” between the two phases moves towards the core, and the physical parameters must be changed accordingly. So, phase transition can be implemented in the model in Section 2 tuning the input parameters, but the framework of the model remains unchanged.
The particles of some materials, such as NMC, are synthesized from primary particles [39]. However, it is hard to model the influence of randomly distributed primary particles which compose secondary particle, and because of the random orientation of primary particles, secondary particles are usually assumed as a continuum material [47,48]. However, Wu et al. [49] tried to consider the influence of primary particle on the stress.

3.2. Comparison with the Results of Numerical Models in Literature

The analytical solution of DIS problem was proposed by Cheng et al. [16] according the uncoupled formulation. As far as the authors know, analytical solution of the coupled problem are still not available in literature. Generally, the finite difference method [18,20,21,23,24] or FE simulations [16,21,27,33] in commercial codes were adopted in order to solve the DIS problem in the coupled formulation. Following the procedure explained in Section 2, the analytical solutions of the standard diffusion problem are used to get the solution of the DIS coupled problem via an iterative computation, which is a much simpler way compared to solve the whole coupled equation (Equation (28)) with finite difference method or building up a FE analysis.
The concentration function computed with the analytical model in galvanostatic and potentiostatic insertion are compared with the results derived via finite different method by Bagheri et al. [26] in Figure 3. A good agreement is achieved between the analytical model proposed in this work and Reference [26] derived via numerical computation. Furthermore the concentration trend with and without “stress effect” matches with the results of Zhang et al. [21] and Christensen et al. [19]. Moreover the results of the uncoupled model matches with the model derived by Cheng et al. [16]. Even the stress functions fits faithfully the numerical results available in the literature, since they depend uniquely on concentration.
The lack of stress measurements in insertion material particles makes the results in this work impossible to be validated experimentally, as pointed out even by other authors [26], and mathematical modelling is the only way to make these computations.

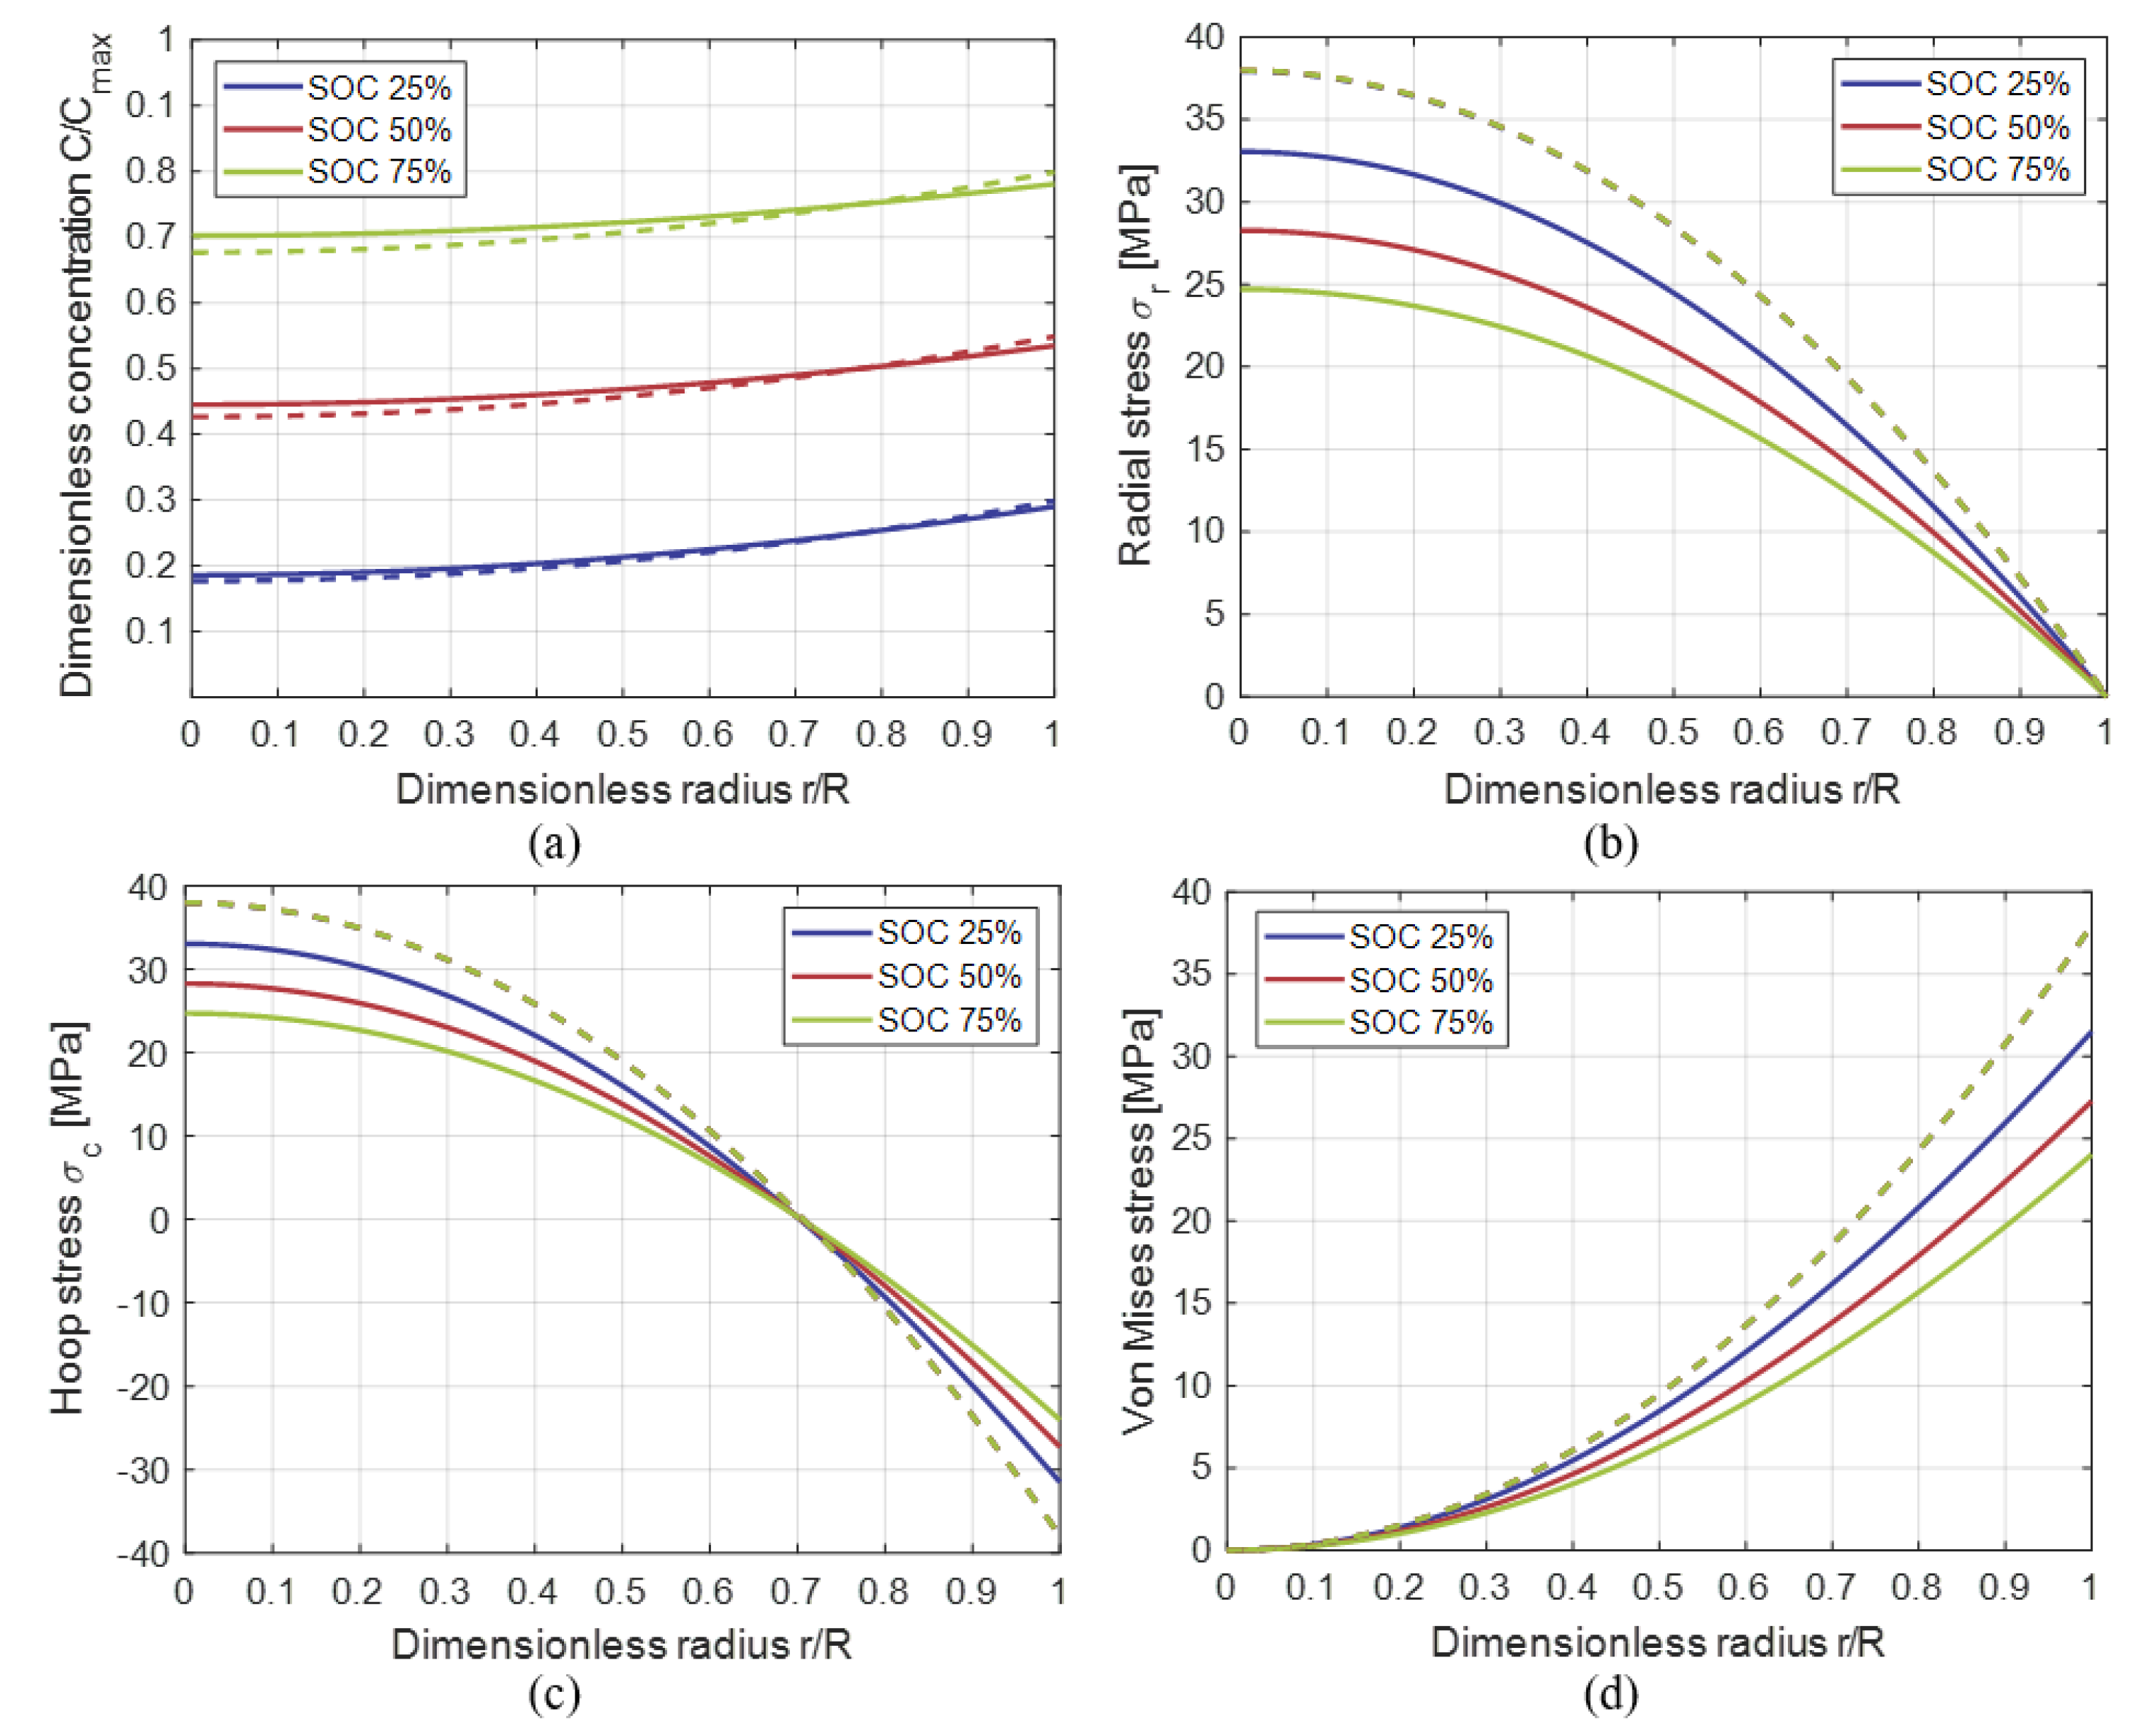
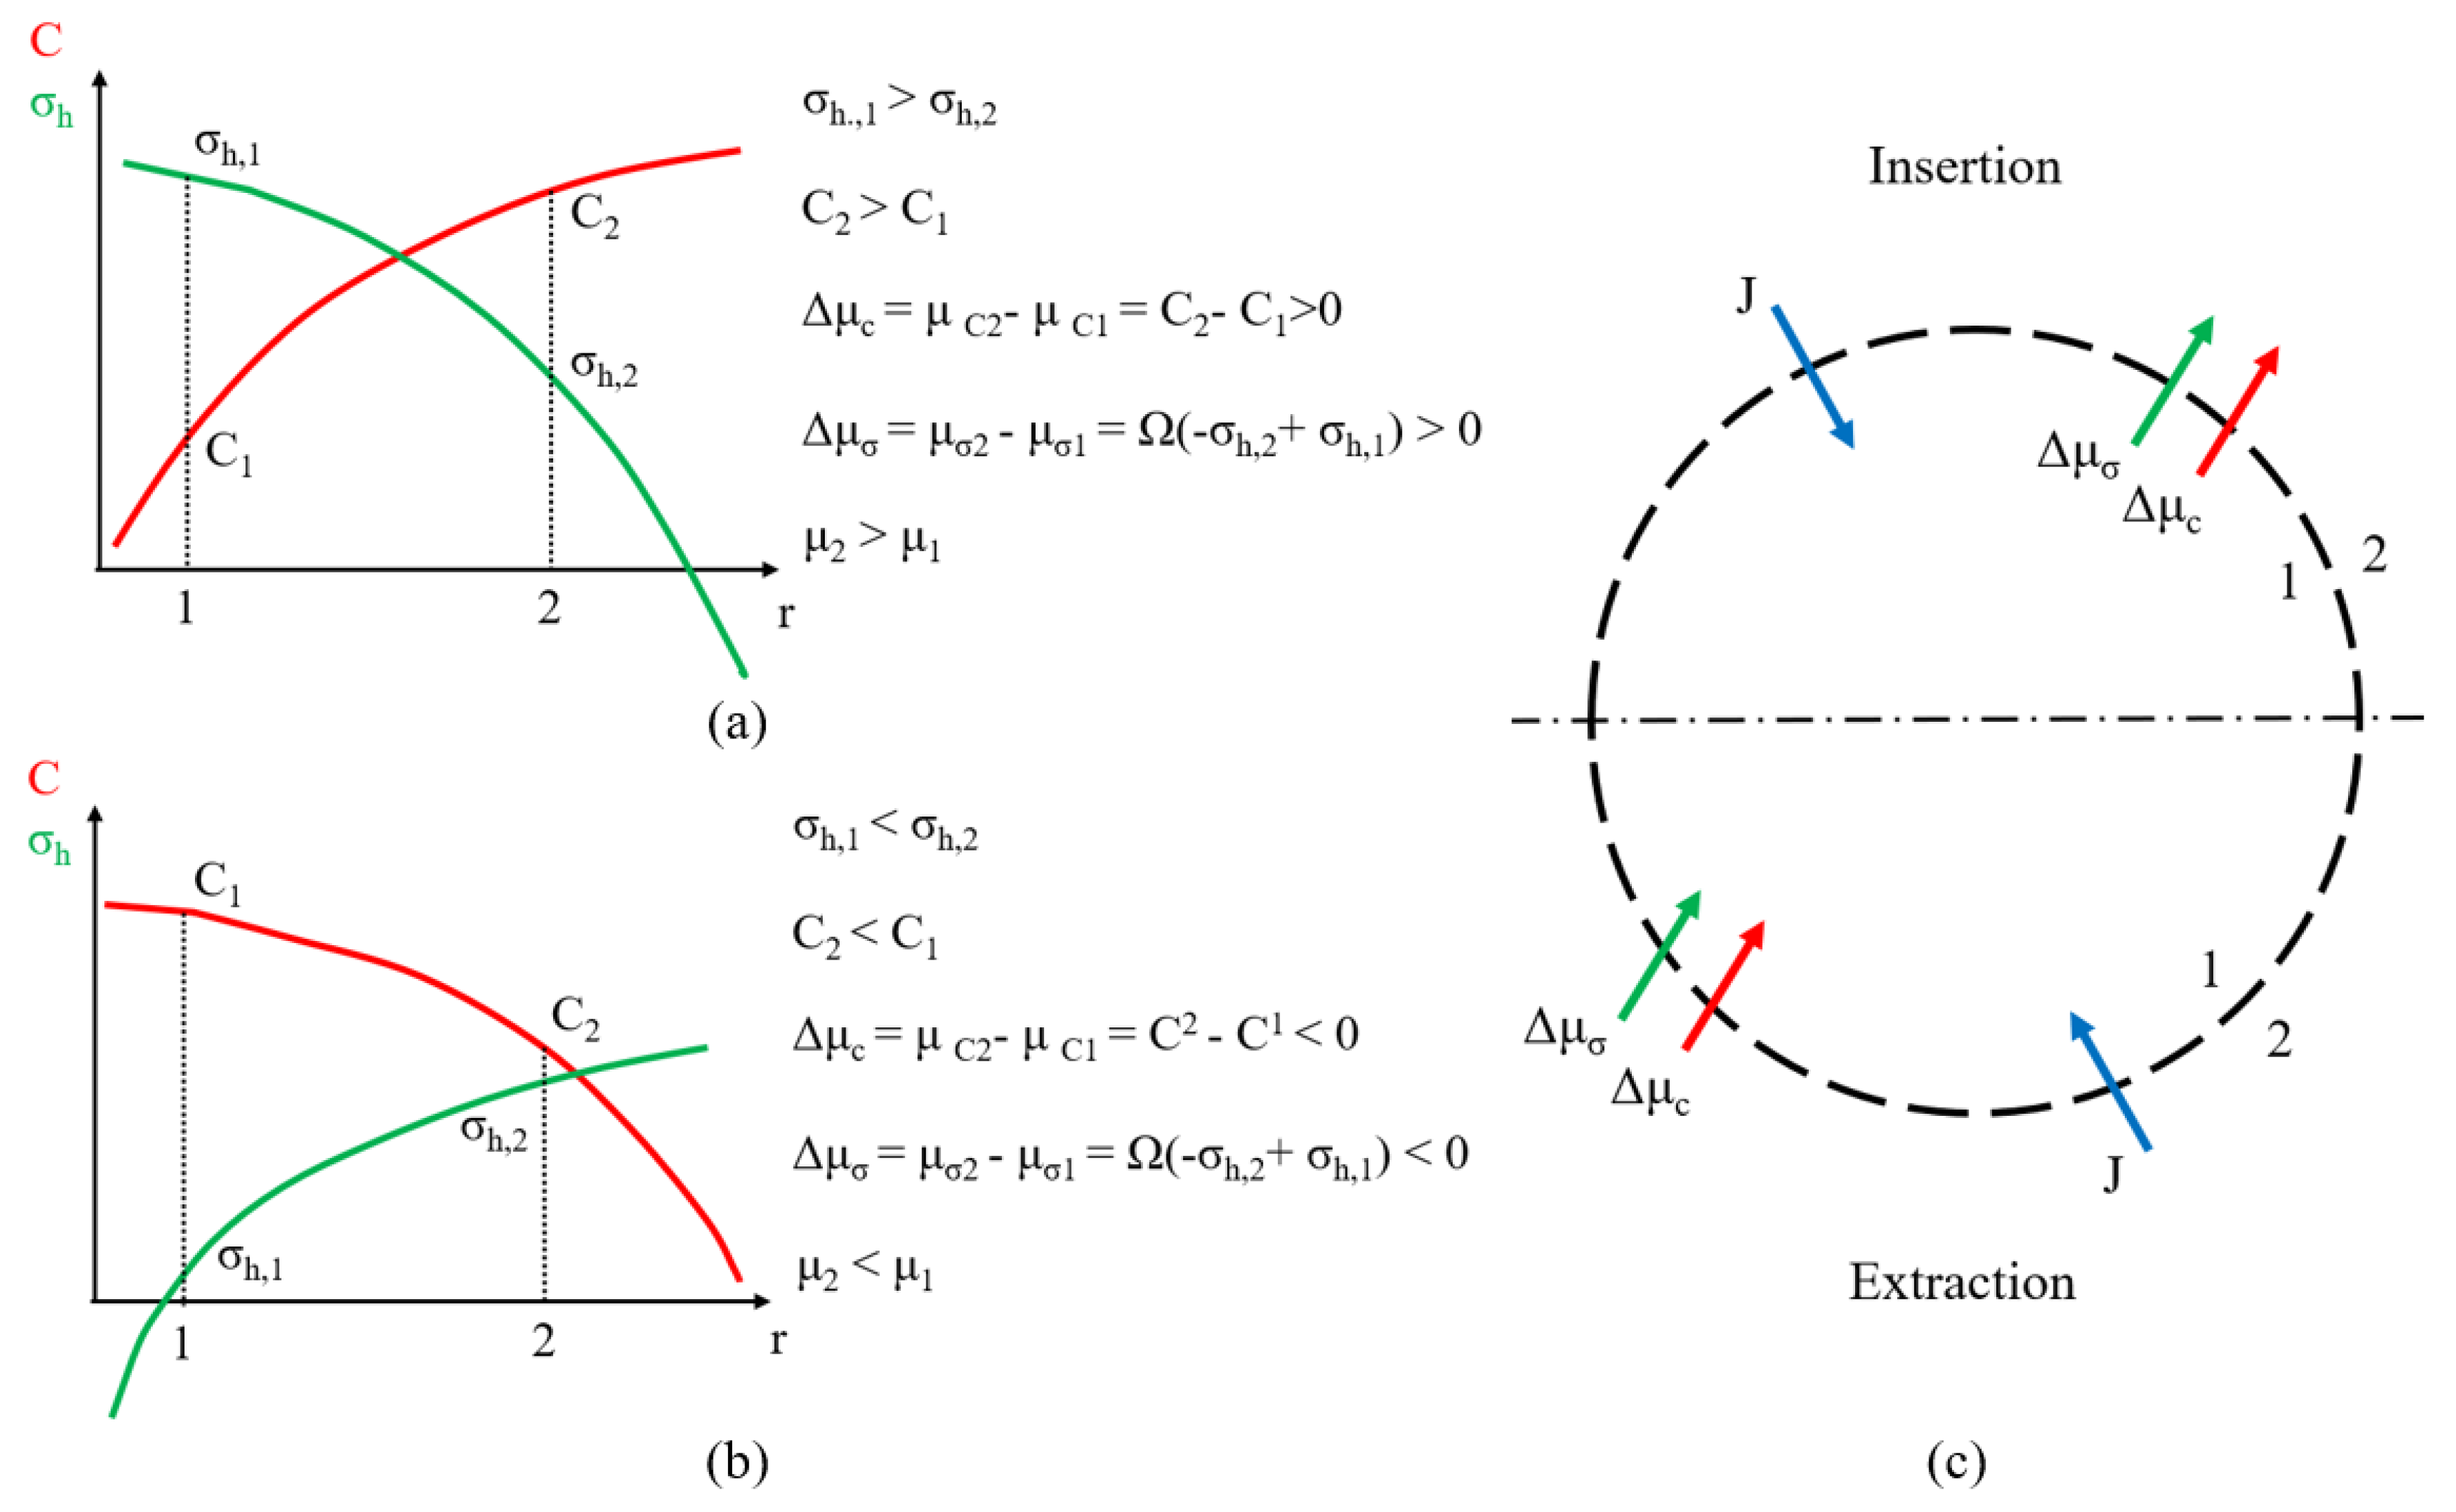
3.3. Insertion under Galvanostatic Control

Concentration level and the stress functions in galvanostatic insertion are computed with the analytical model proposed in Section 2 assuming null initial concentration. The results are derived for three different SOC levels: 25%, 50%, 75%. The SOC level is calculated according to Zhang [26,50] as:
S O C = 0 R c ( r ) r 2 d r 0 R c m a x r 2 d r · 100 .
The current density over the particle surface is 3 A/m2, which corresponds roughly to 2C. The temperature is assumed to be constant at 298 K. The results for anode and cathode particles whose physical parameters are listed in Table 1 and Table 2 are reported in Figure 4 and Figure 5.
The concentration level normalized with the maximum concentration value which can be stored in the active material particles is reported in Figure 4a. So, when the normalized concentration is equal to the unity all the available sites in the particle are occupied by lithium ions. Radial, hoop and Von Mises stress are reported in Figure 4b–d for graphite particles. The same data are reported in Figure 5 for LMO particles.
The pressure diffusion dependence determines a greater equivalent diffusion coefficient which allows a faster lithium diffusion within the particle. In particular enhances mass transport from areas subjected to compression to areas subjected to tensile stress. This fact makes the lithium concentration gradient predicted by the coupled model lower if compared to the uncoupled model, as shown in Figure 4a and Figure 5a. Remembering the thermal analogy, lower gradient means lower stress, so the coupled model predicts a lower stress state, as highlighted in Figure 4b–d and Figure 5b–d; the differences between the two model are up to 40%. The differences between the stresses computed with the three SOC levels are small (the maximum is 15% for graphite and 7% for LMO), this suggests that the active material particles experience similar stresses during almost the whole SOC range.
The comparison between the results obtained for anode (Figure 4) and cathode (Figure 5) shows the influence of the diffusion coefficient. Indeed, the slight difference in the diffusion coefficient between LMO and graphite produces an important increase of the concentration gradient in the cathode particles, which in turn causes a serious increase of the stress. Consequently, a greater equivalent stress makes the coupling between mechanical and diffusion aspect stronger.
This results in a greater difference between the concentration computed with the coupled model or the uncoupled one in LMO because the mechanical component in the chemical potential (Equation (18)) becomes greater.

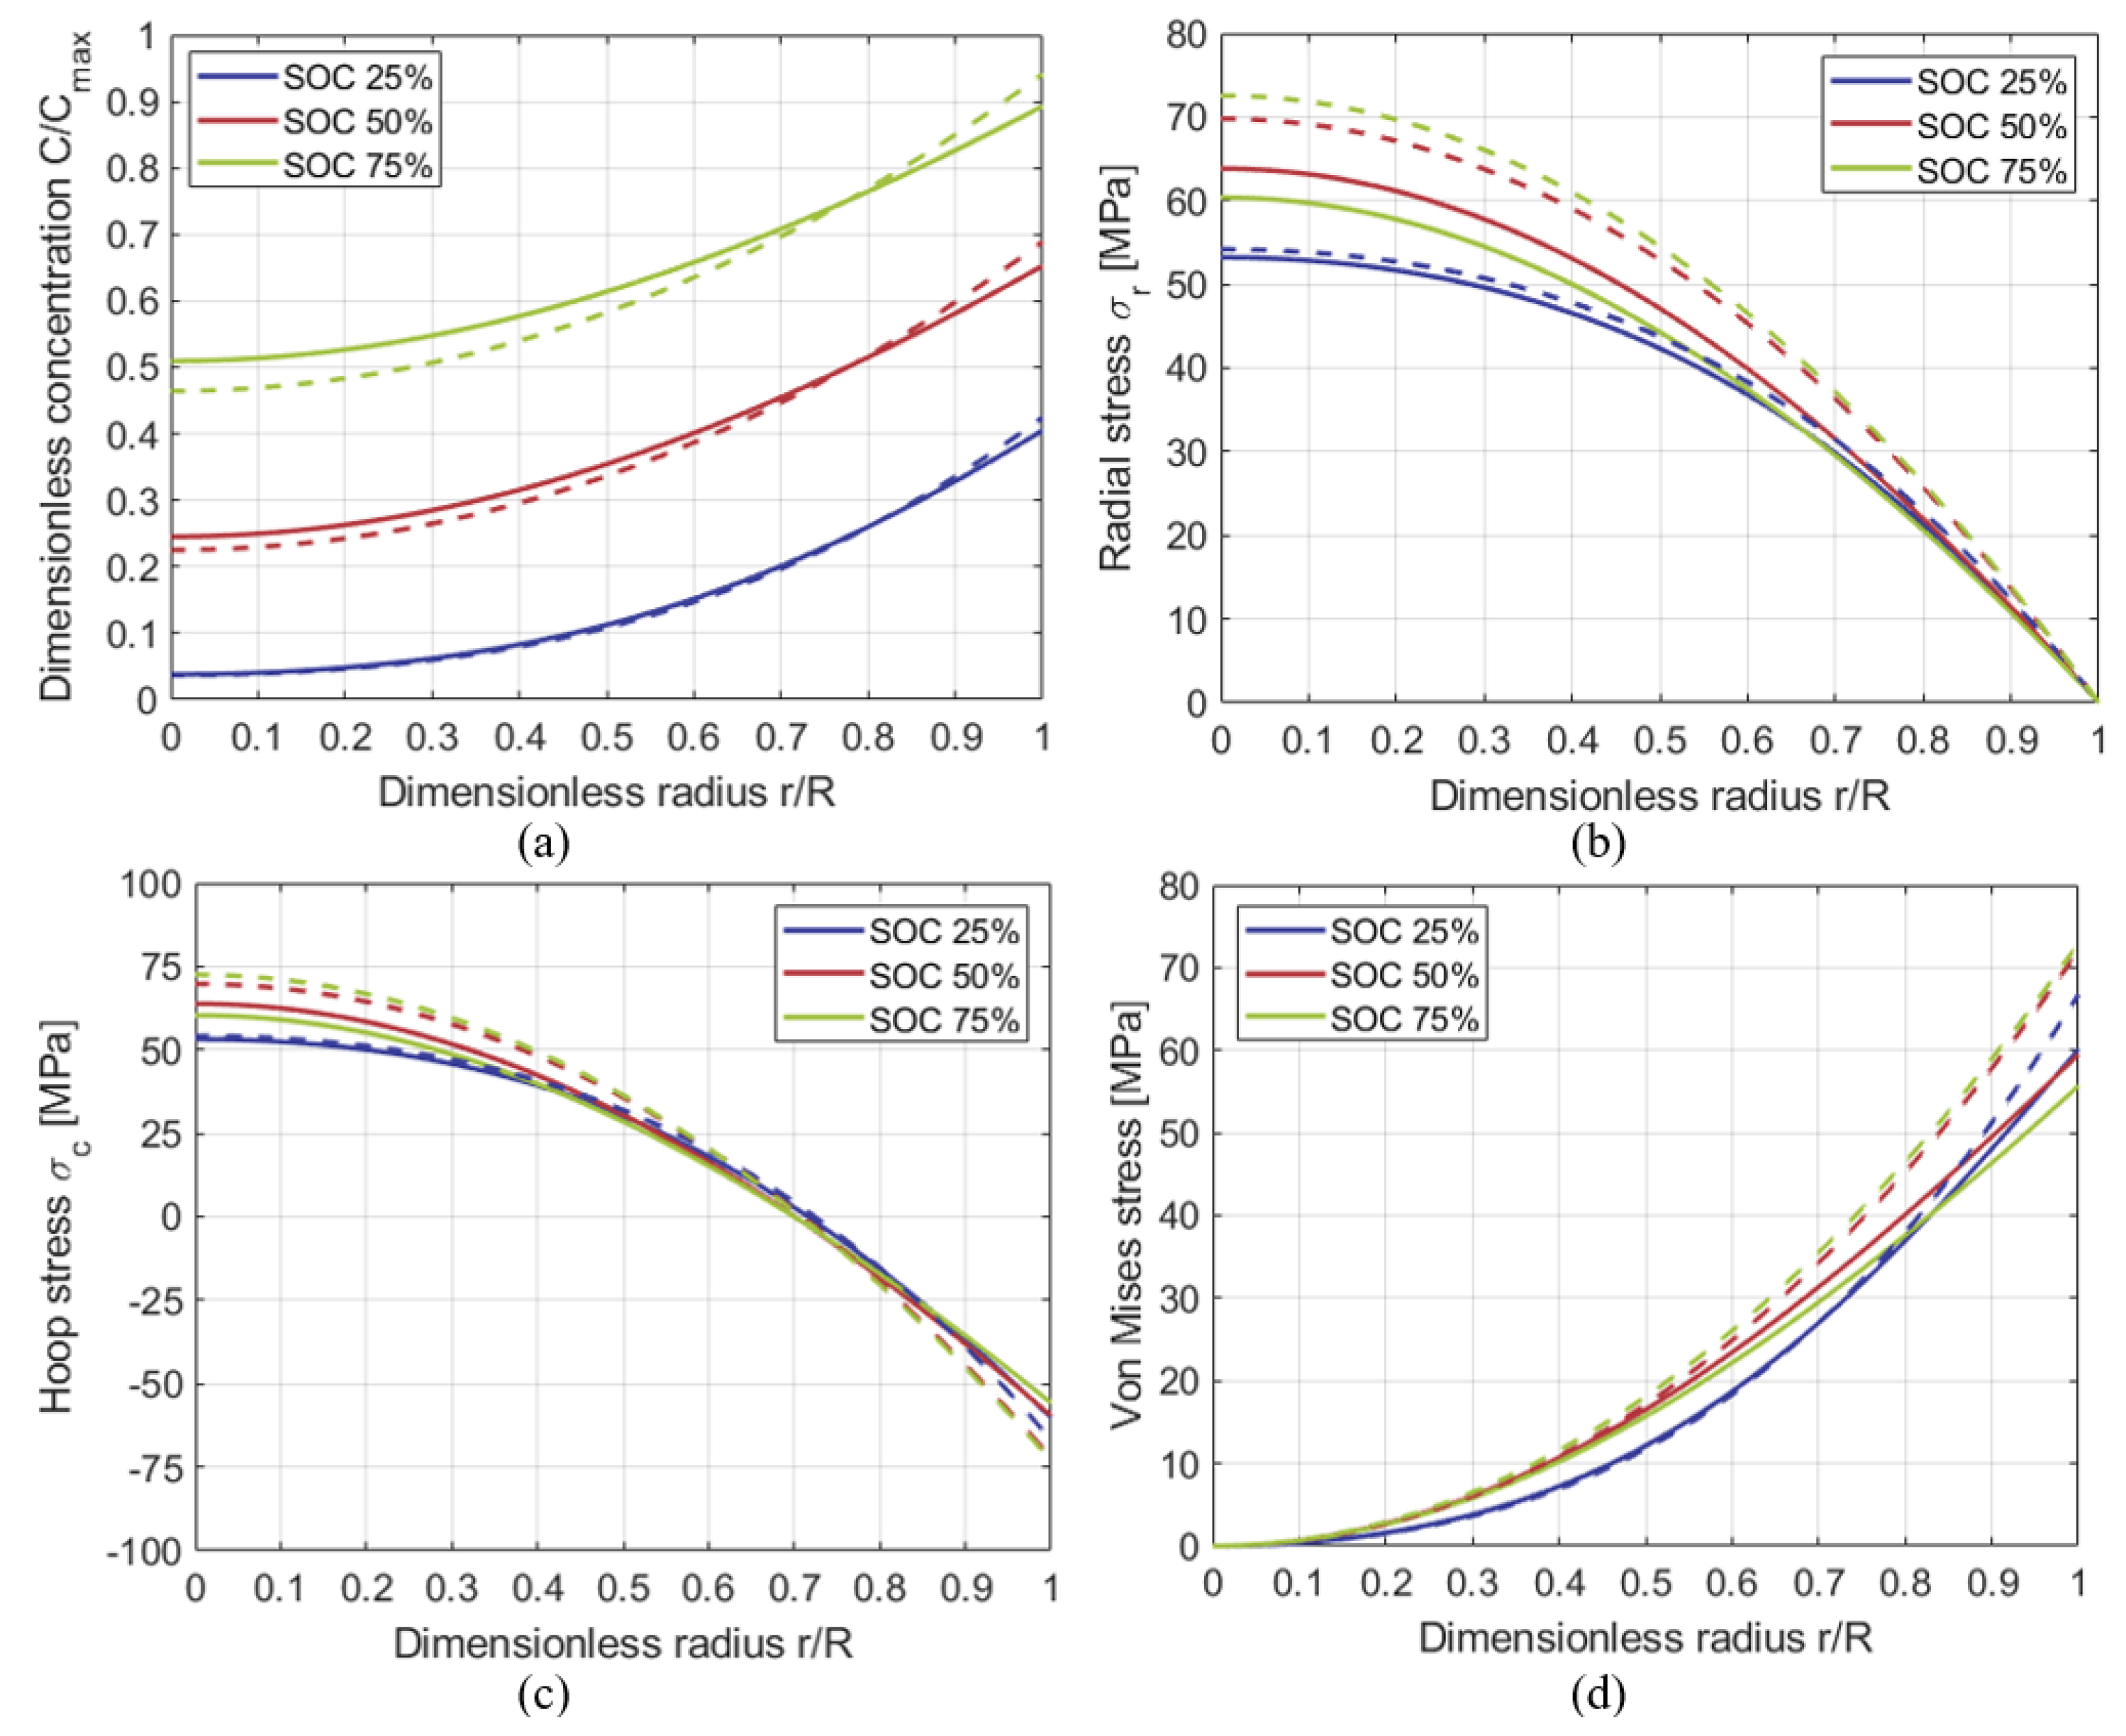
3.4. Extraction under Galvanostatic Control

The galvanostatic extraction is modelled assuming an initial concentration within the particle equal to C m a x , namely SOC 100%, and surface current density equal to −3 A/m2. The extraction determines a reduction of the SOC level, and the result for SOC equal to 75%, 50% and 25% are reported in Figure 6 and Figure 7 for anode and cathode material, respectively. Concentration is reported in Figure 6a, radial, hoop and Von Mises stress are reported in Figure 6b–d for graphite. The same data are reported in Figure 7 for LMO.
The same conclusions made for insertion about the differences of concentration and stress state between the coupled and uncoupled model can be made also for extraction. The differences between the stress computed with the coupled and uncoupled model are up to 35%. In Figure 6c and Figure 7c it is highlighted that the particle experiences tensile hoop stress on its surface during galvanostatic extraction, which is supposed to be the driving force for crack propagation in active material [30].

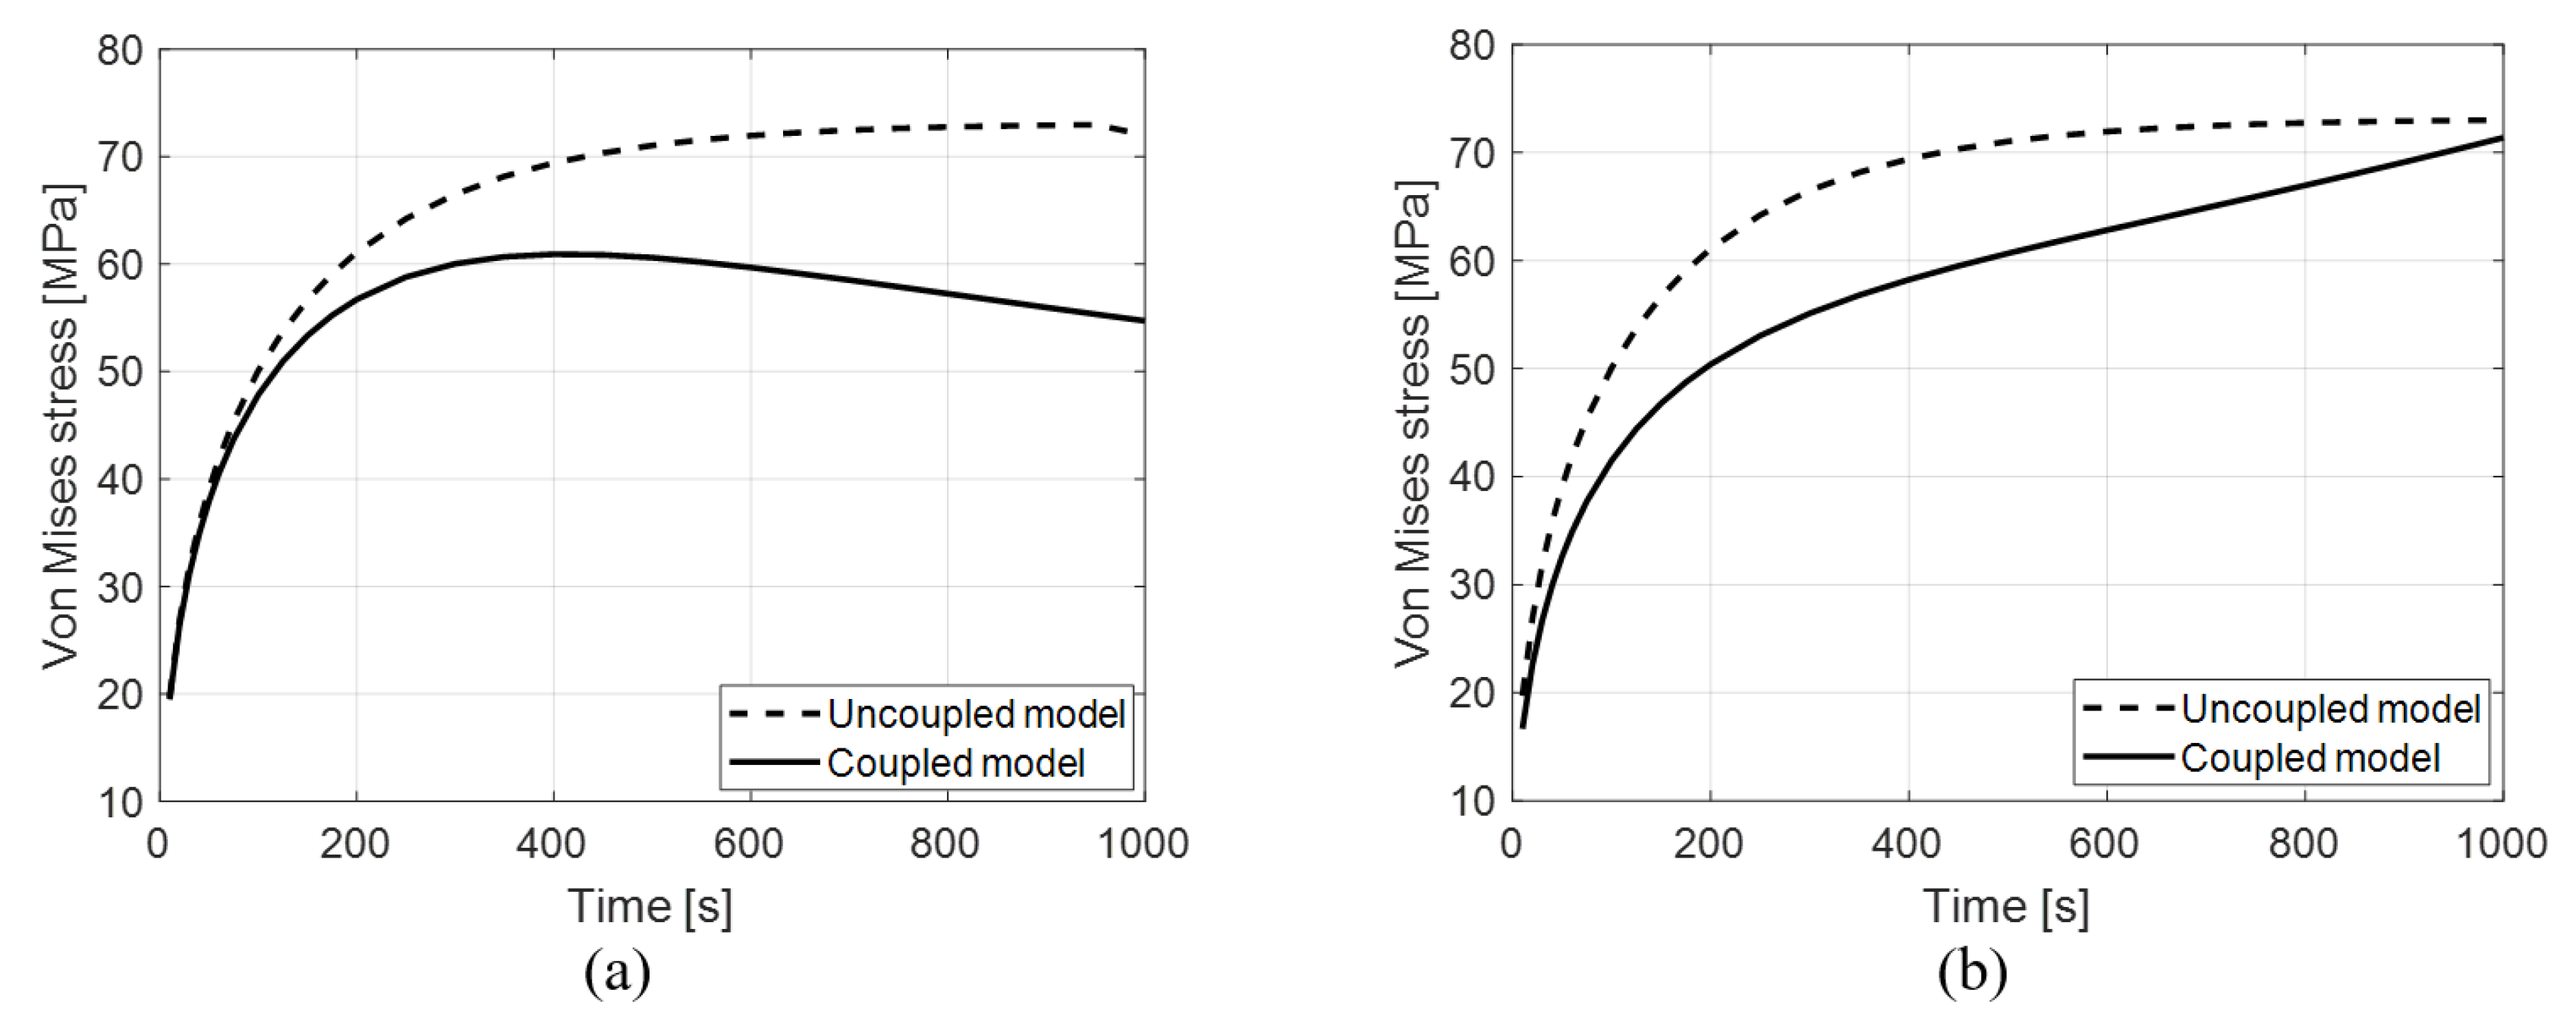
3.5. Evolution of Von Mises Stress in Time

The continuous evolution in time of the Von Mises stress is shown in Figure 8. The hydrostatic stress effect homogenizes the lithium concentration within the particle, so the stress values computed by the coupled model are lower than the uncoupled one, in accordance with Reference [21]. On the contrary, for high extraction time the stress predicted by the coupled model tends to the uncoupled one.

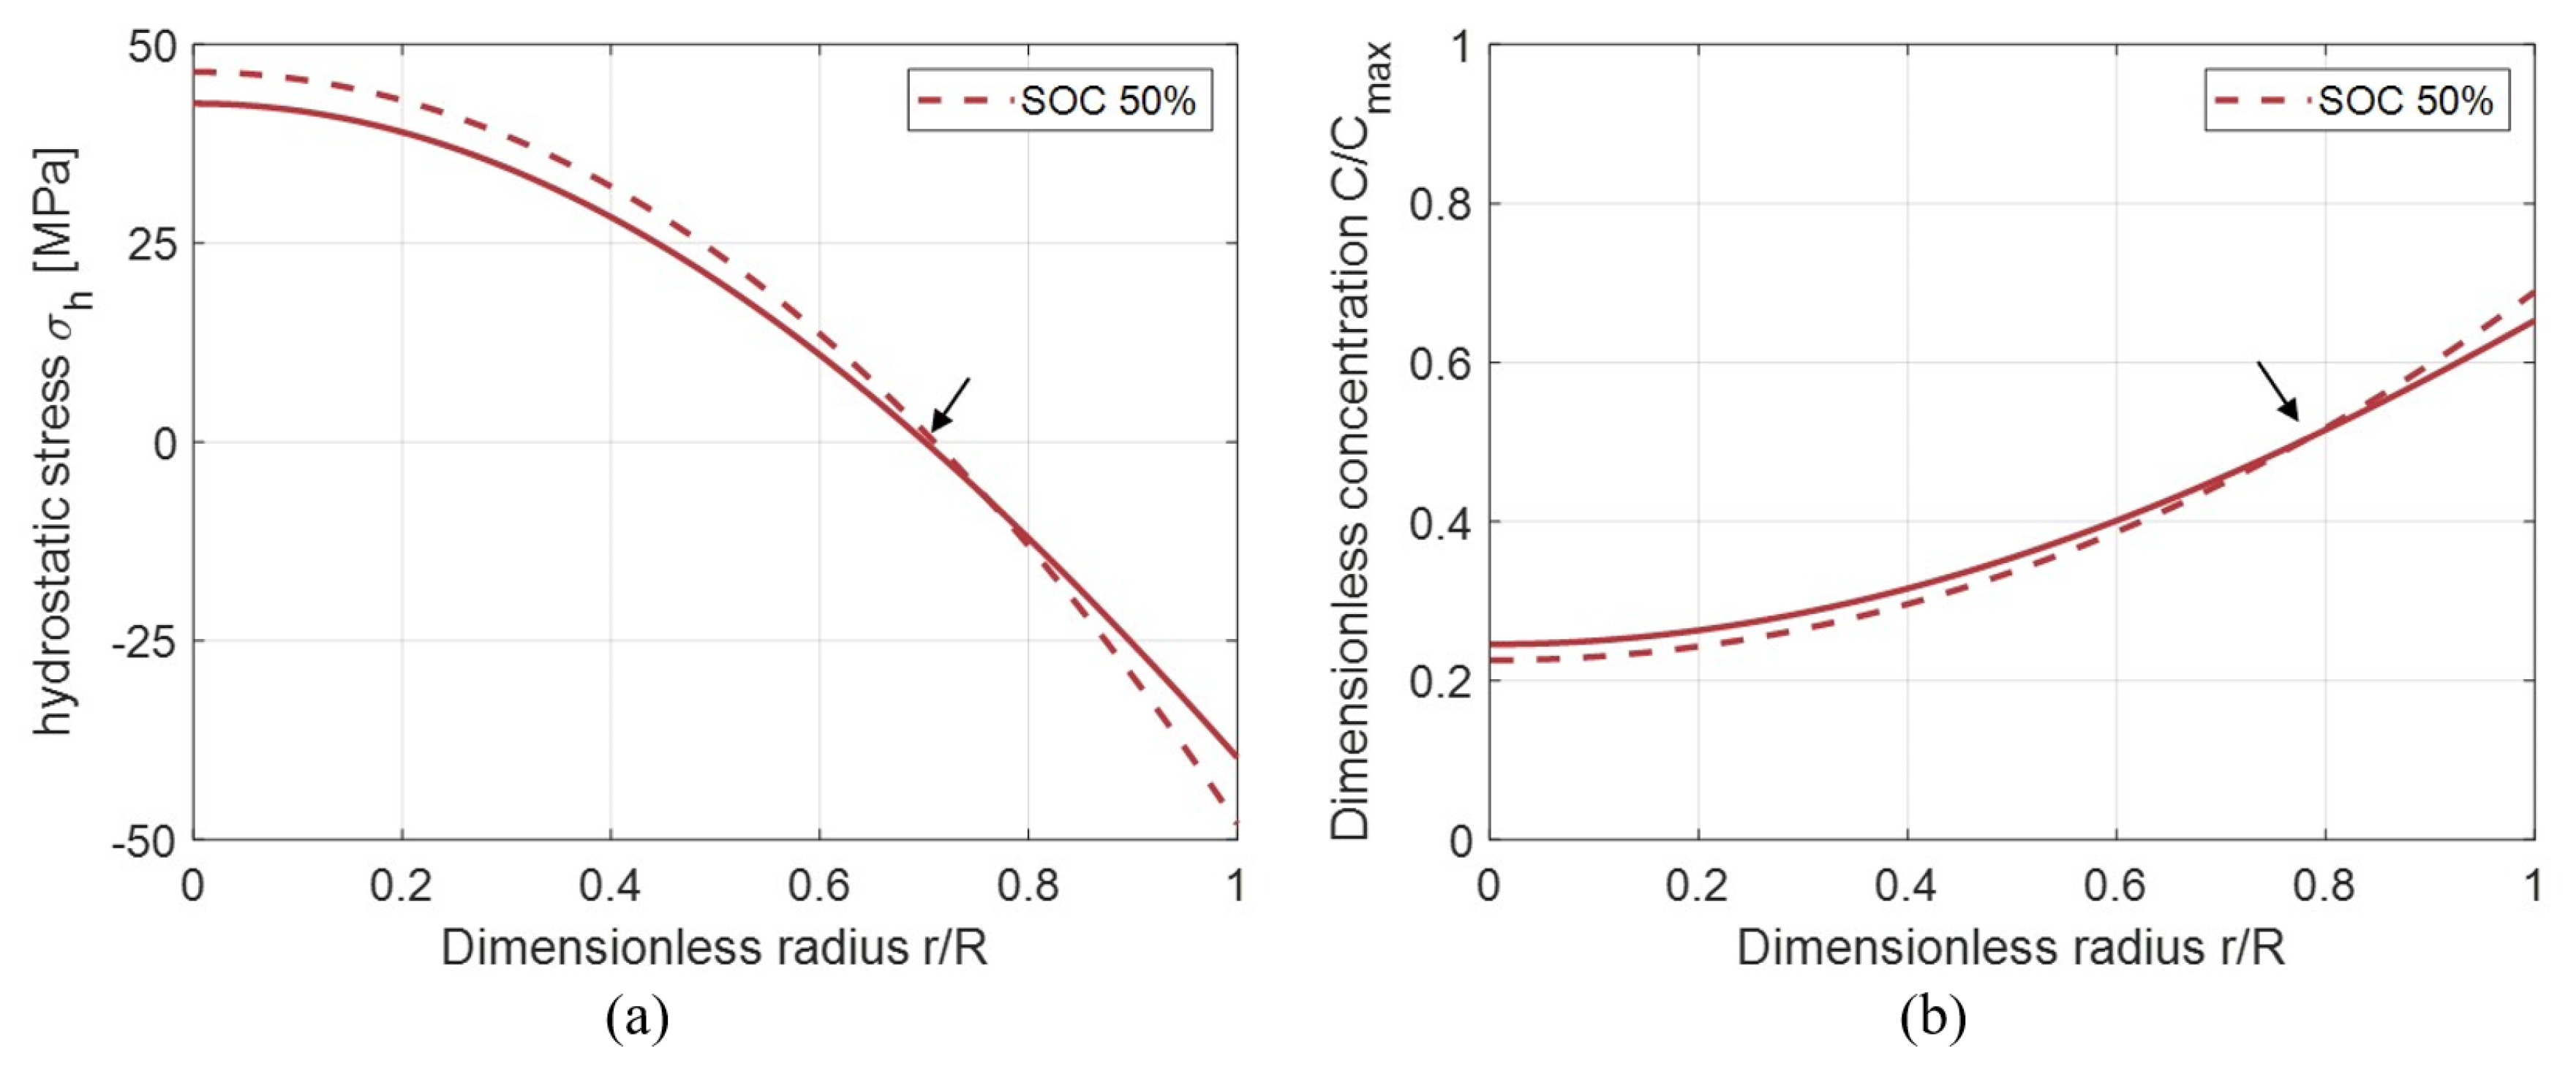
3.6. Influence of Hydrostatic Stress on Concentration

Hydrostatic stress influence always enhances lithium diffusion. This assertion is justified from a quantitative point of view by the artificial contribution to the equivalent diffusion coefficient in Equation (30). This contribution is always positive regardless of the insertion or extraction operation, time constant or radial position, so the coupled model is always characterized by a greater diffusion coefficient which decreases the concentration gradient within the particle, as showed in Figure 4a, Figure 5a, Figure 6a and Figure 7a.
This concept is qualitatively explained in Figure 9. Indeed, the chemical potential in Equation (18) can be split in the concentration contribution ( μ C = R g T ln ( C ) ) and the hydrostatic stress contribution ( μ σ = Ω σ h ) as follow: μ = μ C + μ σ . In case of insertion, referring to Figure 9a, the concentration C 2 at r + d r is greater than the concentration C 1 at r d r for a generic radial coordinate r, resulting in a positive concentration contribution. In the same way the hydrostatic stress σ h , 2 at r + d r is lower than the hydrostatic stress σ h , 1 at r d r , resulting in a positive hydrostatic stress contribution. This analysis can be extended to all the radial coordinates from zero to R because both concentration and hydrostatic stress are monotonic. Therefore, both the contributions are concordant due to the shape of concentration and hydrostatic stress functions showed in Figure 9a, and concur to the incoming flux. This analysis is also valid for extraction, as explained in Figure 9b. In this case, concentration, hydrostatic stress and thus chemical potential contributions are the opposite, resulting in an outgoing flux.
On the other hand, hydrostatic stress influences the concentration level in the particle. Tensile hydrostatic stress allows to store a greater amount of lithium ions, on the contrary compressive hydrostatic stress determines a reduction of the storable lithium ions. These differences are highlighted comparing the results with the uncoupled model, which neglects the influence of the hydrostatic stress on the lithium concentration. Referring to Figure 10a, black arrows mark the border between positive and negative hydrostatic stress. This trend matches with the differences in concentration function computed with the two models in Figure 10b: where the hydrostatic stress is positive the concentration level of the coupled model is higher than the uncoupled one, where the hydrostatic stress is negative the coupled model predicts a lower concentration level compared to the uncoupled model. About this issue it is worth noting that the model in this work assumes free expansion of the particle surface, neglecting the interaction with its surroundings.
A more accurate model should consider the surface constraints of the particle which are supposed to generate an increase in the compressive stress and in turn lower achievable concentration values. Future works should be carried out in order to confirm this hypothesis.

4. Conclusions

The stress state within active material particle of graphitic anode and LMO cathode are computed with coupled and uncoupled model according to DIS theory, assuming no constraints on the external surface. The analytical solution of the coupled model is proposed in this work defining an equivalent diffusion coefficient composed by a physical term and by an artificial contribution connected to the hydrostatic stress. This definition allows to exploit the analytical solutions of the uncoupled model even for the coupled one with an iterative calculation, since the equivalent diffusion coefficient depends itself on concentration.
The results derived with the analytical solution of the coupled model are compared with the solutions derived with numerical methods in literature and show a good agreement. The analytical solution proposed in this work is easier and requires a lower computing time if compared to strongly non-linear FE method or finite difference method. The concentration function and the stress state within the particle are computed for three SOC levels: 25%, 50%, 75%. The differences between the stresses computed with the different SOC levels are small: this fact suggests that particles experience almost the same stress state during about the whole SOC window. The differences between the stress state in LMO and graphite is mainly due to diffusion: a smaller diffusion coefficient causes higher lithium concentration gradient, and higher stress consequently (up to 40%), according to thermal analogy concept. Thus, the coupling factor Ω σ h in chemical potential becomes higher and the differences between coupled and uncoupled model are not negligible.
Finally, it is pointed out that tensile stress, in particular tensile hoop stress which occurs on the particle surface during extraction, is the driving force for crack propagation, which in turn damages the active material and accelerates the SEI growth. On the other hand, compressive hydrostatic stress influences the lithium solubility decreasing the achievable capacity, namely the lithium ions which can be stored in the host material. An increase of compressive stress is expected if surface constraints are considered, because the particle expansion is prevented. Future works should analyse this issue which can result in a not negligible achievable capacity reduction.

Author Contributions

Conceptualization, D.C., F.M. and A.S.; methodology, D.C., F.M. and A.S.; formal analysis, D.C.; investigation, D.C., F.M.; Writing—Original draft preparation, D.C.; writing–review and editing, F.M. and A.S.; supervision, F.M. and A.S. All authors have read and agreed to the published version of the manuscript.

Funding

This research received no external funding.

Conflicts of Interest

The authors declare no conflict of interest.

Abbreviations

The following abbreviations are used in this manuscript:
CConcentrationmol/m 3
C 0 Initial concentrationmol/m 3
C m a x Maximum concentrationmol/m 3
C r Surface concentrationmol/m 3
DDiffusion coefficientm 2 /s
D e q v Equivalent diffusion coefficientm 2 /s
EYoung Modulus M P a
FFaraday constant96485.332 As/mol
ICurrent densityA/m 2
JLithium fluxmol/m 2 s
MMobilitymol· s/Kg
rRadiusm
RParticle radiusm
R g Gas constant8.3145 J/mol K
S O C State of charge-
TTemperature 298K
uDisplacementm
xNormalized radial coordinate-
ϵ c Hoop strain-
ϵ c h Chemical strain-
ϵ r Radial strain-
μ Chemical potentialJ/mol
μ 0 Reference chemical potentialJ/mol
υ Poisson ratio-
σ c Hoop stressMPa
σ h Hydrostatic stressMPa
σ r Radial stressMPa
τ Characteristic time-
Ω Partial molar volumem 3 /mol

References

  1. Miao, Y. Current li-ion battery technologies in electric vehicles and opportunities for advancements. Energies 2019, 12, 1074. [Google Scholar] [CrossRef] [Green Version]
  2. Soma, A. Hybridization Factor and Performance of Hybrid Electric Telehandler Vehicle. IEEE Trans. Ind. Appl. 2016, 52, 5130–5138. [Google Scholar] [CrossRef]
  3. Mocera, F. Battery performance analysis for working vehicles applications. IEEE Trans. Ind. Appl. 2019, 56, 644–653. [Google Scholar] [CrossRef]
  4. Vergori, E. Battery modelling and simulation using a programmable testing equipment. Computers 2018, 7, 20. [Google Scholar] [CrossRef] [Green Version]
  5. Kleiner, J. Thermal modelling of a prismatic lithium-ion cell in a battery electric vehicle environment: Influences of the experimental validation setup. Energies 2019, 13, 62. [Google Scholar] [CrossRef] [Green Version]
  6. Gantenbein, S. Capacity fade in lithium-ion batteries and cyclic aging over various state-of-charge ranges. Sustainability 2019, 11, 6697. [Google Scholar] [CrossRef] [Green Version]
  7. Lee, D. Modeling the Effect of the Loss of Cyclable Lithium on the Performance Degradation of a Lithium-Ion Battery. Energies 2019, 12, 4386. [Google Scholar] [CrossRef] [Green Version]
  8. Willenberg, L.K. High-Precision Monitoring of Volume Change of Commercial Lithium-Ion Batteries by Using Strain Gauges. Sustainability 2020, 12, 557. [Google Scholar] [CrossRef] [Green Version]
  9. Qi, Z.; Shan, Z.; Ma, W.; Li, L.; Wang, S.; Li, C.; Wang, Z. Strain Analysis on Electrochemical Failures of Nanoscale Silicon Electrode Based on Three-Dimensional in Situ Measurement. Appl. Sci. 2020, 10, 468. [Google Scholar] [CrossRef] [Green Version]
  10. Cheng, X. In situ stress measurement techniques on li-ion battery electrodes: A review. Energies 2017, 10, 591. [Google Scholar] [CrossRef]
  11. Prussin, S. Generation and distribution of dislocations by solute diffusion. J. Appl. Phys. 1961, 32, 1876–1881. [Google Scholar] [CrossRef]
  12. Larchè, J. A linear theory of thermochemical equilibrium of solids under stress. Acta Metall. 1973, 8, 1051–1063. [Google Scholar] [CrossRef]
  13. Larchè, J. The effect of self-stress on diffusion in solids. Acta Metall. 1982, 30, 1835–1845. [Google Scholar] [CrossRef]
  14. Chu, J.L. Chemical stresses in composite circular cylinders. J. Appl. Phys. 1993, 73, 2239–2248. [Google Scholar] [CrossRef]
  15. Chu, J.L. The effect of chemical stresses on diffusion. J. Appl. Phys. 1994, 75, 2823–2829. [Google Scholar] [CrossRef]
  16. Cheng, Y.T. Evolution of stress within a spherical insertion electrode particle under potentiostatic and galvanostatic operation. J. Power Sources 2009, 190, 453–460. [Google Scholar] [CrossRef]
  17. Cheng, Y.T. The influence of surface mechanics on diffusion induced stresses within spherical nanoparticles. J. Appl. Phys. 2008, 104, 083521. [Google Scholar] [CrossRef]
  18. Christensen, J. Modeling diffusion-induced stress in Li-ion cells with porous electrodes. J. Electrochem. Soc. 2010, 157, 336–386. [Google Scholar] [CrossRef]
  19. Christensen, J. Stress generation and fracture in lithium insertion materials. J. Solid State Electrochem. 2006, 10, 293–319. [Google Scholar] [CrossRef]
  20. Christensen, J. A mathematical model of stress generation and fracture in lithium manganese oxide. J. Electrochem. Soc. 2006, 153, 1019–1030. [Google Scholar] [CrossRef]
  21. Zhang, X. Numerical simulation of intercalation-induced stress in Li-Ion battery electrode Particles. J. Electrochem. Soc. 2007, 154, 910–916. [Google Scholar] [CrossRef]
  22. Zhang, X. Intercalation-induced stress and heat generation within single lithium-ion battery cathode particles. J. Electrochem. Soc. 2008, 155, 542–555. [Google Scholar] [CrossRef]
  23. Wang, W.L. Effect of chemical stress on diffusion in a hollow cylinder. J. Appl. Phys. 2002, 91, 9584–9590. [Google Scholar] [CrossRef]
  24. Wang, W.L. Interaction between diffusion and chemical stresses. Mater. Sci. Eng. A 2005, 409, 153–159. [Google Scholar]
  25. Zhao, Y. A review on modeling of electro-chemo-mechanics in lithium-ion batteries. J. Power Sources 2018, 413, 259–283. [Google Scholar] [CrossRef]
  26. Bagheri, A. On the effects of hydrostatic stress on Li diffusion kinetics and stresses in spherical active particles of Li-ion battery electrodes. J. Power Sources 2019, 137, 103–134. [Google Scholar] [CrossRef]
  27. Eshghinejad, A. The coupled lithium ion diffusion and stress in battery electrodes. Mech. Mater. 2015, 91, 343–350. [Google Scholar] [CrossRef] [Green Version]
  28. Haftbaradaran, H. Continuum and atomistic models of strongly coupled diffusion, stress, and solute concentration. J. Power Sources 2011, 196, 361–370. [Google Scholar] [CrossRef]
  29. Wu, B. A consistently coupled multiscale mechanical–electrochemical battery model with particle interaction and its validation. J. Mech. Phys. Solids 2019, 125, 89–111. [Google Scholar] [CrossRef]
  30. Deshpande, R. Battery cycle life prediction with coupled chemical degradation and fatigue mechanics. J. Electrochem. Soc. 2012, 159, 1730–1738. [Google Scholar] [CrossRef]
  31. Kotak, N. Electrochemistry-mechanics coupling in intercalation electrodes. J. Electrochem. Soc. 2018, 165, 1064–1083. [Google Scholar] [CrossRef] [Green Version]
  32. Zhang, Y. Simulation of crack behavior of secondary particles in Li-ion battery electrodes during lithiation/de-lithiation cycles. J. Mech. Sci. 2018, 155, 178–186. [Google Scholar] [CrossRef]
  33. Grantab, R. Pressure-gradient dependent diffusion and crack propagation in lithiated silicon nanowires. J. Electrochem. Soc. 2012, 159, 584–591. [Google Scholar] [CrossRef]
  34. Verbrugge, M.W. Stress and strain-energy distributions within diffusion-controlled insertion-electrode particles subjected to periodic potential excitations. J. Electrochem. Soc. 2009, 156, 927–937. [Google Scholar] [CrossRef]
  35. Tang, Z.Y. Determination of the Lithium Ion Diffusion Coefficient in Graphite Anode Material. Acta Phys. Chim. Sin. 2001, 17, 388. [Google Scholar]
  36. Jun, G.H. Diffusion coefficient of lithium in artificial graphite, mesocarbon microbeads, and disordered carbon. New Carbon Mater. 2007, 22, 7–10. [Google Scholar]
  37. Barai, P. Stochastic analysis of diffusion induced damage in lithium-ion battery electrodes. J. Electrochem. Soc. 2013, 160, 955–967. [Google Scholar] [CrossRef]
  38. Korsunsky, A.M. Explicit formulae for the internal stress in spherical particles of active material within lithium ion battery cathodes during charging and discharging. Mater. Des. 2015, 69, 247–252. [Google Scholar] [CrossRef]
  39. Pimenta, V. Synthesis of Li-Rich NMC: A Comprehensive Study. Mater. Des. 2017, 23, 9923–9936. [Google Scholar] [CrossRef]
  40. Mendoza, H. Mechanical and Electrochemical Response of a LiCoO2 Cathode using Reconstructed Microstructures. Electrochim. Acta 2016, 190, 1–15. [Google Scholar] [CrossRef] [Green Version]
  41. Malavé, V. A computational model of the mechanical behavior within reconstructed LixCoO2 Li-ion battery cathode particles. Electrochim. Acta 2014, 130, 707–717. [Google Scholar] [CrossRef]
  42. Korsunsky, A.M. Generation of Realistic Particle Structures and Simulations of Internal Stress: A Numerical/AFM Study of LiMn2O4 Particles. J. Electrochem. Soc. 2011, 158, 434–442. [Google Scholar]
  43. Chung, M. Implementing Realistic Geometry and Measured Diffusion Coefficients into Single Particle Electrode Modeling Based on Experiments with Single LiMn2O4 Spinel Particles. J. Electrochem. Soc. 2011, 158, 371–378. [Google Scholar] [CrossRef]
  44. Ai, W. Electrochemical Thermal-Mechanical Modelling of Stress Inhomogeneity in Lithium-Ion Pouch Cells. J. Electrochem. Soc. 2011, 167, 013512. [Google Scholar] [CrossRef]
  45. Huang, S. Stress generation during lithiation of high-capacity electrode particles in lithium ion batteries. Acta Mater. 2013, 61, 4354–4364. [Google Scholar] [CrossRef]
  46. Renganathan, S. Theoretical Analysis of Stresses in a Lithium Ion Cell. J. Electrochem. Soc. 2010, 157, 155–163. [Google Scholar] [CrossRef]
  47. Xu, R. Computational analysis of chemomechanical behaviors of composite electrodes in Li-ion batteries. Mater. Res. 2016, 31, 2715–2727. [Google Scholar] [CrossRef] [Green Version]
  48. Goldin, G. Three-dimensional particle-resolved models of Li-ion batteries to assist the evaluation of empirical parameters in one-dimensional models. Mater. Res. 2012, 64, 118–129. [Google Scholar] [CrossRef]
  49. Wu, B. Mechanical-electrochemical modeling of agglomerate particles in lithium-ion battery electrodes. Mater. Res. 2016, 163, 3131–3139. [Google Scholar] [CrossRef]
  50. Zhang, T. Effect of reversible electrochemical reaction on Li diffusion and stresses in cylindrical Li-ion battery electrodes. J. Appl. Phys. 2014, 115, 083504. [Google Scholar] [CrossRef]
Figure 1. Battery scheme at micrometer scale and focus on the lithium intercalation mechanism in anode particles (a). Stress and deformation of the active material particles during lithium insertion (b) and extraction (c). Blue shadows depict the lithium concentration (blue means high concentration, white means low concentration). Concentration level affects tension (arrows pointing toward each other) and compression (arrows pointing away from each other) of radial and hoop stress. The concentric lines show expansion or shrinking of the particle: they are evenly spaced in the undeformed configuration.
Energies 13 01717 g001
Figure 2. Iterative calculation procedure.
Energies 13 01717 g002
Figure 3. Concentration level as a function of dimensionless radial position for different time constants τ in galvanostatic (a) and potentiostatic (b) insertion. The analytical model is reported with solid (coupled) and dashed (uncoupled) lines. The solution of the numerical model [26] is reported in discrete radial coordinates with dots (coupled) and crosses (uncoupled).
Energies 13 01717 g003
Figure 4. Lithium concentration (a), radial stress (b), hoop stress (c) and Von Mises stress (d) for different SOC levels in galvanostatic insertion in anode material. Dashed lines refer to the uncoupled model and solid lines refer to the coupled model.
Energies 13 01717 g004
Figure 5. Lithium concentration (a), radial stress (b), hoop stress (c) and Von Mises stress (d) for different SOC levels in galvanostatic insertion in cathode material. Dashed lines refer to the uncoupled model and solid lines refer to the coupled model
Energies 13 01717 g005
Figure 6. Lithium concentration (a), radial stress (b), hoop stress (c) and Von Mises stress (d) for different SOC levels in galvanostatic extraction in anode material. Dashed lines refer to the uncoupled model and solid lines refer to the coupled model.
Energies 13 01717 g006
Figure 7. Lithium concentration (a), radial stress (b), hoop stress (c) and Von Mises stress (d) for different SOC levels in galvanostatic extraction in cathode cathode. Dashed lines refer to the uncoupled model and solid lines refer to the coupled model.
Energies 13 01717 g007
Figure 8. Von Mises stress as a function of insertion (a) and extraction (b) time. The results are derived with physical parameters of Table 2.
Energies 13 01717 g008
Figure 9. Hydrostatic stress influence on lithium diffusion for insertion and extraction operation. The qualitative trend of the lithium concentration (red) and the hydrostatic stress (green) for insertion (a) and extraction (b) are reported in the graphics. The chemical potential is split in concentration contribution and hydrostatic stress contribution whose increments are valued for a general radial position r. The stress and concentration contributions for a general radial coordinate are graphically reported with green and red arrows which goes from the lower to the higher value (c). The lithium flux due to the chemical potential difference is reported with the blue arrows (c).
Energies 13 01717 g009
Figure 10. Hydrostatic stress (a) and concentration (b) in cathode material. Black arrows show the points where the hydrostatic stress changes sign which partially reflect the turnaround of the concentration function. Dashed lines refer to the uncoupled model and solid lines refer to the coupled model.
Energies 13 01717 g010
Table 1. Graphite properties (anode).
ParameterSymbolValueUnitReference
Diffusion coefficientD 2 · 10 14 m 2 /s[35,36]
Partial molar volume Ω 3.42 · 10 6 m 3 /mol[37]
Maximum concentration C m a x 3.18 · 10 4 mol/m 3 [37]
Young modulusE15GPa[18]
Poisson ratio υ 0.3-[18]
Particle radiusR 5 · 10 6 m[18]
Table 2. LixMn2O4 (LMO) properties (cathode).
ParameterSymbolValueUnitReference
Diffusion coefficientD 7.08 · 10 15 m 2 /s[21,26]
Partial molar volume Ω 3.497 · 10 6 m 3 /mol[21,26]
Maximum concentration C m a x 2.29 · 10 4 mol/m 3 [21,26]
Young modulusE10GPa[21,26]
Poisson ratio υ 0.3-[21,26]
Particle radiusR 5 · 10 6 m[21,26]

