Article

Hydrodynamic Performance of a Pitching Float Wave Energy Converter

1
School of Marine Engineering and Technology, Sun Yat-sen University, Guangzhou 510275, China
2
Southern Marine Science and Engineering Guangdong Laboratory, Zhuhai 519000, China
3
College of Shipbuilding Engineering, Harbin Engineering University, Harbin 150001, China
*
Author to whom correspondence should be addressed.
Energies 2020, 13(7), 1801; https://doi.org/10.3390/en13071801
Submission received: 6 March 2020 / Revised: 2 April 2020 / Accepted: 6 April 2020 / Published: 8 April 2020
(This article belongs to the Section A3: Wind, Wave and Tidal Energy)

Abstract

:
This study analyzes the hydrodynamic performance and application of a pitching float-type wave energy conversion device under complex sea conditions in the South China Sea. Potential flow theory and ANSYS-AQWA software are used to establish a method for analyzing hydrodynamic performance in both time and frequency domains, as well as the various factors that influence hydrodynamic performance. The frequency domain characteristics of the conversion device are explored, as well as the time-domain characteristics when exposed to regular and irregular waves. The results show that the frequency domain of hydrodynamic performance conforms to the requirements of an offshore mobile platform. A mooring point that is closer to the center of mass leads to improved stability of the conversion device. The angle arrangement of the anchor-chain mooring method fully conforms to safety requirements. When the wave direction is 45°, the conversion device is highly stressed and its movement is the most strenuous; however, the device can operate safely and stably under all working conditions. These results provide a significant reference for expanding the wave-energy capture range and the hydrodynamic performance of floating wave-energy conversion devices.

1. Introduction

As fossil energy reserves continue to shrink and environmental problems become more prominent, countries around the world increasingly favor clean energy sourced from the Earth’s cycles. For example, the world has generated electric power from wind turbines with uncertainty on airflow control, most recently, using a classic strategy of Fourier-statistical analysis of hourly data, which guarantees the continuous operation [1,2,3]. Furthermore, suitable neural network models were able to perform predictions [4,5,6]. Nevertheless, the measurements of climatic variables are fundamental to estimate the energy generated from airflow on wind turbines. Therefore, to avoid further uncertainty and losses of the energy generated, a perpetual and periodic energy solution is obtaining electricity from ocean energy [7,8,9]. Wave energy results from the pressure of waves on or below the ocean surface [10,11]. The theoretical power generation accessible by this means is approximately 8000 TWh/year, which can meet at least half of the electricity demand of the world [12]. Wave power generators are an important component of wave-energy generation systems; therefore, the development of efficient, stable, and safe wave power generators is key for the effective utilization of wave-energy [13]. The pitching float wave energy converter is a type of oscillating float wave energy converter, which converts the wave’s vertical motion into a rotary motion in the converter, and then drives a generator to generate electricity via power take-off (PTO) with a single float. Wave energy converters can be divided into several different types according to their structure, i.e., tapered channel, raft, pendulum, oscillating water column, and oscillating float [14].
Previous studies have investigated the hydrodynamic performance of various types of wave generators, and the device performance has been improved, but scholars have also found shortcomings in the various types of conversion devices. For example, tapered channel conversion devices require strict terrain conditions and high wave- energy density, which are difficult to achieve. Raft wave-energy conversion device devices use a large number of consumables, determining the most appropriate the mooring position is difficult and the devices are vulnerable to damage from impacts [15]. The waves [16,17] and instabilities [18,19] greatly affect pendulum wave energy converters, which is not conducive to the maintenance of the PTO conversion mechanism [20]. Oscillating water column wave energy converters [21] are greatly influenced by the terrain, high construction costs, and high risks [14]. Compared with these conversion devices, oscillating float-type wave energy converters have a small number of components [22], low cost, high conversion efficiency [23], and strong environmental adaptability. Although there are problems related to corrosion protection and sealing, these devices have significant development potential.
Oscillating float-type wave-energy conversion devices can be classified according to the number of floats into single-float, double-float, and multi-float types. Since 1978, when Budal and Falnes [24] first proposed the concept of an oscillating float wave-energy conversion device, the single-float wave power generator has been extensively investigated [25,26,27]. For example, Ohio State University developed the L-10, a rising wave power generation unit, and found that this single-float device was susceptible to tides, with less than satisfactory power generation efficiency [28]. Zhao [29] proposed a new control strategy for a point absorption wave-energy generator, which exhibited improved power generation efficiency under the same sea conditions. To reduce tidal impacts, scholars turned to double-float wave energy converters [30,31]. Amirid et al. [32] conducted a hydrodynamic analysis of deep-sea catamaran wave energy converters using numerical simulation methods, which showed significant improvements to wave energy conversion efficiency when exposed to certain conditions. To further improve the power generation efficiency, multi-float wave power generation arrays were studied next [33,34,35,36]. For example, Yang et al. [22] experimentally demonstrated the feasibility and effectiveness of an array point raft wave-energy conversion device that integrates multi-point absorption and energy conversion. These findings led to improvements in power generation efficiency; however, the structure remains complex and distribution over large areas affects the ecology. Conversely, the pitching float-type wave-energy conversion device is a float device moored by an anchor chain, which solves the problems associated with single-float wave power generators, i.e., the effects of tides. The pitching float device guarantees efficiency and exhibits characteristics that simplify its application over a wider range.
Insufficient attention has been paid to the pitching float wave converter, particularly in irregular waves. It is still difficult to predict the complex hydrodynamic performance of the pitching float wave generator. Thus, it is difficult to reasonably determine the structural design according to the wave parameters of the actual sea area, which has been the main obstruction to extending the application of the pitching float wave converter. In addition, the pitching float wave converter usually has a large scale, and thus the research method of experiments, programming, and CFD methods are costly and time-consuming. Therefore, based on potential flow theory, the ANSYS-AQWA software and its secondary development, a system dynamics model for the pitch-floating wave energy converter was constructed, which was economical and time-saving. Frequency domain analysis of various factors is also performed, such as the response amplitude operator (RAO), radiation damping, wave excitation force, and additional mass force. The hydrodynamic characteristics in the peak frequency region are analyzed according to different mooring point positions, wave angles, wave periods, starting and stopping frequencies, and other factors, for both regular and irregular waves. The results are important for improving the wave-energy capture range and hydrodynamic performance of float-type wave energy converters.

2. Theoretical Considerations

2.1. Converter Dynamics Model

To facilitate this study, it was assumed that the fluid is an ideal incompressible fluid, with no viscosity or spin. The damping system between the float and pendulum plate (abbreviated as a PTO system) has a linear output, i.e., the PTO system force is calculated as a linear function of the relative rotation angle and the relative rotational angular velocity of the float and pendulum. The mooring point is the center of mass, so that the elastic coefficient is 0 when only the pitch is considered. Figure 1 shows a dynamic model of a pitch-float wave energy converter [37], where K1 and K2 are both 0 and C2 = CPTO.
In Figure 1, the coupling motion of the pitching float, I1, and the wave converts the kinetic and potential energy of the wave into the mechanical energy of the float. The parameters involved in this process are the inertia, I1, damping, C1, float angle, θ1, relative rotational angle, θ2, between the oscillating plate and float, and damping CPTO. The built-in oscillating plate I2 and the pitching float I1 convert the mechanical energy of the oscillating plate into the mechanical energy of the float. The main parameters during the conversion process are the oscillating plate inertia I2, the relative rotational angle θ2 of the oscillating plate and the float, and damping CPTO.
Figure 2 shows the pitch-float wave energy converter. The energy conversion system can be divided into three stages. The first stage of the energy conversion system consists of the wave and the float. The second stage of the energy conversion system is composed of the pitching float and the pendulum in the float. The third stage of the energy conversion system consists of the pendulum plate, the gear transmission mechanism and the generator. The pendulum is a conversion component. The gear transmission system is used for the transmission of mechanical energy of the pendulum and the regulation of energy conversion. The transmission shaft is supported by the platform. The main transmission gear is connected with the pendulum. The lower gear is connected to the left generator when two generators are arranged. The upper gear is connected with the right generator when two generators are arranged. The generator base is fixed on the inner platform of the float. After analyzing the influence of the float shape, width, side radius, and centroid position on the hydrodynamic performance of the float, the specific parameters are chosen as follows: total length, L = 3.0 m, width, B = 0.9 m, depth, D = 1.6 m, draught, d = 1.0 m, and displacement = 2.0 tons. The bottom edge arc radius, R, wide side arc radius, R1, centroid coordinate, and float moment of inertia, I1, are 1.625 m, 2000 m, (0, 0, −0.059 m), and 2036.7 kg/m2, respectively.

2.2. Frequency Domain Analysis Method

The frequency-domain analysis method and time-domain analysis method are two commonly used methods for motion analysis of a floating body. Frequency domain analysis is based on linear theory, in which the force on the floating body is linearly related to the displacement. The key aspect of the frequency domain analysis method is solving the velocity potential. This analysis method can easily reveal the influence of system parameters on system performance and further indicate how to design and calibrate the system.
The ANSYS-AQWA software was used to calculate float hydrodynamics. The AQWA-LINE module was used to solve the hydrodynamic data for the RAO, wave excitation force, radiation damping, and additional mass of the float at six degrees of freedom (6DoF). Figure 3a shows the grid drawn using Ansys-APDL software, where the generated data file is docked with AQWA. Figure 3b shows the AQWA frequency domain hydrodynamic calculation model.
If only the motion in the pitch direction is considered, the frequency domain motion for the float-pitch can be expressed with the following equation:
( I 1 + μ 55 ) θ ¨ 1 ( t ) + λ 55 θ ˙ 1 ( t ) + C 55 θ 1 ( t ) = m 55
where I1 is the pitching inertia of the float, μ55 is the additional inertia caused by the pitching of the float, λ55 is the damping coefficient caused by the pitching of the float, C55 is the static water resilience coefficient, and m55 is the wave excitation moment generated by the pitching of the float. Subscripts “1”, “2” and “3” indicate the pitch-float, oscillating plate and oscillating body, respectively.
As the action torque generated by the oscillating body, m3, to mass m2 is equivalent to the float, m1, the force can be denoted as f13, which can be expressed with Equation (2):
f 13 = C 13 ( θ ˙ 1 ( t ) θ ˙ 3 ( t ) )
where C13 is the damping term generated by the oscillating body to the float. the mooring system’s torque to the float is denoted as M1, which can be expressed with the following equation:
M 1 = k θ 1 ( t )
where k is the stiffness factor of the mooring system. If Equations (2) and (3) combine into Equation (1), Equation (4) can be obtained:
( I 1 + μ 55 ) θ ¨ 1 ( t ) + λ 55 θ ˙ 1 ( t ) + C 13 ( θ ˙ 1 ( t ) θ ˙ 3 ( t ) ) + C 55 θ 1 ( t ) + k θ 1 ( t ) = m 55
The swing body moment balance equation is defined as follows:
I 3 θ ¨ 3 ( t ) = C 31 ( θ ˙ 3 ( t ) θ ˙ 1 ( t ) )
where C31 is the damping term produced by the pitch-float on the oscillating body.
Combining Equations (4) and (5), the following relevant equations can be obtained:
{ ( I 1 + μ 55 ) θ ¨ 1 ( t ) + λ 55 θ ˙ 1 ( t ) + C 13 ( θ ˙ 1 ( t ) θ ˙ 3 ( t ) ) + C 55 θ 1 ( t ) θ 1 ( t ) + k θ 1 ( t ) = m 55 I 3 θ ¨ 3 ( t ) = C 31 ( θ ˙ 3 ( t ) θ ˙ 1 ( t ) )
where θ ¨ 1 and θ ¨ 3 are the rotational angular acceleration of the float and oscillating body, respectively, and θ ˙ 1 and θ ˙ 3 are the rotational angular velocity of the float and oscillating body, respectively.
The amplitude response of a float in waves can be expressed with the following equation:
ω 2 [ M ] { ζ } i ω [ B ] { ζ } + [ K ] { ζ } = { f } M g n 3 + { f e }
where [M], [B], and [K] are the mass matrix, damping matrix, and stiffness matrix of the float, respectively, and {f} and {fe} are the force of the wave on the float and external system on the float, respectively. Unlike diffraction theory, the F-K hypothesis assumes that when an incident wave affects the float, there is no disturbance and no alteration of the wave field. Wave excitation due to the float can be expressed with the following equation:
F = C F K
where C is a diffraction-force coefficient and FK can be derived with the following equation:
F K = ρ V 0 ( d v d t ) a
where (dv/dt) is the average acceleration and V 0 is the drain volume.
In the potential flow computational software, the fluid viscosity is included in the calculation as an added damping form:
Added   Damping = C i j = x % * 2 [ ( M + Δ M ) * K ] 0.5
where x is the additional viscous damping percentage, M is the float mass array, ΔM is the additional float mass array, and K is the float static water stiffness array.

2.3. Time Domain Analysis Method

In practical engineering, a nonlinear relationship between the force and the movement displacement of the floating body often exists, so it is necessary to consider the time domain analysis method, establishing the relationship between the force and the movement at every moment. After calculating the movement of the floating body via the time domain analysis method, the stability, transient and steady-state performance of the system can be evaluated.
The pitching float wave energy converter has a built-in oscillator. Assuming that the waves travel in a certain direction, as well as that the float will move with 6DoF when exposed to wave action, the float will not only be affected by the wave force generated by the incident wave but also by the damping force generated by the relative motion of the built-in oscillator and float. Based on Coummins equation, the time domain motion equation for the pitch-float can be expressed as follows:
( M i j + λ i j ) x ¨ i j ( t ) + b i j x ˙ i j ( t ) + C i j ( x ˙ i j ( t ) x ˙ i j ( t ) ) + ( C i j + c i j ) x i j ( t ) + 0 t [ K i j ( t τ ) ] x ˙ i j ( τ ) d τ = F i j ( t )
where xij(t) is the displacement time function of pitch-float motion, x ˙ i j ( t ) is the velocity time function of pitch-float motion, x ˙ i j ( t ) is the velocity time function of swing float motion, x ¨ i j ( t ) is the acceleration time function of pith-float motion, Mij is the mass matrix, Cij is the hydrostatic recovery coefficient matrix, and the hydroids λij, bij, C’ij, and cij are the momentary response item associated with the additional mass, damping coefficient between the float and water, damping coefficient between the oscillator and float, and recovery factor. Furthermore, Kij(t) is a delay function associated with the shape and time interval of the pitch-float and Fij(t) is the wave force for the t-moment wave that acts on the pitch-float.
The pitch-float wave energy generator has a built-in oscillating body, assuming that the wave propagates in a certain direction. The float moves with 6DoF when exposed to wave action. Figure 4 shows a time domain analysis flowchart. The fluid viscosity was included in the calculation as an added damping form. The impact of PTO was mainly considered by the secondary development of AQWA in Fortran language. Then a dynamic link library file was generated. After putting this dynamic link file into the AQWA file path, it can be called by using the corresponding command during the calculation. The operational parameters including cable arrangement, wave direction, and wave period time were also considered in the time domain motion calculation.
The angle arrangement of the anchor chain arrangement form of an angle layout is shown in Figure 5, with three choices for the mooring point position. The mooring point in Figure 5a is in the middle line of the float, where the anchor chain line can be approximated through the float ingress. The mooring point in Figure 5b is at the intersection of the float’s midline and water line. The mooring point in Figure 5c is at the intersection of the float’s midline and top boundary line of the float.
In the time-domain analysis, there are two main types of wave parameters: wave direction and wave model. As the float has approximate x- and y-axis symmetry, the study only considers the impact of wave directions from 0–90° on the motion and safety performance of the float. Thus, wave directions of 0°, 45°, and 90° were selected.
There are two types of wave models, i.e., regular, and irregular, which are constructed as follows. The regular wave model uses a micro-amplitude linear Ari wave with a wave profile that can be expressed with the following equation [38]:
ζ = H 2 c o s ( ω t k X c o s θ k Y s i n θ + ε 0 )
where k and ω conform to the following dispersion equation:
ω 2 = g k t a n h ( k h )
where ζ is the wave profile fluctuation function, H is wave height, h is the depth of the water, ω is the incident wave frequency, ε0 is the initial phase, θ is the wave incident angle, and k is the number of waves.
The irregular wave model assumes that the regular cell waves are stacked with different superimposed wavelengths, wave heights, and phases, such that the wave profile can be expressed with the following equation:
ζ = j = 1 N H j 2 c o s ( ω j t k j X c o s θ k j Y s i n θ + ε 0 j + ε j )
Each parameter corresponds to the regular wave parameter, such that the incident wave height is related to the spectrum by the following equation:
H j = 2 S ( ω j ) Δ ω
where S(ω) is the spectrum. Based on the general conditions of the South China Sea, we selected the JONSWAP spectrum [39]:
S ( ω ) = 155 H 2 1 / 3 T 1 4 ω 5 e x p ( 944 T 1 4 ω 4 ) ( 3.3 ) γ   a n d
γ = e x p [ ( 0.191 ω T 1 1 2 1 / 2 σ ) ]
where H1/3 is the significant wave high and T1 is the average period. Based on the average wave operating conditions in the South China Sea, the study set H1/3 to 1.6 m, ω > 5.24/T1, and σ = 0.09.
The actual sea conditions are complex, and the influence of the wave direction, frequency spectrum, and anchoring methods on power generation device cannot be ignored. Therefore, the study combined the three mooring methods, three wave directions, and four regular wave cycles to calculate 36 combinations of float time-domain hydrodynamic performance, as well as to obtain a vertical and horizontal two-way comparison, whose specific combination forms are listed in Appendix A.

2.4. Numerical Model Verification

To verify the accuracy of the numerical model, the simulated data of the RAO-heave were compared with the results obtained by Liu [40] who compared the RAO-heaves of different bottom shape floats.
As shown in Figure 6, the variation of the RAO-heave with the angular frequency in this work agrees well with that of Liu [40]. As the angular frequency increases, the RAO-heave initially increases then subsequently decreases. The pitching RAO peak of the spherical bottom float is larger than that of conical bottom float. Therefore, the numerical model developed in this study is adequate to predict the hydrodynamic characteristics of the pitching float wave energy converter.

3. Hydrodynamic Device Characteristics

3.1. Analysis of the Hydrodynamic Performance in the Frequency Domain

Hydrodynamic performance is an important index that measures the quality of a wave energy converter. The frequency domain analysis, based on the design wave energy converter (Figure 2), uses dynamic linear theory, based on the AQWA software, to calculate the hydrodynamic coefficient of the float when only considering pitching motion.

3.1.1. Pitching Response RAO

Figure 7a–f show the 6DoF frequency RAO graph for the float. Larger pitching RAO values resulted in improved vertical rocking performance and more obtained energy, whereas for the other five degrees of freedom, RAO amplitude was smaller and the device was more stable. Therefore, the pitching RAO was used as the main object for research and analysis, whereas the RAO of the other degrees of freedom was used to verify the stability of the float. The much larger pitching RAO value indicated that the pitching performance of the device was excellent, the pitching motion mostly absorbed the energy, the peak frequency appeared at approximately 2.5 rad/s, and the maximum RAO value was 130°/m. The RAO for rolling, yawing, and swaying motions was all within 1. The pitching response amplitude peak frequency was approximately 2.5 rad/s, with a maximum of 4 rad/s. According to the rules published by China Classification Society [41], when the RAO magnitude was less than 5, with excellent stability. Therefore, the hydrodynamic performance of the device designed in this study fully conformed to the target requirements.

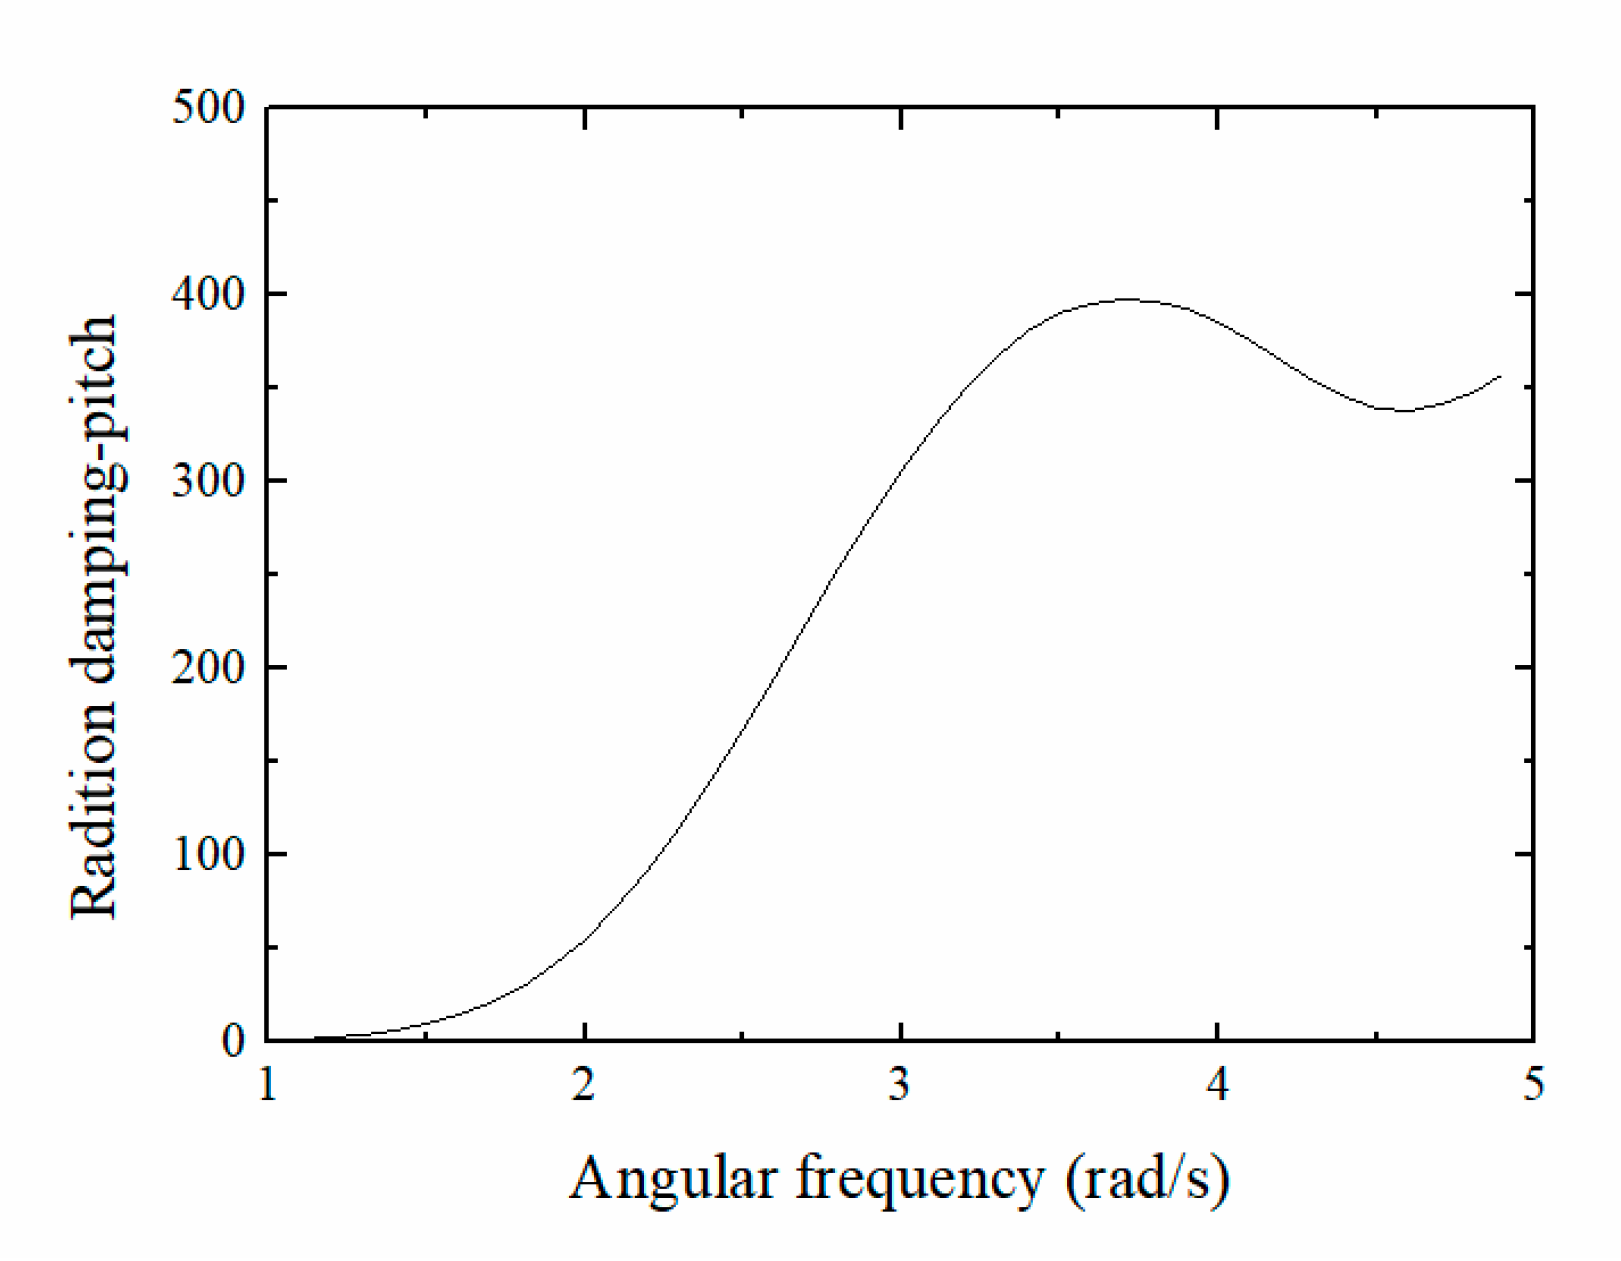
3.1.2. Radiation Damping

The radiation damping coefficient is an important index that measures the size of the damping force in waves affecting the float. As shown in Figure 8, when the wave frequency was zero, the radiation damping coefficient of the float pitch was also zero. The radiation damping coefficient of the float tended to first increase then decrease slightly as the frequency increased. When the wave frequency was 3.5 rad/s, the radiation damping reached its maximum, which was approximately 400 kg/s.

3.1.3. Wave Motivator

When the pitching float wave power generator was functioning, wave excitation affected the float. Here, wave excitation is the combined force of the Froude-Krylov and diffraction forces. Considering that the other five degrees of freedom have little effect on the pitching float device, major consideration was given to the effect of the pitching load on the float, shown in Figure 9. The wave force in the pitching direction increased then decreased with increasing frequency, reaching a maximum of approximately 6000 N at a frequency of 2.6 rad/s.

3.1.4. Additional Mass Force

Additional mass force is an inertial force produced by the float’s pitching motion. Figure 10 shows the additional mass force characteristic that varies with the frequency. The additional mass force of the float had the tendency to first increase, then decrease, and finally to stabilize with an increase in the frequency. The variation range was small, indicating that the additional mass force was more stable during the float’s pitching movement process.

3.2. Analysis of the Hydrodynamic Performance in the Time Domain

According to Figure 6, the response peak frequency area of the pitch-float is between 2 and 3 rad/s, such that the study analyzes the motion characteristics and force conditions of the float at the peak frequency area. With the regular wave action, the wave parameter setting for the calculation of float hydrodynamic performance is the period (Table 1), the peak wave frequency (2–3 rad/s) of the regular wave corresponds to a period of 2.5–2.7 s, and 6 s is the average wave cycle of South China Sea operating conditions, which is used to test the movement state and force condition of the float under normal operating conditions. During irregular wave conditions, the wave parameter settings to calculate float hydrodynamic performance are the wave model and wave frequency range, with the selected wave frequency range for this study listed in Table 1.

3.2.1. Effect of Mooring Point Position on Float Hydrodynamic Performance

Taking the hydrodynamic calculation results of float Nos. 1, 13, and 25 as examples, the study analyzed the effect of different mooring point positions on the float’s hydrodynamic performance with the same wave angle and wave cycle, and the calculation time step of 10,000 s. To show the data clearly, considering the periodicity and similarity of the curve, the following calculation result is taken from 5000 s to 6000 s.
Figure 11a–f show the 6DoF movement time-history curves for the mooring point at the center of mass (No. 1), the water line (No. 13), and the vertex (No. 25) for a wave cycle of 2.5 s and a wave angle of 0°. Due to limitations associated with the anchor chain and exciting force of the waves, the No. 1 float mooring point was in the core, the pitching movement was relatively large and stable, and the maximum pitching angle reached 5°. The pitching was the main energy capture movement, with small sway, surge, and heave amplitudes. The amplitudes of rolling and yawing movements were very small and within 0.1°. For the mooring point along the water line of float No. 13, the pulling force of the anchor chain produced a torque that affected the float, with a slight increase in the sway but a non-notable change in the pitching, heaving, and surging motion. There was a large increase in the rolling and yawing of the float. The mooring point on the vertex of float No. 25, which was unstable and prone to tipping, was selected. At 5000 s, the overturned float reached a steady state due to the force of the anchor chains; thus, the rolling movement was large but still recoverable. Due to the float tipping over, the pitching motion was smaller and the device ceased to store electricity.
In summary, the rolling and yawing movement of the float were greatly affected by an increase in the distance from the mooring point to the center of mass because the torque formed by the pulling force of the anchor chain rendered the float increasingly unstable. When the mooring point setting was at the vertex, the float began to tip. Based on the design requirements, larger pitching responses are preferable and rest movements should be as small as possible. Compared with float No. 13, the mooring point in the core of float No. 1 exhibited better stability and pitching performance; therefore, it is determined as the optimal mooring method.
Figure 12 shows the time-history curves of the tension on the two anchor chains when the mooring points are at the center of mass (No. 1) and waterline (No. 13) at a wave cycle of 2.5 s and wave angle of 0°. As shown in Figure 12a,b, the forces of the two anchor chains were essentially identical, due to the symmetry of both the float and anchor chain arrangement, as well as a positive direction of inflow to the floats, such that the force of the floats did not favor either side of the anchor chain. The maximum anchor chain tension was 4065 N, i.e., less than an order of magnitude (105) smaller than the allowed tension, yielding highly secure performance. The red curve in Figure 11 is the time-history curve of the tension on the two anchor chains for the No. 13 float, where the mooring point was the water line. Compared with the force of the anchor chains for the No. 1 float, there was a slight increase in the amplitude, due to the stability of the No. 13 float, which was inferior to the No. 1 float. This resulted in an increase in the moment of the rolling and yawing torque, as well as an increase in the tension of the anchor chain.
In summary, based on the movement and force of float Nos. 1, 13, and 25, under the conditions of regular waves and a 0° wave angle, the performance is more stable when the mooring point is in the center of mass of the float. Moreover, the float movement corresponded to the force conditions. Therefore, the angle arrangement of the anchor chain fully conforms to the float safety requirements.

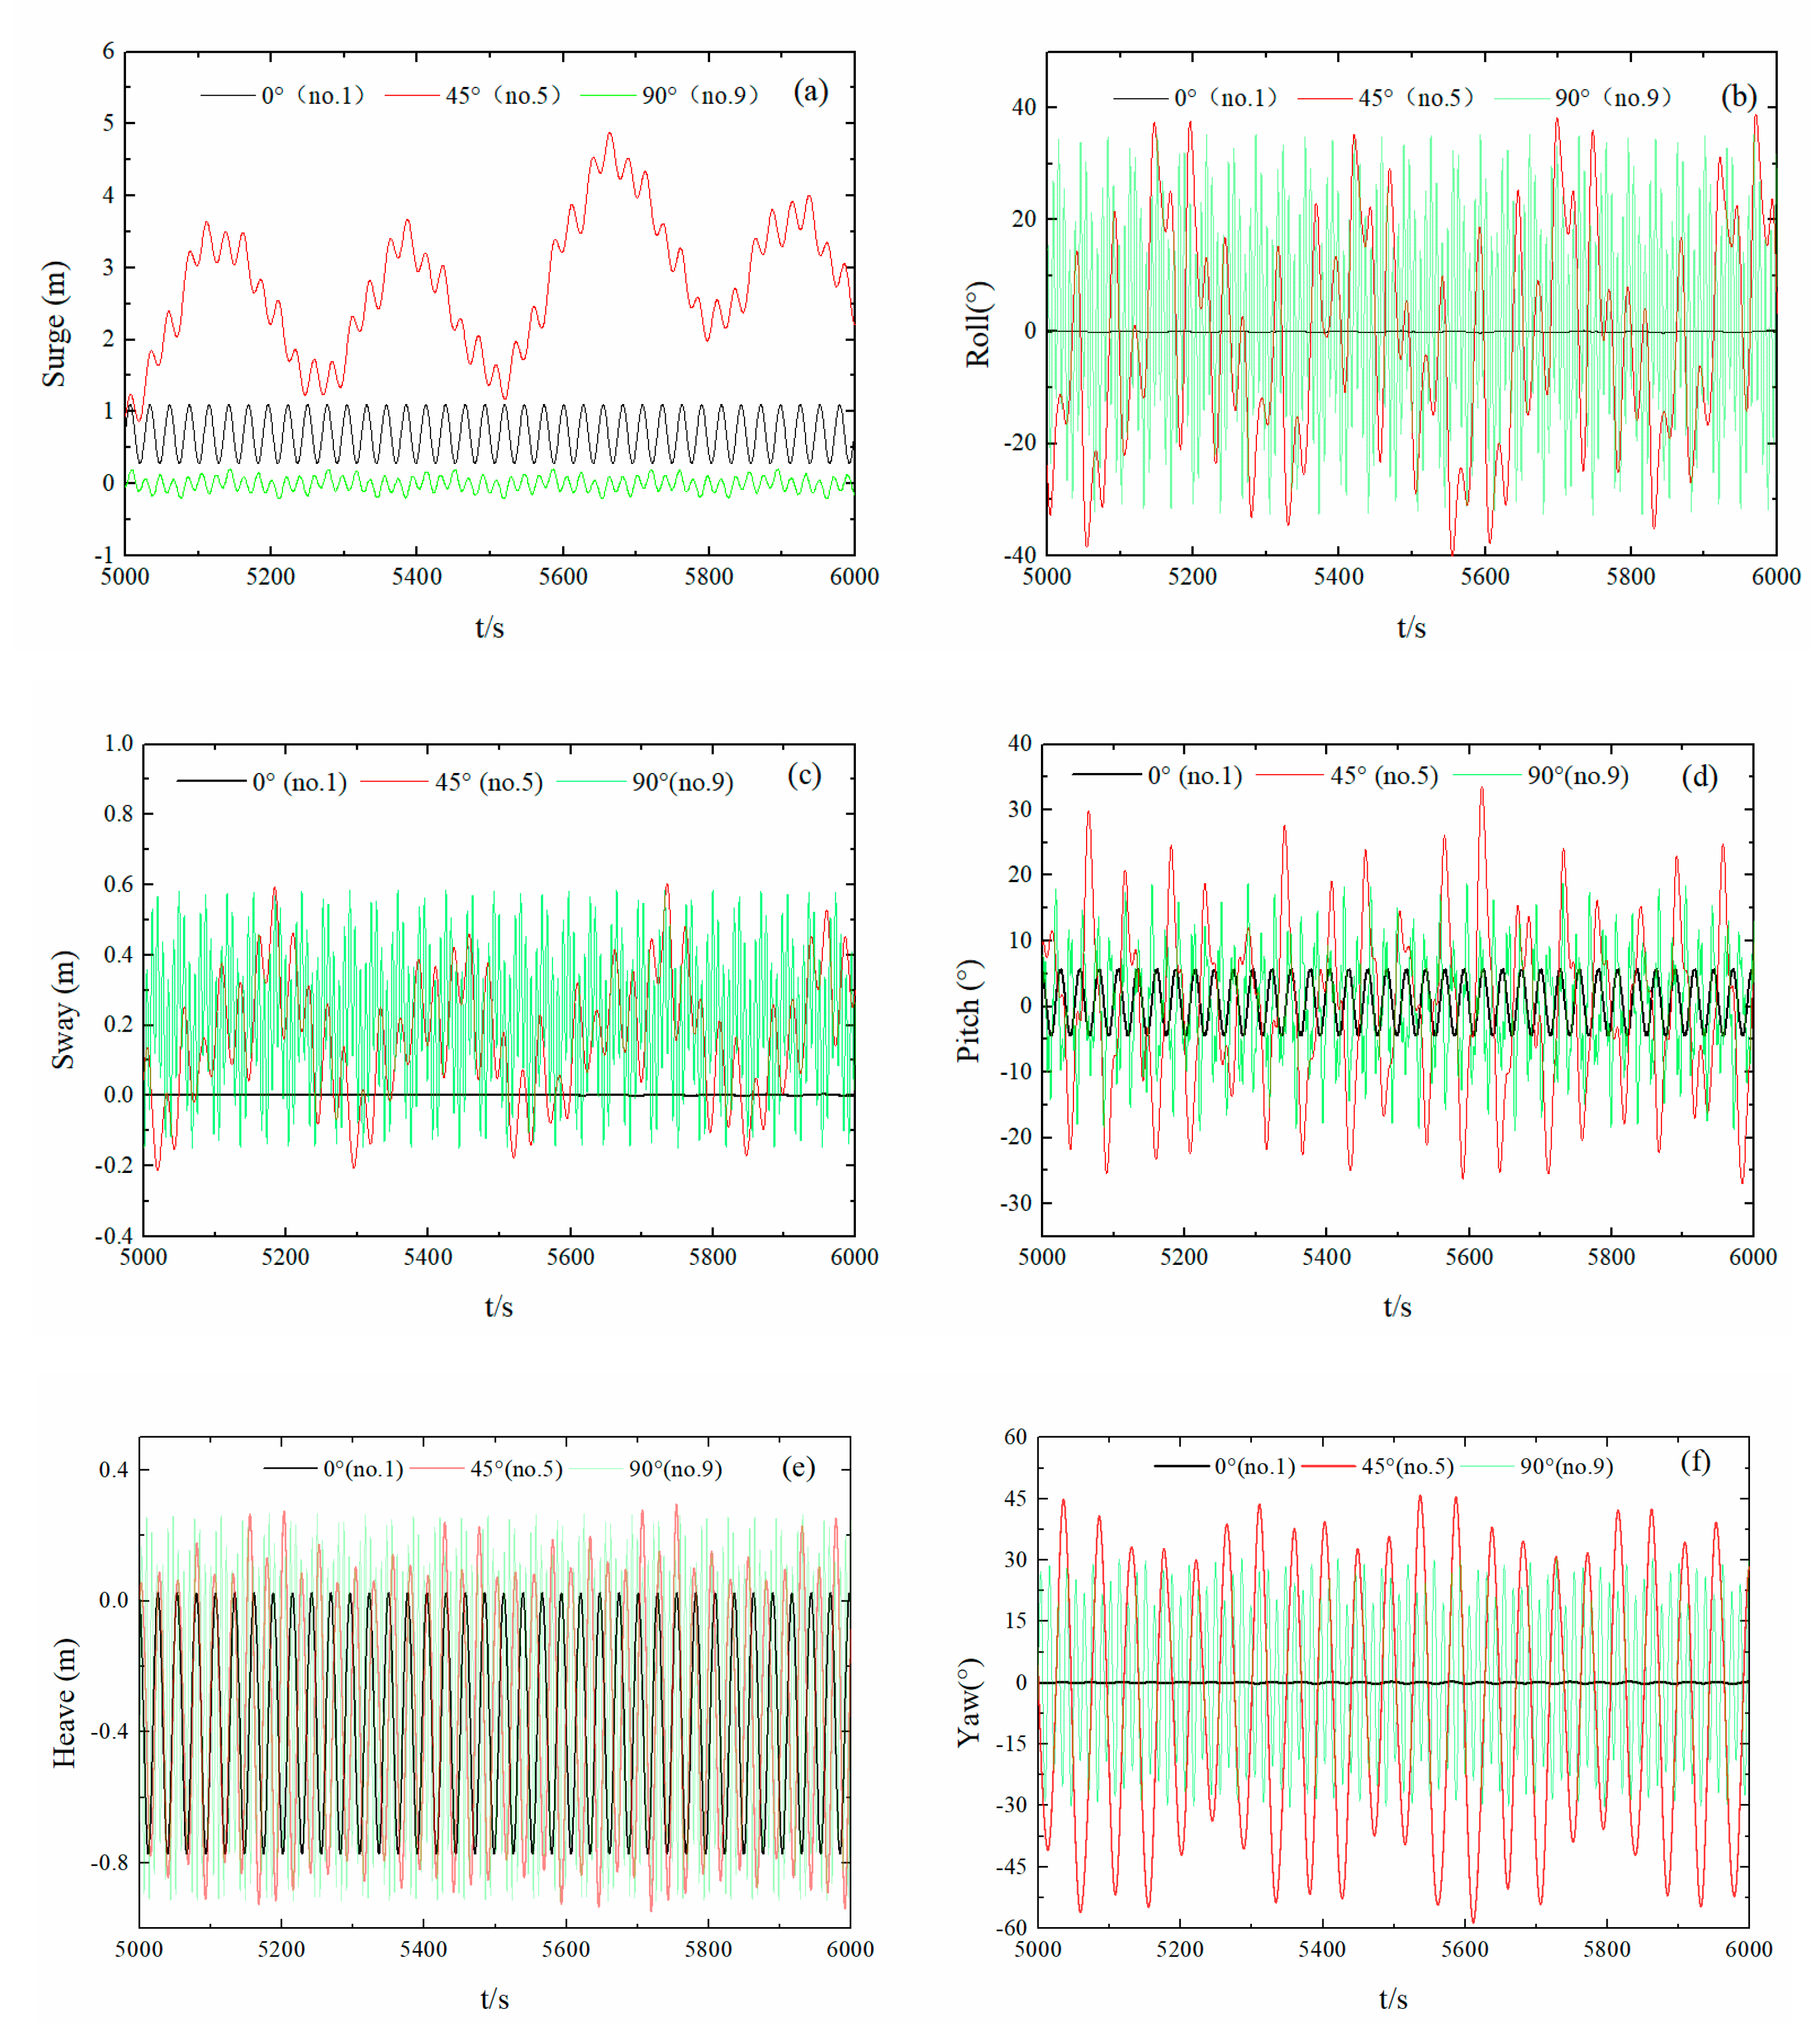
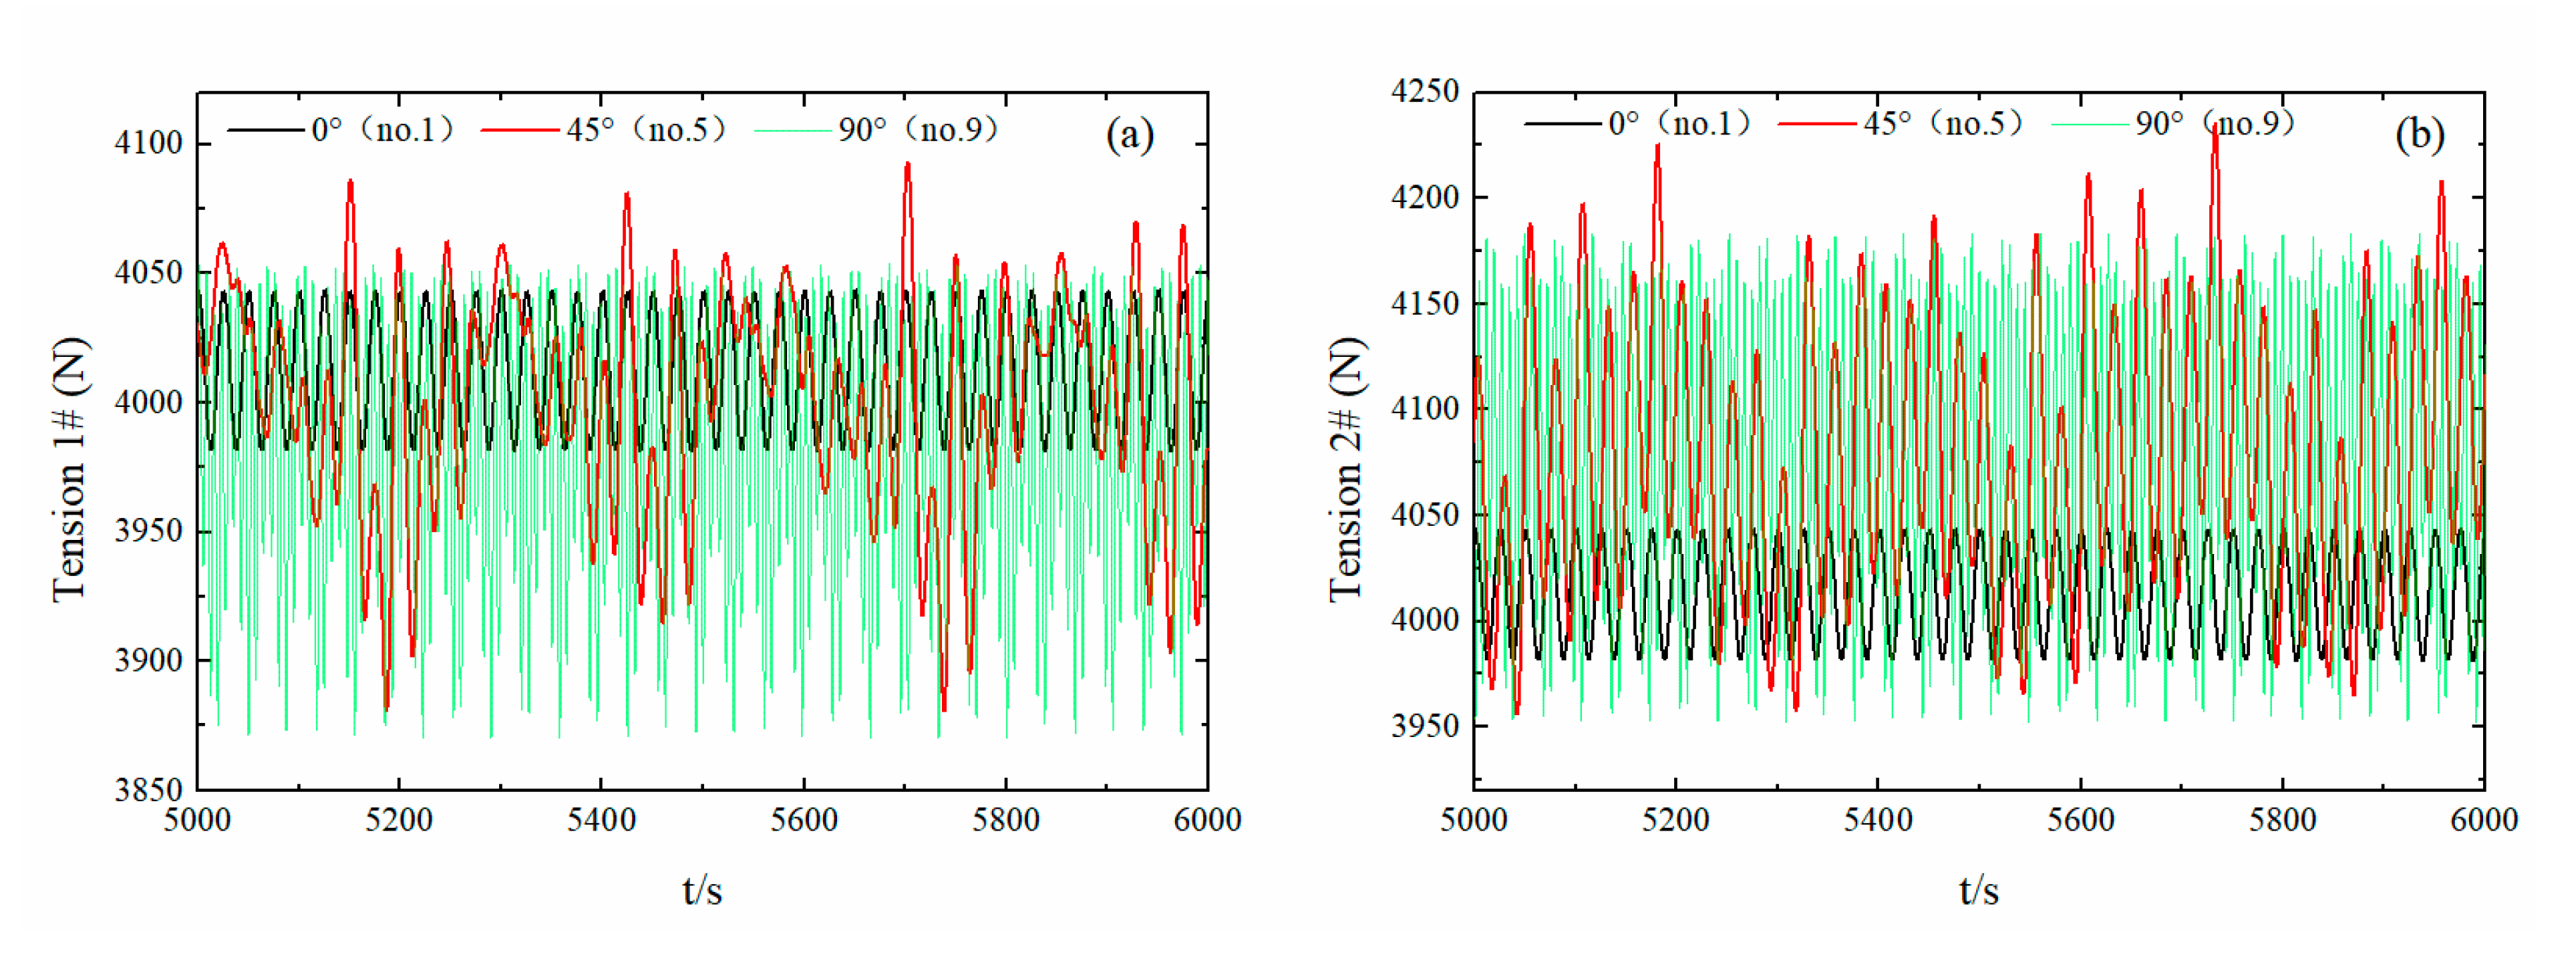
3.2.2. Effect of Wave Angle on Hydrodynamic Float Performance

Based on the hydrodynamic performance calculation results of different float mooring positions, the hydrodynamic performance of the float when exposed to different wave angles was analyzed. The conditions were identical to the wave cycle, i.e., the same mooring point position and regular wave, taking, e.g., the hydrodynamic calculation result of the float at wave angles of 0° (No. 1), 45° (No. 5), and 90° (No. 9).
Figure 13a–f show the 6DoF time-history curves of the float, where the mooring point was at the center of mass, the waves were regular, the wave cycle was 2.5 s, and the wave angles were 0° (No. 1), 45° (No. 5), and 90° (No. 9). Compared with the calculation results for the No. 1 float, an increase was observed in the relative energy capture width of float No. 5 due to a change in the wave direction, as well as a significant increase in the movement amplitude of the 6Dof. Due to the lateral wave force of the float, there was an increase in the pitching motion amplitude of the float, i.e., up to a maximum of 34°. The swaying, rolling, and yawing movement increased substantially, with a maximum swaying value of 0.6 m and maximum rolling and yawing amplitudes of approximately 40°. Additionally, due to restriction of the anchor chains, the swaying and surging movements remained stable. Compared with the calculation results for float No. 9, the 6DoF motion amplitude of float No. 5 was not notably different; however, the pitching amplitude of float No. 5 was much larger than that of float No. 9.
In summary, changes in the wave angle resulted in a large change in the 6DoF movement of the float, where the 45° wave movement amplitude of the float was the largest. Thus, anchor-chain restrictions under different wave angles were appropriate. The pitching amplitude of the float was small for a 0° wave direction, which was due to the minimum width for the relative energy capture interval of the float, which yielded a small amount of wave energy and a small motion amplitude in each direction. The capture interval for the 90° wave direction was the largest; however, its motion amplitude was not the highest because the float shape used in this study has not been optimized, which would greatly improve the safety performance of the float at a 90° wave direction.
Figure 14a–b show the time-history curves of the tension on the two anchor chains, with a wave circle of 2.5 s, wave angle directions at 0° (No. 1), 45° (No. 5), and 90° (No. 9), and the mooring point at the center of the mass. As the 45° wave direction was on the side of the float, the tension of the two anchor chains was not consistent, i.e., the tension of anchor chain II was generally greater than that of anchor chain I. The tension on the two anchor chains of float No. 5 was greater than that of float No. 1, confirming a greater wave force. Compared with the 0° and 45° wave direction, the 90° wave direction condition yielded a tension gap between the two anchor chains that became wider. The overall tension in anchor chain II was the largest of the three waves whereas the overall tension in anchor chain I was the smallest of the three waves, which is consistent with the ideal effect of the designed wave direction. In all wave directions, the maximum anchor-chain tension was less than 104, which was less than the allowed tension magnitude (105), indicating excellent safety performance.
In summary, this section revealed the motion and force conditions of float Nos. 1, 5, and 9 under regular wave conditions. When the wave direction was 45°, the designed float captured a maximum amount of energy. Under the three wave-direction conditions, the movement of the float corresponded to the force condition; thus, the anchor-chain angle arrangement fully conformed to the float safety requirements.

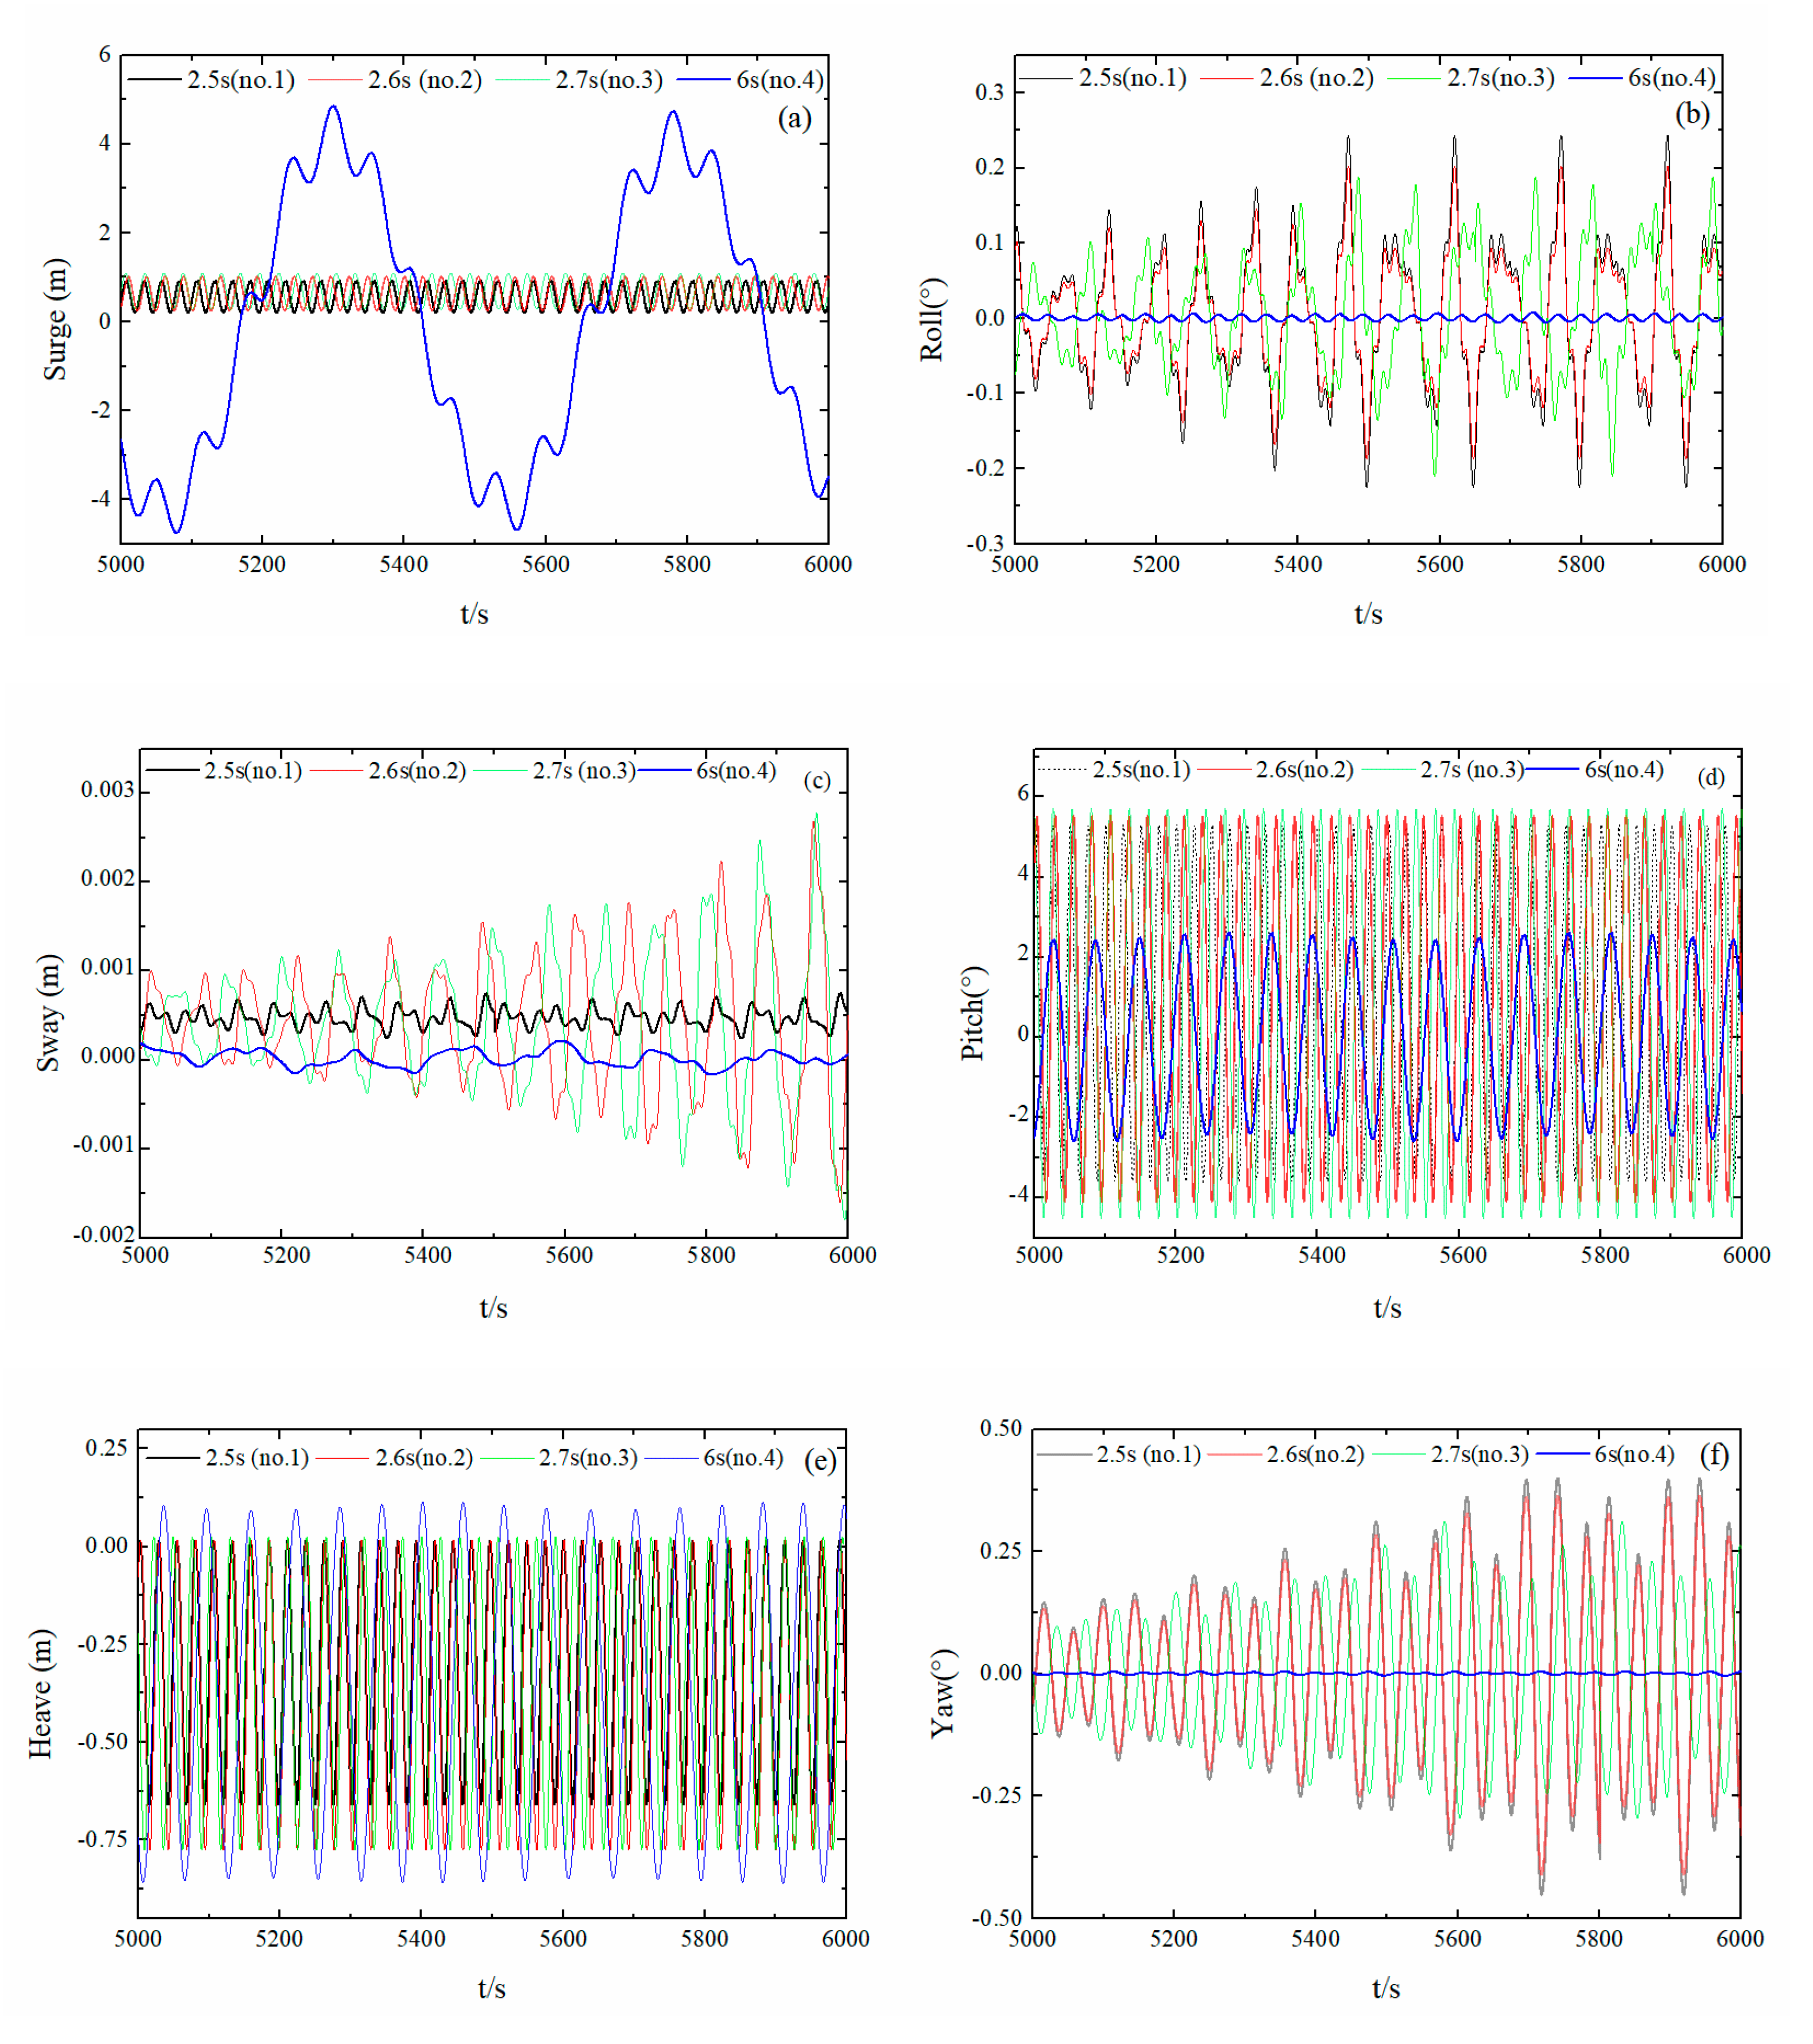
3.2.3. Effect of Wave Period on Hydrodynamic Float Performance

The hydrodynamic calculation results for float Nos. 1, 2, 3, and 4 were used to determine the influence of different wave periods on hydrodynamic float performance at the same mooring point and wave direction angle.
Figure 15a–f show the 6DoF time-history curves for the float, with the mooring point at the center of mass, a wave direction angle of 0°, and a wave period of 2.5 (No. 1), 2.6 (No. 2), 2.7 (No. 3), and 6.0 s (No. 4). Compared with the calculation results for float No. 1, increases in the wave period resulted in increases in the amplitude of the 6DoF movement for float No. 2; however, the float remained in an equilibrium state and exhibited high stability. Float No. 3 exhibited a slight increase in the amplitude of the 6DoF movement compared to floats Nos. 1 and 2 but also remained in an equilibrium state and exhibited high stability. However, compared with floats 1, 2, and 3, which approached the peak period at a wave period of 6 s, float No. 4 exhibited a small amplitude of sway, roll, and yaw movements. As the wave period became longer, the amplitude-change period of the 6DoF movement of the float became correspondingly longer. Regarding the pitching motion, there was a relative increase in the amplitude, as well as a significant increase in the period of the amplitude fluctuation. This was due to relatively stable float movement, a relatively small float wave force, and a reduced limit for the anchor chain. When the wave period was 6 s, the force on the float was relatively large compared with the other three peak periods. under wave action, the float first moved to a certain position, then reached a steady state under anchor-chain restriction, before finally producing a longitudinal reciprocating motion, indicating that the float had a large pitching amplitude.
Due to similarity among the hydrodynamic calculation results with similar wave periods, only the anchor-chain stress for the two types of floats with wave periods of 2.7 s and 6.0 s was compared. Figure 16a–b show the time-history curves of the tension on the anchor chains when the mooring points were at the center of mass of floats No. 3 and No. 4 for wave periods of 2.7 s and 6.0 s with a wave direction angle of 0°. The maximum anchor-chain tension for the float was within 105 N, which was not a large difference. This indicates that both floats are under less than the allowable tension (105) by an order of magnitude, exhibiting excellent safety performance. In summary, wave periods that are closer to the peak period of the frequency domain response result in a greater force acting on the float and more intense motion. Under the four wave periods, the pitching generator can operate both safely and stably with high reliability.

3.3. Irregular Waves

The study combined three mooring methods, three wave directions, and different frequency regions of irregular waves to calculate 45 time-domain hydrodynamic performance combinations for the float, then performed a longitudinal and horizontal two-way comparison. Due to the similarity of the results, Table 2 lists only selected comparison combinations.

3.3.1. Effect of Mooring Point Position on Hydrodynamic Float Performance

The hydrodynamic calculation results of floats No. 1, No. 16, and No. 31 were used to analyze the effects of equal wave direction angle, equal wave period, and different mooring point positions on the hydrodynamic float performance under irregular wave conditions.
Figure 17a–f show the 6DoF time-history motion curves of the mooring point at the center of mass (No. 1), the water line (No. 16), and the vertex (No. 31) under irregular wave conditions (i.e., 1.5–2.5 rad/s) and a wave direction angle of 0°. In contrast to regular wave conditions, with a 0° wave direction angle and the mooring point at the center, the pitching motion amplitude value for float No. 1 was stable at approximately 2°, with a maximum amplitude at 5.8°. The average surging motion of the float was approximately 13 m, with a maximum of 15.5 m, i.e., within the 20-m limit of the Sea Mobile Platform Entry Specification. The heaving motion amplitude of the float was relatively large before stabilization, after which the average drooping displacement of the float was approximately –0.41 m. The swaying, pitching, rolling, and yawing motion of the floats were relatively smooth; the rolling amplitude was within 1.5° and the yawing amplitude was within 2.5°. Due to the change in the mooring point between the anchor chain and float, float No. 16 achieved a stable state when the pitching angle reached −0.6°, which yielded a relatively small pitching amplitude compared to float No. 1. The average pitching amplitude decreased to approximately 8 m with an increase in the rolling and yawing motion to a maximum yawing amplitude of 6 m. There was little change in the swaying and heaving motion of the float. Overall, the stability of float No. 16 was slightly worse than that of float No. 1; therefore, the pitching energy acquisition was also poor. Based on the time-domain calculation results for irregular waves, the mooring point was set to the vertex position (float No. 31), which yielded an unstable and tipping float so was no longer considered.
In summary, similar to the results under regular wave conditions, the impact of rolling and yawing became greater as the mooring point center of mass became increasingly distant. Due to the torque formed by the pull of the anchor chain, the pitching motion of the float became increasingly unstable, resulting in tipping of the float when the vertex was used as the mooring point. However, in contrast to the results for regular wave conditions, the vertical displacement of floats was larger under irregular wave conditions, i.e., up to 15 m. Thus, based on the design requirements, in addition to the larger pitch, improved response, and smaller rolling and yawing, the device stability was improved. Moreover, the stability and pitching performance were better for float No. 1 than for float No. 16, indicating that float No. 1 is the optimal mooring method.
Figure 18a,b show the two anchor-chain tension time-history curves for floats No. 1 and No. 16 under irregular wave conditions (wave frequency from 1.5–2.5 rad/s and a wave angle of 0°). The two anchor chains held approximately the same force, where the maximum anchor-chain tension was less than 104, i.e., less than the allowed tension by one magnitude (105); therefore, the safety performance of the mooring was high. In summary, considering the movement and force of floats No. 1, No. 16, and No. 31, the irregular waves, and the 0° wave direction conditions, the center of the float was selected as the mooring point. This improved the performance stability to superior than that of mooring points at other positions on the float. The movement of the float corresponded to the force condition and the angle arrangement of the anchor chain fully conformed to the safety requirements of the float.

3.3.2. Effect of Wave Angle on Hydrodynamic Float Performance

Based on the influence that the mooring position has on hydrodynamic float performance, we used the hydrodynamic calculation results for float Nos. 1, 6, and 11 as examples to analyze the effect that the different wave direction angles have on hydrodynamic float performance for of irregular waves with the same mooring position and start and end frequency.
Figure 19a–f show the 6DoF time-history curves of the floats with a wave frequency area of 1.5–2.5 rad/s and irregular wave direction angles of 0° (No. 1), 45° (No. 6), and 90° (No. 11), with the mooring at the center of mass. Compared with the calculation results of float No. 1, float No. 6 exhibited a significant increase in pitching with a change in the wave direction from 0° to 45°, with a maximum pitching angle of 12°. There was also a relative increase in the horizontal and oblique capture energy. Despite the smoothness of the surging and heaving movements, there was a significant increase in swaying, rolling, and yawing movements. Among these movements, the maximum swaying value reached 7.8 m, the maximum swaying angle reached 16°, and the maximum yawing angle reached 14°. The influence of lateral wave force (45°) enhanced the energy capture ability of the float so that the restriction of the anchor chain maintained stable all-directional motion of the float, indicating excellent hydrodynamic performance. For a wave direction angle of 90°, the 6DoF motion of float No. 11 was less than that of floats No. 1 and No. 6, the pitching amplitude was small, and the energy capture efficiency was low; therefore, these generator operational conditions should be avoided.
In summary, under irregular wave conditions and a change in the wave angle, the 6DoF movement changed substantially. The 45° wave direction angle yielded the largest float movement amplitude. The hydrodynamic float performance at different wave angles and the anchor chain limiting effect were both good. The capture width of the 90° wave direction angle was the largest but its motion amplitude was small; this was due to the influence of the optimized float shape and action of the anchor chain, which greatly improved the safety performance of the float under a 90° wave direction angle.
Figure 20a,b show the time-history curves of the tension between the two anchor chains with irregular wave angles of 0° (No. 1), 45° (No. 6), and 90° (No. 11), a wave frequency of 1.5–2.5 rad/s, and the mooring point at the center of mass. Due to the side-effect force of the 45° wave on the float, the tension of the two anchor chains was not consistent. The tension on anchor chain II was also typically greater than that on anchor chain I. The tension of the two anchor chains was greater for float No. 6 than for float No. 1, confirming a greater wave force. Compared with the 0° and 45° wave direction, the 90° direction was consistent with the ideal effect of the designed wave direction; thus, the two anchor chains suffered the least tension and were essentially consistent, and the result corresponds to the overall force-history graph. The maximum anchor-chain tension was less than 104, i.e., less than the allowed tension of 105, revealing good safety performance.
In summary, the movement and force of all analyzed floats were observed under irregular wave conditions for a wave direction of 45° and maximum float energy capture. The angle arrangement anchor chain fully conforms to the float safety requirements.

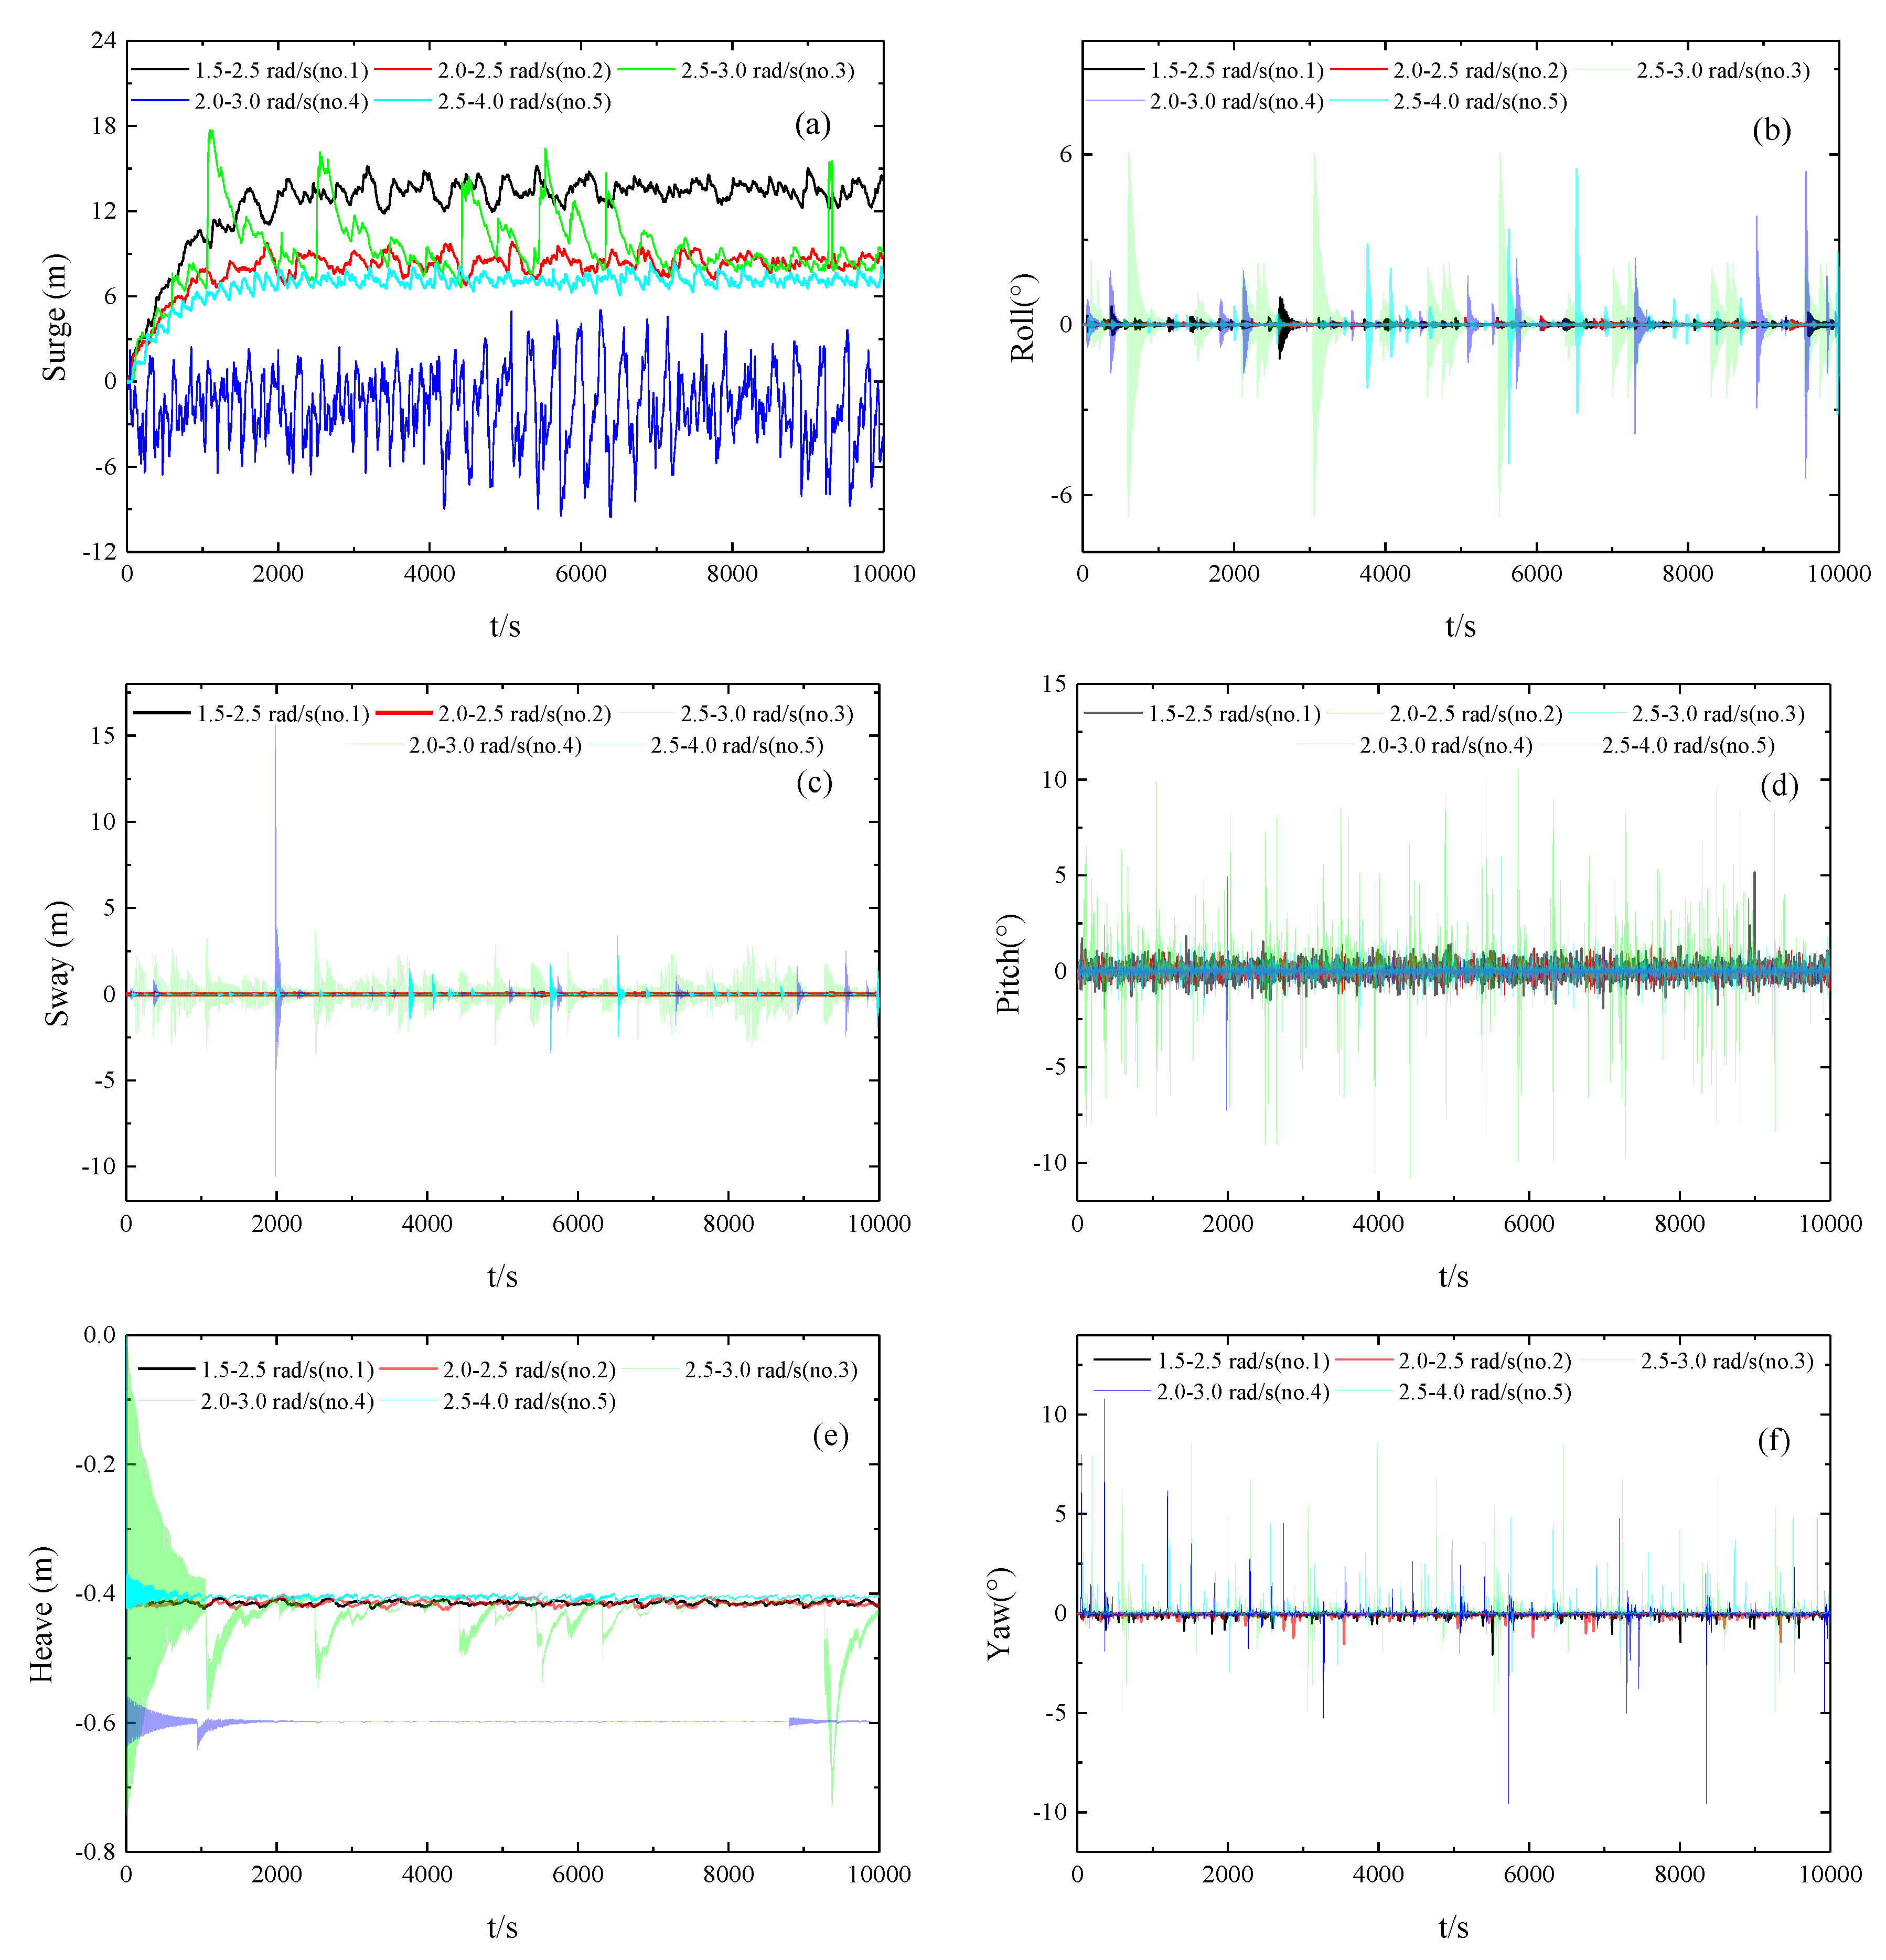
3.3.3. Effect of Start and End Frequency on Hydrodynamic Float Performance

The hydrodynamic calculation results of floats No. 1, No. 2, No. 3, No. 4, and No. 5 are used to analyze the effect of different starting and ending frequencies on hydrodynamic float performance for irregular waves with identical mooring points and wave direction angles. Figure 21a–f show the 6DoF motion curves for the float with start-end frequencies of 1.5–2.5 rad/s (No. 1), 2.0–2.5 rad/s (No. 2), 2.5–3.0 rad/s (No. 3), 2.0–3.0 rad/s (No. 4), and 2.5–4.0 rad/s (No. 5) for a mooring point at the center of mass and a wave direction angle of 0°. Compared with float No. 1, float No. 2 exhibited a reduction in the 6DoF motion amplitude with a slight reduction in the irregular wave frequency area; however, the float was essentially consistent with high stability. Compared with floats No. 1 and No. 2, a right shift of the irregular wave frequency area led to a significant increase in the 6DoF motion amplitude of float No. 3. Moreover, the maximum pitch angle reached 10° and the float exhibited volatile but stable 6DoF movement. The frequency area of float No. 4 was a combination of the frequency regions for floats No. 2 and No. 3. The 6DoF values for float No. 4 lay approximately between the values of floats No. 2 and No. 3, the surge movement trend differed from that of floats No. 1–3, which were more stable, and movement in the other direction was essentially identical. After stabilization, the maximum pitch angle reached 5°. Due to the unique results of float No. 4, its total force and anchor-chain force were analyzed. Similar to the float movement trends for floats No. 1–3, the motion amplitude of float No. 5 decreased with expansion of the irregular wave frequency area. The floating 6DoF movement was more volatile yet remained in a stable state, with a maximum pitch angle of 6°.
In summary, the irregular wave frequency area for the majority of starting and ending frequency combinations yielded approximately identical movement trends, with relatively large volatility. Among them, the 6DoF motion was the largest in the most concentrated energy area at 2.5–3.0 rad/s on float No. 3, which was also closer to the peak frequency. The more concentrated frequency area resulted in more intense float movement. The wave frequency area was 2.0–3.0 rad/s for float No. 4 and the movement was gentler, especially in the direction of surge movements. Similarly, based on the calculation results of the different irregular wave frequency regions, the anchor-chain binding was analyzed for float No. 3 (with the greatest motion response) and float No. 4 because large differences were observed for the other four floats. Figure 22a,b show the time-history graph of the tension on the two anchor chains for the mooring points at the center of mass, with different irregular wave frequency areas. The two anchor chains of float No. 3 exhibited essentially the same force, with a maximum anchor-chain tension of approximately 12,500 N, and was stable at approximately 9500 N. In general, the anchor chain tension of float No. 3 and No. 4 was less than an order of magnitude below the allowable tension (105), demonstrating excellent safety performance.
In summary, the energy was the most concentrated when the irregular wave frequency area was 2.5–3 rad/s, resulting in the most powerful float and most intense movements. Under the five irregular wave frequency regions, the pitching generator was shown to operate safely, steadily, and with high reliability.

4. Conclusions

A pitching float-type wave power generator has advantages of simple construction, high conversion efficiency, and a wide frequency response range. In this study, the AQWA software was used to analyze the frequency- and time-domain hydrodynamic performance of this wave power generator. The dynamic performance of the device frequency area was verified and the time-domain hydrodynamic performance of the device was analyzed under conditions of regular and irregular waves, different mooring modes, different wave direction angles, and different frequency area ranges. The conclusions of this study are as follows:
(1)
The frequency hydrodynamic performance of the designed float conforms to the specifications of a marine mobile platform, with excellent pitching response performance. It was verified that the float radiation damping coefficient, additional mass force, and wave excitation yielded optimum pitching performance.
(2)
Under regular wave conditions, mooring point positions that were closer to the center of mass resulted in better device stability. The angle arrangement of the anchor-chain mooring method fully conformed to the safety requirements. The 45° wave direction angle subjected the unit to the greatest overall force with the most intense movement. Wave cycles that were closest to the peak period resulted in a larger overall force on the device and more intense movement, with a maximum force of 4061.34 N for a wave period of 2.7 s. The device can therefore operate safely, steadily, and with high reliability under all tested operating conditions.
(3)
Under irregular wave conditions, mooring point positions that were closer to the center of mass also resulted in better device stability. The angle arrangement of the anchor-chain mooring method fully conformed to the safety requirements. A 45° wave direction angle resulted in the greatest overall force on the unit and the most intense movement. The irregular wave frequency area at 2.5–3.0 rad/s yielded the most concentrated energy, the most force ingested by the float, and the most intense movement. The device was deemed to operate safely, steadily, and with high reliability under all operating conditions.
(4)
The superior performance of the pitching float-type wave power generator was verified based on the frequency and time-domain analysis. These results are significant for the use of wave-energy generators in the South China Sea and expansion of the wave-energy capture range.

Author Contributions

Conceptualization, L.Y.; Methodology, L.Y. and S.A.; Software, L.Y. and B.Z.; Validation, L.Y.; Investigation, L.Y. and A.Z.; Resources, L.Y.; Writing-Original Draft Preparation, L.Y. and S.A.; Writing-Review & Editing, A.Z. and S.A.; Visualization, S.L.; Supervision, S.L.; Project Administration, L.Y. and Y.M.; Funding Acquisition, L.Y. and Y.M. All authors have read and agreed to the published version of the manuscript.

Funding

This research was financially supported by the Southern Marine Science and Engineering Guang Dong Laboratory (Zhuhai); Fundamental Research Funds for the Central Universities (Grant No. 19lgzd14); General Project of Guangdong Province Department of Natural Resources to Promote High-quality Economic Development (Grant No. GDOE[2019]A43); National Natural Science Foundation of China (Grant No. 51779062).

Conflicts of Interest

The authors declare no conflict of interest.

Appendix A

Table A1. Regular wave conditions.
Float NumberLocation of Mooring PointWave Direction (deg)Wave Period (s)
1centroid2.5
2centroid2.6
3centroid2.7
4centroid6
5centroid45°2.5
6centroid45°2.6
7centroid45°2.7
8centroid45°6
9centroid90°2.5
10centroid90°2.6
11centroid90°2.7
12centroid90°6
13waterline2.5
14waterline2.6
15waterline2.7
16waterline6
17waterline45°2.5
18waterline45°2.6
19waterline45°2.7
20waterline45°6
21waterline90°2.5
22waterline90°2.6
23waterline90°2.7
24waterline90°6
25vertex2.5
26vertex2.6
27vertex2.7
28vertex6
29vertex45°2.5
30vertex45°2.6
31vertex45°2.7
32vertex45°6
33vertex90°2.5
34vertex90°2.6
35vertex90°2.7
36vertex90°6

References

  1. Krzyszczak, J.; Baranowski, P.; Zubik, M.; Hoffmann, H. Temporal scale influence on multifractal properties of agro-meteorological time series. Agric. For. Meteorol. 2017, 239, 223–235. [Google Scholar] [CrossRef]
  2. Castañeda-Miranda, A.; Icaza-Herrera, M.D.; Castaño, V.M. Meteorological Temperature and Humidity Prediction from Fourier-Statistical Analysis of Hourly Data. Adv. Meteorol. 2019, 2019, 1–13. [Google Scholar] [CrossRef]
  3. Yang, Z.C. Hourly ambient air humidity fluctuation evaluation and forecasting based on the least-squares Fourier-model. Measurement 2019, 133, 112–123. [Google Scholar] [CrossRef]
  4. Stoyanov, D.B.; Nixon, J.D. Alternative operational strategies for wind turbines in cold climates. Renew. Energy 2020, 145, 2694–2706. [Google Scholar] [CrossRef]
  5. Castañeda-Miranda, A.; Castaño, V.M. Smart frost control in greenhouses by neural networks models. Comput. Electron. Agric. 2017, 137, 102–114. [Google Scholar] [CrossRef]
  6. Li, C.; Zhou, D.; Wang, H.; Lu, Y.; Li, D. Techno-economic performance study of stand-alone wind/diesel/battery hybrid system with different battery technologies in the cold region of China. Energy 2020, 192, 116702. [Google Scholar] [CrossRef]
  7. Konispoliatis, D.N.; Mavrakos, S.A. Natural frequencies of vertical cylindrical oscillating water column devices. Appl. Ocean Res. 2019, 91, 101894. [Google Scholar] [CrossRef]
  8. Zheng, S.; Zhu, G.; Simmonds, D.; Greaves, D.; Iglesias, G. Wave power extraction from a tubular structure integrated oscillating water column. Renew. Energy 2020, 150, 342–355. [Google Scholar] [CrossRef]
  9. Singh, U.; Abdussamie, N.; Hore, J. Hydrodynamic performance of a floating offshore OWC wave energy converter: An experimental study. Renew. Sustain. Energy Rev. 2020, 117, 109501. [Google Scholar] [CrossRef]
  10. Zhang, H.; Xi, R.; Xu, D.; Wang, K.; Shi, Q.; Zhao, H.; Wu, B. Efficiency enhancement of a point wave energy converter with a magnetic bistable mechanism. Energy 2019, 181, 1151–1165. [Google Scholar] [CrossRef]
  11. Alamian, R.; Shafaghat, R.; Safaei, M.R. Multi-objective optimization of a pitch point absorber wave energy converter. Water 2019, 11, 969. [Google Scholar] [CrossRef] [Green Version]
  12. Yue, X.; Chen, Q.; Wang, Z.; Geng, D.; Yan, D.; Jiang, W.; Wang, W. A novel nonlinear state space model for the hydraulic power take-off of a wave energy converter. Energy 2019, 180, 465–479. [Google Scholar]
  13. Rosa-Santos, P.; Taveira-Pinto, F.; Rodríguez, C.A.; Ramos, V.; López, M. The CECO wave energy converter: Recent developments. Renew. Energ. 2019, 139, 368–384. [Google Scholar] [CrossRef]
  14. Aderinto, T.; Li, H. Ocean wave energy converters: Status and challenges. Energies 2018, 11, 1250. [Google Scholar] [CrossRef] [Green Version]
  15. Prakash, S.S.; Mamun, K.A.; Islam, F.R.; Mudliar, R.; Pau’u, C.; Kolivuso, M.; Cadralala, S. Wave Energy Converter: A Review of Wave Energy Conversion Technology. In Proceedings of the 2016 3rd Asia-Pacific World Congress on Computer Science & Engineering, Nadi, Fiji, 5–6 December 2016; pp. 71–77. [Google Scholar]
  16. Yurchenko, D.; Alevras, P. Parametric pendulum based wave energy converter. Mech. Syst. Signal. Pr. 2018, 99, 504–515. [Google Scholar] [CrossRef] [Green Version]
  17. Zheng, S.; Zhang, Y. Analytical study on hydrodynamic performance of a raft-type wave power device. J. Mar. Sci. Tech. 2017, 22, 620–632. [Google Scholar] [CrossRef]
  18. Nicola, P.; Giovanni, B.; Biagio, P.; Antonello, S.S.; Giacomo, V.; Giuliana, M.; Gianmaria, S. Wave tank testing of a pendulum wave energy converter 1:12 scale model. Int. J. Appl. Mech. 2017, 9, 1750024. [Google Scholar] [CrossRef] [Green Version]
  19. Liu, C.; Yang, Q.; Bao, G. Latching control using optimal control method for a raft-type wave energy converter. Ships. Offshore. Struc. 2018, 13 (Suppl. S1), 138–154. [Google Scholar] [CrossRef]
  20. Mustapa, M.A.; Yaakob, O.B.; Ahmed, Y.M.; Rheem, C.K.; Koh, K.K.; Adnan, F.A. Wave energy device and breakwater integration: A review. Renew. Sustain. Energ. Rev. 2017, 77, 43–58. [Google Scholar] [CrossRef]
  21. Malara, G.; Arena, F. Response of U-Oscillating Water Column arrays:Semi-analytical approach and numerical results. Renew. Energ. 2019, 138, 1152–1165. [Google Scholar] [CrossRef]
  22. Yang, S.; He, H.; Chen, H.; Wang, Y.; Li, H.; Zheng, S. Experimental study on the performance of a floating array-point-raft wave energy converter under random wave conditions. Renew. Energ. 2019, 139, 538–550. [Google Scholar] [CrossRef]
  23. Gao, H.; Li, B. Establishment of motion model for wave capture buoy and research on hydrodynamic performance of floating-type wave energy converter. Pol. Marit. Res. 2015, 22, 106–111. [Google Scholar] [CrossRef]
  24. Budal, K.; Falnes, J. Wave power conversion by point absorbers:A Norwegian project. Int. J. Ambie. Energ. 1982, 3, 59–67. [Google Scholar] [CrossRef]
  25. Sjökvist, L.; Göteman, M. Peak forces on a point absorbing wave energy converter impacted by tsunami waves. Renew. Energ. 2019, 133, 1024–1033. [Google Scholar] [CrossRef]
  26. Dang, T.D.; Phan, C.B.; Ahn, K.K. Design and investigation of a novel point absorber on performance optimization mechanism for wave energy converter in heave mode. Int. J. Pr. ENG. Man-GT 2019, 6, 477–488. [Google Scholar] [CrossRef]
  27. Xu, Q.; Li, Y.; Xia, Y.; Chen, W.; Gao, F. Performance assessments of the fully submerged sphere and cylinder point absorber wave energy converters. Mod. Phys. Lett. B 2019, 33, 1950168. [Google Scholar] [CrossRef]
  28. Prado, M. Archimedes Wave Swing (AWS). In Ocean Wave Energy; Cruz, J., Ed.; Springer: Berlin, Germany, 2008; pp. 297–304. [Google Scholar]
  29. Zhao, A.; Wu, W.; Sun, Z.; Zhu, L.; Lu, K.; Chung, H.; Blaabjerg, F. A Flower Pollination Method Based Global Maximum Power Point Tracking Strategy for Point-Absorbing Type Wave Energy Converters. Energies 2019, 12, 1343. [Google Scholar] [CrossRef] [Green Version]
  30. Abdelkhalik, O.; Zou, S. Control of small two-body heaving wave energy converters for ocean measurement applications. Renew. Energy 2018, 132, 587–595. [Google Scholar] [CrossRef]
  31. Liu, C.; Yu, H.; Liu, Q.; Zhong, W.; Zhu, H. Research on a double float system for direct drive wave power conversion. IET Renew. Power. Gen. 2017, 11, 1026–1032. [Google Scholar] [CrossRef]
  32. Amiri, A.; Panahi, R.; Radfar, S. Parametric Study of Two-Body Floating-Point Wave Absorber. J. Marine. Sci. Appli. 2016, 15, 41–49. [Google Scholar] [CrossRef]
  33. Antonio, F.D.O. Wave energy utilization: A review of the technologies. Renew. Sustain. Energ. Rev. 2010, 14, 899–918. [Google Scholar]
  34. Zhang, H.; Xu, D.; Zhao, H.; Xia, S.; Wu, Y. Energy extraction of wave energy converters embedded in a very large modularized floating platform. Energy 2018, 158, 317–329. [Google Scholar] [CrossRef]
  35. Huang, S.; Sheng, S.; Gerthoffert, A.; Cong, Y.; Zhang, T.; Wang, Z. Numerical design study of multipoint mooring systems for the floating wave energy converter in deep water with a sloping bottom. Renew. Energ. 2019, 136, 558–571. [Google Scholar] [CrossRef]
  36. Do, H.-T.; Dang, T.-D.; Ahn, K.K. A multi-point-absorber wave-energy converter for the stabilization of output power. Ocean Eng. 2018, 161, 337–349. [Google Scholar] [CrossRef]
  37. Author, D.E.N.; Ungar, E.E. Mechanical Vibration Analysis and Computation. Acoust. Soc. Am. 1992, 88, 2506. [Google Scholar]
  38. Airy, G.B. Tides and waves. Encyc. Metrop. 1845, 192, 241–396. [Google Scholar]
  39. Hasselmann, K.; Barnett, T.P.; Bouws, E.; Carlson, H.; Cartwright, D.E.; Enke, K.; Ewing, J.A.; Gienapp, H.; Hasselmann, D.E.; Kruseman, P.; et al. Measurements of Wind-Wave Growth and Swell Decay During the Joint North Sea Wave Project (JONSWAP); Deutches Hydrographisches Institut: Hamburg, Germany, 1973; pp. 8–12. [Google Scholar]
  40. Liu, Y. Design and Analysis of Built-in Wave Energy Converter. Master’s Thesis, Ocean University of China, Qingdao, China, 2014. [Google Scholar]
  41. China Classification Society, Rules for Classification of Mobile Offshore Units; China Communication Press: Beijing, China, 2012.
Figure 1. A dynamic model of the pitch-float wave energy converter.
Energies 13 01801 g001
Figure 2. The pitch-float wave energy converter.
Energies 13 01801 g002
Figure 3. The floating frequency domain calculation model. (Sub-figures: (a) APDL grid model; (b) AQWA hydrodynamic model).
Energies 13 01801 g003
Figure 4. The time domain analysis flowchart of the generator motion.
Energies 13 01801 g004
Figure 5. The anchor chain mooring location distribution. (Sub-figures: (a) mooring location on centroid; (b) mooring location on waterline; (c) mooring location on vertex).
Energies 13 01801 g005
Figure 6. Comparison between simulated RAO-heave with the results of Liu [40] for different float bottom shapes.
Energies 13 01801 g006
Figure 7. 6DoF frequency RAO curves for the float. (Sub-figures: (a) surge motion curve; (b) roll motion curve; (c) sway motion curve; (d) pitch motion curve; (e) heave motion curve; (f) yaw motion curve).
Energies 13 01801 g007aEnergies 13 01801 g007b
Figure 8. Radiation damping of the float in the pitching direction.
Energies 13 01801 g008
Figure 9. Wave excitation on the float in the pitching direction.
Energies 13 01801 g009
Figure 10. Additional mass force in the pitching direction.
Energies 13 01801 g010
Figure 11. 6DoF motion curves of floats with different mooring points. (Sub-figures: (a) surge motion curves; (b) roll motion curves; (c) sway motion curves; (d) pitch motion curves; (e) heave motion curves; (f) yaw motion curves).
Energies 13 01801 g011
Figure 12. Time-history tension curves for the float chain with different mooring points. (Sub-figures: (a) time-history curves of anchor chain I tension; (b) time-history curves of anchor chain II tension).
Energies 13 01801 g012
Figure 13. 6DoF time-history motion curves of the float with different wave angles. (Sub-figures: (a) surge motion curves; (b) roll motion curves; (c) sway motion curves; (d) pitch motion curves; (e) heave motion curves; (f) yaw motion curves).
Energies 13 01801 g013
Figure 14. Time-history curves of the floating anchor chain tension with different wave angle directions. (Sub-figures: (a) time-history curves of anchor chain I tension; (b) time-history curves of anchor chain II tension).
Energies 13 01801 g014
Figure 15. Time-history curves of the 6DoF motion of the float under different wave periods. (Sub-figures: (a) surge motion curves; (b) roll motion curves; (c) sway motion curves; (d) pitch motion curves; (e) heave motion curves; (f) yaw motion curves).
Energies 13 01801 g015
Figure 16. Time-history tension curves for the float chain with different wave periods. (Sub-figures: (a) time-history curves of anchor chain I tension; (b) time-history curves of anchor chain II tension).
Energies 13 01801 g016
Figure 17. 6DoF time-history motion curves of floats at different mooring points. (Sub-figures: (a) surge motion curves; (b) roll motion curves; (c) sway motion curves; (d) pitch motion curves; (e) heave motion curves; (f) yaw motion curves).
Energies 13 01801 g017
Figure 18. Anchor-chain tension time-history curves. (Sub-figures: (a) time-history curves of anchor chain I tension; (b) time-history curves of anchor chain II tension).
Energies 13 01801 g018
Figure 19. 6DoF time-history motion curves different wave angles on the float. (Sub-figures: (a) surge motion curves; (b) roll motion curves; (c) sway motion curves; (d) pitch motion curves; (e) heave motion curves; (f) yaw motion curves).
Energies 13 01801 g019
Figure 20. Floating anchor chain tension time-history curves with different wave direction angles. (Sub-figures: (a) time-history curves of anchor chain I tension; (b) time-history curves of anchor chain II tension).
Energies 13 01801 g020
Figure 21. 6DoF time-history motion curves under different start-end frequencies. (Sub-figures: (a) surge motion curves; (b) roll motion curves; (c) sway motion curves; (d) pitch motion curves; (e) heave motion curves; (f) yaw motion curves).
Energies 13 01801 g021
Figure 22. Anchor-chain tension time-history curves. (Sub-figures: (a) time-history curves of anchor chain I tension; (b) time-history curves of anchor chain II tension).
Energies 13 01801 g022
Table 1. Peak frequency zones.
Float NumberRegular Wave Period (s)Irregular Wave Period (rad/s)
1-1.5–2.5
22.52.0–2.5
32.62.5–3.0
42.72.0–3.0
56.02.5–4.0
Table 2. Irregular wave combination conditions.
Contrasting TermsFloat NumberMooring Point LocationWave Direction (º)Frequency Region of Irregular Wave (rad/s)
Mooring point1Centroid1.5–2.5
Mooring point16Waterline1.5–2.5
Mooring point31Vertex1.5–2.5
Wave direction1Centroid1.5–2.5
Wave direction16Centroid45°1.5–2.5
Wave direction31Centroid90°1.5–2.5
Frequency region1Centroid1.5–2.5
Frequency region2Centroid2.0–2.5
Frequency region3Centroid2.5–3.0
Frequency region4Centroid2.0–3.0
Frequency region5Centroid2.5–4.0

