Abstract
In the present study, a series of laboratory experiments were conducted to examine the impact of pyrolysis temperature on the outcome yields of waste coconut shells in a fixed bed reactor under varying conditions of pyrolysis temperature, from 400 to 800 °C. The temperature was increased at a stable heating rate of about 10 °C/min, while keeping the sweeping gas (Ar) flow rate constant at about 100 mL/min. The bio-oil was described by Fourier transform infrared spectroscopy (FTIR) investigations and demonstrated to be an exceptionally oxygenated complex mixture. The resulting bio-chars were characterized by elemental analysis and scanning electron microscopy (SEM). The output of bio-char was diminished pointedly, from 33.6% to 28.6%, when the pyrolysis temperature ranged from 400 to 600 °C, respectively. In addition, the bio-chars were carbonized with the expansion of the pyrolysis temperature. Moreover, the remaining bio-char carbons were improved under a stable structure. Experimental results showed that the highest bio-oil yield was acquired at 600 °C, at about 48.7%. The production of gas increased from 15.4 to 18.3 wt.% as the temperature increased from 400 to 800 °C. Additionally, it was observed that temperature played a vital role on the product yield, as well as having a vital effect on the characteristics of waste coconut shell slow-pyrolysis.
1. Introduction
Energy is important for agricultural production, electrical generation, transportation and industrial progress, and other economic sectors [1]. Fossil fuel is the leading source of energy and is interred deep inside the Earth. However, these resources are insufficient and are not capable of fulfilling for long the growing global energy requirement [2]. Moreover, there are adverse influences from the consumption of fossil fuels on climate, atmospheric pollution, acid rain, and global warming, for example [3]. For this reason, alternative and durable energy sources are essential to fulfill this rising demand for energy. With the swift expansion in its overall energy application, and the sustainability and expanding environmental impact from fossil fuels, biomass fuels, as sustainable energy sources, have progressively been considered a key choice to replace traditional fossil fuels. Lignocellulosic biomass residues are byproducts or the waste from processed agricultural products, which is an enormous and inexpensive source of sustainable energy that does not affect food or feed supplies. It is outstandingly inexpensive, in comparison to conventional fossil fuels, based on energy supply. Currently, biomass and residues account for 10% to 15% of the world’s energy demand [4].
The pyrolysis of biomass has received increasing attention. Within the previous decade, pyrolysis has been the most encouraging thermochemical technique to provide energy from biomass. Pyrolysis is a procedure in which the thermal deterioration of the organic elements of biomass is formed and maintains the environmental inanimate responses in order to acquire energy. The pyrolysis of the biomass brings about three items: bio-oil, gas, and bio-char. Bio-oil is created in the pyrolysis procedure and has a prosperity as feedstock for electricity generation because it contains a huge amount of energy that is practically identical to the petroleum products after upgradation [5]. Non-condensable gases consist of CH4 (methane), H2 (hydrogen), CO (carbon monoxide), and CO2 (carbon dioxide), which might be burned for energy recuperation or for the creation of syngas. Bio-char is a hard, carbon-rich element that is thermally durable for biomass or some other organic elements [6]. Additionally, bio-char created during pyrolysis contains a large amount of energy, which at times is equivalent to the coal utilized as fuel in ventures [7,8]. The microporous formation of bio-char and its large amount of carbon content makes it valuable for a few modern applications. Moreover, to promote the efficiency of soil, bio-char can be effectively employed from an agricultural perspective. The application of bio-char within soil builds the pace of carbon sequestration in soil. It hinders the pace of supplement deterioration in soil, and thus, improves soil quality, such as the fertility of soil [9,10,11,12]. In electricity generation, the large amount of carbon content suggests that bio-char can be utilized as a fuel.
Coconut shell accounts for an ordinary biomass waste, which is in enormous proportions in all the tropical regions in Asia, Africa, and Latin America. Coconut shell is an inexpensive resource because it is found in over 90 nations around the world [13]. The coconut shell is produced from oil manufacturing, several agro industrial activities, and different utilizations of coconut. This coconut shell byproduct waste needs to be recycled. It can be a significant source of energy if it is properly utilized. Numerous investigators have explored the pyrolysis of other biomasses, for example, sawdust, straw, mangaba seed, corncob, miscanthus, olivekernel, almond shell, and regnum stalks [14,15,16,17]. However, the studies related to coconut shell biomass are outnumbered. Raveendran et al. [18] investigated thirteen biomass samples, in which coconut shell was one. However, insignificant attention was given to these materials. Hoque and Battacharya [19] only studied the coconut shell gasification item from fluidized and spouted bed gasifiers, at a temperature range from 607 to 842 °C. Tritti et al. [20] explored the product characteristic of the fast pyrolysis of coconut shell biomass using FTIR (Fourier transform infrared spectroscopy). Tsamba et al. [21] only studied pyrolysis characteristics and the global kinetics of coconut and cashew nut shells using a thermogravimetric analyzer. Solid, liquid, and gaseous productions, acquired by coconut shell flash and fast pyrolysis, were formerly described [20,22,23]. Nevertheless, comprehensive investigations of the pyrolysis yield and utilization of the byproduct are rare, especially for the effect of the reaction condition and characterization. Thus, the objectives of this paper were to evaluate the effect of pyrolysis temperature on the product yields, as well as to clarify the characterization and the parceling of the mass of coconut shell waste pyrolysis products under varying conditions of pyrolysis temperatures.
2. Materials and Methods
2.1. Sample Preparation
Mature and properly ripened brown coconuts (Cocos nucifera) were collected from the local fruit market in Jessore, located in Khulna division, Bangladesh. The coconut shells were segregated from the copra and husk. The coconut shells were dried in the sunlight for several days in order to withdraw the extract. The samples were crushed and sieved to less than 250 µm by a crusher and sieve shaker, dried at a natural temperature, and then exposed for one hour in the laboratory atmosphere in order to obtain the air-dried samples. Finally, the samples were placed in the dissector. Proximate and ultimate analyses were performed on air-dried samples. The ultimate or elemental analysis was executed by employing a carbon, hydrogen and nitrogen coder (CHN) (MT-5 Yanaco, Co. Ltd., Japan). Moisture, ash, and volatile matter were found by adopting the Japanese Industrial Standard Code procedures. Fixed carbon (FC) was estimated as follows:
FC (wt.%) = 100 − {Moisture(wt.%) + Ash(wt.%) + Volatile Matter(wt.%)}
2.2. Experimental Apparatus for Fixed Bed Pyrolysis
Figure 1 illustrates the different experimental arrangements for biomass pyrolysis and gasification. The main components include a pyrolysis system, a trapping system for condensable products, a gas feeding system, a system for the measurement of gaseous products, and a liquid decomposition system. Two stainless steel coupling reactors, each with an inner diameter dimension of 21.4 mm and a length of 500 mm, were employed in the liquid decomposition system and the pyrolysis system. Biomass was positioned in the 40 µm mesh of each reactor. Furthermore, two distinct electric furnaces governed the independent heating processes of the apparatuses. Additionally, the apparatuses could play a significant role in the heterogeneous reaction amid liquid and ash. The paired stainless steel pipes between the liquid tapping system and the reactors were heated to 300–400 °C in order to avoid contraction of the liquid. Test tubes were inserted in order to collect the condensable products and glass beads were used to boost the collection capability. A cooling bath temperature of –3 °C was maintained with the application of water and ice. Gas chromatography was used to calibrate the different gaseous products.
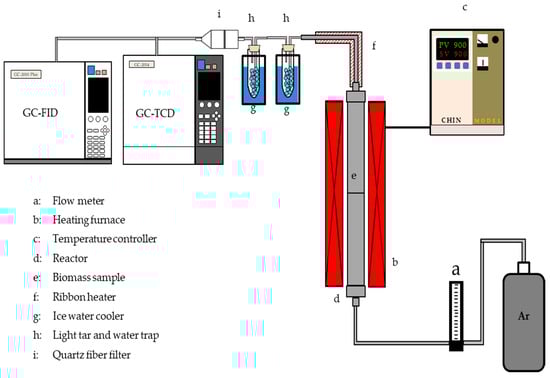
Figure 1.
Experimental apparatus for pyrolysis and gasification product measurements.
2.3. Experimental Procedure
In this experiment, approximately 4 g of the dried sample was positioned on a mesh portion inside the reaction tube. A conduit was connected and installed in an electric furnace. Assembled traps and measure weights were then connected with the liquid trap and filter holder. The joint and upper part of the reaction tube was warped with a ribbon heater. A flow of Ar was supplied in order to create an appropriate reductive atmosphere within the reactor. Thereafter, the temperature control program was set at a heating rate of 10 °C/min, from room temperature (about 25 °C), to 400–800 °C, and it started heating. After the experiment was completed, the electric furnace was opened and the reaction tube was cooled for 1 h using an electric fan. The gaseous products (H2, CO, CO2, CH4) were evaluated based on the measurement results by gas chromatography (GC-2010, Shimadzu Co. Ltd., Japan). The bio-oil (light-weight tar) produced was found by the weight difference method of the liquid entrapment before and after the experiment. However, the char was defined as the residual product inside the reactor after performing the experiment. Heavy tar was condensed at an ambient temperature, which caused clogging in the pyrolysis reactor and pipes, and was calculated as follows:
Heavy tar = Biomass − (Bio-oil + char + total gas)
2.4. Measurement of Waste Coconut Shell Pyrolysis Product
The ultimate or elemental analyses of solid bio-char were performed by employing a CHN corder (MT-5 Yanaco, Co. Ltd., Japan). According to Dulong’s formula, higher heating values (HHV) were estimated as follows:
where C, H, O, and S are the carbon, hydrogen, oxygen, and sulfur, respectively. These were the fundamental compositions in the material weight percentages.
Heating value (MJ/kg) = 0.338 C+ 1.428 (H − O/8) + 0.095 S
Surface morphologies of bio-char were visualized by the scanning process of a scanning electron microscope (SEM, SU1510) at a fixed voltage of 15 kV.
The functional groups of coconut shell sample pyrolysis were quantified by Fourier transform infrared spectroscopy (FTIR). The pyrolysis liquid samples were covered by thin plates of potassium bromide (KBr). Additionally, after placement of the pellet within the FTIR instrument, the functional groups of liquid samples were evaluated. The infrared spectrum was documented within a range of 500 to 4000 cm−1.
2.5. Statistical Analysis
We conducted one-way analysis of variance (ANOVA)s to test the effect of temperature on all the measured parameters, namely the product yield (bio-char, bio-oil, and gas), product content (H, C, N, and O), HHV, and yields of distinct gases, i.e., CO, CO2, CH4, and H2, followed by a post-hoc multiple comparison test with least significant difference (LSD). A square-root function was used to transfer the data in order to maintain the homogeneity of the variances of these analyses, and Levene’s test of equality was applied to check the homogeneity of the variance of the data that were used. After that, p ≤ 0.05 was considered to be significant for all experimental data analyses by using the statistical software IBM SPSS statistics 24.0 (whereas p ≤ 0.05 means that the test hypothesis was statistically significant).
3. Results and Discussion
3.1. Characterization of Raw Biomass
The ultimate and proximate analysis and HHV for the waste coconut shell is displayed in Table 1. From the ultimate analysis results of waste coconut shell, the carbon (C), hydrogen (H), nitrogen (N), and oxygen (O) amounts were 39.22, 4.46, 0.02, and 56.10 wt.%, respectively. The HHV of waste coconut shell was found to be 9.62 MJ/kg. However, the mass amount of oxygen content may convey adverse effects on the HHV. Low nitrogen substance is crucial, due to the fact that higher N percentages might result in toxic NO2 emissions throughout pyrolysis [24]. From the proximate analysis results of waste coconut shell, the values of moisture content, volatile matter, fixed carbon, and ash were 7.82, 79.91, 12.04, and 0.23 wt.%, respectively. A quantitative comparison with previous studies related to coconut shell is presented in Table 2. In Table 2, all the elemental and proximate analyses were found to be different when compared with the present study, due to both the elemental and proximate components being significantly dependent on the maturity of coconut, soil quality, and environmental condition during cultivation. Waste coconut shell has a high volatile content, which is good for the pyrolysis process. A low ash amount is significant because a high ash amount can trigger aggregation in experimental procedures and can result in unproductive heat transfer rates. Low combustion, spillover processing costs, difficulties in the disposal, and waned energy conversion are potential reasons for an undesirable amount of ash [25,26]. Inorganic minerals present in ash greatly affect biomass pyrolysis mechanisms [27].

Table 1.
Proximate and ultimate analysis of waste coconut shell.
Table 2.
Comparison of proximate and ultimate analysis of coconut shell.
3.2. Product Yields under Operating Variables
Coconut shell biomass was pyrolyzed using a fixed bed reactor under several pyrolysis temperatures. Each experiment was repeated at least three times. Figure 2 represents the product yields under several pyrolysis temperatures. The product yields varied significantly across the temperature ranges (bio-char: F4,10 = 1107.48, p ≤ 0.0001; bio-oil: F4,10 = 70.54, p ≤ 0.0001; gas: F4,10 = 207.65, p ≤ 0.0001; and heavy tar: F4,10 = 62.31, p ≤ 0.0001) (Figure 2). The bio-char at 400 to 600 °C was significantly higher than 700 and 800 °C (p ≤ 0.0001), and they were significantly different from each other (p ≤ 0.0001). However, no significant differences (p = 0.251) were observed for the bio-char in the temperature range from 700 to 800 °C. The proportion of bio-char relative to the entire number of biomass samples was reduced from 33.6 to 27.6 wt.% for coconut shell biomass when the pyrolysis temperature was raised from 400 to 700 °C. With the continually rising temperature, no momentous difference in the solid bio-char yields was observed. The pyrolysis of biomass samples at the central part intensified with the rise in temperature, which was one of the probable causes, and other researchers were satisfied with these outputs [29]. When the pyrolysis temperature rose from 400 to 600 °C, the product properties of bio-oil also increased from 47.5 to 48.7 wt.%, respectively. In addition, with the further rise in the pyrolysis temperature, from 600 to 800 °C, the product properties of bio-oil declined from 48.7 to 46.7 wt.%. Pointedly, the weight yield of bio-oil acquired its maximum value at 600 °C under all the considered cases. However, this phenomenon might have caused a significant impact on the secondary cracking behaviors of the volatiles at advanced pyrolysis temperatures (500 to 600 °C). Corresponding outcomes were accessed from the other research results [30,31]. Table 3 shows a comparison of the product yields, namely char, liquid, and gas, which are more or less similar to our results. Pyrolysis temperature was found to have an important effect of non-condensable gas yields. With the further expansion of the gas products, there was a more significant effect at higher temperatures, mainly because of the secondary cracking attitudes of the volatiles. Additionally, throughout the secondary decomposition process, the bio-char may generate non-condensable elements, which would boost gas yields in increments of different pyrolysis temperatures.
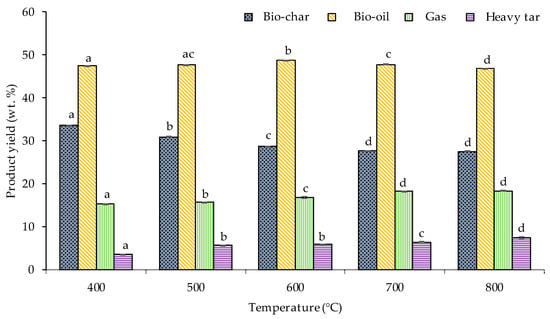
Figure 2.
Product yields of pyrolysis products against varying conditions of temperature, where each bar indicates the mean ± standard error [SE (n = 3)]. Note: distinct letters in each specific yield bar indicate significant differences (p ≤ 0.05).
Table 3.
Comparison of pyrolysis product yield of coconut shell.
3.3. Characterization of Waste Coconut Shell Bio-Chars
3.3.1. Elemental Analysis of Bio-Char
The fundamental components of the bio-char underwent a widespread shift on account of the dejection of maximum volatiles during the pyrolysis procedure. Figure 3 shows the fundamental components of bio-char at various pyrolysis temperatures. Elements C and H in the bio-char differed significantly across the temperature ranges (C: F4,10 = 9.93, p = 0.002; H: F4,10 = 1716.56, p ≤ 0.0001; and O: F4,10 = 62.31, p = 0.006), except N (F4,10 = 3.001, p = 0.072) (Figure 3). The major elements were C, O, and a small amount of H and N. With the increment of pyrolysis temperature, an increasing trend in the carbon components of the bio-char from coconut shell was observed. Under 400 °C, the components of O and H were reduced, due to the condensation and withdrawal of the OH bonds [32]. With rising temperatures, higher volatiles were also released, which lead to a reduction in O and H components. A reduction in O elements was shown when the temperature was over 400 °C; however, the reduced range was small. It implies that the oxygen content involved in the practical units of the fission process was evaporated in the lower temperature zone [33]. The N element exhibited a slow ascending trend with the increment in temperature. The reduction in nitrogen content may be due to the cleavage of nitrogen-containing practical units and the discharge of different gaseous products that contain basic N contents [34].
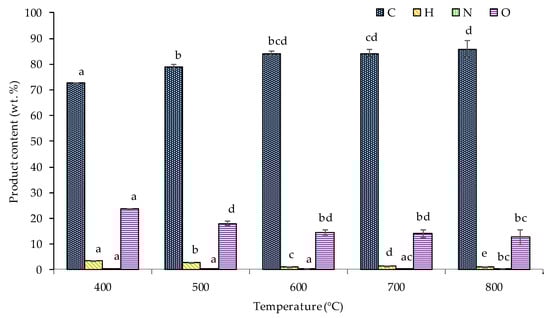
Figure 3.
Effect of temperature on fundamental content of coconut shell bio-char against varying conditions of temperature, where each bar indicates the mean ± standard error [SE (n = 3)]. Note: distinct letters in each specific yield bar indicate significant differences (p ≤ 0.05).
3.3.2. Morphological Observation of Bio-Char by Scanning Electron Microscopy
Figure 4 shows scanning electron microscope (SEM) images of raw biomass and bio-char products obtained at pyrolysis temperatures of 400, 500, 600, 700, and 800 °C. It can clearly be observed that the varying conditions of different pyrolysis temperatures played a significant role in changing the surface morphology of different solid products. The raw biomass appeared to be stone shaped and had a nonporous surface (Figure 4a), and some scattered zones were also observed. The solid bio-char obtained at 400 °C had a rigid, uneven surface with formation of a few pores (Figure 4b). A significant shear bond was witnessed that resulted in the shearing of the materials. The surface of the bio-char product obtained at 500 °C contained a sheet surface and an increased surface area (Figure 4c). The product obtained at 600 °C had no apparent difference in the visual observation (Figure 4d), with only some cracks developing on the surface, when compared to the bio-char that was obtained at 500 °C. The bio-char acquired at 700 °C showed a miscellaneous range of shapes in the pores (Figure 4e). The solid product achieved at 800 °C had a gnarled surface, including dispersed fragments of numerous dimensions (Figure 4f). The advanced carbon content influenced the practice of bio-char. In addition, in the elemental analysis, some variation of the carbon content in bio-char was noted. Therefore, the major features, i.e., morphological, physical, and chemical, were revealed upon the formulation of bio-char. Important parameters such as pyrolysis temperature were found to be dominant, thus controlling the different physical characteristics of bio-char samples, which consequently resulted in each bio-char being significantly different from each other.
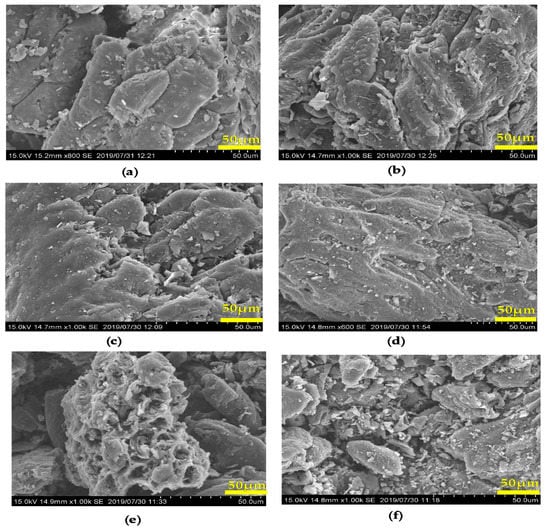
Figure 4.
SEM results from coconut shells: (a) coconut shell and bio-char, (b) 400 °C, (c) 500 °C, (d) 600 °C, (e) 700 °C, and (f) 800 °C.
3.3.3. Higher Heating Value (HHV) of Bio-Char
HHV is an important parameter that defines the efficiency of bio-char as fuel. The HHV did not differ across the temperature ranges (C: F4,10 = 2.09, p = 0.156) (Figure 5), but the HHV at 400 °C was found to be low at 700 and 800 °C (p ≤ 0.05). However, the HHV showed an increasing trend with the increment of temperature. In this study, the HHV of the bio-chars ranged from 28.1 to 30.6 MJ kg−1 for coconut shell when the pyrolysis temperature ranged from 400 to 800 °C. The HHV of the bio-chars increased with the rise in the pyrolysis temperature, as shown in Figure 5. This trend enhanced the carbon content of bio-char at increased temperatures. The HHV of the bio-chars was analogous, in this observation, to several other bio-chars, for example, Cynara cardunculus L [35], cotton stalk [36], and cotton stalk briquette [37].

Figure 5.
Effect of temperature on HHV in coconut shell bio-char, where each bar indicates the mean ± standard error [SE (n = 3)]. Note: distinct letters in each specific yield bar indicate significant differences (p ≤ 0.05).
The HHVs of the bio-chars were equivalent to solid fuels, which are listed from lignite to anthracite, and implies that the bio-chars could be utilized as solid fuels [38].
3.4. Characterization of Bio-Oil Using FTIR
Figure 6 shows the FTIR spectra of bio-oil products obtained at 400, 500, 600, 700, and 800 °C pyrolysis temperatures. The spectra were practically indistinguishable and showed that the characteristic formation of liquid product was fetterless in relation to the pyrolysis temperature. However, reliant on the formation of the biomass explanation, the characteristic structure of biomass was described by its components, cellulose, hemicellulose, lignin, for example. These components were found to be identical during the pyrolysis of coconut shells. Moreover, it is common that the bio-oil product predominantly formed from the evaporated volatiles that came from holocellulose (cellulose and hemicellulose), which decomposes at temperatures of approximately 400 °C. Hence, the spectra achieved at several pyrolysis temperatures were analogous, as expected. However, similar outcomes were also observed for the pyrolysis of almond shell [39]. The maximum spacious and comprehensive peak values were observed at 3448 cm−1, which was found to be indicative of the excessive existence of oxygenated compounds because it was affected by the O-H extended shock of the hydroxyl groups that exist in water, phenol, alcohol, and/or carboxylic acids. The peak was revealed at 2960 cm−1, on account of the C-H outstretched tremor of aliphatic CH2 and CH3 groups [40]. The infirm peak at 2624 cm−1 was possibly due to the OH tremor of carboxylic acid. The peak revealed at 2072 cm−1 was due to the C=C outstretched terminal alkyne groups. The penetrating peak at 1715 cm−1 was due to C=O outstretched tremor, which exposed the availability of aldehydes or ketones. The peak at 1689 cm−1 presumably involved the C=C outstretched tremor of alkenes and aromatics. The peaks among 1391 cm−1 can be imputed to the C-H bending tremor introduction of alkane groups. The manifest peaks found within the 1300 to 1000 cm−1 band were on account of the C=O outstretched and O-H deformation tremors, and showed the availability of alcohols, phenols, esters, and ethers. Furthermore, the peaks lower than 1000 cm−1 were distinguishable from polycyclic aromatic compounds and single ring aromatic compounds [41].
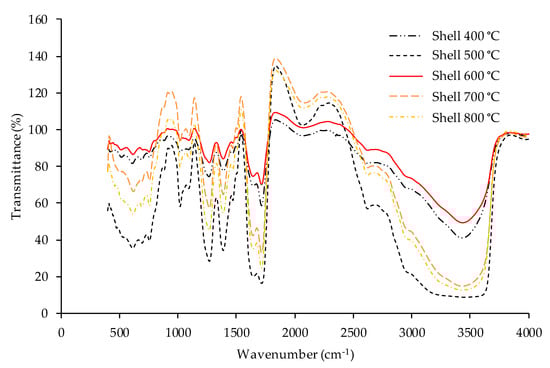
Figure 6.
Fourier transform infrared spectroscopy (FTIR) spectra of waste coconut shell bio-oil at different temperatures.
3.5. Gas Product Characteristics Using Gas Chromatography
Biomass pyrolysis gas was composed of CO2, CO, CH4, H2, and a small amount of hydrocarbons. The gaseous product varied significantly across the temperature range (CO: F4,10 = 158.81, p ≤ 0.0001; CO2: F4,10 = 23.74, p ≤ 0.0001; CH4: F4,10 = 73.83, p ≤ 0.0001; and H2: F4,10 = 492.19, p ≤ 0.0001) (Figure 7). The CO2 at 400 and 800 °C significantly differed in all temperature ranges (p ≤ 0.0001), but no differences were observed at 500, 600, and 700 °C (p ≥ 0.05). However, CO differed across the temperature ranges (p ≤ 0.0001) and it increased linearly with increasing temperatures (Figure 7). The formation of non-condensable gas was predominantly the result of secondary reactions, for instance, of the volatile breakdown and the interactions amid volatiles with char or volatiles with gas during pyrolysis; however, CO and CO2 were the prevalent gases. Yang et al. [42] stated that the primary gases of biomass pyrolysis were CO, CO2, H2, CH4, a few organics, and water vapor. Additionally, those gases were significantly responsible in originating the reaction characteristics between the functional groups. For example, CO2 and CO were probably generated below 600 °C by the breakdown and reconstruction of the following functional groups: carboxylic acid (-COOH), carbonyl (C=O), ether (C-O-C), and methane (CH4), which were predominantly generated by the breakdown of O-CH3 groups.
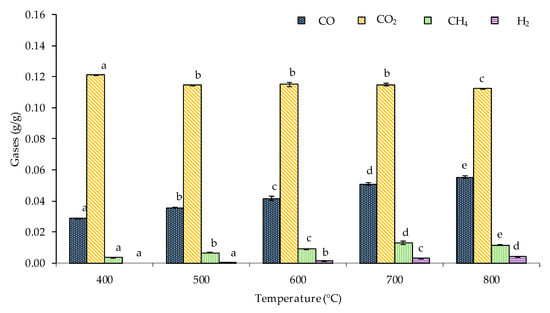
Figure 7.
Gas yields as a function of pyrolysis temperature using coconut shell. Each bar is the mean ± stand error [SE (n = 3)]. Different letters in each specific gas bar indicate significant differences (p ≤ 0.05).
Figure 7 shows the main components of the gases at different pyrolysis temperatures. When the pyrolysis temperature was 400 °C, then the major components of the gases were CO (31.7 vol.%), CO2 (33.28 vol.%), H2 (2.1 vol.%), and CH4 (7.1 vol.%). By further increasing the pyrolysis temperature, the quantity of H2 quickly rose from 2.1 vol.% (400 °C) to 3.7 vol.% (600 °C), and the CO2 amount decreased from 33.18 vol.% (400 °C) to 26.6 vol.% (600 °C). The higher amounts of the non-condensable gas products were mainly CO and CO2 because of the higher degrees of the deoxygenation component during the biomass pyrolysis experiments. The decrement of CO2 with the increment of temperature in the pyrolysis gas products could be the reason for the gasification reaction of carbon. In addition, by raising the temperature from 600 to 800 °C, the amount of H2 likely increased and the quantity of CO2 likely decreased. The quantity of CO abated gradually with the rise in temperature. With the further increase of temperature, the quantity of CH4 followed a declining trend, indicating that the higher temperature may be significant by promoting dry reforming reactions of CH, along with the decomposition process [43,44].
CH4 + CO2 = 2CO + 2H2, ΔH298 = 247.9 kJ mol−1
CH4 = C + 2H2, ΔH298 = 75.6 kJ mol−1
Hydrogen emanated from the dehydrogenation reactions of liquid (bio-oil) and char, for example, alkene formation, condensation, and aromatization. The properties of the gas artifacts varied with temperature; they depended on the development of diverse gases, and were significantly influenced by temperature for their development [45].
Depending on the extensive analyses of the pyrolysis product allocation and development, temperature was significant for fixed bed pyrolysis. High temperature assisted the generation of non-condensable gas properties and the proportion of flammable gas to exhaustive gas production, particularly H2 production [46].
3.6. Future Application of Waste Coconut Shell Pyrolysis Product
In recent years, the pyrolysis of biomass has acquired increasing attention. Bio-char is not just suitable for fuel, but can also be additionally prepared into organic fertilizers, electrode materials, or activated carbon [46,47,48]. Bio-oil is simple to move and use, and is viewed as a perfect energy source that can be applicable in the same way as fossil fuels. Moreover, bio-oil contains a rich mixture of dense organic compounds, which are of great economic value. Upon purification, bio-oil may be utilized to produce valuable chemicals. Non-condensable gas probably underwent combustion in boilers and generators, and likewise, can be utilized for power restoration or to produce syngas. Furthermore, it can be utilized as a supporting agent in the pyrolysis process by supplying heat in the pyrolysis procedure of biomass.
4. Conclusions
The pyrolysis reaction temperature had a significant outcome on product characteristics. Developing pyrolysis temperature supports the creation of CO and CH4, and augments the carbon quantity of bio-char; however, it reduced the quantity of water in bio-oil. The ratio of bio-char to the exhaustive quantity of coconut shell samples waned when the pyrolysis temperature rose from 400 to 600 °C. With the continuous raising of the temperature, no momentous differences in the solid bio-char yields were observed. When the pyrolysis temperatures rose from 400 to 600 °C, the product properties of the bio-oil also increased. Likewise, with an increase in the pyrolysis temperature, the amount of bio-oil declined. Pointedly, the weight yield of bio-oil acquired its highest value at 600 °C under all the considered conditions of temperature. Moreover, the existence of higher oxygenated combinations within the liquid product against the temperature ranges considered was confirmed by FTIR analysis. With the increase in the gas volume, there was a more substantial outcome of hydrogen production at higher temperatures, mainly because of the secondary cracking attitudes of the volatiles. Moreover, the temperature had a vital effect on hydrogen (H2) production in waste coconut shell pyrolysis. Bio-char, bio-oil, and non-condensable gaseous products were vital outcomes in the pyrolysis process of biomass, which could be utilized as an alternative energy source like fossil fuels.
Author Contributions
Conceptualization, J.K.S. and Q.W.; methodology, Q.W.; software, J.K.S.; validation, J.K.S. and Q.W.; formal analysis, J.K.S.; investigation, J.K.S.; resources, Q.W.; data curation, J.K.S.; writing—original draft preparation, J.K.S.; writing—review and editing, Q.W.; visualization, J.K.S.; supervision, Q.W.; project administration, Q.W.; funding acquisition, Q.W. All authors have read and agreed to the published version of the manuscript.
Funding
This study was partially supported by the special funds for Basic Researches (B) (No. 15H05119, FY2015~FY2017) of Grant-in-Aid Scientific Research of the Japanese Ministry of Education, Culture, Sports, Science and Technology (MEXT), Japan.
Acknowledgments
The authors would like to thank Abedur Rahman (Doctoral candidate, Hydraulic and Environmental Engineering Laboratory, Department of Civil and Environmental Engineering, Saitama University, Saitama, Japan) and Nazim Uddin (PhD Research Fellow Ecology Group, Department of Environmental Science Victoria University, Melbourne, Australia) for providing technical support and discussions. Moreover, first author would like to thank Mitsubishi Corporation for providing a scholarship that made it possible to achieve this study.
Conflicts of Interest
The authors declare no conflict of interest.
References
- Enweremadu, C.C.; Mbarawa, M.M. Technical aspects of production and analysis of biodiesel from used cooking oil—A review. Renew. Sustain. Energy Rev. 2009, 13, 2205–2224. [Google Scholar] [CrossRef]
- Biswas, S.; Majhi, S.; Mohanty, P.; Pant, K.K.; Sharma, D.K. Effect of different catalyst on the co-cracking of Jatropha oil, vacuum residue and high density polyethylene. Fuel 2014, 133, 96–105. [Google Scholar] [CrossRef]
- Goyal, H.B.; Seal, D.; Saxena, R.C. Bio-fuels from thermochemical conversion of renewable resources: A review. Renew. Sustain. Energy Rev. 2008, 12, 504–517. [Google Scholar] [CrossRef]
- Khan, A.A.; De Jong, W.; Jansens, P.J.; Spliethoff, H. Biomass combustion in fluidized bed boilers: Potential problems and remedies. Fuel Process. Technol. 2009, 90, 21–50. [Google Scholar] [CrossRef]
- Park, H.J.; Dong, J.I.; Jeon, J.K.; Park, Y.K.; Yoo, K.S.; Kim, S.S.; Kim, J.; Kim, S. Effects of the operating parameters on the production of bio-oil in the fast pyrolysis of Japanese larch. Chem. Eng. J. 2008, 143, 124–132. [Google Scholar] [CrossRef]
- Mašek, O.; Budarin, V.; Gronnow, M.; Crombie, K.; Brownsort, P.; Fitzpatrick, E.; Hurst, P. Microwave and slow pyrolysis biochar—Comparison of physical and functional properties. J. Anal. Appl. Pyrolysis 2013, 100, 41–48. [Google Scholar] [CrossRef]
- Fu, P.; Hu, S.; Xiang, J.; Sun, L.; Su, S.; Wang, J. Evaluation of the porous structure development of chars from pyrolysis of rice straw: Effects of pyrolysis temperature and heating rate. J. Anal. Appl. Pyrolysis 2012, 98, 177–183. [Google Scholar] [CrossRef]
- Mohanty, P.; Pant, K.K.; Naik, S.N.; Parikh, J.; Hornung, A.; Sahu, J.N. Synthesis of green fuels from biogenic waste through thermochemical route–The role of heterogeneous catalyst: A review. Renew. Sustain. Energy Rev. 2014, 38, 131–153. [Google Scholar] [CrossRef]
- McHenry, M.P. Agricultural bio-char production, renewable energy generation and farm carbon sequestration in Western Australia: Certainty, uncertainty and risk. Agric. Ecosyst. Environ. 2009, 129, 1–7. [Google Scholar] [CrossRef]
- Malghani, S.; Gleixner, G.; Trumbore, S.E. Chars produced by slow pyrolysis and hydrothermal carbonization vary in carbon sequestration potential and greenhouse gases emissions. Soil Biol. Biochem. 2013, 62, 137–146. [Google Scholar] [CrossRef]
- Hao, X.W.; Huang, Y.Z.; Cui, Y.S. Effect of bone char addition on the fractionation and bio-accessibility of Pb and Zn in combined contaminated soil. Acta Ecol. Sin. 2010, 30, 118–122. [Google Scholar] [CrossRef]
- Khare, P.; Goyal, D.K. Effect of high and low rank char on soil quality and carbon sequestration. Ecol. Eng. 2013, 52, 161–166. [Google Scholar] [CrossRef]
- Rout, T.; Pradhan, D.; Singh, R.K.; Kumari, N. Exhaustive study of products obtained from coconut shell pyrolysis. J. Environ. Chem. Eng. 2016, 4, 3696–3705. [Google Scholar] [CrossRef]
- Kim, S.W. Pyrolysis conditions of biomass in fluidized beds for production of bio-oil compatible with petroleum refinery. J. Anal. Appl. Pyrolysis 2016, 117, 220–227. [Google Scholar] [CrossRef]
- Le Brech, Y.; Jia, L.; Cissé, S.; Mauviel, G.; Brosse, N.; Dufour, A. Mechanisms of biomass pyrolysis studied by combining a fixed bed reactor with advanced gas analysis. J. Anal. Appl. Pyrolysis 2016, 117, 334–346. [Google Scholar] [CrossRef]
- Santos, R.M.; Santos, A.O.; Sussuchi, E.M.; Nascimento, J.S.; Lima, Á.S.; Freitas, L.S. Pyrolysis of mangaba seed: Production and characterization of bio-oil. Bioresour. Technol. 2015, 196, 43–48. [Google Scholar] [CrossRef]
- Gu, X.; Ma, X.; Li, L.; Liu, C.; Cheng, K.; Li, Z. Pyrolysis of poplar wood sawdust by TG-FTIR and Py–GC/MS. J. Anal. Appl. Pyrolysis 2013, 102, 16–23. [Google Scholar] [CrossRef]
- Raveendran, K.; Ganesh, A.; Khilar, K.C. Influence of mineral matter on biomass pyrolysis characteristics. Fuel 1995, 74, 1812–1822. [Google Scholar] [CrossRef]
- Hoque, M.M.; Bhattacharya, S.C. Fuel characteristics of gasified coconut shell in a fluidized and a spouted bed reactor. Energy 2001, 26, 101–110. [Google Scholar] [CrossRef]
- Siengchum, T.; Isenberg, M.; Chuang, S.S. Fast pyrolysis of coconut biomass–An FTIR study. Fuel 2013, 105, 559–565. [Google Scholar] [CrossRef]
- Tsamba, A.J.; Yang, W.; Blasiak, W. Pyrolysis characteristics and global kinetics of coconut and cashew nut shells. Fuel Process. Technol. 2006, 87, 523–530. [Google Scholar] [CrossRef]
- Raj, K.G.; Joy, P.A. Coconut shell based activated carbon–iron oxide magnetic nanocomposite for fast and efficient removal of oil spills. J. Environ. Chem. Eng. 2015, 3, 2068–2075. [Google Scholar] [CrossRef]
- Tsai, W.T.; Lee, M.K.; Chang, Y.M. Fast pyrolysis of rice straw, sugarcane bagasse and coconut shell in an induction-heating reactor. J. Anal. Appl. Pyrolysis 2006, 76, 230–237. [Google Scholar] [CrossRef]
- Sundaram, E.G.; Natarajan, E. Pyrolysis of coconut shell: An experimental investigation. J. Eng. Res. 2009, 6, 33–39. [Google Scholar] [CrossRef]
- Sait, H.H.; Hussain, A.; Salema, A.A.; Ani, F.N. Pyrolysis and combustion kinetics of date palm biomass using thermogravimetric analysis. Bioresour. Technol. 2012, 118, 382–389. [Google Scholar] [CrossRef] [PubMed]
- Sarenbo, S. Wood ash dilemma-reduced quality due to poor combustion performance. Biomass Bioenergy 2009, 33, 1212–1220. [Google Scholar] [CrossRef]
- Kan, T.; Strezov, V.; Evans, T.J. Lignocellulosic biomass pyrolysis: A review of product properties and effects of pyrolysis parameters. Renew. Sustain. Energy Rev. 2016, 57, 1126–1140. [Google Scholar] [CrossRef]
- Damartzis, T.; Vamvuka, D.; Sfakiotakis, S.; Zabaniotou, A. Thermal degradation studies and kinetic modeling of cardoon (Cynara cardunculus) pyrolysis using thermogravimetric analysis (TGA). Bioresour. Technol. 2011, 102, 6230–6238. [Google Scholar] [CrossRef]
- Zhao, X.; Wang, M.; Liu, H.; Li, L.; Ma, C.; Song, Z. A microwave reactor for characterization of pyrolyzed biomass. Bioresour. Technol. 2012, 104, 673–678. [Google Scholar] [CrossRef]
- Chen, D.; Liu, D.; Zhang, H.; Chen, Y.; Li, Q. Bamboo pyrolysis using TG–FTIR and a lab-scale reactor: Analysis of pyrolysis behavior, product properties, and carbon and energy yields. Fuel 2015, 148, 79–86. [Google Scholar] [CrossRef]
- Kim, K.H.; Eom, I.Y.; Lee, S.M.; Choi, D.; Yeo, H.; Choi, I.G.; Choi, J.W. Investigation of physicochemical properties of biooils produced from yellow poplar wood (Liriodendron tulipifera) at various temperatures and residence times. J. Anal. Appl. Pyrolysis 2011, 92, 2–9. [Google Scholar] [CrossRef]
- Yang, H.; Yan, R.; Chen, H.; Lee, D.H.; Liang, D.T.; Zheng, C. Mechanism of palm oil waste pyrolysis in a packed bed. Energy Fuels 2006, 20, 1321–1328. [Google Scholar] [CrossRef]
- Demirbaş, A. Mechanisms of liquefaction and pyrolysis reactions of biomass. Energy Convers. Manag. 2000, 41, 633–646. [Google Scholar] [CrossRef]
- Becidan, M.; Skreiberg, Ø.; Hustad, J.E. NOx and N2O Precursors (NH3 and HCN) in Pyrolysis of Biomass Residues. Energy Fuels 2007, 21, 1173–1180. [Google Scholar] [CrossRef]
- Encinar, J.M.; Gonzalez, J.F.; Gonzalez, J. Fixed-bed pyrolysis of Cynara cardunculus L. Product yields and compositions. Fuel Process. Technol. 2000, 68, 209–222. [Google Scholar] [CrossRef]
- Chen, Y.; Yang, H.; Wang, X.; Zhang, S.; Chen, H. Biomass-based pyrolytic polygeneration system on cotton stalk pyrolysis: Influence of temperature. Bioresour. Technol. 2012, 107, 411–418. [Google Scholar] [CrossRef]
- Yang, H.; Liu, B.; Chen, Y.; Chen, W.; Yang, Q.; Chen, H. Application of biomass pyrolytic polygeneration technology using retort reactors. Bioresour. Technol. 2016, 200, 64–71. [Google Scholar] [CrossRef]
- Raveendran, K.; Ganesh, A. Heating value of biomass and biomass pyrolysis products. Fuel 1996, 75, 1715–1720. [Google Scholar] [CrossRef]
- Gonzalez, J.F.; Ramiro, A.; González-García, C.M.; Gañán, J.; Encinar, J.M.; Sabio, E.; Rubiales, J. Pyrolysis of almond shells. Energy applications of fractions. Ind. Eng. Chem. Res. 2005, 44, 3003–3012. [Google Scholar] [CrossRef]
- Apaydin-Varol, E.; Uzun, B.B.; Önal, E.; Pütün, A.E. Synthetic fuel production from cottonseed: Fast pyrolysis and a TGA/FT-IR/MS study. J. Anal. Appl. pyrolysis 2014, 105, 83–90. [Google Scholar] [CrossRef]
- Demiral, I.; Şensöz, S. The effects of different catalysts on the pyrolysis of industrial wastes (olive and hazelnut bagasse). Bioresour. Technol. 2008, 99, 8002–8007. [Google Scholar] [CrossRef] [PubMed]
- Yang, H.; Yan, R.; Chen, H.; Lee, D.H.; Zheng, C. Characteristics of hemicellulose, cellulose and lignin pyrolysis. Fuel 2007, 86, 1781–1788. [Google Scholar] [CrossRef]
- Domínguez, A.; Fernández, Y.; Fidalgo, B.; Pis, J.J.; Menéndez, J.A. Biogas to syngas by microwave-assisted dry reforming in the presence of char. Energy Fuels 2007, 21, 2066–2071. [Google Scholar] [CrossRef]
- Dominguez, A.; Menéndez, J.A.; Fernandez, Y.; Pis, J.J.; Nabais, J.V.; Carrott, P.J.M.; Carrott, M.R. Conventional and microwave induced pyrolysis of coffee hulls for the production of a hydrogen rich fuel gas. J. Anal. Appl. Pyrolysis 2007, 79, 128–135. [Google Scholar] [CrossRef]
- Yang, H.; Yan, R.; Chen, H.; Lee, D.H.; Liang, D.T.; Zheng, C. Pyrolysis of palm oil wastes for enhanced production of hydrogen rich gases. Fuel Process. Technol. 2006, 87, 935–942. [Google Scholar] [CrossRef]
- Dufour, A.; Girods, P.; Masson, E.; Rogaume, Y.; Zoulalian, A. Synthesis gas production by biomass pyrolysis: Effect of reactor temperature on product distribution. Int. J. Hydrog. Energy 2009, 34, 1726–1734. [Google Scholar] [CrossRef]
- Chen, D.; Zhou, J.; Zhang, Q. Effects of heating rate on slow pyrolysis behavior, kinetic parameters and products properties of moso bamboo. Bioresour. Technol. 2014, 169, 313–319. [Google Scholar] [CrossRef]
- Lee, Y.; Park, J.; Ryu, C.; Gang, K.S.; Yang, W.; Park, Y.K.; Jung, J.; Hyun, S. Comparison of biochar properties from biomass residues produced by slow pyrolysis at 500 °C. Bioresour. Technol. 2013, 148, 196–201. [Google Scholar] [CrossRef]
© 2020 by the authors. Licensee MDPI, Basel, Switzerland. This article is an open access article distributed under the terms and conditions of the Creative Commons Attribution (CC BY) license (http://creativecommons.org/licenses/by/4.0/).