Biowaste Treatment and Waste-To-Energy—Environmental Benefits

Abstract
:
1. Introduction
- The amount of utilised heat is firmly bound with the possibility to absorb heat in district heating systems (DHS) or for industrial heating.
- If such a heat sink is not available, less efficient power production is enforced.
- The share of biowaste in RES, technological advancement, and facilities availability will differ; for instance, in developed and developing countries.
2. Methodology
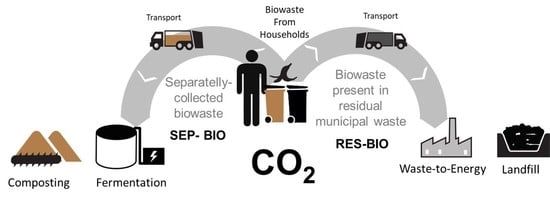
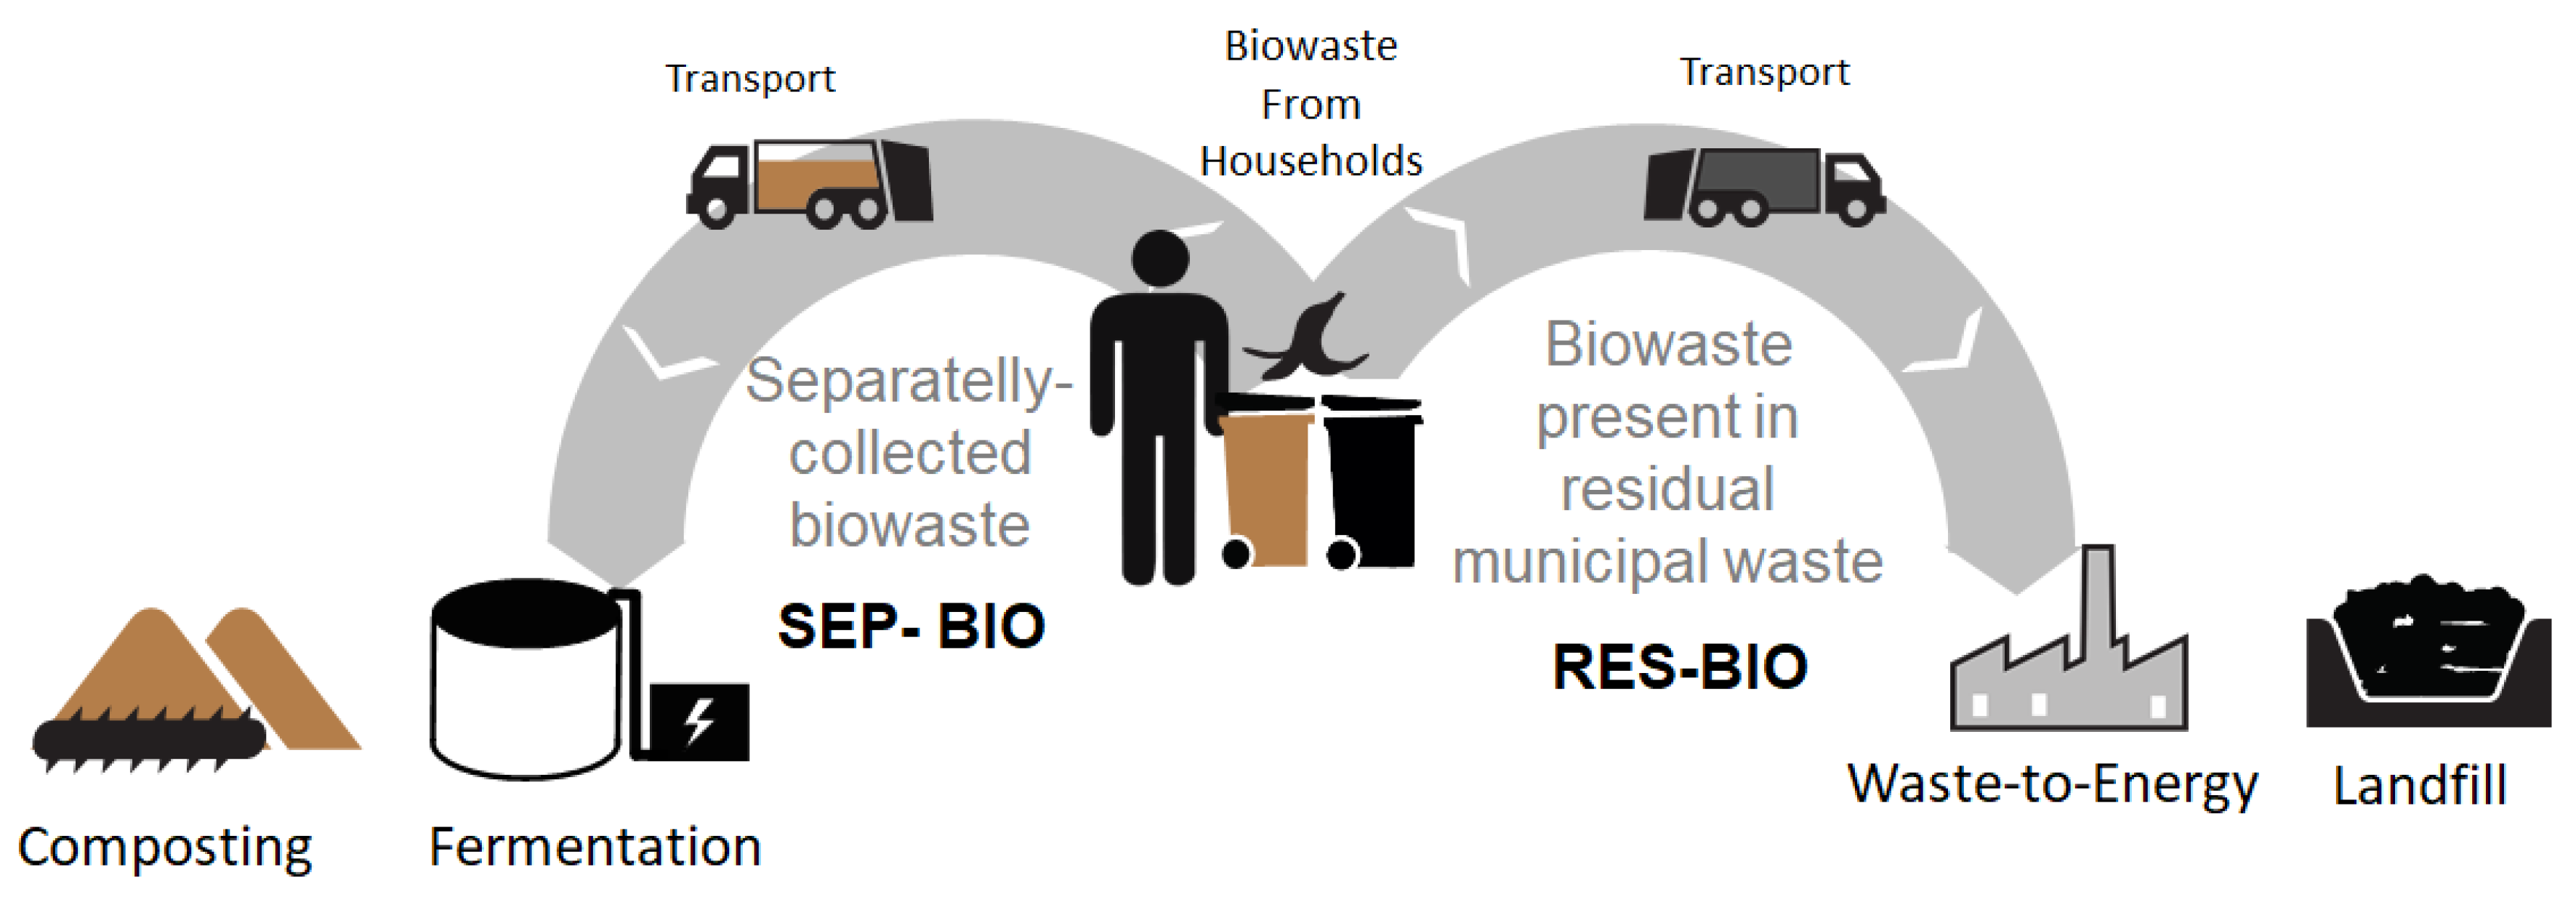
2.1. Goal and Scope
2.2. Fermentation and Composting Processes
2.2.1. Description
2.2.2. Specifications
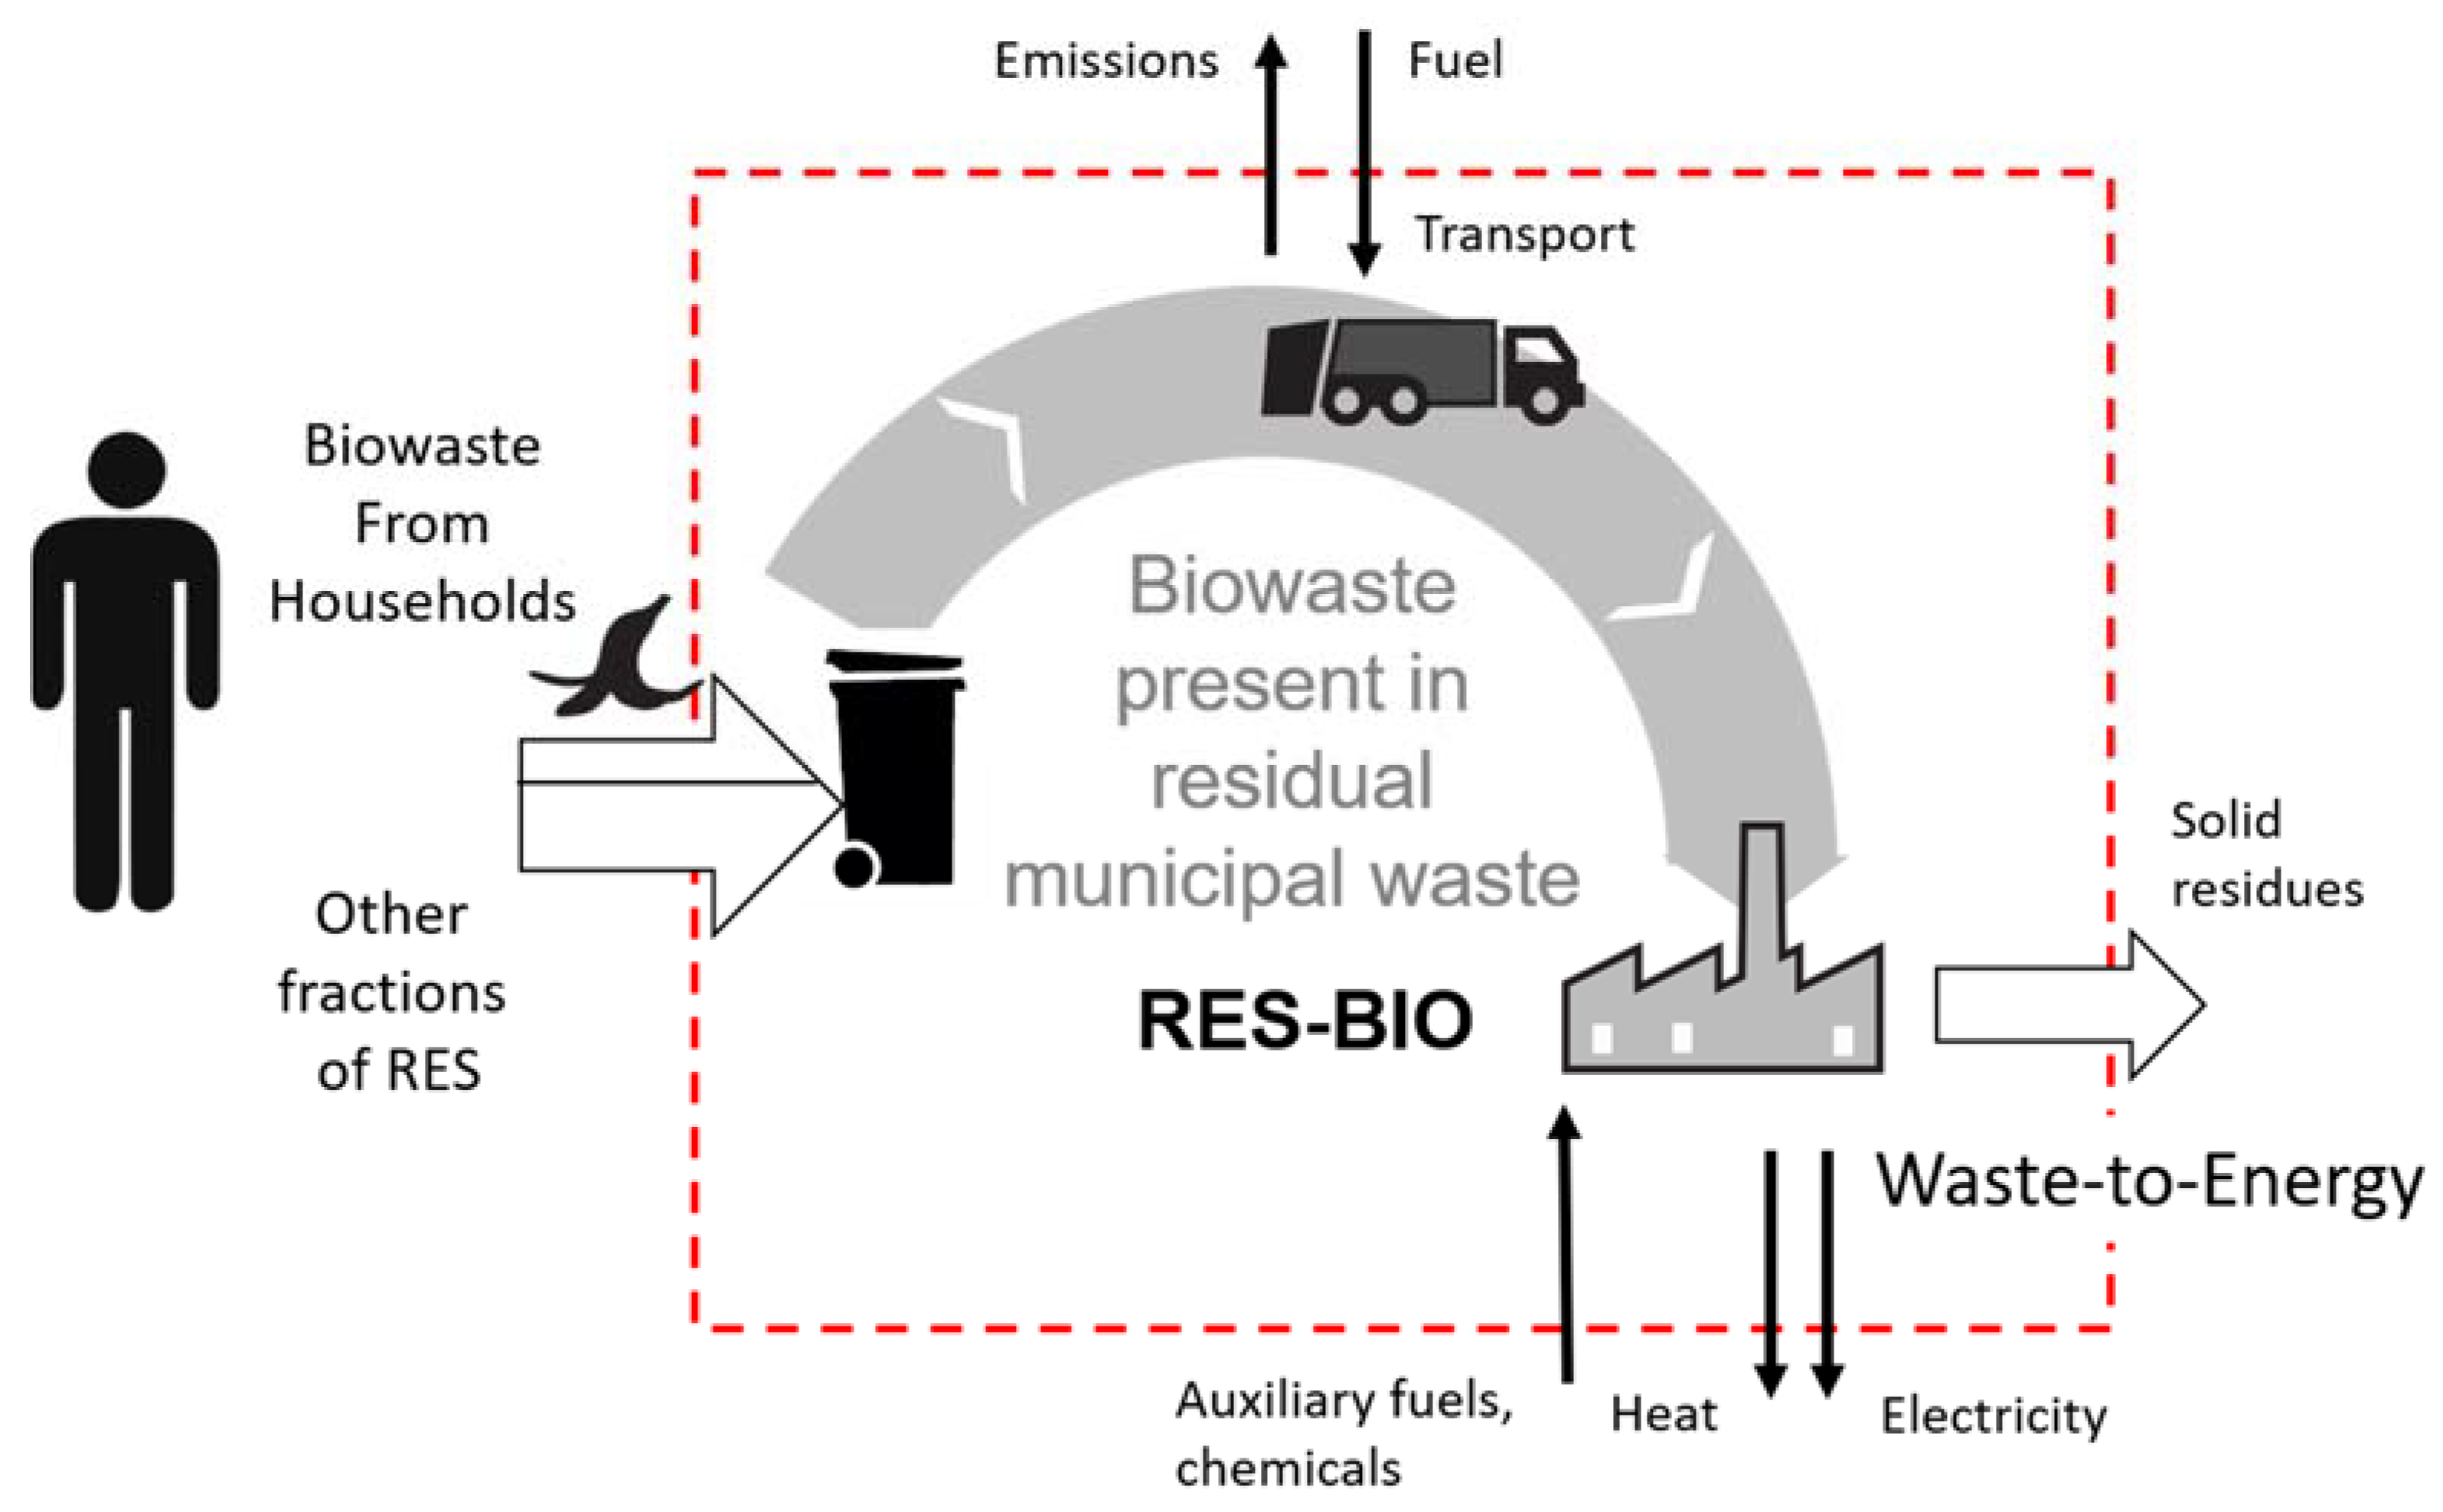
2.3. WtE Process
Modelling Approach
- i
- Firstly, the overall GWP for the whole amount of RES processed in WtE per year is calculated according to the procedure described in the previous paragraph, and according to [17], the resulting GWP is denoted as reference one and corresponds to the current composition of RES, GWPREFERENCE.
- ii
- Secondly, the marginal change of the input RES is defined, and its effects on results are assessed. The marginal change is the diversion of a specific amount of one of the waste components from the original composition of RES—in this case, biowaste. This change is denoted as mMARGINAL, and it expresses the biowaste removed from the input RES, i.e., the amount of input RES processed in WTE per year is decreased. The calculation procedure in the step (i.) is then repeated. The overall balance of the WTE plant is slightly modified, and the calculations lead to a new GWP value, which is called GWPALTERNATIVE. This value, therefore, represents the overall GWP for the whole amount of RES processed in WTE per year decreased by mMARGINAL.
- iii
- Finally, based on the assumption that the marginal change is exclusively related to one of the RES components, the GWP corresponding to the specific component—biowaste, in this case—can be computed. Such value is denoted as GWPCOMP or GWPBIO, and results from a simple equation:
- RES composition is listed in Table A1 in Appendix A and was estimated specifically for The Czech Republic using tool JUSTINE [28].
- The fuel mix for power and heat industry in the Czech Republic used for GWP calculations is given in Table A2 in Appendix A.
- The WtE plant capacity was selected as 100 kt of RES per year. Technological specifications are according to [17]. The released heat is utilised in a heat recovery steam generator (HRSG) to generate superheated steam at 4 MPa and 400 °C. This steam is further used in cogeneration by the employment of extraction condensing steam turbine. In such type of turbine, the ratio between heat and power can be freely adjusted. Heat is exported in the form of hot water and supplied into the district heating system. The exported electricity is sold to the national electricity grid. The operational hours of the plant are stated as 8000 h/y.
- The amount of biowaste diversion is 5%, which at plant capacity yields approximately 1.45 kt of biowaste per year.
- The processes considered within the system boundaries are of the same nature as given for composting and fermentation.
3. Results
3.1. Composting
3.2. Fermentation
3.3. Incineration with Energy Recovery
3.4. Biowaste Treatment Methods Comparison and Discussion
4. Conclusions
Author Contributions
Funding
Conflicts of Interest
Appendix A

| Component | RES Composition [%] | Fossil-Derived Carbon [kgt−1] | Calorific Value [GJ.t−1] |
|---|---|---|---|
| Metals | 2.68 | 0.0 | 0.0 |
| Glass | 5.12 | 0.0 | 0.0 |
| Paper | 7.78 | 0.0 | 13.0 |
| Composite packaging | 2.99 | 219.0 | 18.0 |
| Plastic | 9.32 | 0.0 | 34.0 |
| Biowaste | 28.92 | 0.0 | 4.6 |
| Textile | 5.72 | 172.0 | 15.0 |
| Mineral waste | 3.32 | 19.0 | 0.0 |
| Hazardous waste | 0.62 | 416.0 | 17.0 |
| Electronic waste | 0.42 | 441.0 | 22.9 |
| Other combustibles | 14.38 | 45.0 | 4.4 |
| Fine fraction (under 40 mm) | 21.73 | 46.0 | 5.1 |
| Total | 100 | 101.3 | 8.46 |
| Power | Heat | ||||
|---|---|---|---|---|---|
| Reference | Share | CO2 Production | Reference | Share | CO2 Production |
| [%] | [kg(CO2)GJ−1 of Produced Power] | [%] | [kg(CO2)/GJ−1 of Produced Heat] | ||
| Coal | 51 | 337 | Coal | 59 | 112 |
| Natural gas | 8 | 187 | Natural gas | 24 | 62 |
| Nuclear | 30 | 0 | Other gases | 4 | 73 |
| Water | 1 | 0 | Renewables | 9 | 0 |
| Solar | 3 | 0 | Heating oil | 4 | 85 |
| Wind | 1 | 0 | |||
| Biomass | 6 | 0 | |||
| Total | 100 | 187 | Total | 88 | |
References
- Directive 2008/98/EC of the European Parliament and of the Council of 19 November 2008 on Waste and Repealing Certain Directives. Available online: https://eur-lex.europa.eu/legal-content/EN/TXT/PDF/?uri=CELEX:32008L0098&from=EN (accessed on 6 February 2019).
- Laso, J.; García-Herrero, I.; Margallo, M.; Bala, A.; Fullana-i-Palmer, P.; Irabien, A.; Aldaco, R. LCA-Based Comparison of Two Organic Fraction Municipal Solid Waste Collection Systems in Historical Centres in Spain. Energies 2019, 12, 1407. [Google Scholar] [CrossRef] [Green Version]
- Vakalis, S.; Moustakas, K. Applications of the 3T Method and the R1 Formula as Efficiency Assessment Tools for Comparing Waste-to-Energy and Landfilling. Energies 2019, 12, 1066. [Google Scholar] [CrossRef] [Green Version]
- Kong, D.; Shan, J.; Iacoboni, M.; Maguin, S.R. Evaluating greenhouse gas impacts of organic waste management options using life cycle assessment. Waste Manag. Res. 2012, 30, 800–812. [Google Scholar] [CrossRef] [PubMed]
- Ardolino, F.; Parrillo, F.; Arena, U. Biowaste-to-biomethane or biowaste-to-energy? An LCA study on anaerobic digestion of organic waste. J. Clean. Prod. 2018, 174, 462–476. [Google Scholar] [CrossRef]
- Laurent, A.; Bakas, I.; Clavreul, J.; Bernstad, A.; Niero, M.; Gentil, E.; Hauschild, M.Z.; Christensen, T.H. Review of LCA studies of solid waste management systems–part I: Lessons learned and perspectives. Waste Manag. 2014, 34, 573–588. [Google Scholar] [CrossRef]
- Arena, U.; Ardolino, F.; Di Gregorio, F. A life cycle assessment of environmental performances of two combustion- and gasification-based waste-to-energy technologies. Waste Manag. 2015, 41, 60–74. [Google Scholar] [CrossRef]
- Dong, J.; Tang, Y.; Nzihou, A.; Chi, Y.; Weiss-Hortala, E.; Ni, M.; Zhou, Z. Comparison of waste-to-energy technologies of gasification and incineration using life cycle assessment: Case studies in Finland, France and China. J. Clean. Prod. 2018, 203, 287–300. [Google Scholar] [CrossRef]
- Güereca, L.P.; Gassó, S.; Baldasano, J.M.; Jiménez-Guerrero, P. Life cycle assessment of two biowaste management systems for Barcelona, Spain. Resour. Conserv. Recycl. 2006, 49, 32–48. [Google Scholar] [CrossRef]
- Pubule, J.; Blumberga, A.; Romagnoli, A.; Blumberga, D. Finding an optimal solution for biowaste management in the Baltic States. J. Clean. Prod. 2015, 88, 214–223. [Google Scholar] [CrossRef]
- Thomsen, M.; Seghetta, M.; Mikkelsen, M.H.; Gyldenkærne, S.; Becker, T.; Caro, D.; Frederiksen, P. Comparative life cycle assessment of biowaste to resource management systems—A Danish case study. J. Clean. Prod. 2017, 142, 4050–4058. [Google Scholar] [CrossRef]
- Di Maria, F.; Sisani, F.; Contini, S. Are EU waste-to-energy technologies effective for exploiting the energy in bio-waste? Appl. Energ. 2018, 230, 1557–1572. [Google Scholar] [CrossRef]
- Zhou, Z.; Tang, Y.; Chi, Y.; Ni, M.; Buekens, A. Waste-to-energy: A review of life cycle assessment and its extension methods. Waste Manag. Res. 2018, 36, 3–16. [Google Scholar] [CrossRef]
- Mehta, Y.D.; Shastri, Y.; Joseph, B. Economic analysis and life cycle impact assessment of municipal solid waste (MSW) disposal: A case study of Mumbai, India. Waste Manag. Res. 2018, 36, 1177–1189. [Google Scholar] [CrossRef] [PubMed]
- Martinez-Sanchez, V.; Hulgaard, T.; Hindsgaul, C.; Riber, C.; Kamuk, B.; Astrup, T.F. Estimation of marginal costs at existing waste treatment facilities. Waste Manag. 2016, 50, 364–375. [Google Scholar] [CrossRef] [Green Version]
- Xin-gang, Z.; Gui-wu, J.; Ang, L.; Yun, L. Technology, cost, a performance of waste-to-energy incineration industry in China. Renew. Sust. Energ. Rev. 2016, 55, 115–130. [Google Scholar] [CrossRef]
- Ferdan, T.; Pavlas, M.; Nevrlý, V.; Šomplák, R. Greenhouse Gas Emissions from Thermal Treatment of Non-Recyclable Municipal Waste. Front. Chem. Sci. Eng. 2018, 12, 815–831. [Google Scholar] [CrossRef]
- Schwarzböck, T.; Rechberger, H.; Cencic, O.; Fellner, J. Determining national greenhouse gas emissions from waste-to-energy using the Balance Method. Waste Manag. 2016, 49, 263–271. [Google Scholar] [CrossRef]
- Bing, X.; Bloemhof, J.M.; Ramos, T.R.P.; Barbosa-Povoa, A.P.; Wong, C.Y.; Van Der Vorst, J.G.A.J. Research challenges in municipal solid waste logistics management. Waste Manag. 2016, 48, 584–592. [Google Scholar] [CrossRef]
- Šomplák, R.; Smejkalová, V.; Nevrlý, V.; Pluskal, J.; Pavlas, M. Implementation of Circular Economy through the Mathematical Programming for the Complex System Evaluation. Chem. Eng. Trans. 2019, 76, 523–528. [Google Scholar] [CrossRef]
- Jensen, M.B.; Møller, J.; Scheutz, C. Comparison of the organic waste management systems in the Danish-German border region using life cycle assessment (LCA). Waste Manag. 2016, 49, 491–504. [Google Scholar] [CrossRef] [PubMed]
- Reyes-Torres, M.; Oviedo-Ocaña, E.R.; Dominguez, I.; Komilis, D.; Sánchez, A. A systematic review on the composting of green waste: Feedstock quality and optimization strategies. Waste Manag. 2018, 77, 486–499. [Google Scholar] [CrossRef] [PubMed]
- Epstein, E. Industrial Composting: Environmental Engineering and Facilities Management; CRC Press, Tailor & Francis Group: Abingdon, UK, 2011. [Google Scholar]
- Fan, Y.V.; Klemeš, J.J.; Lee, C.T.; Perry, S. Anaerobic digestion of municipal solid waste: Energy and carbon emission footprint. J. Environ. Manage. 2018, 223, 888–897. [Google Scholar] [CrossRef] [PubMed]
- Ecoinvent. Dataset: Municipal Waste Collection Service by 21 Metric Ton Lorry (CH). Information/Dataset from Ecoinvent Database v3.4. 2017. Available online: https://www.ecoinvent.org (accessed on 23 November 2017).
- Ecoinvent. Dataset: Transport, Freight, Lorry >32 Metric Ton, EURO5 (RER). Information/Dataset from Ecoinvent Database v3.4. 2017. Available online: https://www.ecoinvent.org (accessed on 23 November 2017).
- Report on the Production and Management of Municipal Solid Waste. Edizione 2016; Rapporti 251/2016; ISPRA: Ispra, Italy, 2016; ISBN 978-88-448-0791-7.
- Pavlas, M.; Šomplák, R.; Smejkalová, V.; Stehlík, P. Municipal solid waste fractions and their source separation—Forecasting for large geographical area and its subregions. Waste Biomass Valor. 2020, 11, 725–742. [Google Scholar] [CrossRef]
- Möller, B.; Wiechers, E.; Persson, U.; Grundahl, L.; Connolly, D. Heat Roadmap Europe: Identifying local heat demand and supply areas with a European thermal atlas. Energy 2018, 158, 281–292. [Google Scholar] [CrossRef]
- Halkos, G.; Petrou, K.N. Analysing the Energy Efficiency of EU Member States: The Potential of Energy Recovery from Waste in the Circular Economy. Energies 2019, 12, 3718. [Google Scholar] [CrossRef] [Green Version]
- Bisinella, V.; Götze, R.; Conradsen, K.; Damgaard, A.; Christensen, T.H.; Astrup, T.F. Importance of waste composition for Life Cycle Assessment of waste management solutions. J. Clean. Prod. 2017, 164, 1180–1191. [Google Scholar] [CrossRef] [Green Version]
- Slivka, V. Study on the State of the Heating Industry; VŠB-Technical University of Ostrava: Ostrava, Czech Republic, 2011. [Google Scholar]


| Source | GWP Impact | 100% Heat Prod. in CHP GWP [kt(CO2)eq.y−1] | 0% Heat Prod. in CHP GWP [kt(CO2)eq.y−1] | ||
|---|---|---|---|---|---|
| Before | After | Before | After | ||
| GHG from waste incineration | burden | 37.140 | 37.140 | 37.140 | 37.140 |
| Heat export | Credit | −49.570 | −49.192 | 0.000 | 0.000 |
| Electricity export | Credit | −6.671 | −6.656 | −26.584 | −26.418 |
| Net result | overall | −19.101 | −18.708 | 10.556 | 10.723 |
© 2020 by the authors. Licensee MDPI, Basel, Switzerland. This article is an open access article distributed under the terms and conditions of the Creative Commons Attribution (CC BY) license (http://creativecommons.org/licenses/by/4.0/).
Share and Cite
Pavlas, M.; Dvořáček, J.; Pitschke, T.; Peche, R. Biowaste Treatment and Waste-To-Energy—Environmental Benefits. Energies 2020, 13, 1994. https://doi.org/10.3390/en13081994
Pavlas M, Dvořáček J, Pitschke T, Peche R. Biowaste Treatment and Waste-To-Energy—Environmental Benefits. Energies. 2020; 13(8):1994. https://doi.org/10.3390/en13081994
Chicago/Turabian StylePavlas, Martin, Jan Dvořáček, Thorsten Pitschke, and René Peche. 2020. "Biowaste Treatment and Waste-To-Energy—Environmental Benefits" Energies 13, no. 8: 1994. https://doi.org/10.3390/en13081994