Article

An Accurate Time Constant Parameter Determination Method for the Varying Condition Equivalent Circuit Model of Lithium Batteries

1
School of Information Engineering, Southwest University of Science and Technology, Mianyang 621010, China
2
School of Mechanical and Electrical Engineering, Mianyang Teachers’College, Mianyang 621000, China
3
Department of Energy Technology, Aalborg University, Pontoppidanstraede 111, 9220 Aalborg East, Denmark
4
School of Pharmacy and Life Sciences, Robert Gordon University, Aberdeen AB10-7GJ, UK
*
Author to whom correspondence should be addressed.
Energies 2020, 13(8), 2057; https://doi.org/10.3390/en13082057
Submission received: 18 February 2020 / Revised: 6 April 2020 / Accepted: 15 April 2020 / Published: 20 April 2020
(This article belongs to the Section D: Energy Storage and Application)

Abstract

:
An accurate estimation of the state of charge for lithium battery depends on an accurate identification of the battery model parameters. In order to identify the polarization resistance and polarization capacitance in a Thevenin equivalent circuit model of lithium battery, the discharge and shelved states of a Thevenin circuit model were analyzed in this paper, together with the basic reasons for the difference in the resistance capacitance time constant and the accurate characterization of the resistance capacitance time constant in detail. The exact mathematical expression of the working characteristics of the circuit in two states were deduced thereafter. Moreover, based on the data of various working conditions, the parameters of the Thevenin circuit model through hybrid pulse power characterization experiment was identified, the simulation model was built, and a performance analysis was carried out. The experiments showed that the accuracy of the Thevenin circuit model can become 99.14% higher under dynamic test conditions and the new identification method that is based on the resistance capacitance time constant. This verifies that this method is highly accurate in the parameter identification of a lithium battery model.

1. Introduction

The microscopic physical parameters of lithium batteries are difficult measure directly by sensors or measurement techniques [1,2,3]. Parameter identification in equivalent models of lithium battery is an important issue in battery management [4,5,6,7]. The battery model can be divided into an electrochemical model [8], black box model and equivalent circuit model in terms of its different building mechanisms [9,10,11,12]. The electrochemical model is based on the analysis of chemical reactions inside the battery, and the partial differential equation is established to describe the electrodes and electrolyte dynamics [13,14]. It is suitable for optimum design and the safety analysis of the battery [15,16,17]. The black-box model is a linear or non-linear function that can describe the response characteristics of voltage of batteries [18,19,20,21]. However, it usually needs a data-driven algorithm as support, including the neural network method, support vector regression method, and genetic particle filter method [22,23,24]. The black-box model can establish the model structure and parameter optimization flexibly, but it lacks the significance of physics [25,26,27]. The equivalent circuit model consists of capacitors and resistors to simulate the dynamic voltage response characteristics of batteries [28,29,30]. The relationship between the parameters in this model is direct and obvious [31] and there are fewer model parameters, which makes the mathematical description of state space easier [32,33]. Therefore, it is widely used in system simulation and practical engineering [34].
The commonly used equivalent circuit models are the Rint model, Thevenin model, RC model, The Partnership for a New Generation of Vehicles (PNGV) model and the General Non-Linear (GNL) model. In these models [35,36,37], Thevenin model is often chosen as a battery model in battery State of Charge (SOC) estimations because of its simple circuit structure and moderate difficulty in parameter identification [38]. In the process of identifying the Thevenin model parameters, the Thevenin model generally uses a first-order or second-order structure, and rarely uses a high-order structure [39]. This is because the increase in order has little contribution to improving the accuracy of the model, and it also increases the difficulty of parameter identification [40]. In order to get accurate model parameters, it is necessary to study the influence of working current, SOC and temperature on the model parameters, as well as the identification method of model parameters.
In reference [41], a first-order equivalent circuit model of Thevenin based on self-healing characteristics is proposed and verified on the experimental platform. In reference [42], the parameter identification method of the second-order Thevenin model with different discharge rate is studied. At a low discharge and charge rate (below 0.5 C), the parameter identification method of the valve regulated lead–acid (VRLA) and the LiFePO4 (LFP) battery model is used in reference [40]. The Thevenin model with a self-discharge effect is proposed in reference [43], and its parameters are identified within the SOC range of 20%–80%. In reference [44], the application of charge–discharge cycling electrochemical impedance spectroscopy in model parameter identification was proposed. In this paper, based on the first-order Thevenin model, the load resistance is introduced. The influence of load resistance on the RC time constant of a Thevenin model in the process of discharge and shelving is analyzed in detail. At the same time, the dynamic equation and identification method of each parameter of the model are given with accuracy. The model parameters are identified by hybrid pulse power characterization (HPPC) experiments, and the accuracy of the identification method is verified by simulation.

2. Mathematical Analysis

2.1. Dynamic Thevenin Mode

Considering the demands of engineering application, the dynamic characteristics of a lithium battery should be characterized by uncomplicated equivalent model [45,46], so the Thevenin model of lithium battery equivalent circuit model is selected in this paper. The Thevenin model is composed of a resistance capacitance (RC) circuit in series with ohm internal resistance [47,48,49]. Its basic idea is to use ohm internal resistance to characterize the instantaneous change in terminal voltage in the charging and discharging process [50,51,52], and an RC parallel circuit to characterize the polarization effect of the battery in the using process [53,54]. This model can accurately characterize the dynamic characteristics of lithium battery in the working process. A description of the model is shown in Figure 1a.
In Figure 1a, UOC represents the open circuit voltage of the battery, and R0 represents the ohmic internal resistance of the battery, it can characterize the change in voltage response at the moment of battery charging and discharging. R1 and C1 represent the polarization resistance and polarization capacitance inside the battery, respectively. The circuit formed by R1 and C1 can reflect the gradual change in battery voltage during and after charging and discharging.
We will then discuss the different working states of the circuit when switches K1 and K2 are closed and opened at the same time. In Figure 1b, we specify the discharge direction as the reference positive direction of the circuit.
When switches K1 and K2 are not closed, the circuit is in the initial state. The capacitor in the circuit has no electric energy and the voltage on the capacitor is zero. When switches K1 and K2 are closed, the battery will work with load and start discharging. Equation (1) can be obtained according to
U 2 = U O C U C R 0 × i
In Equation (1), i is the discharge current, UC is the voltage at both ends of polarization capacitor C1, R2 is the load resistance, and U2 is the load resistance voltage. For polarization capacitor C1, when switches K1 and K2 are closed, it is the zero-state response, as expressed in Equation (2).
U C = i × R 1 ( 1 e t τ 1 )
In Equation (2)
τ 1 = R e q 1 × C 1
by connecting R0 and R2 in series and R1 in parallel. Its evaluation expression is Equation (4).
R e q 1 = ( R 0 + R 2 ) × R 1 ( R 0 + R 2 ) + R 1
When switches K1 and K2 are closed for t1 s, they are turned on again. At this time, for capacitor C1, it is a zero-input response. The circuit diagram is shown in Figure 2b. At this point, the voltage on the capacitor is shown as expressed in Equation (5).
U c = U c 0 e t τ 2
In Equation (5)
τ 2 = R e q 2 × C 1
As can be seen from Figure 2b, Req2 is resistance R1.
Since the voltage on the capacitor cannot be abruptly changed, when the switch is changed from the closed state to the open state, Uc0 is the value of the capacitor at the time t1 before the switch is opened. Its expression is as shown in Equation (7).
{ R e q 2 = R 1 U C 0 = i × R 1 ( 1 e t 1 τ 1 )
From the theoretical analysis above, the following two conclusions can be obtained.
First, when Thevenin equivalent circuit model works in discharge state and shelved state, the RC time constants in the shelved state and discharge state are different due to the unequal equivalent resistance. The RC time constant τ 2 of shelved state is larger than that of discharge state τ 1 .
The second point is that when the switches K1 and K2 are closed and opened, the expression of Thevenin’s equivalent circuit model is a piecewise function, and the function expression is in Equation (8).
{ U 2 = U O C i × R 0 i × R 1 ( 1 e t τ 1 )                   0 t t 1 U 2 = U O C i × R 1 ( 1 e t 1 τ 1 ) e t τ 2                          t 1 t < t 2
In Equation (8), 0 to t1 indicate the switch closing time; t1 to t2 indicate the time when the switch is turned on.

2.2. Parameter Identification

According to the American freedom vehicle battery experiment manual [55], the HPPC experiment is conducted on lithium batteries at 10 points when SOC equals 0.1 to 1.0. The discharge rates of lithium batteries are all set at 1C. In the single-cycle step, 10 s of constant current discharge, 40 s shelved and 10 s constant current charge are arranged in turn, and the interval between 10 SOC points is 40 min. Figure 3 shows the current pulse curve and the corresponding voltage change curve in the HPPC experiment.
From the voltage response curve of HPPC experimental battery, the characteristics of each SOC point can be obtained as follows.
The voltage of the battery terminal of t1-t2 drops instantaneously. This is because the battery discharge current increases abruptly from 0 to 1C, resulting in a sudden change in voltage on the ohmic internal resistance. The terminal voltage of the t2-t3 battery decreases slowly during the process of discharging the current charging polarization capacitor, which is caused by the zero-state response of the RC loop. The terminal voltage of t3-t4 battery rises instantaneously, which is caused by the sudden change in the discharge current to 0 and the disappearance of voltage on ohmic internal resistance. During the t4-t5 period, the slow rise in battery terminal voltage is the process of polarization resistance discharging by the polarization capacitor, which is caused by the zero-input response of the RC circuit. t5 time is the charging phase of the battery. There is a phase of sudden voltage increase and a phase of slow voltage increase during the charging. According to the above characteristics, the following methods can be used to identify the parameters of the Thevenin equivalent model.

2.2.1. Open Circuit Voltage Identification

The open circuit voltage UOC is the voltage that keeps the battery stable at both positive and negative terminals when the battery is left for a long time. The experiments show that the terminal voltage of the battery after standing for 1 h is basically equal to the open circuit voltage of the battery. Therefore, the battery is discharged at a 1C constant current for 6 min and then shelved for 1 h. At this time, the voltage at both ends of the battery can be considered as the open circuit voltage of the battery under SOC state;

2.2.2. Identification of R0, R1, C1

This curve of t2-t3 is a zero-state response curve, as expressed in Equation (9)
U 2 = U O C i × R 0 i × R 1 ( 1 e t τ 1 )  
Simplify Equation (9) to Equation (10)
y = a b c ( 1 e x d )
The curve from t4-t5 is a zero-input response curve, as expressed in Equation (11)
U 2 = U O C i × R 1 ( 1 e 10 τ 1 ) e t τ 2
Simplify Equation (11) to Equation (12)
y = a g × e x h
In Equations (8)–(12), y represents the terminal voltage U2, and x represents the time t; the six parameters a, b, c, d, h, and g correspond to UOC, i × R 0 , i × R 1 , τ 1 , τ 2 and i × R 1 ( 1 e 10 τ 1 ) , respectively.
According to the identified open-circuit voltage UOC and load current i measured by the current sensor, R0, R1, and i can be identified by using cftool toolbox in MATLAB. When the time constant τ 2 is obtained, C1 can be obtained by using C 1 = τ 2 / R 1 .

3. Experimental Design

In order to get the parameters of the Thevenin equivalent model, HPPC experiments were carried out. At the same time, the open-circuit voltage was measured for lithium batteries under different SOC conditions, then the variation rule of the parameters of the model with the working state was obtained through experimental analysis and calculation.
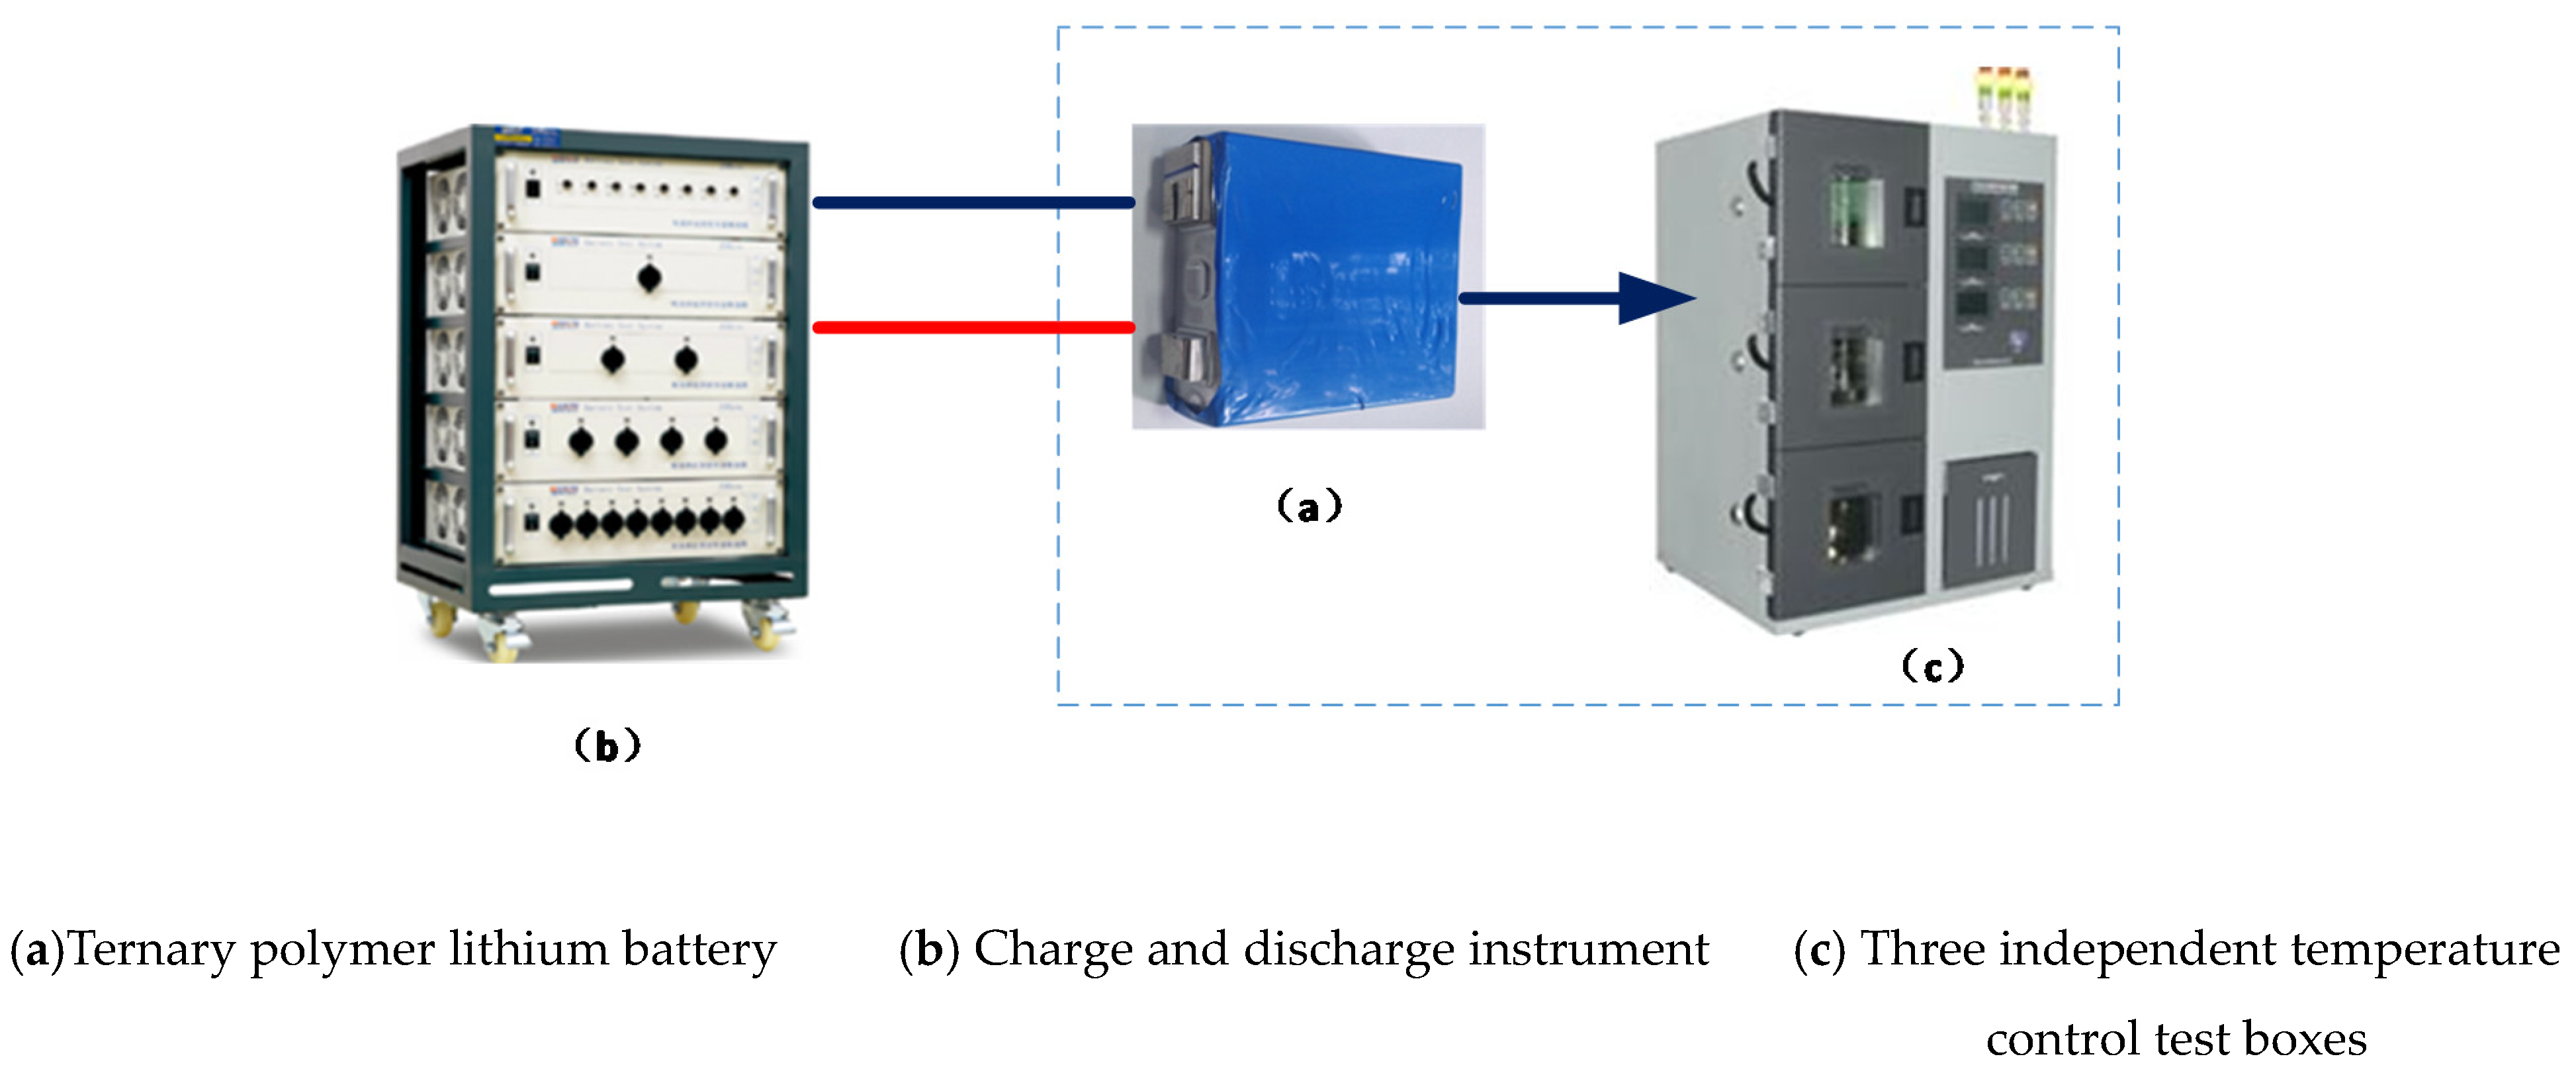
The experimental object used was a lithium ternary polymer battery, and its appearance is shown in Figure 4a. The battery has a nominal capacity of 40 Ah and an actual capacity of 39.37 Ah. The instruments used in the experiment included a charge and discharge instrument and a three-layer independent temperature control experiment box. Their appearance is shown in Figure 4b,c. In order to avoid the influence of temperature change on model parameters, the experiment was carried out at 25 °C. A constant temperature of 25 °C will be maintained by a temperature-controlled test chamber.
The HPPC experiment is to stimulate the battery with continuous discharge pulses, then acquire the battery parameters by experimental data. This experiment added two discharge experimental points to the base of the standard HPPC experiment. The two points were SOC, equal to 0.95 and 0.05, respectively. The complete HPPC experimental steps are as follows.
  • The lithium batteries were discharged by IC, and then the batteries were shelved for 2 h after discharging. The batteries were charged to SOC 100% by constant current and voltage;
  • Let the battery stand for 10 h, then measure and record the open circuit voltage of the battery;
  • Discharge at 1C for 3 min, then shelve it for 40 min;
  • Steps 3 and 4 were performed at four points where the SOC equaled 1, 0.95, 0.1, and 0.05, respectively;
  • A current pulse experiment was performed on a lithium battery. First, it was discharged at 1C for 10 s, then shelved for 40 s, charged at 1C for 10 s thereafter, then shelved for 40 s;
  • The battery was discharged at 1C for 6 min, then left to stand for 40 min;
  • Steps 6 and 7 were performed at eight points where the SOC was equal to 0.9, 0.8, 0.7...0.3, and 0.2, respectively.
Discharge experiments of lithium batteries were carried out according to the above experimental steps. The current and voltage during the experiment were shown in Figure 5.
With the HPPC experimental data, the corresponding relationship between different SOC points and various parameters can be drawn when the Thevenin equivalent model is at 25 °C, as shown in Table 1.
From the identified parameters, it can be seen that when the Thevenin equivalent circuit model works in discharge and shelf state, τ 2 is larger than τ 1 . When SOC is 0.05 and 0.1 respectively, the ohmic internal resistance, polarization resistance and polarization capacitance of the battery will change rapidly, but they are relatively stable in other discharge stages. With SOC as the independent variable and each parameter in Table 1 as the dependent variable, we can obtain fitting Equations (13)–(16), where R0, R1, C1 and UOC vary with SOC through polynomial fitting.
R 0 = 0.04868 × S O C 7 + 0.2129 × S O C 6 0.3831 × S O C 5 + 0.3659 × S O C 4 0.1996 × S O C 3 + 0.06241 × S O C 2 0.01078 × S O C + 0.002851
R 1 = 0.2345 × S O C 8 1.438 × S O C 7 + 3.497 × S O C 6 4.409 × S O C 5 + 3.135 × S O C 4 1.277 × S O C 3 + 0.2909 × S O C 2 0.03471 × S O C + 0.002402
C 1 = 1.139 × 10 7 × S O C 8 4.641 × 10 7 × S O C 7 + 7.585 × 10 7 × S O C 6 6.355 × 10 7 × S O C 5 + 2.875 × 10 7 × S O C 4 6.515 × 10 6 × S O C 3 + 3.539 × 10 5 × S O C 2 + 1.356 × 10 5 × S O C 107.2
U O C = 5.062 × S O C 5 15.72 × S O C 4 + 18.57 × S O C 3 9.559 × S O C 2 + 2.508 × S O C + 3.333

4. Model Verification

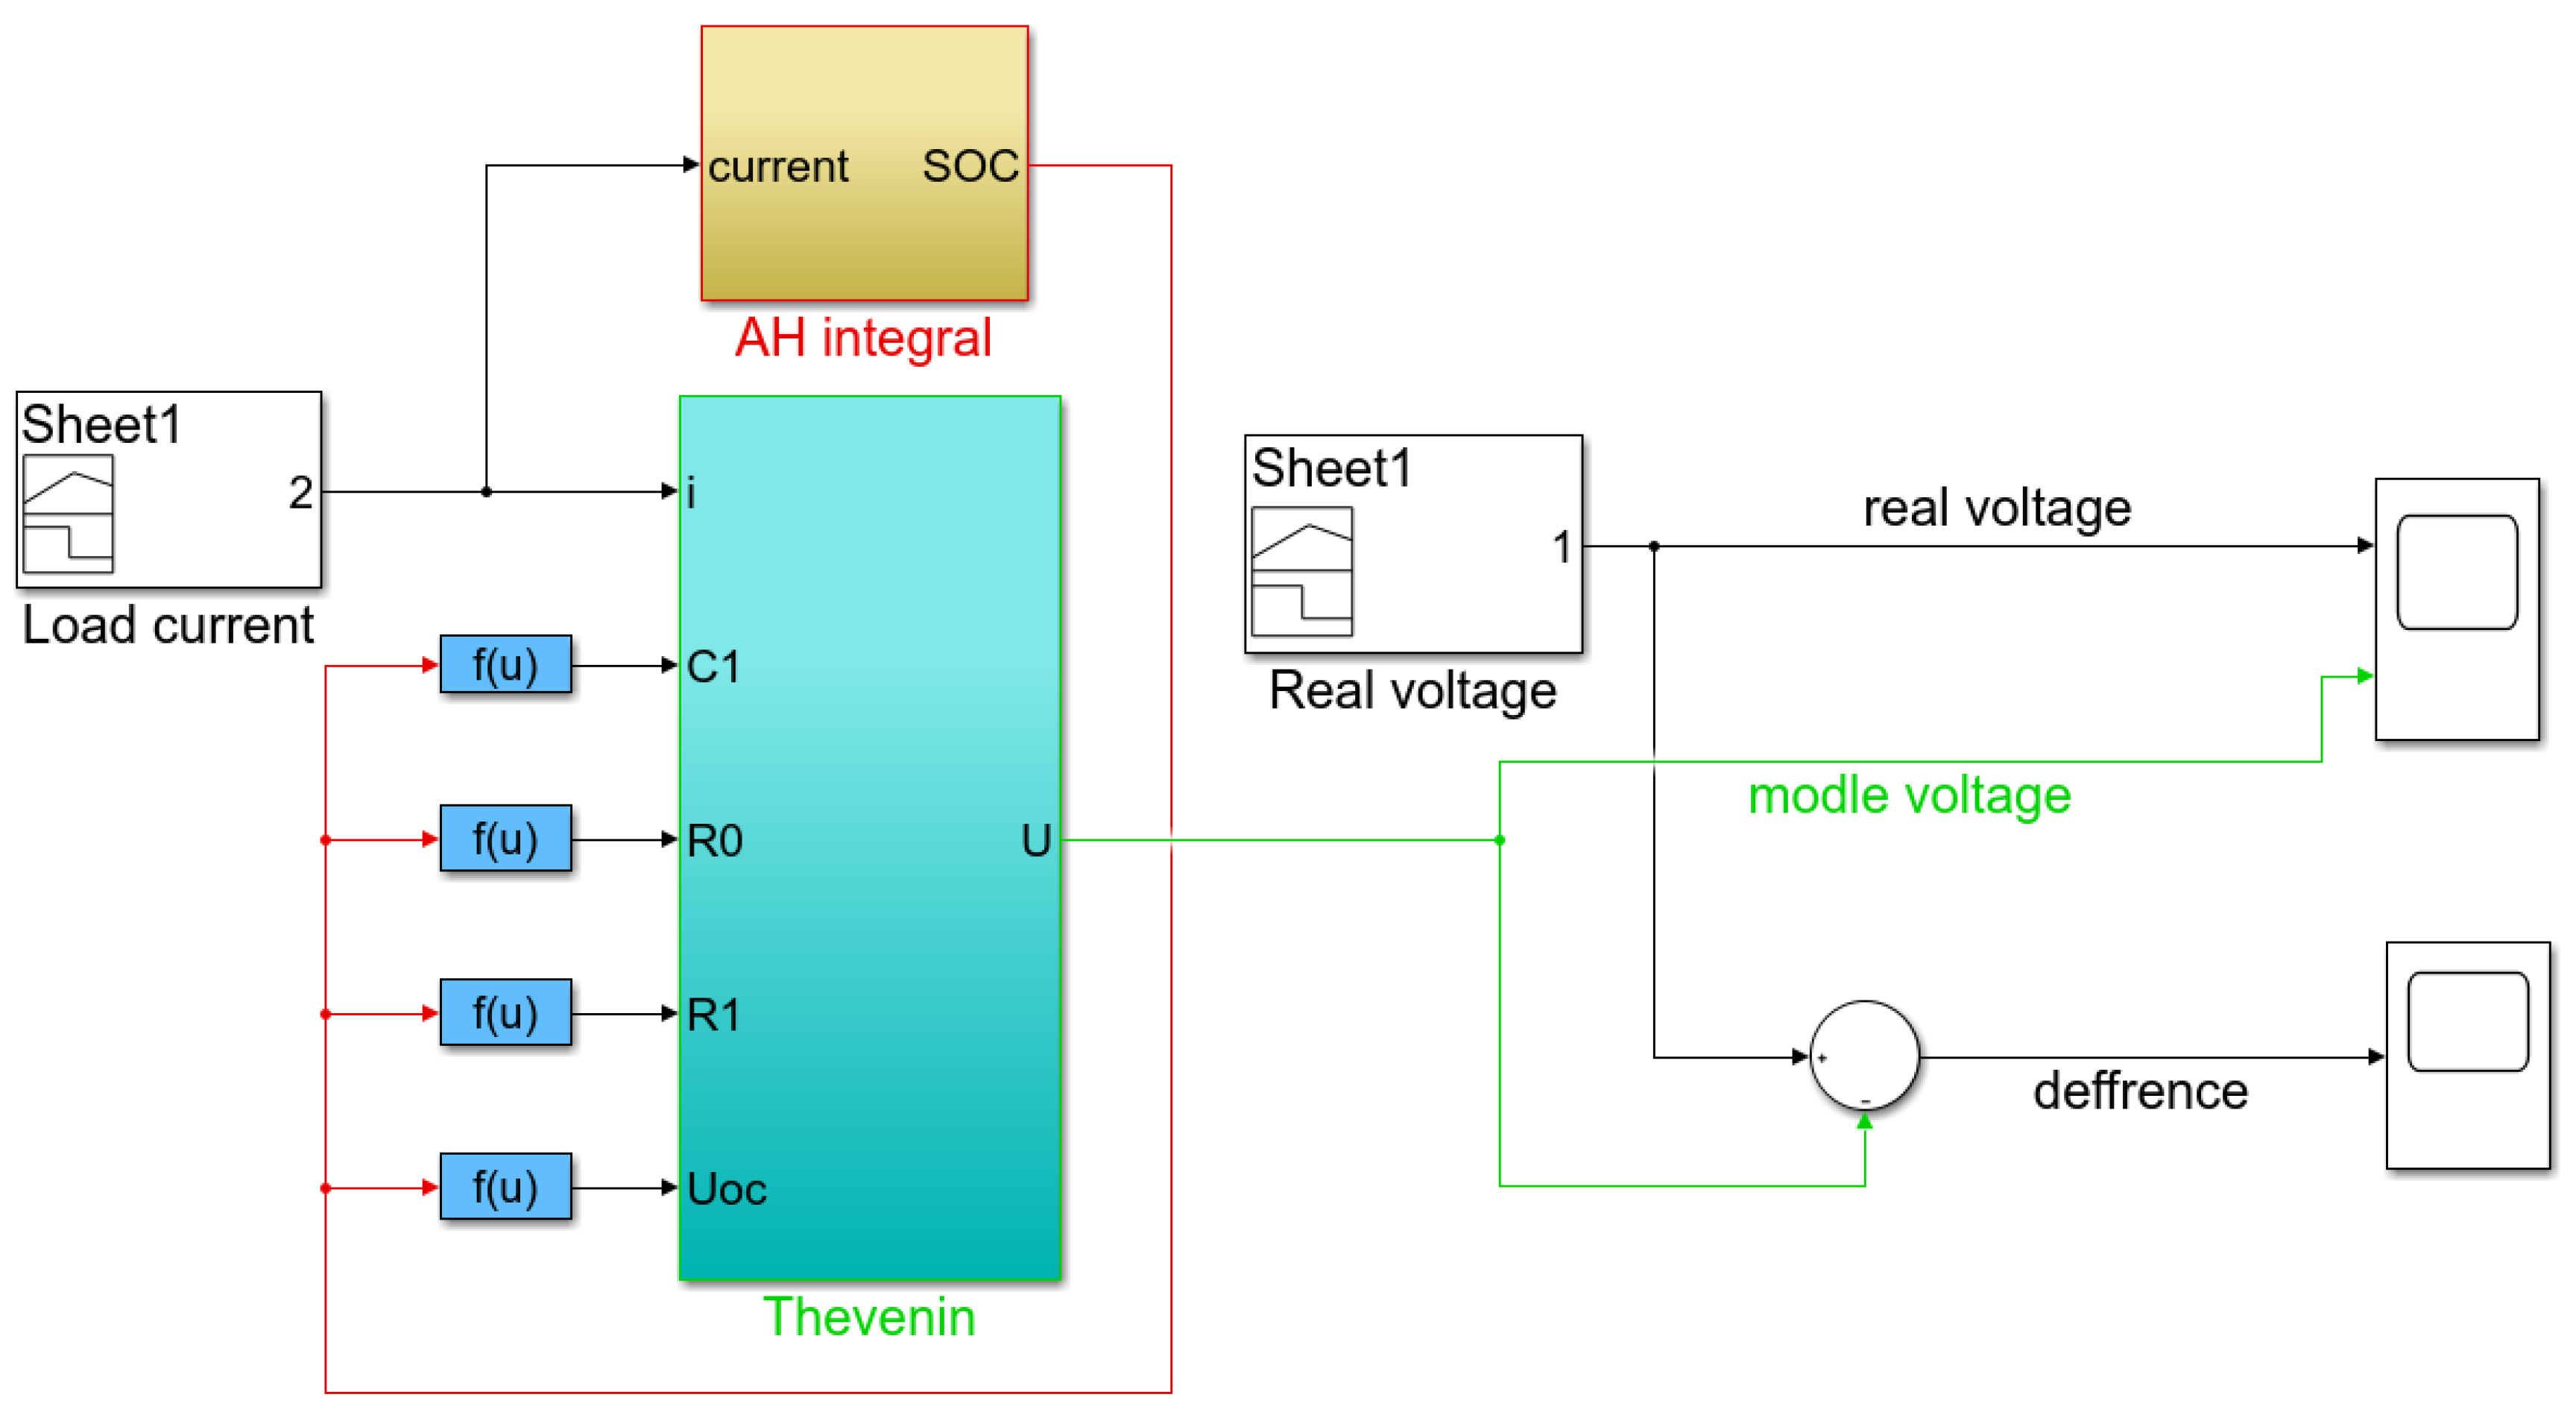
After identifying the parameters of the model, the dynamic simulation model of the Thevenin equivalent circuit was constructed in Simulink. The identified parameters were put into the simulation model, then different working currents were input, the output voltage response of the model was compared with the actual voltage data, and the model was verified. The built model validates the Simulink simulation structure, as shown in Figure 6.
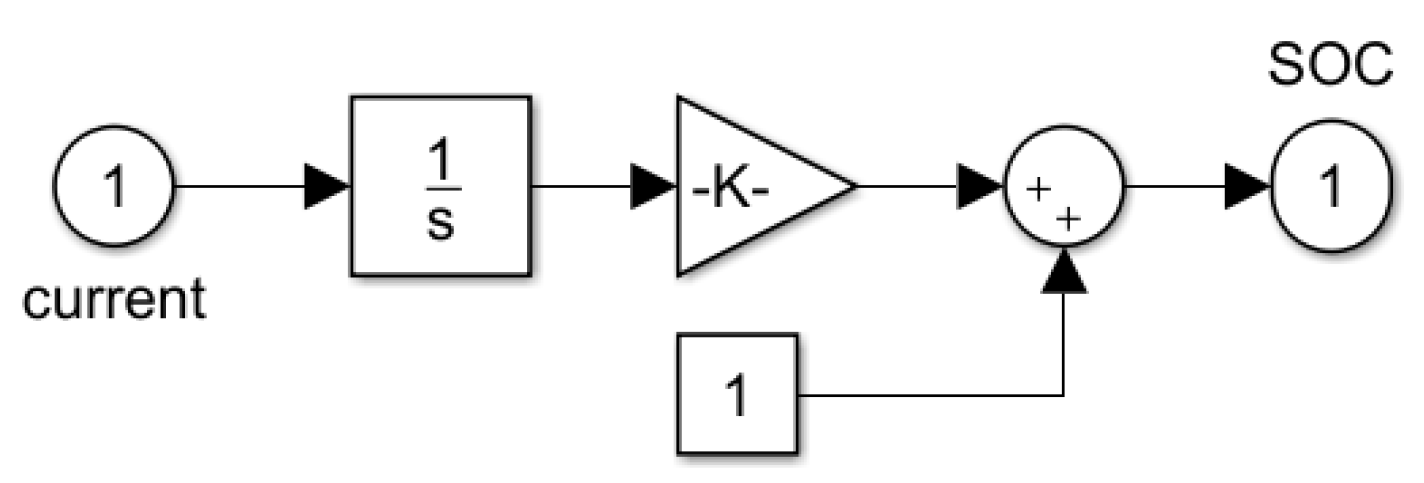
To calculate SOC with discharge current, the method of the ampere-hour (AH) integral is applied. Its internal structure is shown in Figure 7.
The internal structure of Thevenin’s equivalent circuit model is shown in Figure 8, where each circuit component is a controllable parameter that changes over time. The model has five inputs and one output. The inputs are i, R0, R1, C1 and UOC, and the output is the terminal voltage U. This model can simulate the working condition of the lithium battery.
In order to evaluate the accuracy of the model parameters, the variable operating current is added to the model and the difference between the model output voltage and the time output voltage is compared. The variable operating current is shown in Figure 9.
As shown in Figure 10, the blue curve is the output voltage of the model, and the red curve is the actual output voltage of the battery. It can be seen that the output voltage of the model is in good agreement with the actual value, which indicates the feasibility and reliability of the parameter identification method.
The difference between the output voltage of the model and the actual output voltage of the battery is defined as the model error. Model accuracy is defined as the percentage of model error to the actual output voltage of the battery. From the curve error in Figure 11, it can be seen that the maximum error of the output voltage of the model is 0.0361 and 0.0326 V, respectively. The model accuracy is 99.14% and 99.22% when the maximum voltage of the lithium battery is 4.2 V.

5. Conclusions

The accurate identification of parameters of lithium battery model is an important part of the SOC estimation of lithium battery. In this paper, the classical Thevenin equivalent circuit model is selected to identify the parameters. Through detailed circuit analysis, the accurate expressions of the RC time constant and terminal voltage of lithium batteries are derived. After HPPC experiments that identify the parameters accurately, the Simulink model is established in MATLAB, and the model is verified by simulation with HPPC experimental data. The parameter identification method adopted in this paper can make the accuracy of the Thevenin model reach more than 99.14%. The parameter identification achieved good results. The research content of this paper can provide an accurate identification method for the parameter identification of a lithium battery mathematical model, and it is also an important theoretical basis for the accurate estimation of SOC in a battery management system.

Author Contributions

Conceptualization, S.W. and C.F.; Data curation, C.Y.; Formal analysis, D.-I.S.; Writing—original draft, L.Z.; Writing—review and editing, C.Z. All authors have read and agreed to the published version of the manuscript.

Funding

National Natural Science Foundation of China (No. 61801407 and No. 61671393).

Acknowledgments

The work was supported by the National Natural Science Foundation of China (No. 61801407 and No. 61671393).

Conflicts of Interest

The authors declare that there are no conflicts of interest regarding the publication of this paper.

References

  1. Sergi, F.; Arista, A.; Agnello, G.; Ferraro, M.; Andaloro, L.; Antonucci, V. Characterization and comparison between lithium iron p hosphate and lithium-polymers batteries. J. Energy Storage 2016, 8, 235–243. [Google Scholar] [CrossRef]
  2. Yang, D.; Wang, Y.; Pan, R.; Chen, R.; Chen, Z. State-of-health estimation for the lithium-ion battery based on support vector regression. Appl. Energy 2018, 227, 273–283. [Google Scholar] [CrossRef]
  3. Shen, Y.Q. Adaptive extended Kalman filter based state of charge determination for lithium-ion batteries. Electrochim. Acta 2018, 283, 1432–1440. [Google Scholar] [CrossRef]
  4. Andaloro, L.; Arista, A.; Agnello, G.; Napoli, G.; Sergi, F.; Antonucci, V. Study and design of a hybrid electric vehicle (Lithium Batteries-PEM FC). Int. J. Hydrog. Energy 2017, 42, 3166–3184. [Google Scholar] [CrossRef]
  5. Hidalgo-Reyes, J.I.; Gómez-Aguilar, J.F.; Escobar-Jiménez, R.F.; Alvarado-Martínez, V.M.; López-López, M.G. Classical and fractional-order modeling of equivalent electrical circuits for supercapacitors and batteries, energy management strategies for hybrid systems and methods for the state of charge estimation: A state of the art review. Microelectron. J. 2019, 85, 109–128. [Google Scholar] [CrossRef]
  6. Dong, G.Z.; Chen, Z.H.; Wei, J.W. Sequential monte carlo filter for state-of-charge estimation of lithium-ion batteries based on auto regressive exogenous model. IEEE Trans. Ind. Electron. 2019, 66, 8533–8544. [Google Scholar] [CrossRef]
  7. Lee, J.; Kwon, D.; Pecht, M.G. Reduction of li-ion battery qualification time based on prognostics and health management. IEEE Trans. Ind. Electron. 2019, 66, 7310–7315. [Google Scholar] [CrossRef]
  8. De Lorenzo, G.; Andaloro, L.; Sergi, F.; Napoli, G.; Ferraro, M.; Antonucci, V. Numerical simulation model for the preliminary design of hybrid electric city bus power train with polymer electrolyte fuel cell. Int. J. Hydrog. Energy 2014, 39, 12934–12947. [Google Scholar] [CrossRef]
  9. Wang, J.L.; Zhang, L.; Xu, D.; Zhang, P.; Zhang, G. A simplified fractional order equivalent circuit model and adaptive online parameter identification method for lithium-ion batteries. Math. Probl. Eng. 2019, 12, e0172424. [Google Scholar] [CrossRef]
  10. Liu, D.T.; Li, L.; Song, Y.; Wu, L.; Peng, Y. Hybrid state of charge estimation for lithium-ion battery under dynamic operating conditions. Int. J. Electr. Power Energy Syst. 2019, 110, 48–61. [Google Scholar] [CrossRef]
  11. Liu, M.Z.; He, M.; Qiao, S.; Liu, B.; Cao, Z.; Wang, R. A high-order state-of-charge estimation model by cubature particle filter. Measurement 2019, 146, 35–42. [Google Scholar] [CrossRef]
  12. Zhou, D.M.; Al-Durra, A.; Zhang, K.; Ravey, A.; Gao, F. A robust prognostic indicator for renewable energy technologies: A novel error correction grey prediction model. IEEE Trans. Ind. Electron. 2019, 66, 9312–9325. [Google Scholar] [CrossRef]
  13. Barcellona, S.; Piegari, L. Lithium ion battery models and parameter identification techniques. Energies 2017, 10, 2007. [Google Scholar] [CrossRef] [Green Version]
  14. Fragiacomo, P.; Astorino, E.; Chippari, G.; De Lorenzo, G.; Czarnetzki, W.T.; Schneider, W. Dynamic modeling of a hybrid electric system based on an anion exchange membrane fuel cell. Cogent Eng. 2017, 4, 1357891. [Google Scholar] [CrossRef]
  15. Xu, L.P.; Zhou, F.; Kong, J.; Zhou, H.; Zhang, Q. Effect of testing temperature on the electrochemical properties of Li(Ni0.6Mn0.2Co0.2)O-2 and its Ti3C2(OH)(2) modification as cathode materials for lithium-ion batteries. J. Alloy. Compd. 2019, 804, 353–363. [Google Scholar] [CrossRef]
  16. Yoo, K.; Kim, J. Thermal behavior of full-scale battery pack based on comprehensive heat-generation model. J. Power Sources 2019, 433, 226715. [Google Scholar] [CrossRef]
  17. Alessandrini, S.; Rizzuto, E.; Del Prete, Z. Characterizing different types of lithium ion cells with an automated measurement system. J. Energy Storage 2016, 7, 244–251. [Google Scholar] [CrossRef]
  18. Xu, Z.; Gao, S.B.; Yang, S.F. LiFePO4 battery state of charge estimation based on the improved Thevenin equivalent circuit model and Kalman filtering. J. Renew. Sustain. Energy 2016, 8, 024103. [Google Scholar] [CrossRef]
  19. Dai, H.D.; Zhao, G.; Lin, M.; Wu, J.; Zheng, G. A novel estimation method for the state of health of lithium-ion battery using prior knowledge-based neural network and markov chain. IEEE Trans. Ind. Electron. 2019, 66, 7706–7716. [Google Scholar] [CrossRef]
  20. Ma, C.; Zhai, X.; Wang, Z.; Tian, M.; Yu, Q.; Liu, L.; Liu, H.; Wang, H.; Yang, X. State of health prediction for lithium-ion batteries using multiple-view feature fusion and support vector regression ensemble. Int. J. Mach. Learn. Cybern. 2019, 10, 2269–2282. [Google Scholar] [CrossRef]
  21. Topic, J.; Skugor, B.; Deur, J. Neural network-based modeling of electric vehicle energy demand and all electric range. Energies 2019, 12, 1396. [Google Scholar] [CrossRef] [Green Version]
  22. Wang, Q.; Feng, X.; Zhang, B.; Gao, T.; Yang, Y. Power battery state of charge estimation based on extended Kalman filter. J. Renew. Sustain. Energy 2019, 11, 014302. [Google Scholar] [CrossRef]
  23. El-Sehiemy, R.A.; Hamida, M.A.; Mesbahi, T. Parameter identification and state-of-charge estimation for lithium-polymer battery cells using enhanced sunflower optimization algorithm. Int. J. Hydrog. Energy 2020, 45, 8833–8842. [Google Scholar] [CrossRef]
  24. Liu, X.; Zheng, C.; Wu, J.; Meng, J.; Stroe, D.I.; Chen, J. An improved state of charge and state of power estimation method based on genetic particle filter for lithium-ion batteries. Energies 2020, 13, 478. [Google Scholar] [CrossRef] [Green Version]
  25. Wu, Z.; Shang, M.; Shen, D.; Qi, S. SOC estimation for batteries using MS-AUKF and neural network. J. Renew. Sustain. Energy 2019, 11, 024103. [Google Scholar] [CrossRef]
  26. Yang, F.F.; Li, W.; Li, C.; Miao, Q. State-of-charge estimation of lithium-ion batteries based on gated recurrent neural network. Energy 2019, 175, 66–75. [Google Scholar] [CrossRef]
  27. Zhang, C.J.; Cheng, J.; Tian, Q. Semantically modeling of object and context for categorization. IEEE Trans. Neural Netw. Learn. Syst. 2019, 30, 1013–1024. [Google Scholar] [CrossRef]
  28. Burgos-Mellado, C.; Orchard, M.E.; Kazerani, M.; Cárdenas, R.; Sáez, D. Particle-filtering-based estimation of maximum available power state in Lithium-Ion batteries. Appl. Energy 2016, 161, 349–363. [Google Scholar] [CrossRef]
  29. Chen, Z.H.; Sun, H.; Dong, G.; Wei, J.; Wu, J.I. Particle filter-based state-of-charge estimation and remaining-dischargeable-time prediction method for lithium-ion batteries. J. Power Sources 2019, 414, 158–166. [Google Scholar] [CrossRef]
  30. Kim, T.; Adhikaree, A.; Pandey, R.; Kang, D.W.; Kim, M.; Oh, C.Y.; Baek, J.W. An on-board model-based condition monitoring for lithium-ion batteries. IEEE Trans. Ind. Appl. 2019, 55, 1835–1843. [Google Scholar] [CrossRef]
  31. Diab, Y.; Auger, F.; Schaeffer, E.; Wahbeh, M. Estimating lithium-ion battery state of charge and parameters using a continuous-discrete extended kalman filter. Energies 2017, 10, 1075. [Google Scholar] [CrossRef] [Green Version]
  32. Pola, D.A.; Navarrete, H.F.; Orchard, M.E.; Rabié, R.S.; Cerda, M.A.; Olivares, B.E.; Silva, J.F.; Espinoza, P.A.; Pérez, A. Particle-filtering-based discharge time prognosis for lithium-ion batteries with a statistical characterization of use profiles. IEEE Trans. Reliab. 2015, 64, 710–720. [Google Scholar] [CrossRef]
  33. Ye, M.; Guo, H.; Xiong, R.; Yu, Q. A double-scale and adaptive particle filter-based online parameter and state of charge estimation method for lithium-ion batteries. Energy 2018, 144, 789–799. [Google Scholar] [CrossRef]
  34. Zhou, D.M.; Zhang, K.; Ravey, A.; Gao, F.; Miraoui, A. Online estimation of lithium polymer batteries state-of-charge using particle filter-based data fusion with multimodels approach. IEEE Trans. Ind. Appl. 2016, 52, 2582–2595. [Google Scholar] [CrossRef]
  35. Afshar, S.; Morris, K.; Khajepour, A. State-of-charge estimation using an ekf-based adaptive observer. IEEE Trans. Control Syst. Technol. 2019, 27, 1907–1923. [Google Scholar] [CrossRef]
  36. Kim, Y.; Lin, X.; Abbasalinejad, A.; Kim, S.U.; Chung, S.H. On state estimation of all solid-state batteries. Electrochim. Acta 2019, 317, 663–672. [Google Scholar] [CrossRef]
  37. Ma, Y.; Chen, Y.; Zhou, X.; Chen, H. Remaining useful life prediction of lithium-ion battery based on gauss-hermite particle filter. IEEE Trans. Control Syst. Technol. 2019, 27, 1788–1795. [Google Scholar] [CrossRef]
  38. Eltoumi, F.; Badji, A.; Becherif, M.; Ramadan, H.S. Experimental identification using equivalent circuit model for lithium-ion battery. Int. J. Emerg. Electr. Power Syst. 2018, 19, 20170210. [Google Scholar] [CrossRef]
  39. Yu, C.-X.; Xie, Y.M.; Sang, Z.Y.; Yang, S.Y.; Huang, R. State-of-charge estimation for lithium-ion battery using improved dukf based on state-parameter separation. Energies 2019, 12, 4036. [Google Scholar] [CrossRef] [Green Version]
  40. Yu, Y.; Narayan, N.; Vega-Garita, V.; Popovic-Gerber, J.; Qin, Z.; Wagemaker, M.; Bauer, P.; Zeman, M. Constructing accurate equivalent electrical circuit models of lithium iron phosphate and lead–acid battery cells for solar home system applications. Energies 2018, 11, 2305. [Google Scholar] [CrossRef] [Green Version]
  41. Pei, Z.; Zhao, X.; Yuan, H.; Peng, Z.; Wu, L. An equivalent circuit model for lithium battery of electric vehicle considering self-healing characteristic. J. Control Sci. Eng. 2018, 2018, 1–11. [Google Scholar] [CrossRef] [Green Version]
  42. Madani, S.; Schaltz, E.; Knudsen Kær, S. An electrical equivalent circuit model of a lithium titanate oxide battery. Batteries 2019, 5, 31. [Google Scholar] [CrossRef] [Green Version]
  43. Su, J.; Lin, M.; Wang, S.; Li, J.; Coffie-Ken, J.; Xie, F. An equivalent circuit model analysis for the lithium-ion battery pack in pure electric vehicles. Meas. Control 2019, 52, 193–201. [Google Scholar] [CrossRef] [Green Version]
  44. Abe, Y.; Hori, N.; Kumagai, S. Electrochemical impedance spectroscopy on the performance degradation of LiFePO4/Graphite lithium-ion battery due to charge-discharge cycling under different C-rates. Energies 2019, 12, 4507. [Google Scholar] [CrossRef] [Green Version]
  45. Methekar, R. SOC estimation with thermal and charging rate consideration using dual filter approach for lithium-ion battery. J. Renew. Sustain. Energy 2018, 10, 064103. [Google Scholar] [CrossRef]
  46. Shen, P.; Ouyang, M.; Lu, L.; Li, J.; Feng, X. The co-estimation of state of charge, state of health, and state of function for lithium-ion batteries in electric vehicles. IEEE Trans. Veh. Technol. 2018, 67, 92–103. [Google Scholar] [CrossRef]
  47. Zeng, Z.B.; Tian, J.; Li, D.; Tian, Y. An online state of charge estimation algorithm for lithium-ion batteries using an improved adaptive cubature kalman filter. Energies 2018, 11, 59. [Google Scholar] [CrossRef] [Green Version]
  48. Zhang, C.; Allafi, W.; Dinh, Q.; Ascencio, P.; Marco, J. Online estimation of battery equivalent circuit model parameters and state of charge using decoupled least squares technique. Energy 2018, 142, 678–688. [Google Scholar] [CrossRef]
  49. Arachchige, B.; Perinpanayagam, S.; Jaras, R. Enhanced prognostic model for lithium ion batteries based on particle filter state transition model modification. Appl. Sci. Basel 2017, 7, 1172. [Google Scholar] [CrossRef] [Green Version]
  50. Lao, Z.Z.; Xia, B.; Wang, W.; Sun, W.; Lai, Y.; Wang, M. A novel method for lithium-ion battery online parameter identification based on variable forgetting factor recursive least squares. Energies 2018, 11, 1358. [Google Scholar] [CrossRef] [Green Version]
  51. Zahid, T.; Li, W.M. A comparative study based on the least square parameter identification method for state of charge estimation of a lifepo4 battery pack using three model-based algorithms for electric vehicles. Energies 2016, 9, 720. [Google Scholar] [CrossRef] [Green Version]
  52. Nikolian, A.; Firouz, Y.; Gopalakrishnan, R.; Timmermans, J.M.; Omar, N.; Van den Bossche, P.; Van Mierlo, J. Lithium ion batteriesdevelopment of advanced electrical equivalent circuit models for nickel manganese cobalt lithium-ion. Energies 2016, 9, 360. [Google Scholar] [CrossRef]
  53. Wang, C.; He, H.; Zhang, Y.; Mu, H. A comparative study on the applicability of ultracapacitor models for electric vehicles under different temperatures. Appl. Energy 2017, 196, 268–278. [Google Scholar] [CrossRef]
  54. Wang, Q.Q.; Wang, J.; Zhao, P.; Kang, J.; Yan, F.; Du, C. Correlation between the model accuracy and model-based SOC estimation. Electrochim. Acta 2017, 228, 146–159. [Google Scholar] [CrossRef]
  55. Christophersen, J.P. Battery Test Manual For Electric Vehicles; Revision 3; Idaho National Lab.: Idaho Falls, ID, USA, 2015. [Google Scholar]
Figure 1. Thevenin equivalent circuit and load mode.
Energies 13 02057 g001
Figure 2. Equivalent circuit.
Energies 13 02057 g002
Figure 3. Current and voltage diagram during HPPC experiment.
Energies 13 02057 g003
Figure 4. Appearance diagram of experimental equipment.
Energies 13 02057 g004
Figure 5. HPPC experiment of the discharge process.
Energies 13 02057 g005
Figure 6. Simulink Model Verification Structural Diagram.
Energies 13 02057 g006
Figure 7. The internal structure of ampere-hour (AH) integral.
Energies 13 02057 g007
Figure 8. The internal structure of Thevenin model.
Energies 13 02057 g008
Figure 9. The variable operating current.
Energies 13 02057 g009
Figure 10. Voltage output curve diagram.
Energies 13 02057 g010
Figure 11. Voltage error.
Energies 13 02057 g011
Table 1. Model parameters under different SOC states.
SOC τ 1 / s τ 2 / s R0/mR1/mC1/FUoc/V
0.057.7738.7652.4451.25107006.39483.4616
0.18.9910.472.2290.838912,480.62943.4951
0.210.2613.432.0710.687119,545.91763.5686
0.310.3312.602.0190.620020,322.58063.6201
0.49.87712.151.9880.583320,829.76173.6480
0.58.84212.331.9560.578021,332.17993.6867
0.69.44112.081.9470.781815,451.52213.7648
0.79.38811.931.9360.767415,545.99953.8504
0.88.78511.621.9480.721216,112.03553.9487
0.98.51511.221.9530.671516,708.86084.0584
0.958.68412.721.9760.659019,301.97274.1192
19.03312.791.9940.722017,714.68144.1917