Article

Performance Evaluation of PV/T Air Collector Having a Single-Pass Double-Flow Air Channel and Non-Uniform Cross-Section Transverse Rib

Department of Refrigeration and Air-Conditioning Engineering, Pukyong National University, Busan 48513, Korea
*
Author to whom correspondence should be addressed.
Energies 2020, 13(9), 2203; https://doi.org/10.3390/en13092203
Submission received: 5 April 2020 / Revised: 19 April 2020 / Accepted: 26 April 2020 / Published: 2 May 2020
(This article belongs to the Section A2: Solar Energy and Photovoltaic Systems)

Abstract

:
In the present work, the electrical and thermal performances of a newly designed PV/T (photovoltaic/thermal) air collector, which was proposed and fabricated by the author, have been investigated experimentally in the natural weather conditions. The PV/T air collector has a single-pass double-flow air channel. Also, a non-uniform cross-section transverse rib was attached at the back surface of the PV (photovoltaic) module to improve the heat transfer performance between the PV module and flowing air. The experiment was carried out in an outdoor field on a clear day with various air mass flow rates ranges from 0.0198 kg/s to 0.07698 kg/s. In the results, it was found that the average thermal efficiency of the PV/T collector increased from 35.2% to 56.72% as the air mass flow rate increased. The average electrical efficiency also increased from 14.23% to 14.81% with an increase in an air mass flow rate, but the effect of air mass flow rate on the increase in electrical efficiency was inconsiderable. The average overall efficiency, which represents the sum of electrical and thermal efficiencies, was in the range of 49.44% to 71.54% and it increased as the air mass flow rate increased. The maximum value of average overall efficiency during the test period was found to be 71.54% at an air mass flow rate of 0.07698 kg/s. From the results, it was confirmed that the newly designed PV/T air collector provides a significant enhancement in solar energy utilization.

1. Introduction

The PV (photovoltaic) module is one of the most widely used renewable systems and it has gained fast growth globally. It can convert 12–18% of the incident solar energy into useful electrical energy depending on its type and operating conditions. However, most of the incident solar energy either reflected or turn into thermal energy. This thermal energy dissipated into the atmosphere or leads to an increase in the temperature of the PV module, which reduces its efficiency.
To retrieve thermal energy and prevent a decrease in efficiency of PV module, Wolf suggested PV/T (photovoltaic/thermal) solar collector first [1]. The PV/T solar collector consists of a PV module and a solar thermal collector. The cooling mediums such as air and water in the solar thermal collector extract heat from the PV module, which reduces its temperature. In addition to this, heated fluid can be used to provide thermal energy for hot water supply, space heating, and so on.
The PV/T collectors can be categorized into two types: liquid-based PV/T solar collector and air-based PV/T solar collector. The liquid-based PV/T collector uses a liquid such as water and nanofluid as a cooling medium. Nualboonrueng et al. examined the performance of PV/T water collector under actual climate conditions in Bangkok to confirm the electrical and thermal energy supplied in tropical areas by the collector [2]. Jahromi et al. conducted an exergy and economic evaluation of a commercial PV/T water collector using MATLAB simulation [3]. Rosa-Clot et al. evaluated the thermal and electrical performance of the PV/T water collector experimentally and compared its electrical efficiency with the results of a PV system [4]. Calise et al. developed a one-dimensional finite-volume model of an unglazed PV/T water collector and investigated the performance of the PV/T collector under different operating parameters [5]. Lee et al. confirmed the effect of the water flow rate on the thermal efficiency of the PV/T water collector and compared its thermal and electrical efficiencies using water and nanofluid [6]. Motamedi et al. conducted an experimental test of the hydrophobic microchannels for PV/T solar collector using nanofluids [7]. Hussain et al. developed a dynamic model for a PV/T solar collector that uses air and nanofluid simultaneously [8]. Sarafraz et al. performed an experimental investigation on the thermal and electrical performance of a PV/T solar collector equipped with a cooling jacket filled with PCM (phase change material) using nanofluid [9]. Liu et al. conducted parameters’ optimization of PV/T solar collector integrated with PCM using the Taguchi method [10].
The thermal efficiency is relatively high when the liquid was used as a cooling medium because of its high thermal conductivity. However, the liquid-based PV/T collectors are expensive because of the relatively complex design, and it is prone to freezing when operating in cold winter. Meanwhile, the PV/T air collectors are economic because of the simple design and need a little maintenance. But, the heat transfer performance of the PV/T air collector is low because of the low thermal conductivity of air. Thus, many studies to improve the thermal performance of the PV/T air collector have been conducted.
Sopian et al. conducted a comparative study of the single and double pass PV/T air collector using a steady-state numerical model and reported that the double pass PV/T air collector has better performance [11]. Othman et al. evaluated the thermal and electrical performance of a PV/T air collector with a fin-mounted double-pass air channel through experimental and mathematical analysis [12]. Raman and Tiwari compared the electrical, thermal, and exergy efficiencies of PV/T air collectors combined with a single-pass and double-pass air channel and the performance of a double-pass PV/T air collector was found to be higher than that of a single-pass PV/T air collector [13]. Kumar et al. conducted a performance evaluation of a double-pass PV/T air collector with and without fins using a mathematical model [14]. Karima and Musafa performed a comparative study of four different PV/T air collector and developed a numerical model to analyze the thermal and hydraulic performances of the PV/T collector and reported that the collector with a single-pass and double-flow has higher efficiencies than other models [15]. Kim et al. conducted an experimental study on the thermal and electrical characteristics of PV/T air collector having a bending round-shaped heat-absorbing plates [16]. Farshchiminfared et al. performed optimization of air mass flow rate, air distribution duct diameter, and an air channel depth of PV/T air collector for residential buildings application [17]. Kim et al. designed PV/T air collector coupled with a heat-recovery ventilator and analyzed the performance of the proposed system experimentally [18]. Ju et al. analyzed the thermal characteristics of an air-type BIPVT (building integrated photovoltaic/thermal) collector according to the inlet opening ratio and air flow path [19]. Including these work, a number of studies have been conducted to improve the thermal performance of the PV/T air collector [20,21].
However, it was observed that most of the previous studies for PV/T air collector have been conducted with the numerical method and a few experimental studies for the PV/T air collector have been done on the natural weather conditions. In this study, the performance of the PV/T air collector, which was newly designed and fabricated by the author, has been investigated experimentally on the natural weather conditions with various air mass flow rates. The PV/T air collector proposed in this study has a single-pass double-flow air channel, which has higher thermal performance than that of single-pass single-duct as reported in previous studies [15]. Moreover, the collector has a non-uniform cross-section transverse rib at the back sheet of the PV module to improve the heat transfer performance from the PV module to the flowing air. The main purposes of the present work are as follows: (a) Evaluating the thermal and electrical performance of the PV/T air collector experimentally on the natural weather conditions; (b) investigating the effect of air mass flow rate on the performance of the PV/T air collector; (c) confirming the feasibility of the PV/T air collector proposed in this study.

2. Experimental Apparatus and Methods

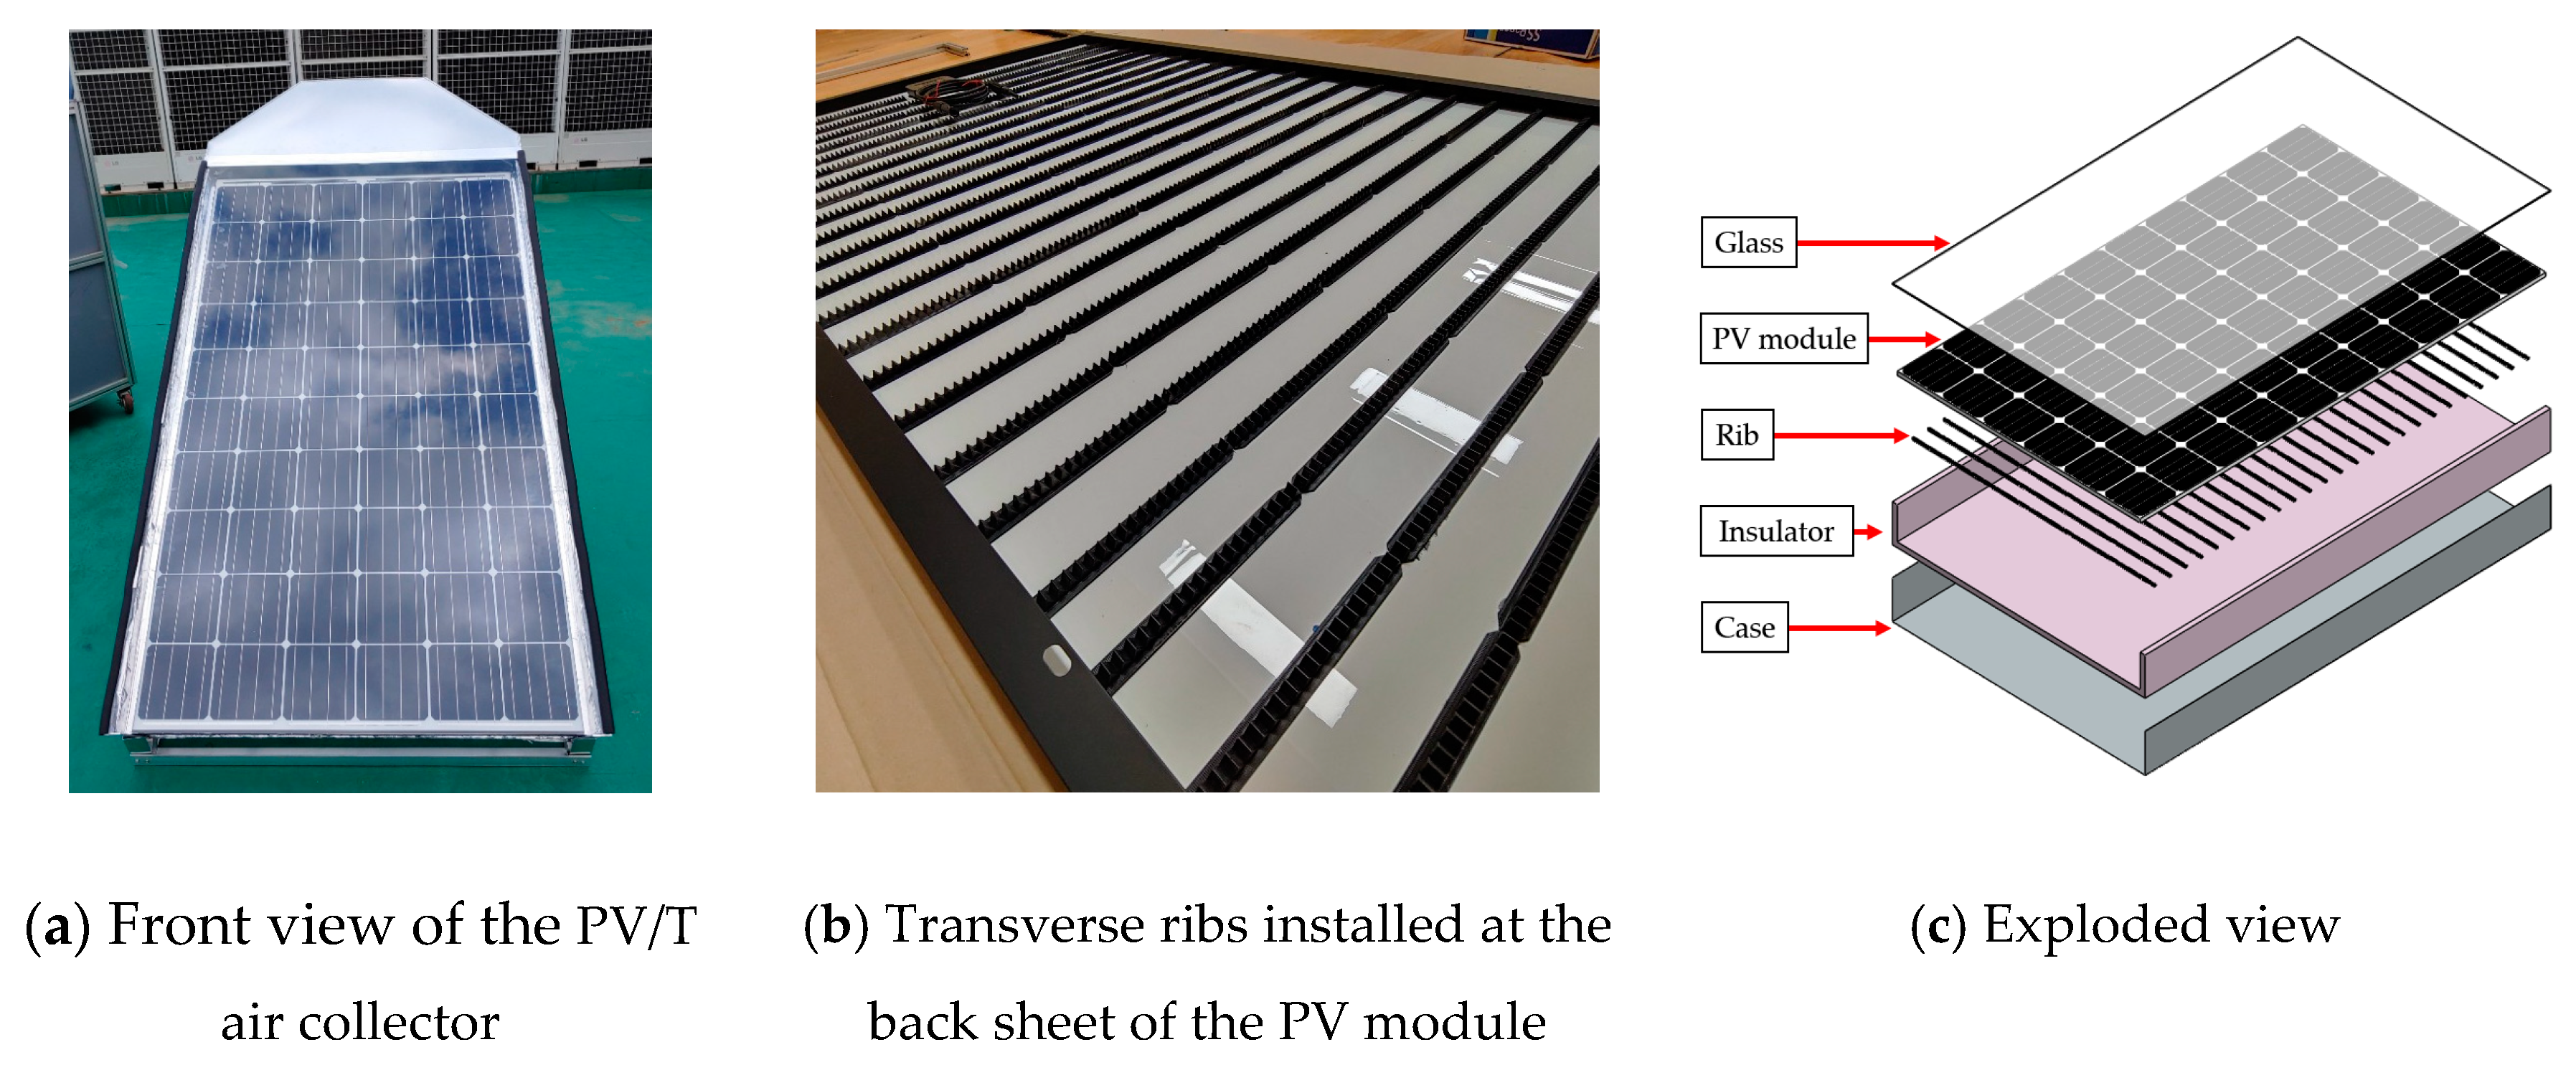
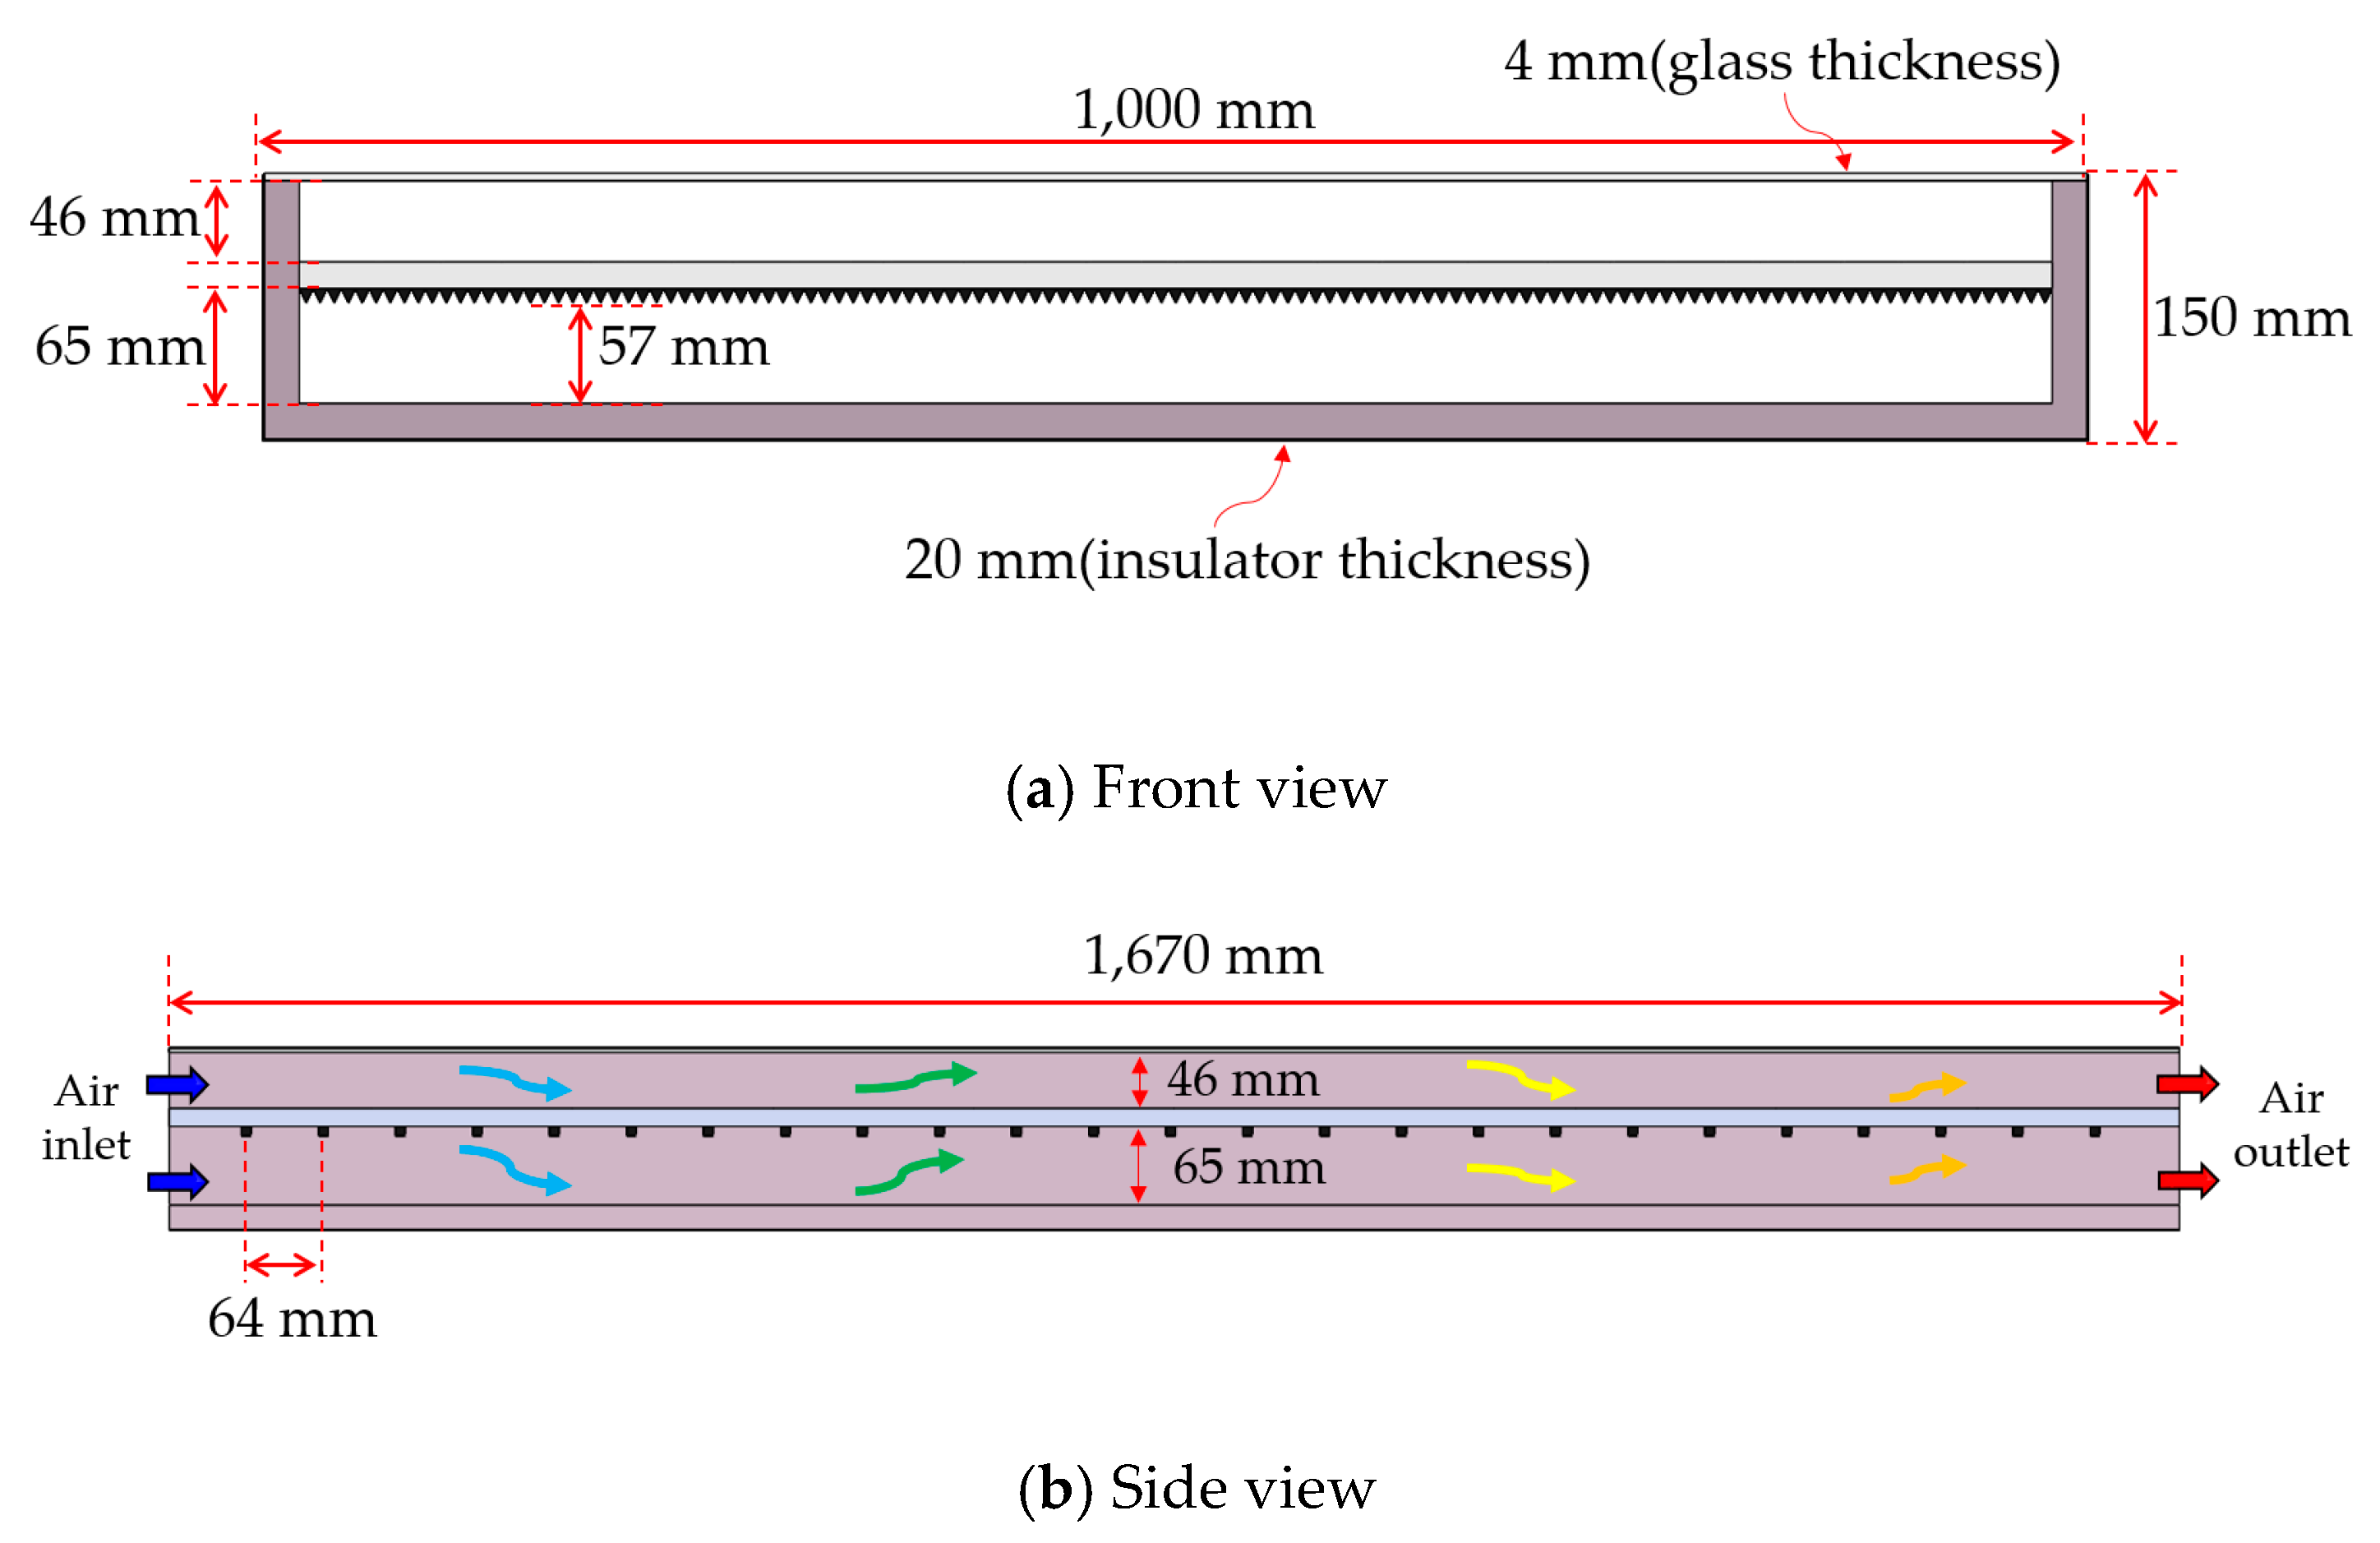
2.1. Description of PV/T Air Collector

The PV/T air collector used in this study is a newly designed collector, which has a single-pass double-flow air channel and non-uniform cross-section transverse rib at the back sheet of the PV module. Figure 1 shows the actual and exploded view of the proposed PV/T air collector. The PV/T air collector consists of glass, PV module, rib, insulator, and case. The length, width, and thickness of the glass were 1670 mm, 1040 mm, and 4mm, respectively. The PV module used in this study was a commercially available product. The length and width of the PV module were 1670 mm and 1000 mm, respectively. More detailed specifications of the PV module (Model: Q. PEAK BFR-G4.4) on the standard test conditions (Solar intensity 1000 W/m2, module temperature 25 °C, AM 1.5), which are obtained from the product catalog, are listed in Table 1. In the specifications, negative value of the temperature coefficient means the decrease in electrical efficiency according to the increase in cell temperature.
The upper and lower air channel have the same length of 1670 mm, width of 1000 mm, and different heights of 46 mm and 65 mm. The non-uniform cross-section ribs were attached at the back surface of the PV module in the form of a triangle in order to increase the heat transfer performance from the PV module to flowing air. The height, width, and length of each triangle of the rib have the same values of 8 mm. A total of 125 triangles were installed for one transverse rib. To prevent heat loss, the insulators were installed at the sidewall and bottom of the air channel with a thickness of 20 mm. Figure 2 and Figure 3 show a schematic of the proposed PV/T air collector and a transverse triangular rib with more detailed dimensions.

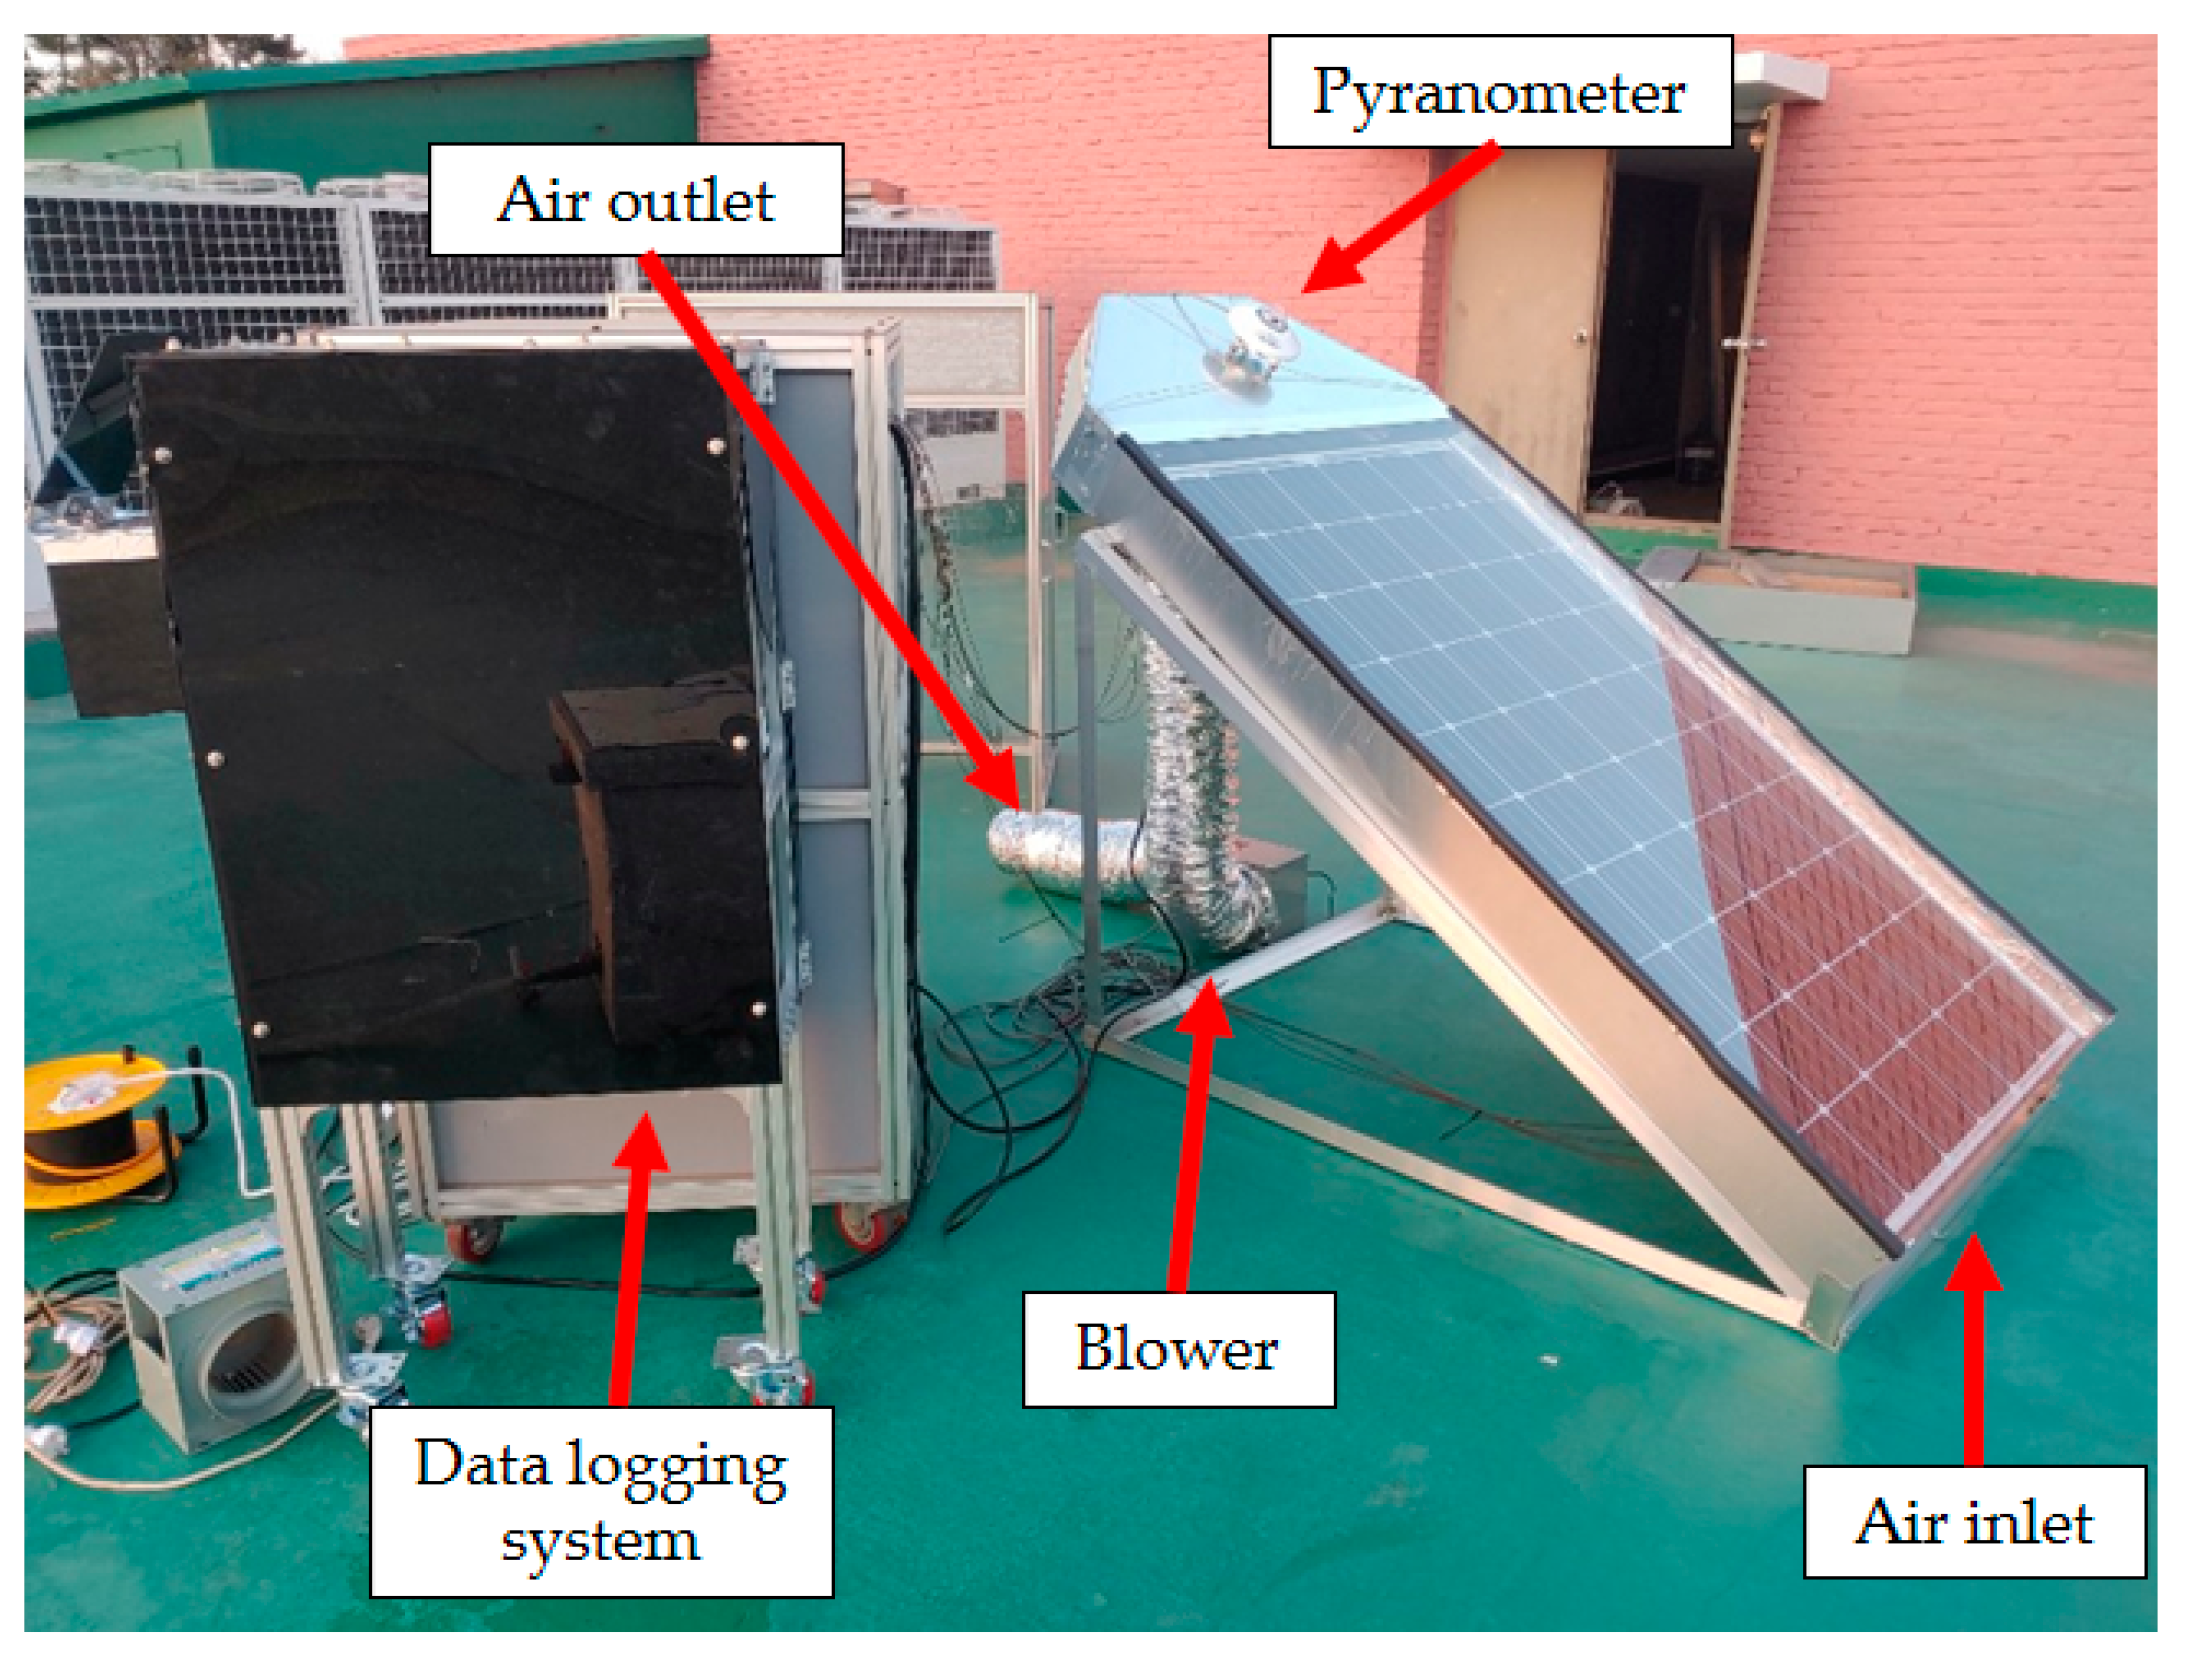
2.2. Experimental Setup and Methods

Figure 4 shows the experimental setup for PV/T air collector having a single-pass double-flow air channel and non-uniform cross-section transverse rib. The PV/T air collector is located at Engineering Building 2, Yongdang Campus, Pukyong National University, Busan, Korea (latitude: 35°6.98′, longitude: 129°5.39′). The experiments of the PV/T air collector were performed from 10:00 to 16:00 for a fixed value of air mass flow rate in an outdoor field on a clear day. Performance evaluations of the PV/T air collector were carried out with four different days with four different air mass flow rates ranging from 0.01977 kg/s to 0.07698 kg/s to get compatible results.
Ambient temperature was measured by T-type thermocouples located under the collector with the accuracy of ± 1 °C during the experiment period. The outlet air temperature was also measured with the T-type thermocouples in an outlet air duct. The voltage and ampere generated by the PV module were measured with a power meter (PW3336-02) with an accuracy of ± 0.1%. The air velocity was measured by hot-wire anemometer (KNOMAX 6531-2G) with an accuracy of ± 0.015 m/s at the outlet air duct. Air mass flow rate was obtained by multiplying the cross-section area of air duct and air density by measured air velocity. The incident solar intensity on the surface of the collector was measured by pyranometer (MS-802) with an accuracy of ± 2%. The experimental conditions and the properties of measuring devices are summarized in Table 2 and Table 3, respectively.

2.3. Performance Evaluation

The main parameters used to analyze the performance of PV/T air collector were heat gain of air, thermal efficiency, electric generation, and electrical efficiency. The heat gain of air per unit area of PV/T air collector was calculated as follows:
q a i r = m ˙ a i r C p , a i r ( T a i r , o u t T a i r , i n ) A c
The thermal efficiency, which represents the ratio of the heat gain of air to the incident solar radiation, was calculated as follows:
η t h = q a i r G = m ˙ a i r C p , a i r G A c ( T a i r , o u t T a i r , i n )
The electric generation per unit area of PV/T air collector was calculated as follows:
w P V = V P V I P V ε P V A c
where the ε P V is the PV cell’s coverage factor. It is the ratio of the PV cell area to the overall PV/T solar collector area.
The electrical efficiency, which represents the ratio of electric generation to the incident solar radiation, was calculated as follows:
η e = w P V G = V P V I P V G ε P V A c
The PV/T air collector produces both thermal energy and electrical energy simultaneously. Thus, the overall efficiency needs to be confirmed and it was calculated as follows:
η o v e r a l l = η t h + η e

3. Results and Discussion

3.1. Weather Conditions

Figure 5 shows the variation of ambient temperature and solar intensity for each experiment day with operating time.
The solar intensity varied from 520.18 W/m2 to 1123.92 W/m2, 496.54 W/m2 to 1122.11 W/m2, 508.5 W/m2 to 1093.55 W/m2, and 437.08 W/m2 to 1065.79 W/m2 for each experiment day with average values of 946.53 W/m2, 937.61 W/m2, 935.26 W/m2, and 890.36 W/m2. The ambient temperatures were in the range of 10.42 °C to 13.49 °C, 11.69 °C to 18.42 °C, 15.55 °C to 18.63 °C, and 12.96 °C to 15.28 °C for each experiment day with average values of 12.06 °C, 16.27 °C, 16.84 °C, and 14.1 °C. From the figure, it was seen that the experiment have been conducted on a clear day for all experiments. Also, the solar intensity had similar values and a changing trend during the test period.

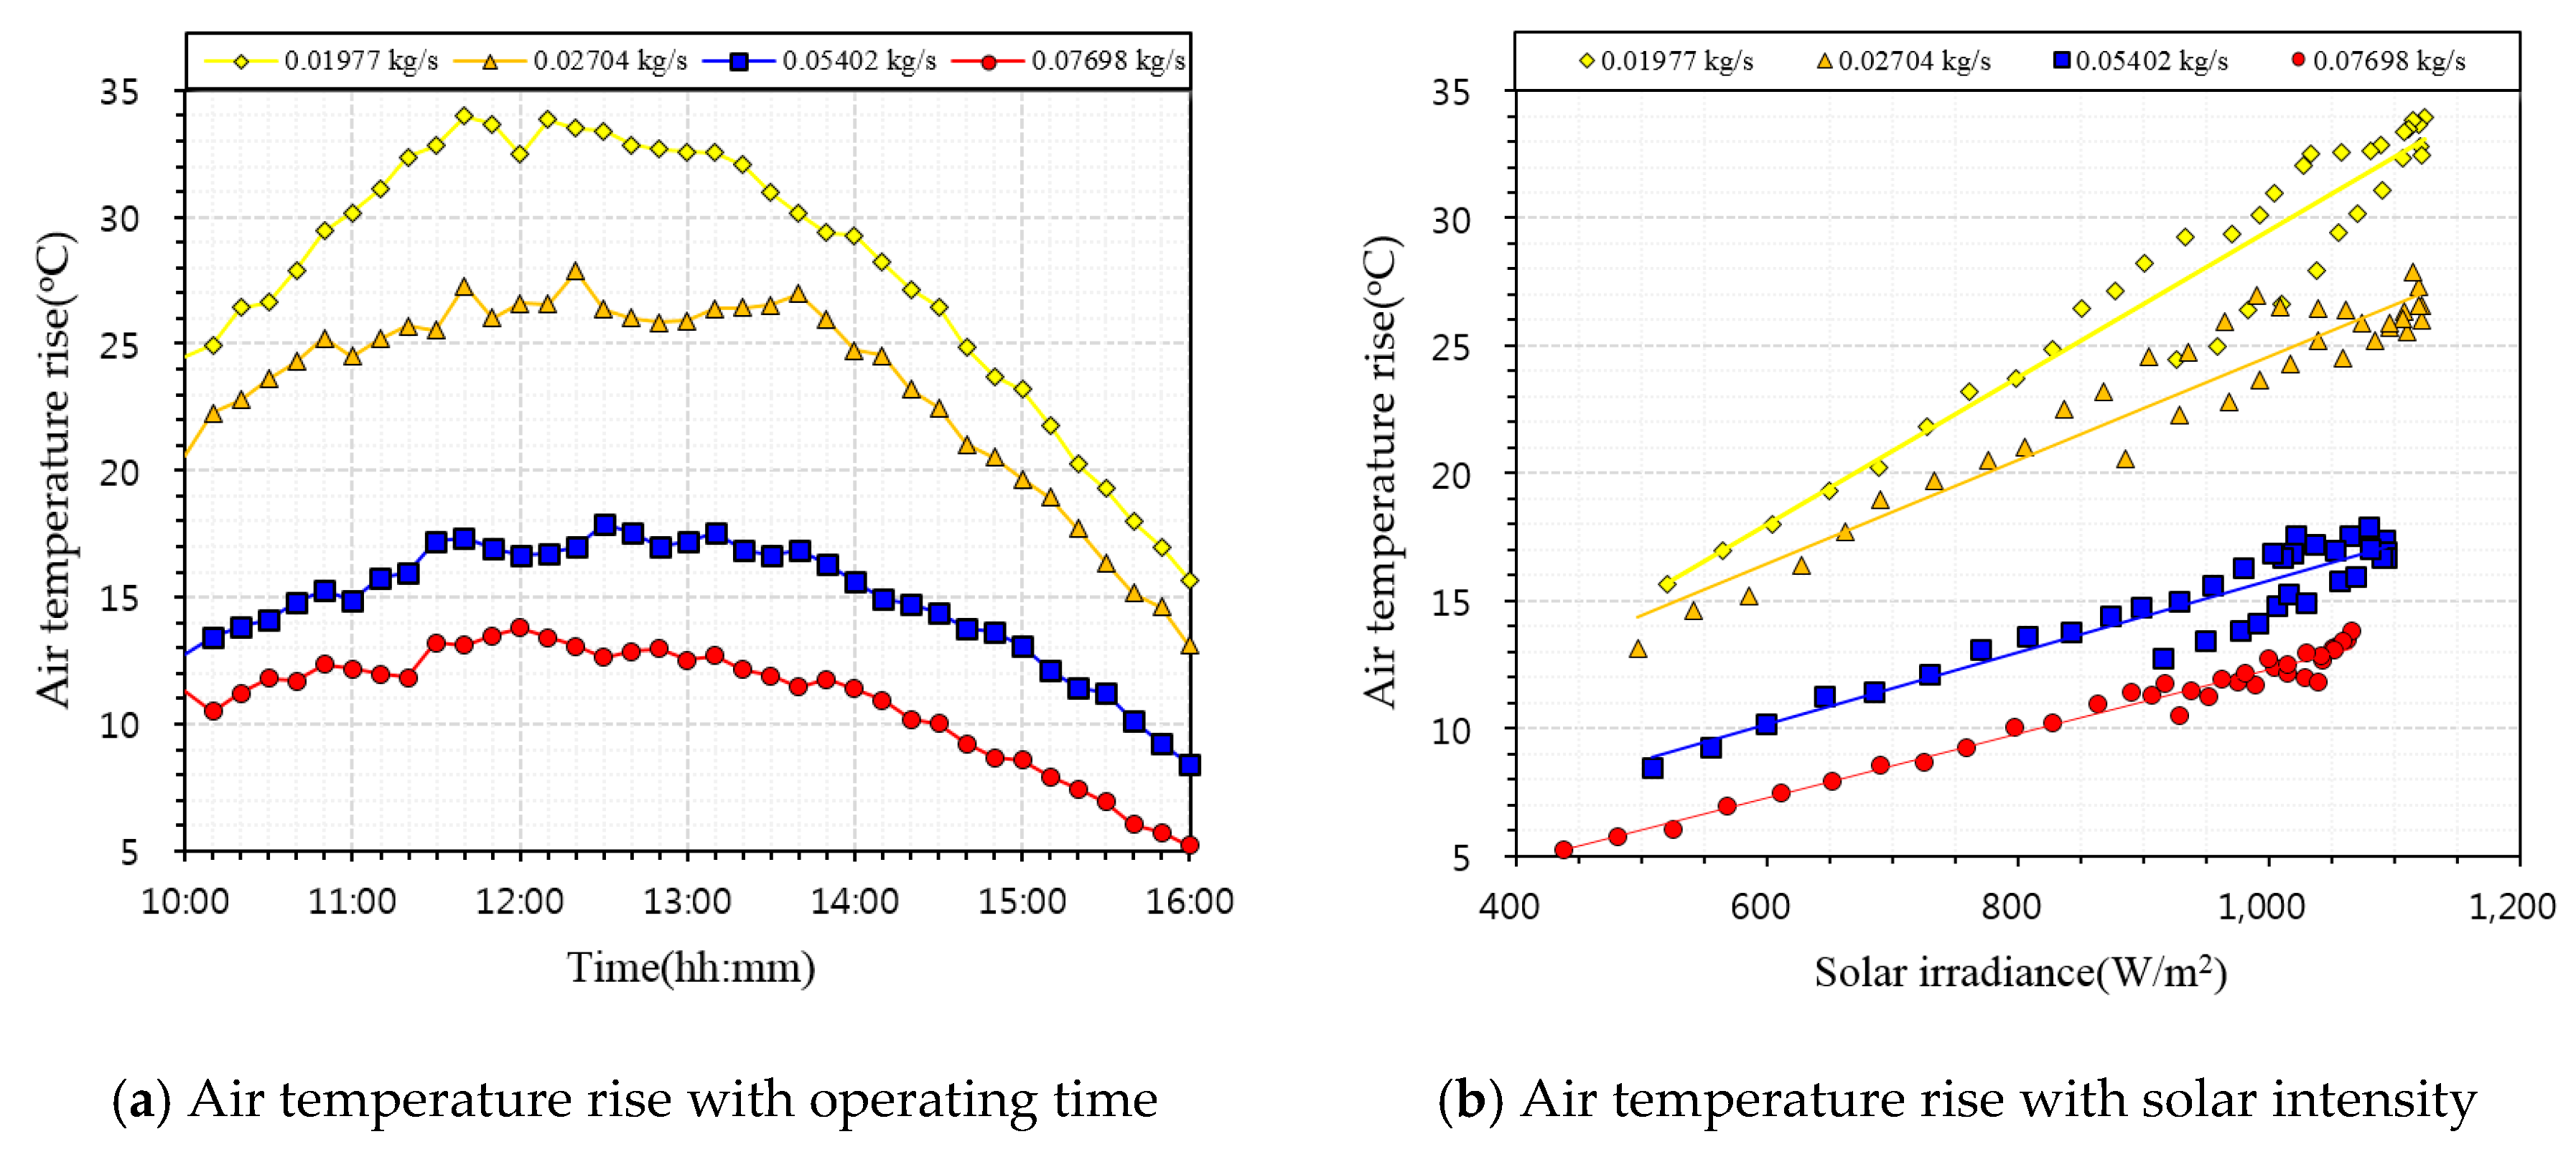
3.2. Thermal Performance

In this section, the thermal performance of the PV/T air collector was investigated in the form of air temperature rise, heat gain of air, and thermal efficiency.
Figure 6a shows air temperature rise, which means the temperature difference between inlet and outlet air in the PV/T air collector. The air temperature rise varied in the range of 15.66 °C to 33.96 °C, 13.11 °C to 27.86 °C, 8.44 °C to 17.90 °C, 5.21 °C to 13.78 °C according to the weather conditions and air mass flow rate. The mean values of air temperature rise during experiment period were 27.97 °C, 23.31 °C, 14.85 °C, 10.92 °C for each air mass flow rate of 0.01977 kg/s, 0.02704 kg/s, 0.05402 kg/s, 0.07698 kg/s, respectively. From the results, it was observed that the air temperature rise increased with a decrease in air mass flow rate. This is due to the decrease in heat transfer time caused by the decrease in air velocity in an air channel. From the figure, it was also seen that the air temperature rise presented a changing trend similar to the solar intensity during the test period. This is because the increase in air temperature rise depends on the intensity of incident solar energy as shown in Figure 6b.
Figure 7 shows the heat gain of air and thermal efficiency of the PV/T air collector during the test period at different air mass flow rate. The heat gain of air varied from 186.40 W/m2 to 404.15 W/m2, 213.35 W/m2 to 453.22 W/m2, 274.47 W/m2 to 581.98 W/m2, 241.49 W/m2 to 638.52 W/m2 with average values of 332.86 W/m2, 379.23 W/m2, 482.95 W/m2, and 506 W/m2 for each air mass flow rate of 0.01977 kg/s, 0.02704 kg/s, 0.05402 kg/s, and 0.07698 kg/s, respectively. The heat gain of air increased with an increase in the air mass flow rate. This is due to the increase in air velocity in an air channel of the PV/T air collector, which results in a higher heat transfer coefficient between the PV module and flowing air. The thermal efficiency was in the range of 30.97% to 37.44%, 37.4% to 44.64%, 45.34% to 56.67%, and 52.37% to 59.91% for each air mass flow rate. From the results, it was seen that the thermal efficiency significantly increased with an increase in the air mass flow rate. This is because the heat gain of air increased as the air mass flow rate increases, while the solar intensity remains similar. The detailed values of thermal efficiency for PV/T air collector at different air mass flow rate are listed in Table 4 with operating time.
Figure 8 shows the thermal efficiency with respect to air mass flow rate and the average thermal efficiency during the experiment period. From the figure, it was observed that the air mass flow rate has a strong effect on the increase in thermal efficiency, as stated previously. The average thermal efficiencies were 35.2%, 40.77%, 51.87%, and 56.72% for each air mass flow rate.

3.3. Electrical Performance

In this section, the electrical performance of the PV/T air collector for various air mass flow rates is presented in the form of electric generation and electrical efficiency.
Figure 9 shows electric generation and electrical efficiency during test period at difference air mass flow rate. The electric generation varied in the range of 57.45 W/m2 to 160.08 W/m2, 60.08 W/m2 to 162.11 W/m2, 57.58 W/m2 to 160.40 W/m2, and 49.56 W/m2 to 164.03 W/m2 with average values of 135.75 W/m2, 134.87 W/m2, 137.60 W/m2, and 133.35 W/m2 for air mass flow rate of 0.01977 kg/s, 0.02704 kg/s, 0.05402 kg/s, and 0.07698 kg/s, respectively. As shown in the figure, the electric generation increased with increase in solar intensity and then decreased as the solar intensity decreased. The electrical efficiencies varied from 11.05% to 15.37%, 12.10% to 16.11%, 11.32% to 15.60%, and 11.32% to 16.27% for each air mass flow rate.
Figure 10 shows the electrical efficiency with respect to the air mass flow rate and the average electrical efficiency during the experiment period. The average electrical efficiencies were 14.23%, 14.33%, 14.6%, and 14.81% for each air mass flow rate. From the results, it was seen that the electrical efficiency slightly increased with an increase in air mass flow rate. This is due to the fact that the increasing of the thermal performance with an increase in air mass flow rate leads to the lower temperature of the PV module, which results in higher electrical efficiency. However, the effect of air mass flow rate on the increase in electrical efficiency was inconsiderable. The detailed values of electrical efficiency for PV/T air collector at different air mass flow rate are listed in Table 5 with operating time.

3.4. Overall Efficiency

The PV/T air collector produces not only thermal energy but also electrical energy. Thus the overall efficiency, which means the sum of thermal and electrical efficiencies, was investigated.
Figure 11 shows the variation of overall efficiency during the test period. The overall efficiency was in the range of 46.24% to 52.08%, 52% to 58.97%, 60.94% to 70.80%, and 66.32% to 75.3% for air mass flow rate of 0.01977 kg/s, 0.02704 kg/s, 0.05402 kg/s, and 0.07698 kg/s, respectively.
Figure 12 shows the overall efficiency with respect to air mass flow rate and the average overall efficiency during the experiment period. The average overall efficiencies were 49.44%, 55.10%, 66.47%, and 71.54% for each air mass flow rate. From the results, it was found that the overall efficiency increased with an increase in air mass flow rate. The reason was that the increase in air mass flow rate leads to an increase in both thermal and electrical efficiencies for PV/T air collector.

4. Conclusions

In the present work, a newly designed PV/T air collector, which has a single-pass double-flow air channel and non-uniform cross-section rib, was fabricated and experimented. The thermal and electrical performance have been investigated experimentally on the natural weather conditions with various air mass flow rate. The major conclusions of this study can be summarized as follows: (1) The air temperature rise changed from 5.21 °C to 33.96 °C depending on the solar intensity and air mass flow rate. It increased with a decrease in air mass flow rate and the maximum air temperature rise was found at a low air mass flow rate of 0.01977 kg/s. (2) The thermal efficiency varied from 30.97% to 59.91% according to weather conditions and air mass flow rate. The maximum value of average thermal efficiency during the test period was found to be 56.72% at an air mass flow rate of 0.07698 kg/s. From the results, it was found that the thermal efficiency increased significantly with an increase in air mass flow rate different from the air temperature rise. Also, a strong effect of air mass flow rate on the increase in thermal efficiency was confirmed. (3) The electrical efficiency varied from 11.05% to 16.27% according to weather conditions and air mass flow rate. The maximum value of average electrical efficiency during the test period was found to be 14.81% at an air mass flow rate of 0.07698 kg/s. The electrical efficiency increases slightly with an increase in the air mass flow rate and the effect of the air mass flow rate on the increase in electrical efficiency was found inconsiderable. (4) The overall efficiency varied from 46.24% to 75.3% according to the weather conditions and air mass flow rate. The maximum value of average overall thermal efficiency during the test period was found to be 71.54% at an air mass flow rate of 0.07698 kg/s. The overall efficiency increased with an increase in air mass flow rate because of the increase in both thermal and electrical efficiencies. (5) From the results, it was found that the PV/T air collector used this study provides a significant enhancement in solar energy utilization.

Author Contributions

All authors made equal contributions and efforts in writing the manuscript. All authors have read and agreed to the published version of the manuscript.

Funding

This research received no external funding.

Acknowledgments

This research was supported by X-mind Corps program of National Research Foundation of Korea (NRF) funded by the Ministry of Science, ICT (No.2019H1D8A1105564).

Conflicts of Interest

The authors declare no conflict of interest.

Nomenclature

qHeat transfer rate per unit area of PV/T air collector (W/m2)
m ˙ Air mass flow rate (kg/s)
C p Specific heat (J/kg K)
TTemperature (K)
GSolar intensity (W/m2)
AArea (m2)
w Power (W)
VVoltage (V)
IAmpere (A)
Subscript
airAir
inInlet
outOutlet
cCollector
PVPhotovoltaic module
thThermal
eElectrical
cellPV cell
overallOverall
Greek Letters
η Efficiency (-)
ε Coverage factor (-)

References

  1. Wolf, M. Performance analyses of combined heating and photovoltaic power systems for residences. Energy Convers. Manag. 1976, 16, 79–90. [Google Scholar] [CrossRef]
  2. Nualboonrueng, T.; Tuenpusa, P.; Ueda, Y.; Akisawa, A. Field Experiments of PV-Thermal Collectors for Residential Application in Bangkok. Energies 2012, 5, 1229–1244. [Google Scholar] [CrossRef] [Green Version]
  3. Jahromi, S.N.; Vadiee, A.; Yaghoubi, M. Exergy and Economic Evaluation of a Commercially Available PV/T Collector for Different Climates in Iran. Energy Procedia 2015, 75, 444–456. [Google Scholar] [CrossRef] [Green Version]
  4. Rosa-Clot, M.; Rosa-Clot, P.; Tina, G.M.; Ventura, C. Experimental photovoltaic-thermal Power Plants based on TESPI panel. Sol. Energy 2016, 133, 305–314. [Google Scholar] [CrossRef]
  5. Calise, F.; Figaj, R.D.; Vanoli, L. Experimental and Numerical Analyses of a Flat Plate Photovoltaic/Thermal Solar Collector. Energies 2017, 10, 491. [Google Scholar] [CrossRef] [Green Version]
  6. Lee, J.H.; Hwang, S.G.; Lee, G.H. Efficiency Improvement of a Photovoltaic Thermal (PVT) System Using Nanofluids. Energies 2019, 12, 3063. [Google Scholar] [CrossRef] [Green Version]
  7. Motamedi, M.; Chung, C.-Y.; Rafeie, M.; Hjerrild, N.; Jiang, F.; Qu, H.; Taylor, R.A. Experimental Testing of Hydrophobic Microchannels, with and without Nanofluids, for Solar PV/T Collectors. Energies 2019, 12, 3036. [Google Scholar] [CrossRef] [Green Version]
  8. Hussain, M.I.; Kim, J.-H.; Kim, J.-T. Nanofluid-powered dual-fluid photovoltaic/thermal (PV/T) system: Comparative numerical study. Energies 2019, 12, 775. [Google Scholar] [CrossRef] [Green Version]
  9. Sarafraz, M.M.; Safaei, M.R.; Leon, A.S.; Tlili, I.; Alkanhal, T.A.; Tian, Z.; Goodarzi, M.; Arjomandi, M. Experimental Investigation on Thermal Performance of a PV/T-PCM (Photovoltaic/Thermal) System Cooling with a PCM and Nanofluid. Energies 2019, 12, 2572. [Google Scholar] [CrossRef] [Green Version]
  10. Liu, X.; Zhou, Y.; Li, C.-Q.; Lin, Y.; Yang, W.; Zhang, G. Optimization of a New Phase Change Material Integrated Photovoltaic/Thermal Panel with The Active Cooling Technique Using Taguchi Method. Energies 2019, 12, 1022. [Google Scholar] [CrossRef] [Green Version]
  11. Sopian, K.; Yigit, K.S.; Liu, H.T.; Kakaç, S.; Veziroglu, T.N. Performance analysis of photovoltaic thermal air heaters. Energy Convers. Manag. 1996, 37, 1657–1670. [Google Scholar] [CrossRef]
  12. Othman, M.Y.; Yatim, B.; Sopian, K.; Abu Bakar, M.N. Performance studies on a finned double-pass photovoltaic-thermal (PV/T) solar collector. Desalination 2007, 209, 43–49. [Google Scholar] [CrossRef]
  13. Vivek, R.; Tiwawri, G.N. A comparison study of energy and exergy performance of a hybrid photovoltaic double-pass and single-pass air collector. Int. J. Energy Res. 2009, 33, 605–617. [Google Scholar] [CrossRef]
  14. Kumar, R.; Rosen, M.A. Performance evaluation of a double pass PV/T solar air heater with and without fins. Appl. Therm. Eng. 2011, 31, 1402–1410. [Google Scholar] [CrossRef]
  15. Amori, K.E.; Abd-AlRaheem, M.A. Field study of various air based photovoltaic/thermal hybrid solar collectors. Renew. Energy 2014, 63, 402–414. [Google Scholar] [CrossRef]
  16. Kim, S.-M.; Kim, J.-H.; Kim, J.-T. Experimental Study on the Thermal and Electrical Characteristics of an Air-Based Photovoltaic Thermal Collector. Energies 2019, 12, 2661. [Google Scholar] [CrossRef] [Green Version]
  17. Farshchimonfared, M.; Bilbao, J.I.; Sproul, A.B. Channel depth, air mass flow rate and air distribution duct diameter optimization of photovoltaic thermal (PV/T) air collectors linked to residential buildings. Renew. Energy 2015, 76, 27–35. [Google Scholar] [CrossRef]
  18. Kim, J.-H.; Ahn, J.-G.; Kim, J.-T. Demonstration of the Performance of an Air-Type Photovoltaic Thermal (PVT) System Coupled with a Heat-Recovery Ventilator. Energies 2016, 9, 728. [Google Scholar] [CrossRef] [Green Version]
  19. Yu, J.-S.; Kim, J.-H.; Kim, J.-T. A Study on the Thermal Performance of Air-Type BIPVT Collectors Applied to Demonstration Building. Energies 2019, 12, 3120. [Google Scholar] [CrossRef] [Green Version]
  20. Reddy, S.R.; Ebadian, M.A.; Lin, C.X. A review of PV-T systems: Thermal management and efficiency with single phase cooling. Int. J. Heat Mass Transf. 2015, 91, 861–871. [Google Scholar] [CrossRef]
  21. Al-Waeli, A.H.A.; Sopian, K.; Kazem, H.A.; Chaichan, M.T. Photovoltaic/Thermal (PV/T) systems: Status and future prospects. Renew. Sustain. Energy Rev. 2017, 77, 109–130. [Google Scholar] [CrossRef]
Figure 1. Actual and exploded view of the proposed photovoltaic/thermal (PV/T) air collector.
Energies 13 02203 g001
Figure 2. Schematics of the proposed PV/T air collector.
Energies 13 02203 g002
Figure 3. Schematics of the non-uniform cross-section transverse rib installed in the PV/T air collector.
Energies 13 02203 g003
Figure 4. Schematics of the experimental setup.
Energies 13 02203 g004
Figure 5. Variation of ambient temperature and solar intensity with operating time for each experiment day.
Energies 13 02203 g005
Figure 6. Variation of air temperature rise for PV/T air collector at different air mass flow rate.
Energies 13 02203 g006
Figure 7. Variation of heat gain of air and thermal efficiency for PV/T air collector at different air mass flow rate with operating time.
Energies 13 02203 g007
Figure 8. Thermal efficiency for PV/T air collector with respect to air mass flow rate.
Energies 13 02203 g008
Figure 9. Variation of electric generation and electrical efficiency for PV/T air collector at different air mass flow rate with operating time.
Energies 13 02203 g009
Figure 10. Electrical efficiency for PV/T air collector with respect to air mass flow rate.
Energies 13 02203 g010
Figure 11. Variation of overall efficiency for PV/T air collector at different air mass flow rate with operating time.
Energies 13 02203 g011
Figure 12. Overall efficiency for PV/T air collector with respect to air mass flow rate.
Energies 13 02203 g012
Table 1. Specifications of PV module at standard test conditions.
ParametersValue
Module size (mm)1670 × 1000 × 32
Number of cell (ea)60
Electrical efficiency at maximum output power (%)18.6
Temperature coefficient (%/K)−0.39
Maximum output power (W)310
Output voltage at maximum power (V)32.75
Output current at maximum power (A)9.46
Table 2. Experimental conditions for performance evaluation of PV/T air collector.
ParametersValue
Date16 March 202021 March 202018 March 202023 March 2020
Time10:00–16:00
LocationYongdang campus, Pukyong National University, Busan, Korea
(35°6.98′ N latitude, 129°5.39′ E longitude)
Air mass flow rate (kg/s)0.019770.027040.054020.07698
Table 3. Properties of measuring devices.
DeviceModelRangeAccuracy
ThermocoupleT-type−281 to 370 °C   ± 1 °C
PyranometerMS-8020 to 4000 W/m2   ± 2%
Hot-wire anemometerKanomax 6531-2G0.01 to 9.99 m/s   ± 0.015 m/s
Power meterPW3336-020 to 1000 V   ± 0.1%
0 to 50 A   ± 0.1%
Multi-function data loggerAgilent 34972A--
Table 4. Thermal efficiency for PV/T air collector at different air mass flow rate with operating time.
TimeAir Mass Flow Rate (kg/s)TimeAir Mass Flow Rate (kg/s)
0.019770.027040.054020.076980.019770.027040.054020.07698
10:000.31430.37740.45340.577813:100.37440.40480.55870.5888
10:100.30970.38990.46130.523713:200.37130.41370.5380.5729
10:200.31980.3830.46050.546313:300.36660.42750.53660.5733
10:300.31390.38740.46270.560613:400.36130.44320.54710.5661
10:400.320.38880.47830.547313:500.35990.43730.54090.594
10:500.33180.39460.48940.570114:000.37310.43030.53220.5927
11:000.33520.37610.47050.555314:100.37260.44140.52470.5867
11:100.33890.37780.48570.539114:200.36810.43470.53410.5698
11:200.34770.38150.48530.526714:300.37030.4370.53580.5818
11:300.34860.3740.51520.580514:400.35760.42490.53220.5628
11:400.35960.39680.51690.57814:500.35310.43040.5480.555
11:500.35810.37730.50310.587215:000.36250.43660.55210.5747
12:000.34460.38540.49610.599115:100.35620.44640.5410.5624
12:100.36120.38610.4990.586815:200.34980.43520.54130.564
12:200.35830.40660.51230.575815:300.35360.42460.56670.5649
12:300.35860.38690.5390.561115:400.35370.42160.55180.5333
12:400.35890.38270.53640.57215:500.35810.43890.54250.552
12:500.35950.38350.52450.58316:000.35830.42970.53980.5516
13:000.36640.39240.54060.5706
Table 5. Electrical efficiency for PV/T air collector at different air mass flow rate with operating time.
TimeAir Mass Flow Rate (kg/s)TimeAir Mass Flow Rate (kg/s)
0.019770.027040.054020.076980.019770.027040.054020.07698
10:000.15370.16110.1560.162313:100.14470.13920.14930.1455
10:100.15270.16040.15490.162713:200.14480.13760.15010.1453
10:200.15210.15830.15350.161313:300.14550.13870.15020.1452
10:300.15060.15650.15280.159813:400.14570.13820.15030.1466
10:400.14860.15430.15180.157813:500.14670.13640.15110.1481
10:500.14780.15290.15070.157614:000.14770.13760.15180.1495
11:000.14640.14840.15040.157114:100.14810.13980.15220.1445
11:100.14480.14740.14890.156214:200.14820.14200.15160.1442
11:200.14390.14640.14790.155214:300.14760.14480.14670.1426
11:300.14290.14600.14350.154514:400.14240.14890.14940.1416
11:400.14140.14480.14670.154514:500.14470.15130.14760.1457
11:500.14110.14310.14670.154315:000.14160.15030.14540.1445
12:000.14130.14240.14630.153915:100.13930.14330.14250.1467
12:100.14230.14080.14630.152915:200.13580.13990.13850.1424
12:200.14190.13870.14660.152315:300.13010.13750.13140.1375
12:300.1420.14000.14520.150815:400.12390.13320.12750.1299
12:400.14280.13940.1470.149215:500.11590.12390.12040.1222
12:500.14310.13900.14790.147116:000.11050.12100.11320.1132
13:000.14390.13860.14830.1458

