1. Introduction
Currently, motors are used widely in various industrial fields as key power sources, and their importance is increasing. According to the failure occurrence rates of the parts in a motor, the stator winding is among those most likely to fail, accounting for up to 25% of all failures [
1,
2].
Typically, a stator fault is due to the breakdown of the insulation between turns, and it has been reported that approximately 80% of all electrical failures in the stator are due to the failure of the winding insulation [
3], which, in turn, is due to a combination of mechanical, electrical, thermal, and environmental stresses.
If a stator winding suffers a short-circuit fault (SCF), it can rapidly develop into a more serious fault, such as ground fault or even a fire. Therefore, SCFs are among the most critical faults that must be detected. If an SCF is detected early under relatively minor conditions, then an effective remedy can be taken to avert disaster. Accordingly, an easy and effective method for fault diagnosis is needed to ensure the operating condition of a motor with high reliability.
If an SCF occurs, it could cause significant damage to the stator core. A stator-core quality assessment technique has been reported for evaluating the condition of a stator core [
4]. Fortunately, there has been sufficient research on the detection and diagnosis of SCFs, and many methods have been proposed over the past two decades [
5,
6,
7,
8]. Among these methods, the impulse test is the only test that can find a minor SCF [
9]. Though this test is performed off-line, it is useful for finding faults and assessing the condition of a coil. The impulse test is widely used on site and is still being improved [
10,
11,
12].
In the impulse test, an impulse voltage is applied between the terminals, and the voltage between the windings is measured. The diagnostic method based on the impulse test focuses on the shape of the voltage waveform. Because this shape differs between a healthy winding and one with an SCF, a judgment is made by calculating the area over which two waveforms are out of position. However, the area itself has no physical meaning and cannot be used to diagnose the fault mode (e.g., a one-turn or two-turn SCF).
This paper proposes a novel method for the detailed diagnosis of a slight turn-to-turn SCF in a stator winding. First, an impulse generator that generates a relatively low impulse voltage is developed. This impulse generator is used to conduct an impulse test, and the voltage characteristics are discussed. Subsequently, the coefficients of the equivalent circuit of the impulse test are identified, and particle swarm optimization (PSO) is used to solve the optimization problem to find the optimal solution for the coefficients. Finally, diagnosis is performed based on a support vector machine (SVM) that has high classification ability, and the effectiveness of the proposed method is verified experimentally.
2. Impulse Test
2.1. Equivalent Circuit
In the impulse test (also known as the surge test), an impulse voltage is applied across the target winding of the motor. In this section, impulse tests are carried out, the voltages between terminals are measured, and the characteristics are discussed.
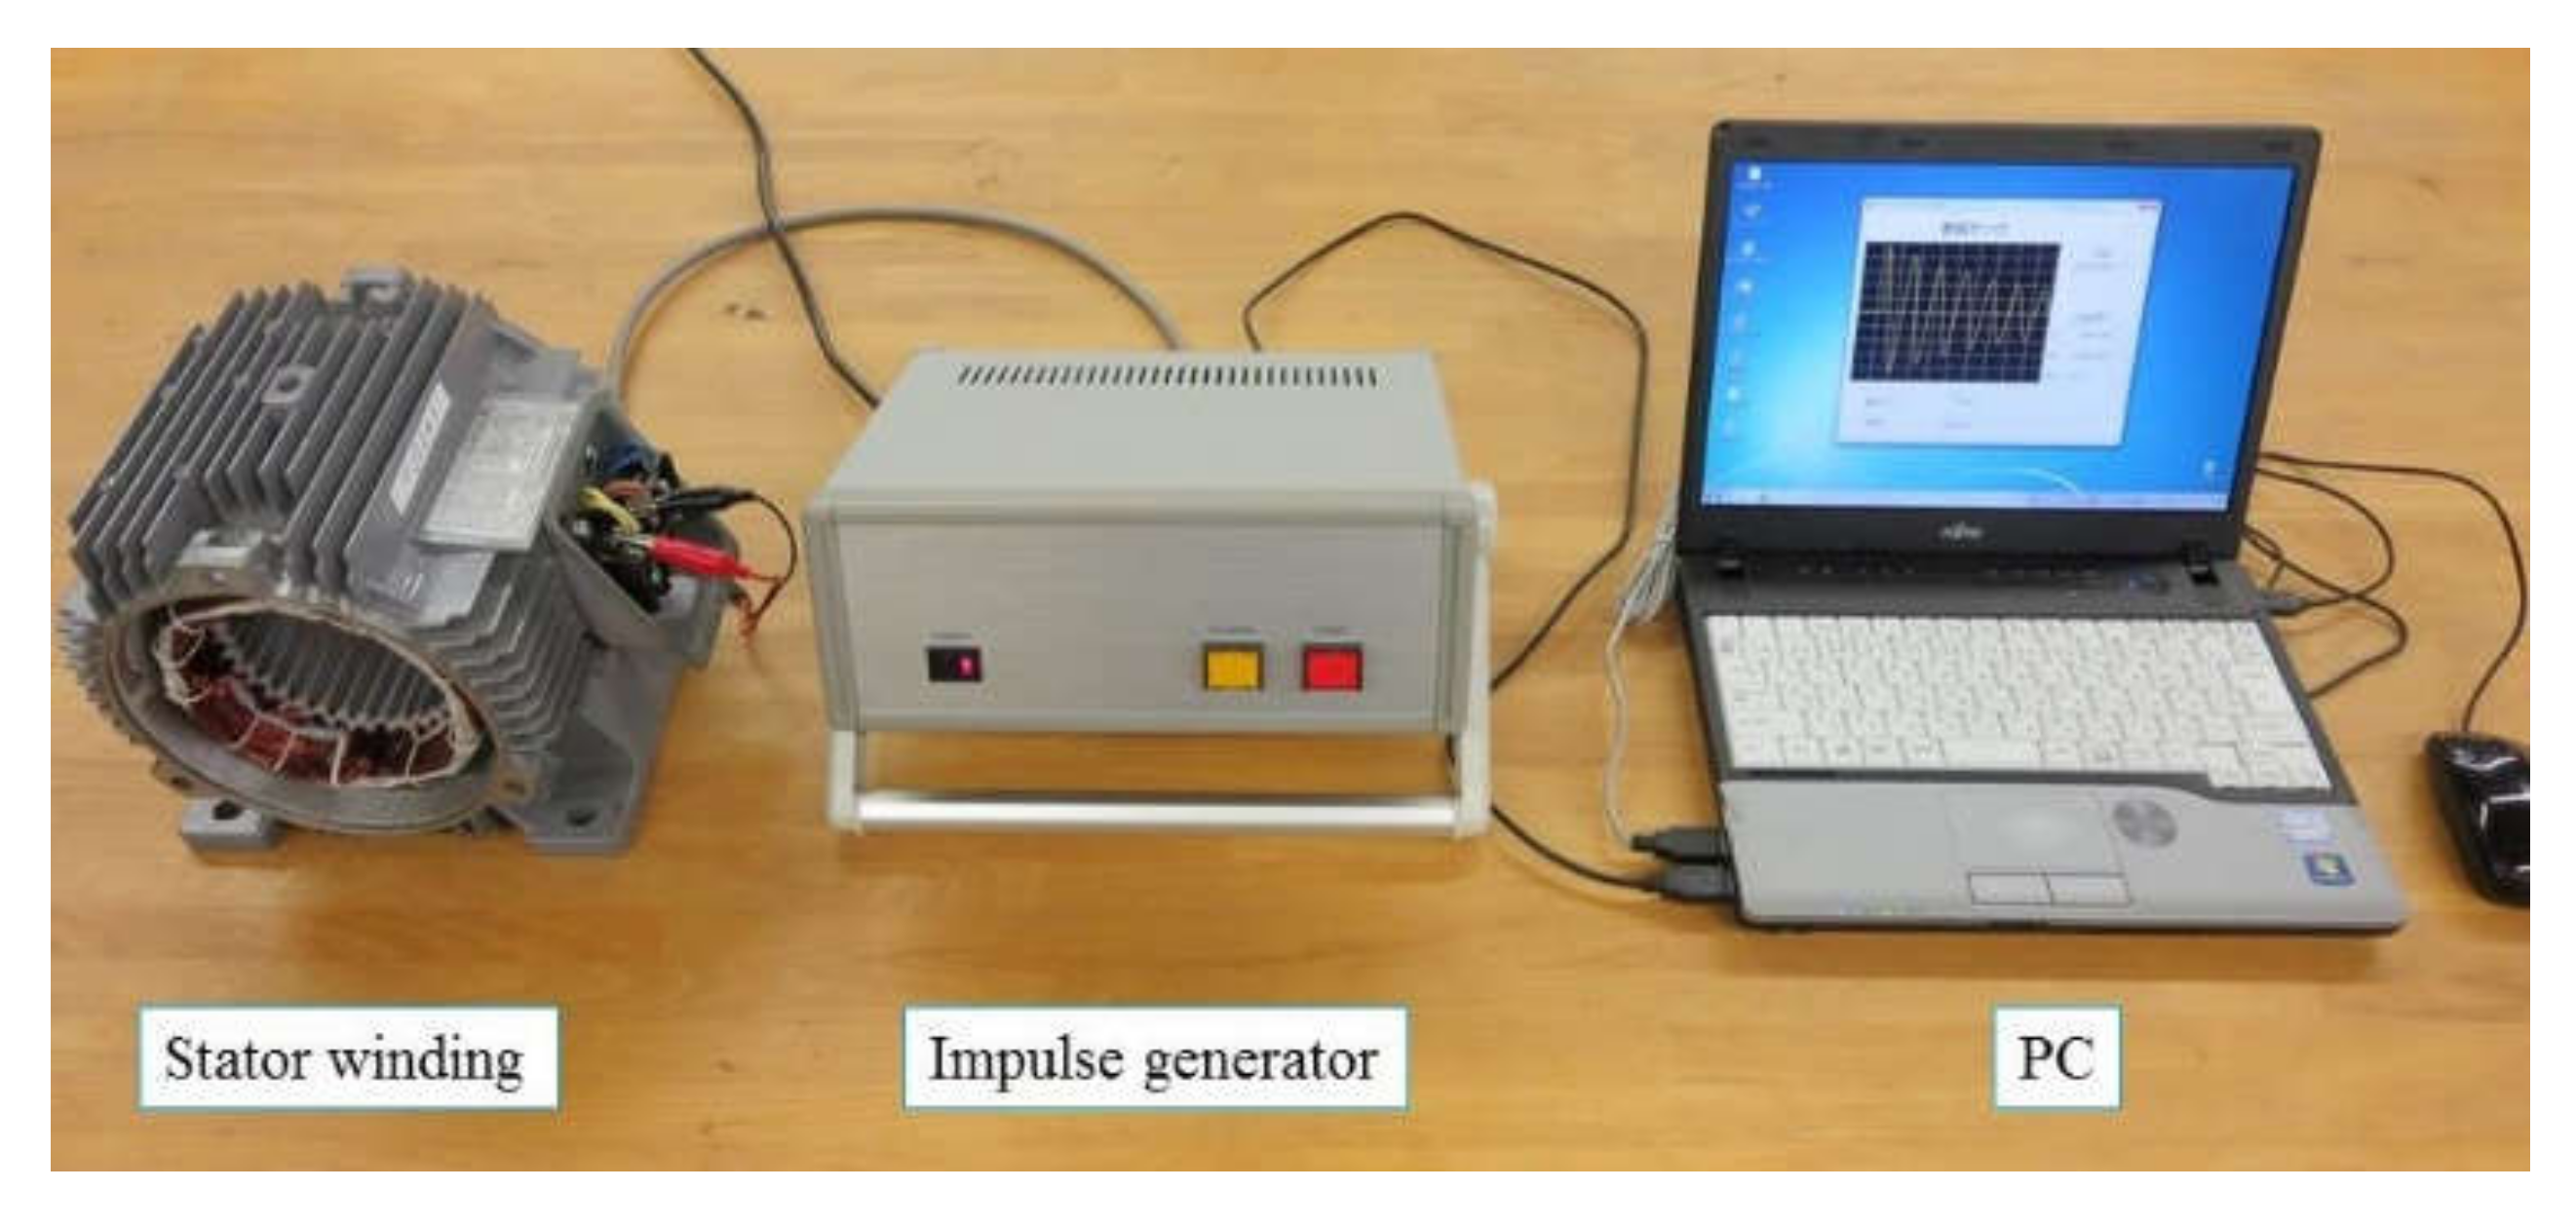
The experimental setup of the impulse test is shown in
Figure 1. The impulse generator comprises a DC power source, a capacitor charged by the power source, and a switch. When the switch is moved to the ON position, the impulse voltage is generated by the capacitor and quickly discharges into the winding. During the discharge, the resistance and inductance of the stator winding form a series circuit.
Since the stator winding configures a star-connection, the motor has three terminals: U, V, and W. An impulse voltage is applied between terminals U and V, V and W, or W and U.
Figure 1 shows a circuit connection when an impulse voltage is applied between terminals U and V (denoted as U–V).
2.2. Measurement of Voltage
The impulse generator is shown in
Figure 2. It can generate a voltage of up to 40 V for application to the terminals. To ensure that the capacitor discharges quickly, a field-effect transistor is used as the switch. The generator contains an analog-to-digital converter; the analog signal of the measured voltage is converted to a digital signal that is then transferred to an external PC via a USB cable and stored on the hard disk of the PC. The sampling time can be varied from 1 to 100
sec but was fixed at 10
sec in this experiment.
2.3. Reproduction of Short-Circuit Fault
The stator winding of an induction motor (1.5 kW, 200 V, 6.2 A, four poles) was used as a specimen. This stator winding has double star connection and 92 turns per phase. This motor was tentatively named motor 1. To confirm the voltage characteristic, a stator winding with SCFs was needed. However, collecting a sufficient number of such windings from actually damaged motors would have taken a long time and been expensive. Therefore, artificially induced SCFs were used in the present study. The SCFs were made by removing the enamel insulation at two points in the winding and connecting them with solder, as shown in
Figure 3. Herein, the connection between the first and second turns of the stator winding is referred to as the one-turn SCF.
2.4. Voltage Characteristics in Impulse Test
Impulse tests were implemented between the terminals of a healthy, one-turn SCF and two-turn SCF stator windings. These results are shown in
Figure 4,
Figure 5 and
Figure 6, respectively. In these figures, the green, the blue, and the red lines correspond to the voltage waveform between the terminals of U–V, V–W, and W–U, respectively. From
Figure 4, it is clear that the three voltage waveforms measured between the terminals of the healthy winding had almost the same shape.
Next, when a one-turn or two-turn SCF occurred in the U phase winding, the shapes of the voltage waveforms of U–V and W–U, including the U phase, significantly changed compared with that of the healthy winding of V–W. This was due to the change of resistance and the inductance of the U phase winding. By contrast, the U–V and W–U waveforms were almost the same.
For comparison of voltage waveforms under different winding conditions, waveforms across the U–V terminals shown in
Figure 4,
Figure 5 and
Figure 6 were merged and are demonstrated in
Figure 7. From
Figure 7, we can see that the frequency of the vibration got higher as the number of short-circuit turn increased.
In this impulse test, under the same winding conditions, the impulse voltage was applied repeatedly 15 times for the healthy and faulty windings. As a result, it was confirmed that the 15 waveform shapes were almost the same under the same winding conditions. The similarity of the waveforms was evaluated by the correlation coefficient, which represented the degree of similarity and took a value between 1 and −1. As the value of the coefficient approached 1, there was a strong correlation between two waveforms. In this evaluation, 15 waveforms obtained from the healthy winding of U–V were used, and the correlation coefficients between the first waveform and each waveform of the remaining 14 waveforms were calculated. The average value was 0.9998. Furthermore, the maximum value and minimum value of the coefficient were 0.9999 and 0.9995, respectively. This means that there was a high similarity between the waveforms. Likewise, average correlation coefficients of 0.9998 and 0.9981 were obtained in the case of the one- and two-turn SCFs in the winding, respectively. From these results, the shapes of the voltage waveforms measured in the impulse test depended on the winding condition, and it is evident that their waveforms had a strong similarity and highly reproducibility under the same winding condition.
3. Parameter Identification
3.1. Feature Extraction
As the first step in diagnosis, the effective features must be extracted, and in this section, the manner in which this is achieved is presented. The experimental setup of the impulse test shown in
Figure 1 is considered. Based on the circuit, suppose that the voltage across the winding is
, the resistance of the circuit is
R, the inductance is
L, and the capacitance is
C. In this circuit, the resistance and the inductance components of the winding account for a large percentage in
R and
L, respectively. Then, the following equation is obtained:
By transforming Equation (1) into a difference equation, the following equation can be obtained:
where
Ts is the sampling time. Furthermore, by rearranging Equation (2), the following equation is obtained:
where
In this study, both LC and RC, which are included in the coefficients and , are regarded as features whereupon parameter identification is performed.
3.2. Parameter Identification Based on PSO
According to Equation (3), the features of
LC and
RC are included in both the numerator and denominator in each
and
. It is impossible to derive
LC and
RC analytically, so they must instead be calculated numerically. For this reason, PSO was used for the parameter identification of (
LC,
RC) in this study. Further, a brief description of PSO is provided. PSO was originally proposed to simulate the flocking behavior of birds and fish [
13]. Because the advantages of PSO are that (i) its algorithm is simple and easy to understand and (ii) it is easy to implement, it is used widely as a tool to solve optimization problems, and several applications for it have been proposed [
14,
15,
16,
17].
The basic idea of the algorithm is to update both the velocity and position of the particles using the following equations:
where
is an inertial weight;
and
are acceleration coefficients;
is a random value between 0 and 1;
and
are the velocity and position, respectively, of the
ith particle at time
;
is the best position of the
ith particle; and
is the swarm’s best position as of time
.
PSO is used to find the optimal (
LC,
RC) that minimize
e described by the following equation:
To identify
LC and
RC, 40 points of
that correspond to one or more cycles of the waveform are used. The parameters used in PSO are given in
Table 1.
The calculation process of PSO is shown in
Figure 8; 100 particles are used in this calculation. Initially, they are arranged in a grid in the solution space (
Figure 8a). Then, they are moved following Equations (6) and (7). As the number of iterations increases, 100 particles converge to a point. After 40 iterations, 100 particles are almost converged at one point (
Figure 8f). In this parameter identification, the best particle that minimizes above-mentioned
e is selected as (
LC,
RC).
4. Feature Distribution Analysis
Parameter identification based on PSO was carried out for the voltage waveforms obtained in the impulse tests. In this parameter identification, the impulse tests were repeated five times, and the waveforms obtained from U–V under each winding condition were used. The feature distributions of
LC and
RC obtained by PSO are shown in
Figure 9. Thus, it can be clarified that the areas in which
LC and
RC are distributed were different and were distributed in almost the same area based on the winding conditions.
Next, as a consistency test, a new motor, named motor 2, was prepared; it was of the same type as motor 1 but was from a different production lot, and the impulse test was performed again. The identified result for
LC and
RC of the new motor is shown in
Figure 10. As can be seen by comparing
Figure 9 and
Figure 10, the features were again distributed in the same area according to the winding conditions. A high similarity and repeatability of voltage waveforms at a given winding condition were also confirmed by the same procedures described in
Section 2.4. In a careful manner, evaluation was carried out using two more motors, and consistency was demonstrated.
For evaluation using another type of motor, a new 2.2-kW motor, namely motor 1, was prepared with a winding whose constitution differed from that of the 1.5-kW motor. One-turn and two-turn SCFs were introduced in the W phase of this motor, and five repeated impulse tests were carried out. By using the waveforms obtained from V–W,
LC and
RC were identified. The result is shown in
Figure 11, from which it can be seen that the values of
LC and
RC tended to be distributed in the same area depending on the winding conditions, as with the result for the 1.5-kW motor.
Considering all results described above, LC and RC reflect the winding condition very well and were highly reliable features to judge a slight turn-to-turn SCF of the winding.
We considered the physical meaning of
LC. A resonance angular frequency
of the serial circuit shown in
Figure 1 is represented as
. The resonance frequency is as follows:
. This means that
LC represents the degree of change in a time axis direction. The resonance frequencies under the healthy, one-turn SCF and two-turn SCF conditions shown in
Figure 4,
Figure 5 and
Figure 6 were 3.05, 3.15, and 3.20 kHz, respectively. On the other hand, the resonance frequencies induced by
LC, which were calculated by PSO, were 3.04, 3.14, and 3.21 kHz, respectively. Those were almost the same. The resonance frequency was easily induced from the parameter
LC.
Thus, instead of using only one feature (that of the area value between healthy and faulty waveforms), using two features (LC and RC) can provide more useful information for diagnosis.
5. Diagnosis of Stator Windings
5.1. Support Vector Machine
The diagnostic tool used in this study was an SVM, which is a supervised machine-learning algorithm [
18]. The SVM concept is based on the margin, which is defined as the distance between the decision boundary and the closest of the data points. The SVM maximizes this margin to find the decision boundary, called the hyperplane, which produces optimal separation of classes. SVMs were originally introduced to classify linear classes. However, as well as performing linear classification, they can efficiently perform nonlinear classification using a kernel. Because the advantages of SVMs are their high discrimination ability and easy implementation for nonlinear discrimination, they are widely used for classification problems and other applications [
19,
20,
21].
There are two types of SVM, namely a hard-margin SVM and a soft-margin SVM. A hard-margin SVM offers a very low degree of misrecognition, whereas a soft-margin SVM allows for some degree of misrecognition. In the present study, a soft-margin SVM was used; this SVM has two important parameters, namely cost and γ parameters. A smaller value of the cost parameter allows for misrecognition, while a larger value of the cost parameter allows for no misrecognition and the SVM behaves as a hard-margin SVM. Meanwhile, the larger the value of γ parameter, the more complex the boundary.
5.2. Diagnosis for 1.5-kW Motor
First, the 1.5-kW motor described in
Section 2 was diagnosed. Five combinations of
LC and
RC obtained from U–V of motor 1 under each winding condition were used as the training data, and 10 combinations of
LC and
RC obtained from motor 2 were used as the verification data. A motor of the same type, namely motor 3, was also prepared, and 10 combinations of
LC and
RC were calculated and were used as verification data.
The SVM-based diagnosis was implemented in the free software
R, which is a programming language that is used widely for statistical computing. The values of cost and γ parameters used in the SVM are given in
Table 2. In general, they need to be chosen optimally. The software
R automatically chooses their certain optimal values.
The diagnostic results for motors 2 and 3 are given in
Table 3,
Table 4,
Table 5 and
Table 6. These results showed that for all three winding conditions, the proposed method correctly diagnosed not only the difference between a healthy winding and a faulty one but also the difference between a one-turn SCF and a two-turn SCF.
5.3. Diagnosis for 2.2-kW Motor
Next, the 2.2-kW motor was diagnosed. As with the 1.5-kW motor, five combinations of LC and RC obtained from V–W of motor 1 under each winding condition were used as the training data, and 10 combinations of LC and RC obtained from motor 2 were used as the verification data. The U phase of motor 2 contained a two-turn SCF.
In this diagnosis, a motor of the same type, namely motor 3, was also prepared, and 10 combinations of LC and RC were calculated under healthy conditions and were used as verification data.
The diagnostic results for motors 2 and 3 are presented in
Table 7,
Table 8 and
Table 9. As shown in
Table 8, the two-turn SCF was incorrectly judged as being a one-turn SCF only once, but the remaining results were recognized correctly. At the very least, the difference between a healthy winding and a faulty winding could be determined correctly. The global accuracy was 99.5% (209/210). The above results showed that the proposed method enables extremely accurate diagnosis, and no problems are expected in its practical use.
5.4. Discussion for Practical Use
As the number of PSO iterations increased,
LC and
RC converged to a certain value, but this required a not insignificant calculation time. To apply this method on site, the number of PSO iterations must be determined by taking into account both the convergence and the calculation time. Because a random function is used in the PSO algorithm, as shown in Equation (6), the solutions differed slightly even when the same data were used. Parameter identification was performed 10 times for one set of data while changing the number of iterations, and the relationship between the number of iterations and the calculated optimum solution of
LC was evaluated. The results are shown in
Figure 12, according to which
LC had yet to converge after 10 iterations. However, the convergence of
LC improved as the number of iterations increased, and
LC approached convergence after 40 iterations. From this result, there should be at least 40 iterations.
Regarding the calculation time, when a 32-bit computer (Core i5, 3.2 GHz) was used for this calculation, it took approximately 10 s until LC and RC had converged after 40 iterations. Though the convergence time depends on parameters such as w, , and in the PSO algorithm, the selection of optimum values of these parameters has yet to be examined, and optimum programing has yet to be considered. It follows from this that calculation time could be reduced by selecting optimum values and applying optimum programing. Another measure that could reduce the calculation time is narrowing the search space of LC and RC. However, studying how to reduce the calculation time is left for future work.
6. Conclusions
This study proposed a novel method—involving an impulse test, parameter identification, and diagnosis—to diagnose slight turn-to-turn SCFs in motor windings. First, impulse tests were carried out, and the voltage characteristics were discussed. The results showed that for the winding of a motor of several kilowatts, the voltage waveforms differed largely between healthy and faulty conditions, even if a low impulse voltage was used instead of a high one of the order of several kilovolts. Specifically, the advantages of using a low impulse voltage instead of a high one are that (i) there is no risk of breaking the insulation of the winding and (ii) the impulse generator can be made smaller. Next, PSO was used to perform parameter identification for features induced by the equivalent circuit of the impulse test.
By representing the difference between healthy and SCF conditions, LC and RC could be explicitly displayed in the two-dimensional distribution of LC and RC. We could visually and easily identify the conditions of the windings by the region where LC and RC existed.
Finally, diagnosis was performed using an SVM. The results showed that even the difference between a one-turn SCF and a two-turn SCF was diagnosed mostly accurately, and the effectiveness of the proposed method was verified.
The resonance frequency of the equivalent circuit of the impulse test is easily induced from the parameter LC. This can be used as an effective index value of the product management of the stator winding.
The application of the proposed method to an incipient fault or pre-short-circuit fault with resistance is a challenging work. The authors would like to try it in the future.
Author Contributions
Conceptualization, H.N.; methodology, H.N.; validation, Y.M.; formal analysis, H.N.; investigation, H.N. and Y.M; resources, H.N. and Y.M.; data curation, H.N. and Y.M.; writing—original draft preparation, H.N.; writing—review and editing, H.N. and Y.M.; visualization, H.N.; supervision, H.N.; project administration, H.N.; funding acquisition, H.N. and Y.M. All authors have read and agreed to the published version of the manuscript.
Funding
This research received no external funding.
Conflicts of Interest
The authors declare no conflict of interest.
References
- Nandi, S.; Toliyat, H.; Li, X. Condition Monitoring and Fault Diagnosis of Electrical Motors—A Review. IEEE Trans. Energy Convers. 2005, 20, 719–729. [Google Scholar] [CrossRef]
- IAS Motor Reliability Working Group. Report of Large Motor Reliability Survey of Industrial and Commercial Installations. IEEE Trans. Ind. Appl. Part I. 1985, IA-21, 865–872. [Google Scholar] [CrossRef]
- Geiman, J. DC Step-Voltage and Surge Testing Motors; Baker Instrum. Co.: Fort Collins, CO, USA, 2007. [Google Scholar]
- Lee, K.; Hong, J.; Lee, K.-W.; Bin Lee, S.; Wiedenbrug, E. A Stator-Core Quality-Assessment Technique for Inverter-Fed Induction Machines. IEEE Trans. Ind. Appl. 2009, 46, 213–221. [Google Scholar] [CrossRef]
- Tallam, R.; Habetler, T.; Harley, R.G. Transient model for induction machines with stator winding turn faults. IEEE Trans. Ind. Appl. 2002, 38, 632–637. [Google Scholar] [CrossRef]
- Lee, S.B.; Tallam, R.M.; Habetler, T.G. A robust, on-line turn-fault detection technique for induction machines based on monitoring the sequence component impedance matrix. IEEE Trans. Power Electron. 2003, 18, 865–872. [Google Scholar] [CrossRef]
- Bouzid, M.B.K.; Champenois, G. New Expressions of Symmetrical Components of the Induction Motor under Stator Faults. IEEE Trans. Ind. Electron. 2012, 60, 4093–4102. [Google Scholar] [CrossRef]
- Seshadrinath, J.; Singh, B.; Panigrahi, B. Incipient Turn Fault Detection and Condition Monitoring of Induction Machine Using Analytical Wavelet Transform. IEEE Trans. Ind. Appl. 2013, 50, 2235–2242. [Google Scholar] [CrossRef]
- Stafford, M.R.; Jackson, H.; Mayo-Wilson, E.; Morrison, A.P.; Kendall, T. Early interventions to prevent psychosis: Systematic review and meta-analysis. IEEE Ind. Appl. Mag. 2013, 346, 34–40. [Google Scholar] [CrossRef] [PubMed] [Green Version]
- Stone, G.; Boulter, E.; Culbert, I.; Dhirani, H. Electrical insulation for rotating machines-design, evaluation, aging, testing, and repair—Book Review. IEEE Electr. Insul. Mag. 2004, 20, 65. [Google Scholar] [CrossRef]
- Oliver, J.; Woodson, H.; Johnson, J. A Turn Insulation Test for Stator Coils. IEEE Trans. Power Appar. Syst. 1968, 669–678. [Google Scholar] [CrossRef]
- Grubic, S.; Restrepo, J.; Aller, J.; Lu, B.; Habetler, T.G. A New Concept for Online Surge Testing for the Detection of Winding Insulation Deterioration in Low-Voltage Induction Machines. IEEE Trans. Ind. Appl. 2011, 47, 2051–2058. [Google Scholar] [CrossRef]
- Poli, R.; Kennedy, J.; Blackwell, T. Particle Swarm Optimisation. SSRN Electron. J. 2007, IV, 1942–1948. [Google Scholar] [CrossRef]
- Gaing, Z.-L. A Particle Swarm Optimization Approach for Optimum Design of PID Controller in AVR System. IEEE Trans. Energy Convers. 2004, 19, 384–391. [Google Scholar] [CrossRef] [Green Version]
- Chang, H.-H.; Lin, L.-S.; Chen, N.; Lee, W.-J. Particle-Swarm-Optimization-Based Nonintrusive Demand Monitoring and Load Identification in Smart Meters. IEEE Trans. Ind. Appl. 2013, 49, 2229–2236. [Google Scholar] [CrossRef]
- Yeh, Y.-C.; Tsai, M.-S. Application of PSO for the development and simulation of EV charging time minimization in distribution systems. In Proceedings of the 2015 18th International Conference on Intelligent System Application to Power Systems (ISAP), Porto, Portugal, 11–16 September 2015. [Google Scholar]
- Santos, P.; Macedo, M.; Figueiredo, E.; Santana, C.J.; Soares, F.; Siqueira, H.; Maciel, A.; Gokhale, A.; Bastos-Filho, C.J.A. Application of PSO-based clustering algorithms on educational databases. In Proceedings of the 2017 IEEE Latin American Conference on Computational Intelligence (LA-CCI), Arequipa, Peru, 8–10 November 2017. [Google Scholar]
- Vapnik, V.N. Statistical Learning Theory; John Wiley & Sons: New York, NY, USA, 1998. [Google Scholar]
- Seshadrinath, J.; Singh, B.; Panigrahi, B.K. Single-Turn Fault Detection in Induction Machine Using Complex-Wavelet-Based Method. IEEE Trans. Ind. Appl. 2012, 48, 1846–1854. [Google Scholar] [CrossRef]
- Shi, J.; Lee, W.-J.; Liu, Y.; Yang, Y.; Wang, P. Forecasting Power Output of Photovoltaic Systems Based on Weather Classification and Support Vector Machines. IEEE Trans. Ind. Appl. 2012, 48, 1064–1069. [Google Scholar] [CrossRef]
- Pandarakone, S.E.; Mizuno, Y.; Nakamura, H. Evaluating the Progression and Orientation of Scratches on Outer-Raceway Bearing Using a Pattern Recognition Method. IEEE Trans. Ind. Electron. 2018, 66, 1307–1314. [Google Scholar] [CrossRef]
Figure 1.
Experimental setup of impulse test.
Figure 1.
Experimental setup of impulse test.
Figure 2.
Developed impulse generator.
Figure 2.
Developed impulse generator.
Figure 3.
Reproduction of a short-circuit fault (SCF).
Figure 3.
Reproduction of a short-circuit fault (SCF).
Figure 4.
Waveform of a healthy winding.
Figure 4.
Waveform of a healthy winding.
Figure 5.
Waveform of a one-turn SCF.
Figure 5.
Waveform of a one-turn SCF.
Figure 6.
Waveform of a two-turn SCF.
Figure 6.
Waveform of a two-turn SCF.
Figure 7.
Voltage waveforms across U–V terminals obtained for healthy, one-turn SCF, and two-turn SCF windings.
Figure 7.
Voltage waveforms across U–V terminals obtained for healthy, one-turn SCF, and two-turn SCF windings.
Figure 8.
Calculation process of PSO. (a) Iteration is 0; (b) iteration is 1; (c) iteration is 5; (d) iteration is 10; (e) iteration is 20; and (f) iteration 40.
Figure 8.
Calculation process of PSO. (a) Iteration is 0; (b) iteration is 1; (c) iteration is 5; (d) iteration is 10; (e) iteration is 20; and (f) iteration 40.
Figure 9.
Feature distribution for the 1.5-kW motor 1.
Figure 9.
Feature distribution for the 1.5-kW motor 1.
Figure 10.
Feature distribution for the 1.5-kW motor 2.
Figure 10.
Feature distribution for the 1.5-kW motor 2.
Figure 11.
Feature distribution for the 2.2-kW motor 1.
Figure 11.
Feature distribution for the 2.2-kW motor 1.
Figure 12.
Relationship between number of iterations and value of LC (a feature whereupon parameter identification was performed).
Figure 12.
Relationship between number of iterations and value of LC (a feature whereupon parameter identification was performed).
Table 1.
Parameters of particle swam optimization (PSO).
Table 1.
Parameters of particle swam optimization (PSO).
| Item | Value |
|---|
| Number of Particles | 100 |
| Interactions | 100 |
| w | 0.1 |
| C1 | 0.1 |
| C2 | 0.1 |
Table 2.
Parameters of the support vector machine (SVM).
Table 2.
Parameters of the support vector machine (SVM).
| Item | Value |
|---|
| Type of SVM | Soft Margin SVM |
| Kernel | Radial |
| Cost Parameter | 1 |
| γ Parameter | 0.5 |
Table 3.
Diagnostic results for the 1.5-kW motor 2 (healthy).
Table 3.
Diagnostic results for the 1.5-kW motor 2 (healthy).
| | Winding Condition | U–V | V–W | W–U |
|---|
| Results of Diagnosis | Healthy | 10 | 10 | 10 |
| One-Turn Short-Circuit | 0 | 0 | 0 |
| Two-Turn Short-Circuit | 0 | 0 | 0 |
Table 4.
Diagnostic results for the 1.5-kW motor 2 (one-turn short-circuit in the U phase winding).
Table 4.
Diagnostic results for the 1.5-kW motor 2 (one-turn short-circuit in the U phase winding).
| | Winding Condition | U–V | V–W | W–U |
|---|
| Results of Diagnosis | Healthy | 0 | 10 | 0 |
| One-Turn Short-Circuit | 10 | 0 | 10 |
| Two-Turn Short-Circuit | 0 | 0 | 0 |
Table 5.
Diagnostic results for the 1.5-kW motor 2 (two-turn short-circuit in the U phase winding).
Table 5.
Diagnostic results for the 1.5-kW motor 2 (two-turn short-circuit in the U phase winding).
| | Winding Condition | U–V | V–W | W–U |
|---|
| Results of Diagnosis | Healthy | 0 | 10 | 0 |
| One-Turn Short-Circuit | 0 | 0 | 0 |
| Two-Turn Short-Circuit | 10 | 0 | 10 |
Table 6.
Diagnostic results for the 1.5-kW motor 3 (healthy).
Table 6.
Diagnostic results for the 1.5-kW motor 3 (healthy).
| | Winding Condition | U–V | V–W | W–U |
|---|
| Results of Diagnosis | Healthy | 10 | 10 | 10 |
| One-Turn Short-Circuit | 0 | 0 | 0 |
| Two-Turn Short-Circuit | 0 | 0 | 0 |
Table 7.
Diagnostic results for the 2.2-kW motor 2 (healthy).
Table 7.
Diagnostic results for the 2.2-kW motor 2 (healthy).
| | Winding Condition | U–V | V–W | W–U |
|---|
| Results of Diagnosis | Healthy | 10 | 10 | 10 |
| One-Turn Short-Circuit | 0 | 0 | 0 |
| Two-Turn Short-Circuit | 0 | 0 | 0 |
Table 8.
Diagnostic results for the 2.2-kW motor 2 (two-turn short-circuit in the U phase winding).
Table 8.
Diagnostic results for the 2.2-kW motor 2 (two-turn short-circuit in the U phase winding).
| | Winding Condition | U–V | V–W | W–U |
|---|
| Results of Diagnosis | Healthy | 0 | 10 | 0 |
| One-Turn Short-Circuit | 0 | 0 | 1 |
| Two-Turn Short-Circuit | 10 | 0 | 9 |
Table 9.
Diagnostic results for the 2.2-kW motor 3 (healthy).
Table 9.
Diagnostic results for the 2.2-kW motor 3 (healthy).
| | Winding Condition | U–V | V–W | W–U |
|---|
| Results of Diagnosis | Healthy | 10 | 10 | 10 |
| One-Turn Short-Circuit | 0 | 0 | 0 |
| Two-Turn Short-Circuit | 0 | 0 | 0 |
© 2020 by the authors. Licensee MDPI, Basel, Switzerland. This article is an open access article distributed under the terms and conditions of the Creative Commons Attribution (CC BY) license (http://creativecommons.org/licenses/by/4.0/).


