Article

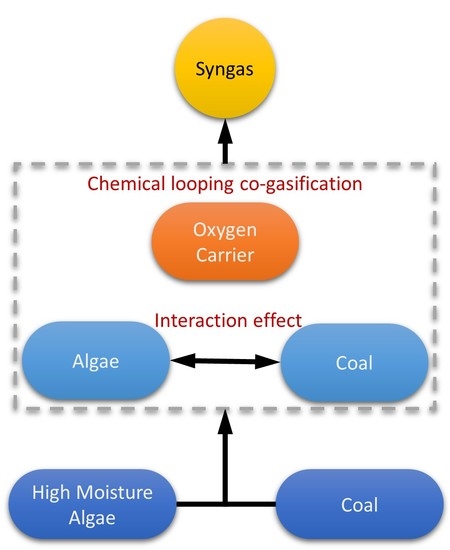
Chemical Looping Co-Gasification Characteristics of Cyanobacterial/Coal Blends

1
Key Laboratory of Energy Thermal Conversion and Control of Ministry of Education, School of Energy and Environment, Southeast University, Nanjing 210096, China
2
Department of Chemical and Biomedical Engineering, West Virginia University, Morgantown, WV 26506, USA
*
Author to whom correspondence should be addressed.
Energies 2020, 13(9), 2352; https://doi.org/10.3390/en13092352
Submission received: 16 April 2020 / Revised: 3 May 2020 / Accepted: 7 May 2020 / Published: 8 May 2020
(This article belongs to the Collection Feature Papers in Bio-Energy)

Abstract

:
The frequent outbreak of cyanobacteria bloom results in an urgent need for the resource utilization of cyanobacteria. However, the development of routine thermal treatment (i.e., gasification and pyrolysis) is hindered by the issue of high moisture content. In order to minimize the dewatering requirement, this study investigated the chemical looping co-gasification of the cyanobacteria/coal mixture. The results showed that the residual moisture of cyanobacteria not only could serve as the gasifying agent of coal, but also presented a better gasification effect than the injecting steam. Meanwhile, blending cyanobacteria also improved the performance of coal chemical looping gasification in terms of the syngas quality, gasification rate, and carbon conversion efficiency. Cyanobacteria pyrolysis supplied abundant hydrocarbons and hydrogen-rich gases. The highest syngas yield of 1.26 Nm3/kg was obtained in the mixture fuel of 46 wt.% cyanobacteria and 54 wt.% coal under a 0.3 oxygen carrier-to-fuel ratio. A slight interaction effect was observed in the pyrolysis process, in which the reactivity of coal pyrolysis was enhanced by the oxygenated groups of cyanobacteria volatile. The dominant motive of the interaction effect was the catalytic effect of alkali metals of cyanobacteria ash on the coal gasification. However, the formation of aluminosilicates deactivated alkali metals and further inhibited the char gasification. The intensity of interaction effect was demonstrated to be highly relevant with the (Na + K)/Al molar ratio of ash. The most prominent interaction effect occurred for the sample with 82 wt.% cyanobacteria, but a negative interaction was observed in the sample with 10 wt.% cyanobacteria. Both homogeneous reaction and shrinking core models showed the excellent fitting performance in the char gasification process. However, these two models could not be applied to the initial pyrolysis process because of the intricate mechanisms.

Graphical Abstract

1. Introduction

The global economy and ecosystem are not only vulnerable to industrial pollutants, but also the natural toxins released from the frequent outbreak of cyanobacteria blooms in freshwaters [1]. Cyanobacteria with an extremely high growth rate can produce a diverse mixture of waterborne toxic metabolites into surface waters [2]. This poses severe threats to drinking water resources, aquatic organisms, and economic development [3]. Physical collection is the primary treatment of cyanobacteria in broad waters at present. However, the collected cyanobacteria could reach thousands of tons a day, which results in an urgent need to realize the harmless treatment and resource utilization of these toxic cyanobacteria [4].
Among numerous approaches of cyanobacteria treatment, thermochemical processes are considered as some of the most promising ways because of the associated low pollution, high social benefits, and the maximum energy/product recovery efficiency. Cyanobacteria have abundant volatiles and high gasification reactivity, being an ideal bio-fuel for syngas production. The typical high heating value of dry-based cyanobacteria is about 17.25 MJ/Kg, comparable to lignite coal. The main thermal applications of cyanobacteria focus on the production of syngas, biodiesel, and bio-hydrogen [5]. However, the development has been facing several issues, including high moisture content, low energy density, and high NOx emissions [6]. The energy-intensive dewatering process is the biggest obstacle among these drawbacks. Moisture management and a cost-effective strategy are critical in the thermal process of cyanobacteria treatment. At present, high-moisture feedstocks can be directly gasified by several strategies, including fluidized bed gasification, hydrothermal liquefaction, and subcritical water extraction. Employing a high-moisture fuel in the fluidized bed can increase the heating value of syngas, improve the combustible gas constituents, and inhibit NOx emissions [7]. However, the high moisture of fuel also brings challenges in terms of the poor economy, unstable bed temperature, and intensive fluidization [8]. Hydrothermal liquefaction is similar to subcritical water extraction. These technologies expend the pressurized water in the high-moisture feedstock to produce gas products and bio-oil crude. However, a further application is hindered by the relatively low process efficiency and high levels of heteroatoms in products [6].
Applying the co-gasification of cyanobacteria/coal mixture with the chemical looping process is an innovative method to improve the economy of cyanobacteria biofuel. The chemical looping gasification (CLG) can avoid the high energy penalty processes of gas separation and pure oxygen production. The economically unfavorable cryogenic air separation unit (ASU) would consume 12 to 15 percent of the overall capital cost of the gasification plant [9]. The conventional gasification is spatially divided into two sub-steps in the CLG, in which the oxygen demand and heat of gasification are provided by the circulated oxygen carrier (OC) particles between two reactors. The separation strategy of the CLG improves the process exergy efficiency, achieves an N2-free atmosphere for fuel gasification, and combines the functions of production and purification. More importantly, cyanobacteria dewatering can be avoided in the chemical looping co-gasification with coal. The cyanobacteria’s moisture can partially replace the injecting steam required in the CLG because the cyanobacteria’s moisture is an ideal gasifying agent of coal. The energy initially supplied to heat the injecting steam is sufficient for cyanobacteria dehydration in the furnace. Employing the high-moisture cyanobacteria also makes sense for operating the chemical looping process in a water shortage area. Based on the result of an analog simulation [10], above 72% system efficiency was achieved in the syngas chemical looping of algae with high moisture content. Besides, the OC has advantages in increasing the syngas quality and accelerating tar cracking because of the selectivity conversion of OC. The issue of NOx emissions also can be improved in the CLG, in which NOx evolution is inhibited by the low-temperature condition and reducing atmosphere [11].
From the standpoint of coal CLG, blending cyanobacteria can tremendously improve gasification performance. The major problem of coal CLG is the incomplete char conversion originating from the low reactivity of char gasification [12]. Although the reduced OCs (transition metals) had a catalytic function in steam gasification reactions, the char gasification is still the limiting step of the CLG. The improved coal gasification has been proven in the conventional co-gasification with respect to the catalytic effect of alkali and alkaline earth metals in biomass ash [13]. The basic mechanism underlying the interaction effect is the melting of alkali metal carbonates/hydroxides, followed by absorption on the surface of the char micropore [14]. The molten film of alkali metal carbonates/hydroxides can accelerate the oxygen transfer from the gasifying agent (CO2 and H2O) to the char surface [15]. Most research achieves the enhanced carbon conversion, higher syngas yield, and minimized CO2 production during the co-gasification of coal and biomass. Therefore, applying cyanobacteria with the coal CLG undoubtedly creates a win-win situation for the economy of cyanobacteria bio-fuel and the efficiency of coal CLG.
Enormous research efforts have been made in the conventional gasification and co-gasification of cyanobacteria/coal mixture. However, less attention has been paid to the CLG process. This study aims to evaluate the influence of the OC and cyanobacteria moisture on the chemical looping co-gasification of cyanobacteria/coal blends. It is expected to provide a basis for further research on the application of the interconnected fluidized bed and the renewable recovery of active nitrogen and phosphorus from cyanobacteria. Thermogravimetric analysis (TGA) coupled with Fourier transform infrared spectrometer (FTIR) was employed to evaluate the co-gasification behaviors, including thermogravimetric characteristics, gas product evolution, interaction effect, and kinetic parameters. The influence of the oxygen carrier-to-fuel ratio, fuel blending ratio, and cyanobacteria moisture was analyzed in a batch fluidized bed.

2. Experiment

2.1. Material

The raw cyanobacteria used in this work were collected from Taihu Lake, China. The part of the raw cyanobacteria was dewatered in a drying oven. After several trials, the drying temperature of 65 °C and a duration of six hours were determined as the stable values to prevent the hydrocarbons from escaping during the dewatering process. However, a small amount of moisture was still reserved in the dewatered cyanobacteria under these drying conditions. Hydrocarbon would escape when the drying temperature was above 80 °C and the duration was longer than eight hours. Subsequently, the dewatered cyanobacteria were crushed and sieved to obtain 0.1–0.3 mm particles. The rest of the raw cyanobacteria with high moisture content was hermetically stored in cold storage. The lignite coal used in this work was produced in Xiaolongtan, China. The grinding and sieving process was also required for the lignite coal to obtain particles with a size distribution of 0.1–0.3 mm. Cyanobacteria and lignite coal were characterized by proximate analysis, ultimate analysis, and ash analysis, as shown in Table 1. The proximate analysis of cyanobacteria and coal was determined as the average value of three measurements without a significant difference. The significant differences between coal and cyanobacteria were in terms of the volatile matter, fixed carbon, and ash compositions. Cyanobacteria contained more volatile matter, while coal had higher fixed carbon content. The coal ash was primarily composed of inert components, silica, and alumina. The cyanobacteria ash was found with abundant phosphorus, alkali metals, and alkaline earth metals.
The mixture fuels used in the TGA tests were prepared by the lignite coal and dewatered cyanobacteria. These mixture fuels were labeled as 82CYA, 64CYA, 46CYA, 28CYA, 10CYA, corresponding to the cyanobacteria mass fractions of 82 wt.%, 64 wt.%, 46 wt.%, 28 wt.%, and 10 wt.%, respectively. Besides, the single cyanobacteria and single coal were labeled as CYA and coal, respectively.
Natural hematite from South African was selected as the OC. The raw hematite mineral was crushed and sieved into particles with a size distribution of 0.3–0.45 mm. Subsequently, the OC particles were calcined in a muffle oven under air atmosphere at 900 °C for 12 h. The bulk density of OC particles was measured as 1986 kg/m3. The XRF analysis showed that the hematite OC mainly consisted of 83.21 wt.% Fe2O3 (active phase), 7.06 wt.% SiO2, and 5.13 wt.% Al2O3.

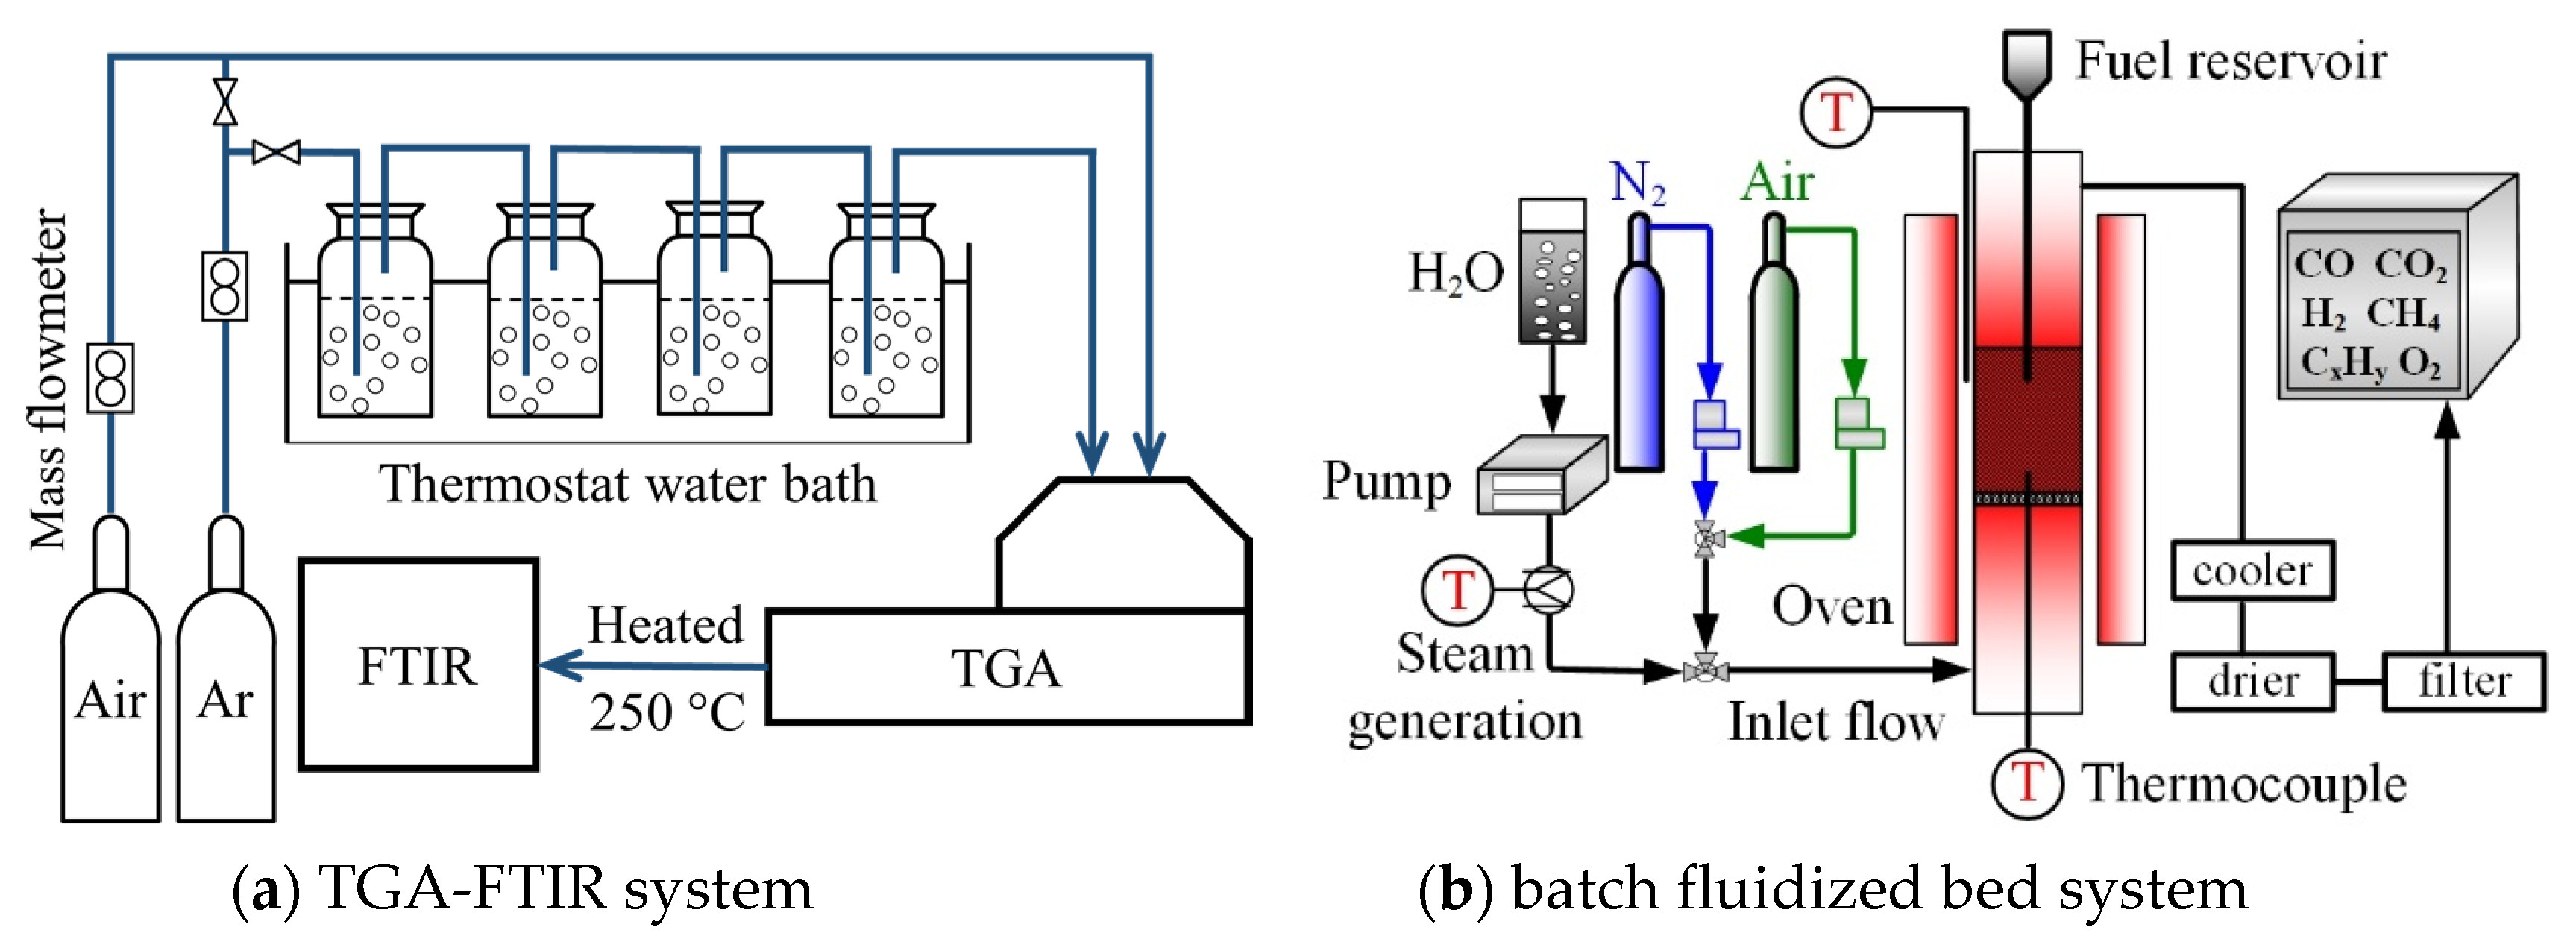
2.2. Experimental Procedure

The TGA-FTIR apparatus consisted of a simultaneous thermal analyzer (SDT 650, TA Instruments Company, USA) and an FTIR spectrometer (Bruker), as shown in Figure 1. Around 40 ± 1 mg of fuel and OC particles were previously weighed on a precise balance to obtain the mixture with a fuel/OC mass ratio of 2:1. Subsequently, the fuel/OC mixture was adequately mixed and loaded into a hollow alumina crucible. It then was heated in the TGA with a 20 °C/min heating rate from room temperature to 900 °C and followed by an isothermal holding for 30 minutes. The mixed gas of argon and steam was introduced with a flow rate of 100 mL/min during the whole experiment process. The argon stream was saturated with water in four connected two-necked flasks to prepare the mixed gas of argon/steam, as shown in Figure 1. A thermostat water bath was employed to keep flasks at a constant temperature of 50 °C. The gas products from TGA were analyzed by the FTIR spectrometer, which had an infrared absorption band of 4000–400 cm–1 and a resolution of 4 cm–1. The connected gas-line between TAG and FTIR was heated to 250 °C to prevent the condensation of steam and tar.
The batch fluidized bed system was mainly composed of a fluidized bed reactor, gas feeding devices, and an on-line gas analyzer, as shown in Figure 1. The center of the batch fluidized bed was a quartz tube reactor of 1340 mm in height and 32 mm in internal diameter. Around 55 g of bed material, consisting of OC and slice sand, were loaded on a porous quartz distributor and filled the cross-section of the quartz tube. An electric heater coupling with a preservation furnace was arranged around the reactor to supply the heat during the operation and heating-up process. Two K-type thermocouples were used to measure the operation temperature. One thermocouple was placed in the center of the reactor, and the other was located between the reactor and furnace. The air flow of 1 L/min was introduced into the reactor during the heating-up period. When the desired temperature of 900 °C was almost reached, the fluidization agent was rapidly switched to the N2 flow of 2 L/min. In order to improve the stability of the steam fluidization, pneumatic injecting was employed to feed the preheated steam of 170 °C via the bottom distributor plate. The injected steam was prepared from the deionized water and heated by the electric heating belt. A constant flow pump was employed to control the steam flow as 20 g/h. Subsequently, two grams of fuel were fed into the reaction zone from the fuel reservoir. The gas analyzer (Gasboard 9020) was used for the on-line gas analysis; the analyzer could measure the gas concentrations of CH4, CO2, CxHy, CO, H2, and O2 by several non-dispersive infrared sensor (NDIR) cuvettes. Some operational details were conducted to ensure the reproducibility of fluidized bed tests, including ensuring the gas distribution uniformity, minimizing the instrument vibration, and stabilizing the backpressure of the reactor outlet.

2.3. The Interaction Index MR

The index MR [16] is defined as the fraction of the mean of the absolute error to the mean of the calculated value, as shown in Equation (1). The MR index can comprehensively characterize the dispersion degree between theoretical and experimental weight loss rates. It also can ascertain that the interaction is beneficial or negative. If the MR is a positive value, the beneficial interaction effect exists with more reacted samples in the temperature region.
MR = i = 1 n ( W e x p i W t h i ) n · 1 X c a l m e a n
where W e x p i and W t h i are the experimental and theoretical weight loss rate, respectively; W c a l m e a n is the average value of the theoretical value of weight loss rate.
The theoretical weight loss rate [17] was calculated by the following linear correlation:
W t h = X c o a l W c o a l + X C Y A W C Y A
where X c o a l and X C Y A are the mass fraction of coal and cyanobacteria in the blends; W c o a l and W C Y A represent the mass losses from the TG profiles of individual samples with the same experimental condition as the mixture.

2.4. Kinetic Models

Two kinetic models were compared in this study, including the homogeneous reaction model (HRM) and the shrinking core model (SCM).
HRM regards all heterogeneous gas-solid reactions as a single chemical process. The gas diffusion was supposed as uniform within the entire particle, including the outside and inside of the particle surface [18]. The reaction surface area was also assumed to be linearly decreasing with the conversion process [19]. The overall reaction rate of HRM is shown in Equation (3) [20]. After a series of transformations, HRM can be expressed in Equation (4) [20].
d α / d t = K f ( α ) = K H R M ( 1 α )
where K is the Arrhenius-type kinetic constant and α is the fraction of solid fuel conversion.
α = 1 exp ( R T 2 β E A e ( E / R T ) )
where A and E are the pre-exponential factor and the activation energy, respectively; β is the heating rate.
The SCM proposed by Szekely and Evans [21] is based on the supposition that the porous fuel particles comprise an assembly of uniform non-porous grain. The space between the neighboring grains constitutes the porous network of fuel particles. The gasifying agent diffuses into fuel particles through this porous network [20]. The overall reaction rate of SCM is shown in Equation (5) [21].
d α / d t = K f ( α ) = K S C M ( 1 α ) 3
With the substitution of the temperature profile, SCM can be expressed as the time profile of fractional fuel conversion, as Equation (6) shows [20]:
α = 1 ( 1 R T 2 3 β E A e ( E / R T ) ) 3

2.5. Data Evaluation

2.5.1. Gas Yield

The gas yield ( G i , Nm3/kg) is defined as the volume of gas products generated from the unit fuel, as shown in Equation (7) [22].
G i = N N 2 ,   i n 1 y i · t · y i / m f u e l
where N N 2 ,   i n is the inlet flow of nitrogen; t is the reaction duration; m f u e l is the mass of solid fuel; y i is the gas volume fraction ( i = CO, CO2, H2, CH4, and CxHy). N N 2 ,   i n 1 y i is used to calculate the volume flow of outlet gas by the nitrogen balance.

2.5.2. Carbon Conversion Efficiency

Carbon conversion efficiency ( X C , %) was used to evaluate the degree of carbon utilization. X C is defined by the fraction of gaseous carbon at the outlet stream with respect to the total carbon amount of the fuel feed, as shown in Equation (8) [9].
X C = 0 t N o u t · ( y C O + y C O 2 + y C H 4 + y C x H y ) d t 22.4 · m ˙ s f   ·   x C , f u e l
where m ˙ s f   is the mass of solid fuel and   x C , f u e l is the carbon fraction of solid fuel.

2.5.3. Oxygen Carrier-to-Fuel Ratio

The oxygen carrier-to-fuel ratio ( φ ) is defined as the fraction of the available oxygen provided by OC to the stoichiometric oxygen demand of the fuel feed, as shown in Equation (9) [9].
φ = m ˙ O C · R O C m ˙ s f · Ω s f
where m ˙ O C is the OC mass, R O C is the oxygen transport capacity of OC, and Ω s f is the stoichiometric oxygen demand of the solid fuel.

3. Results and Discussion

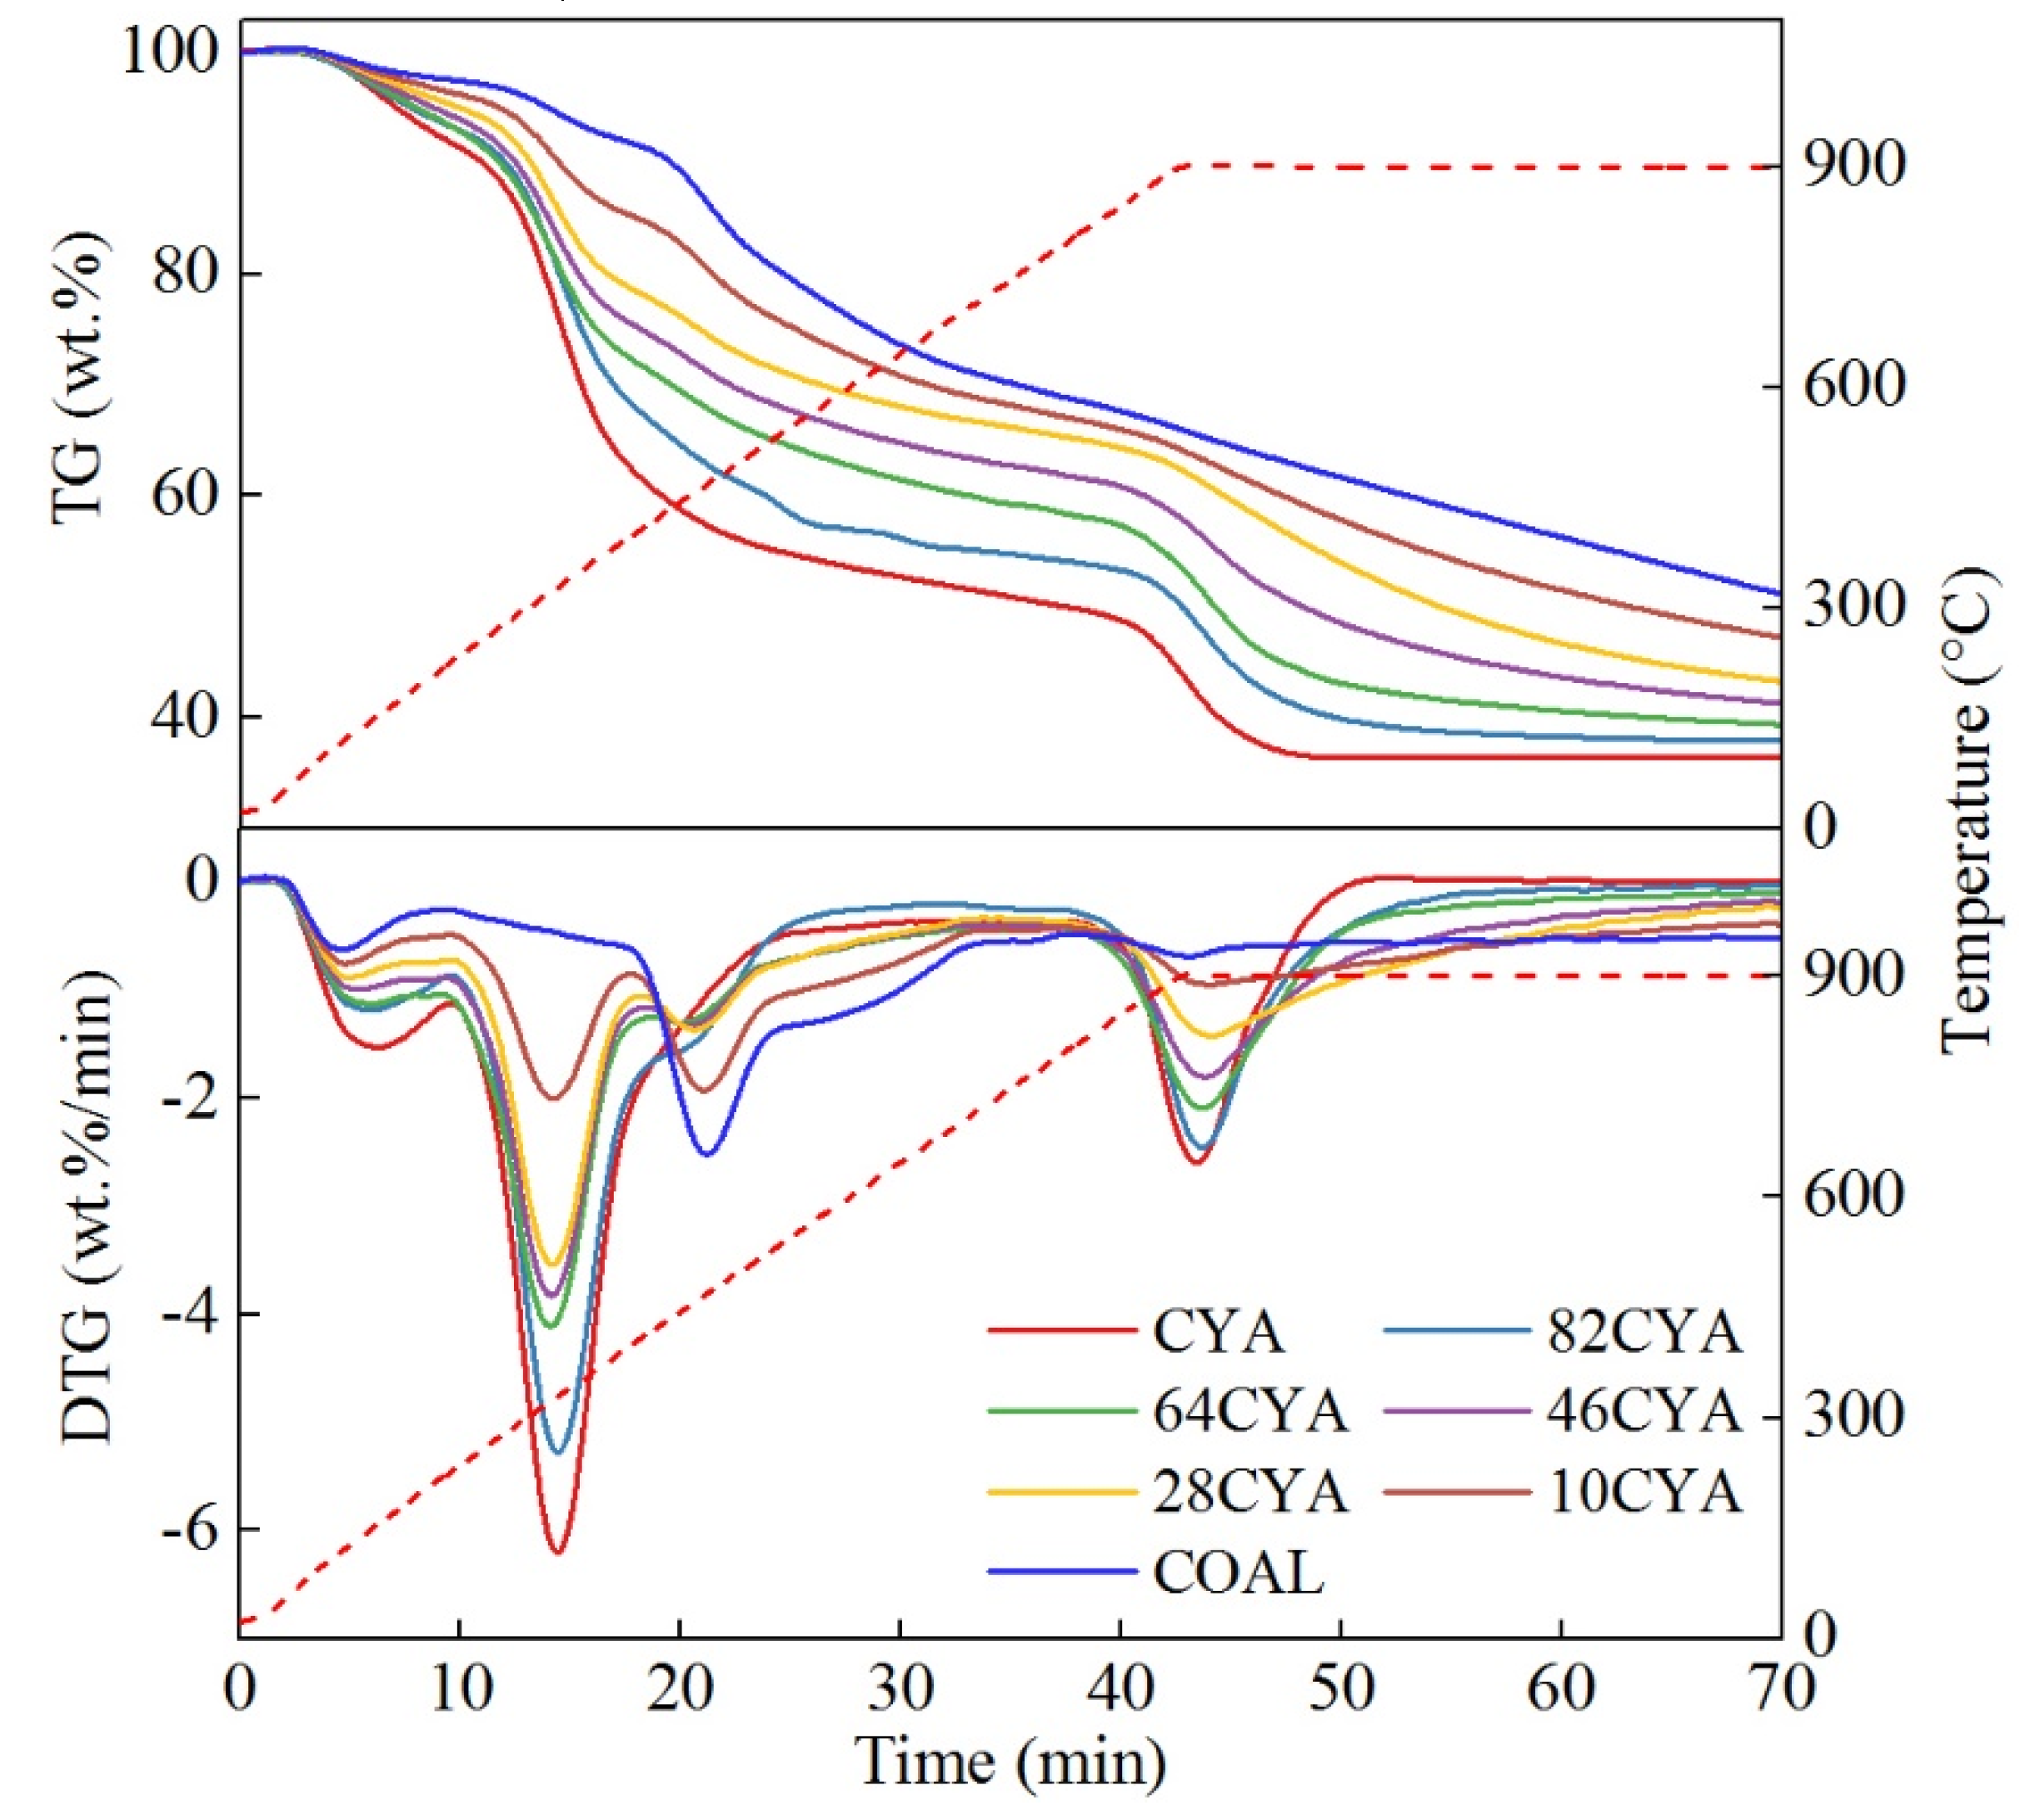
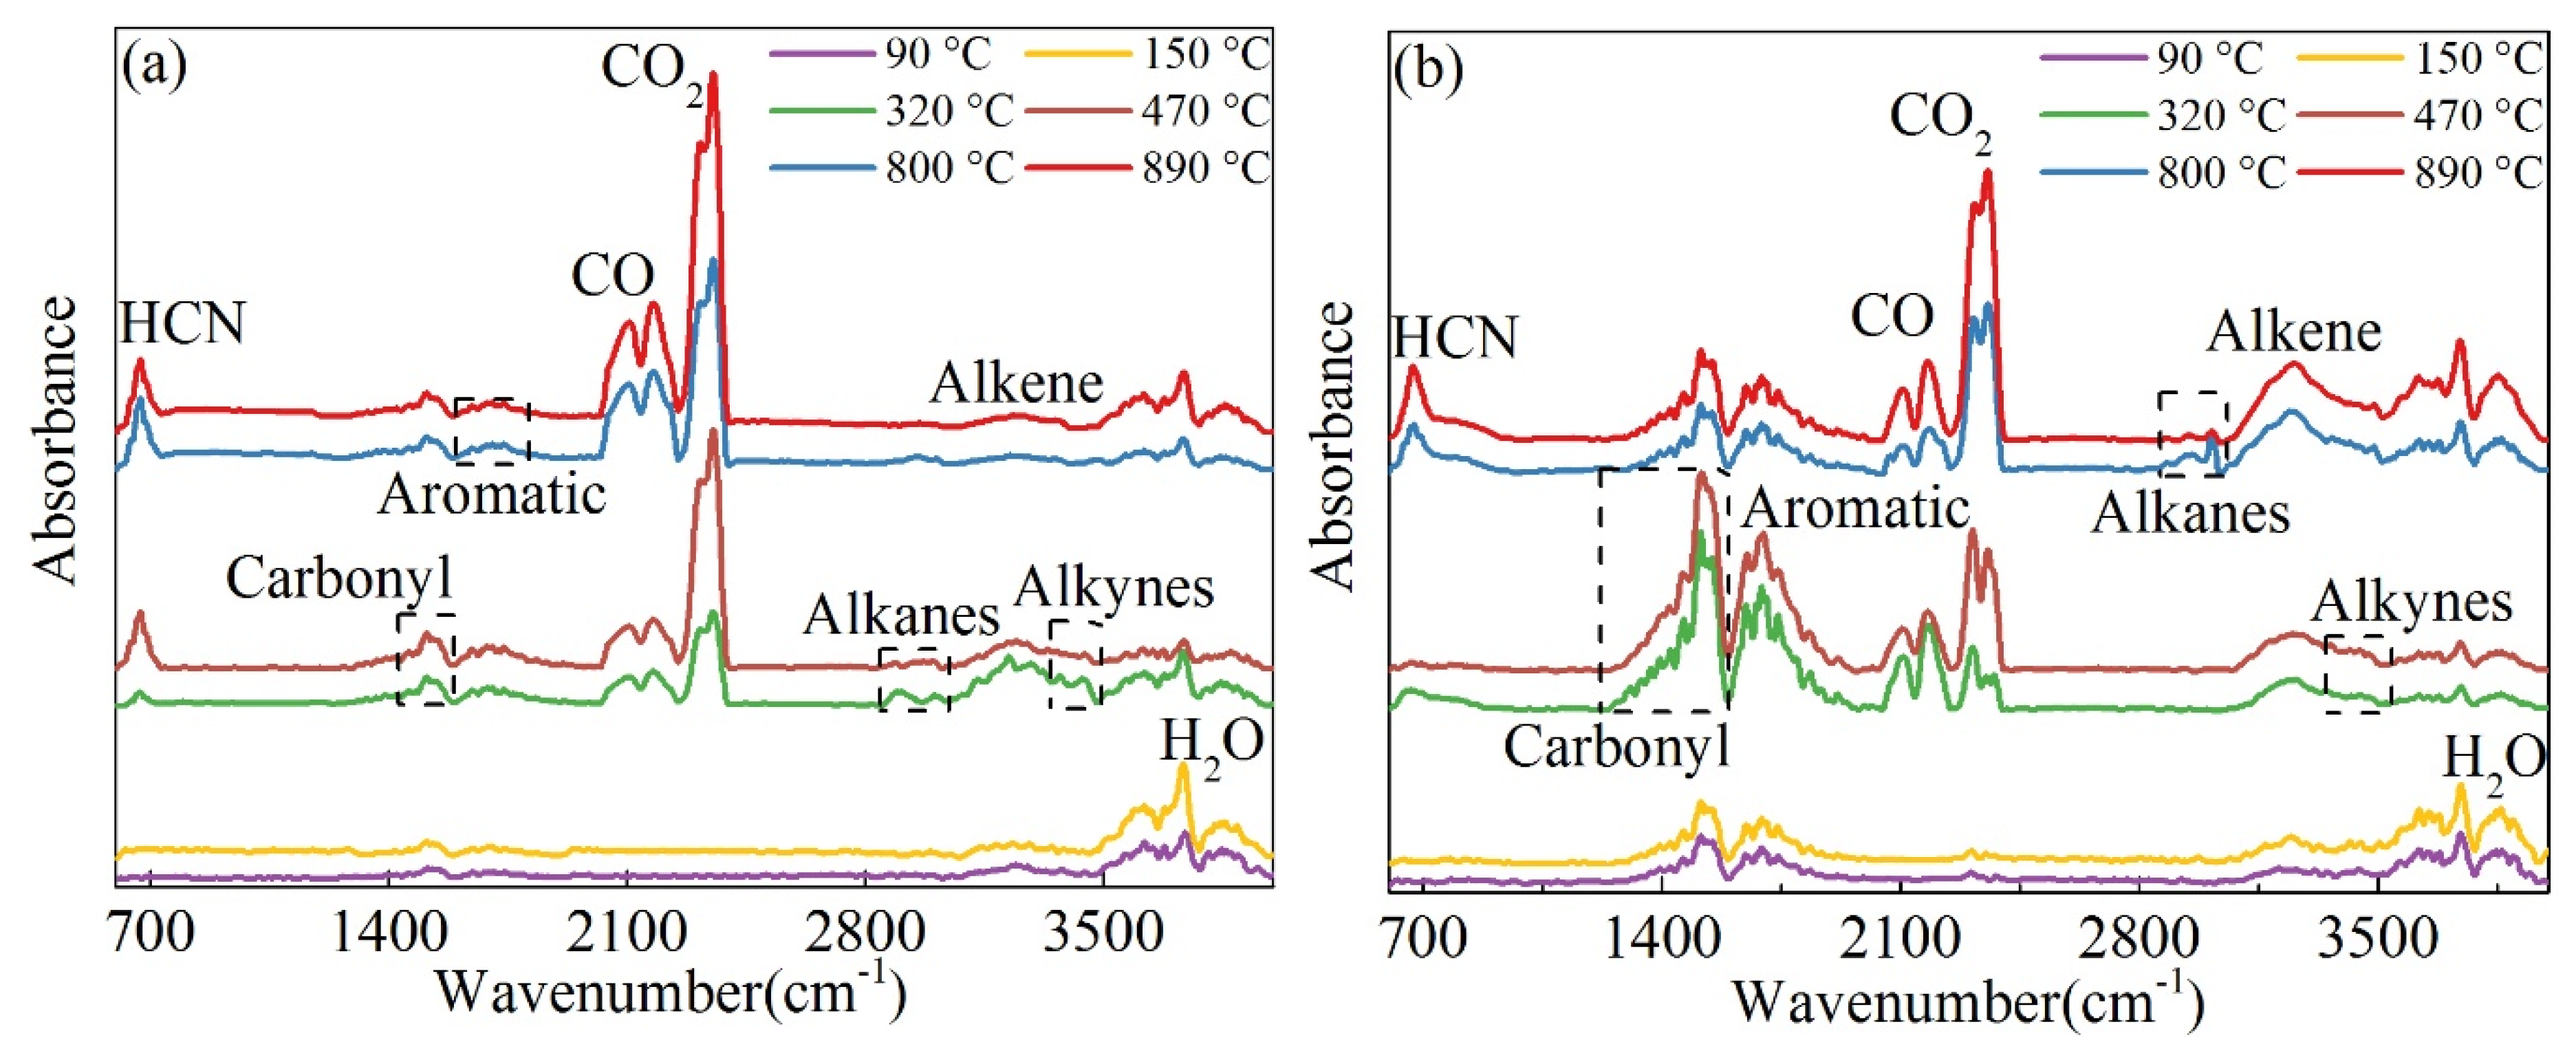
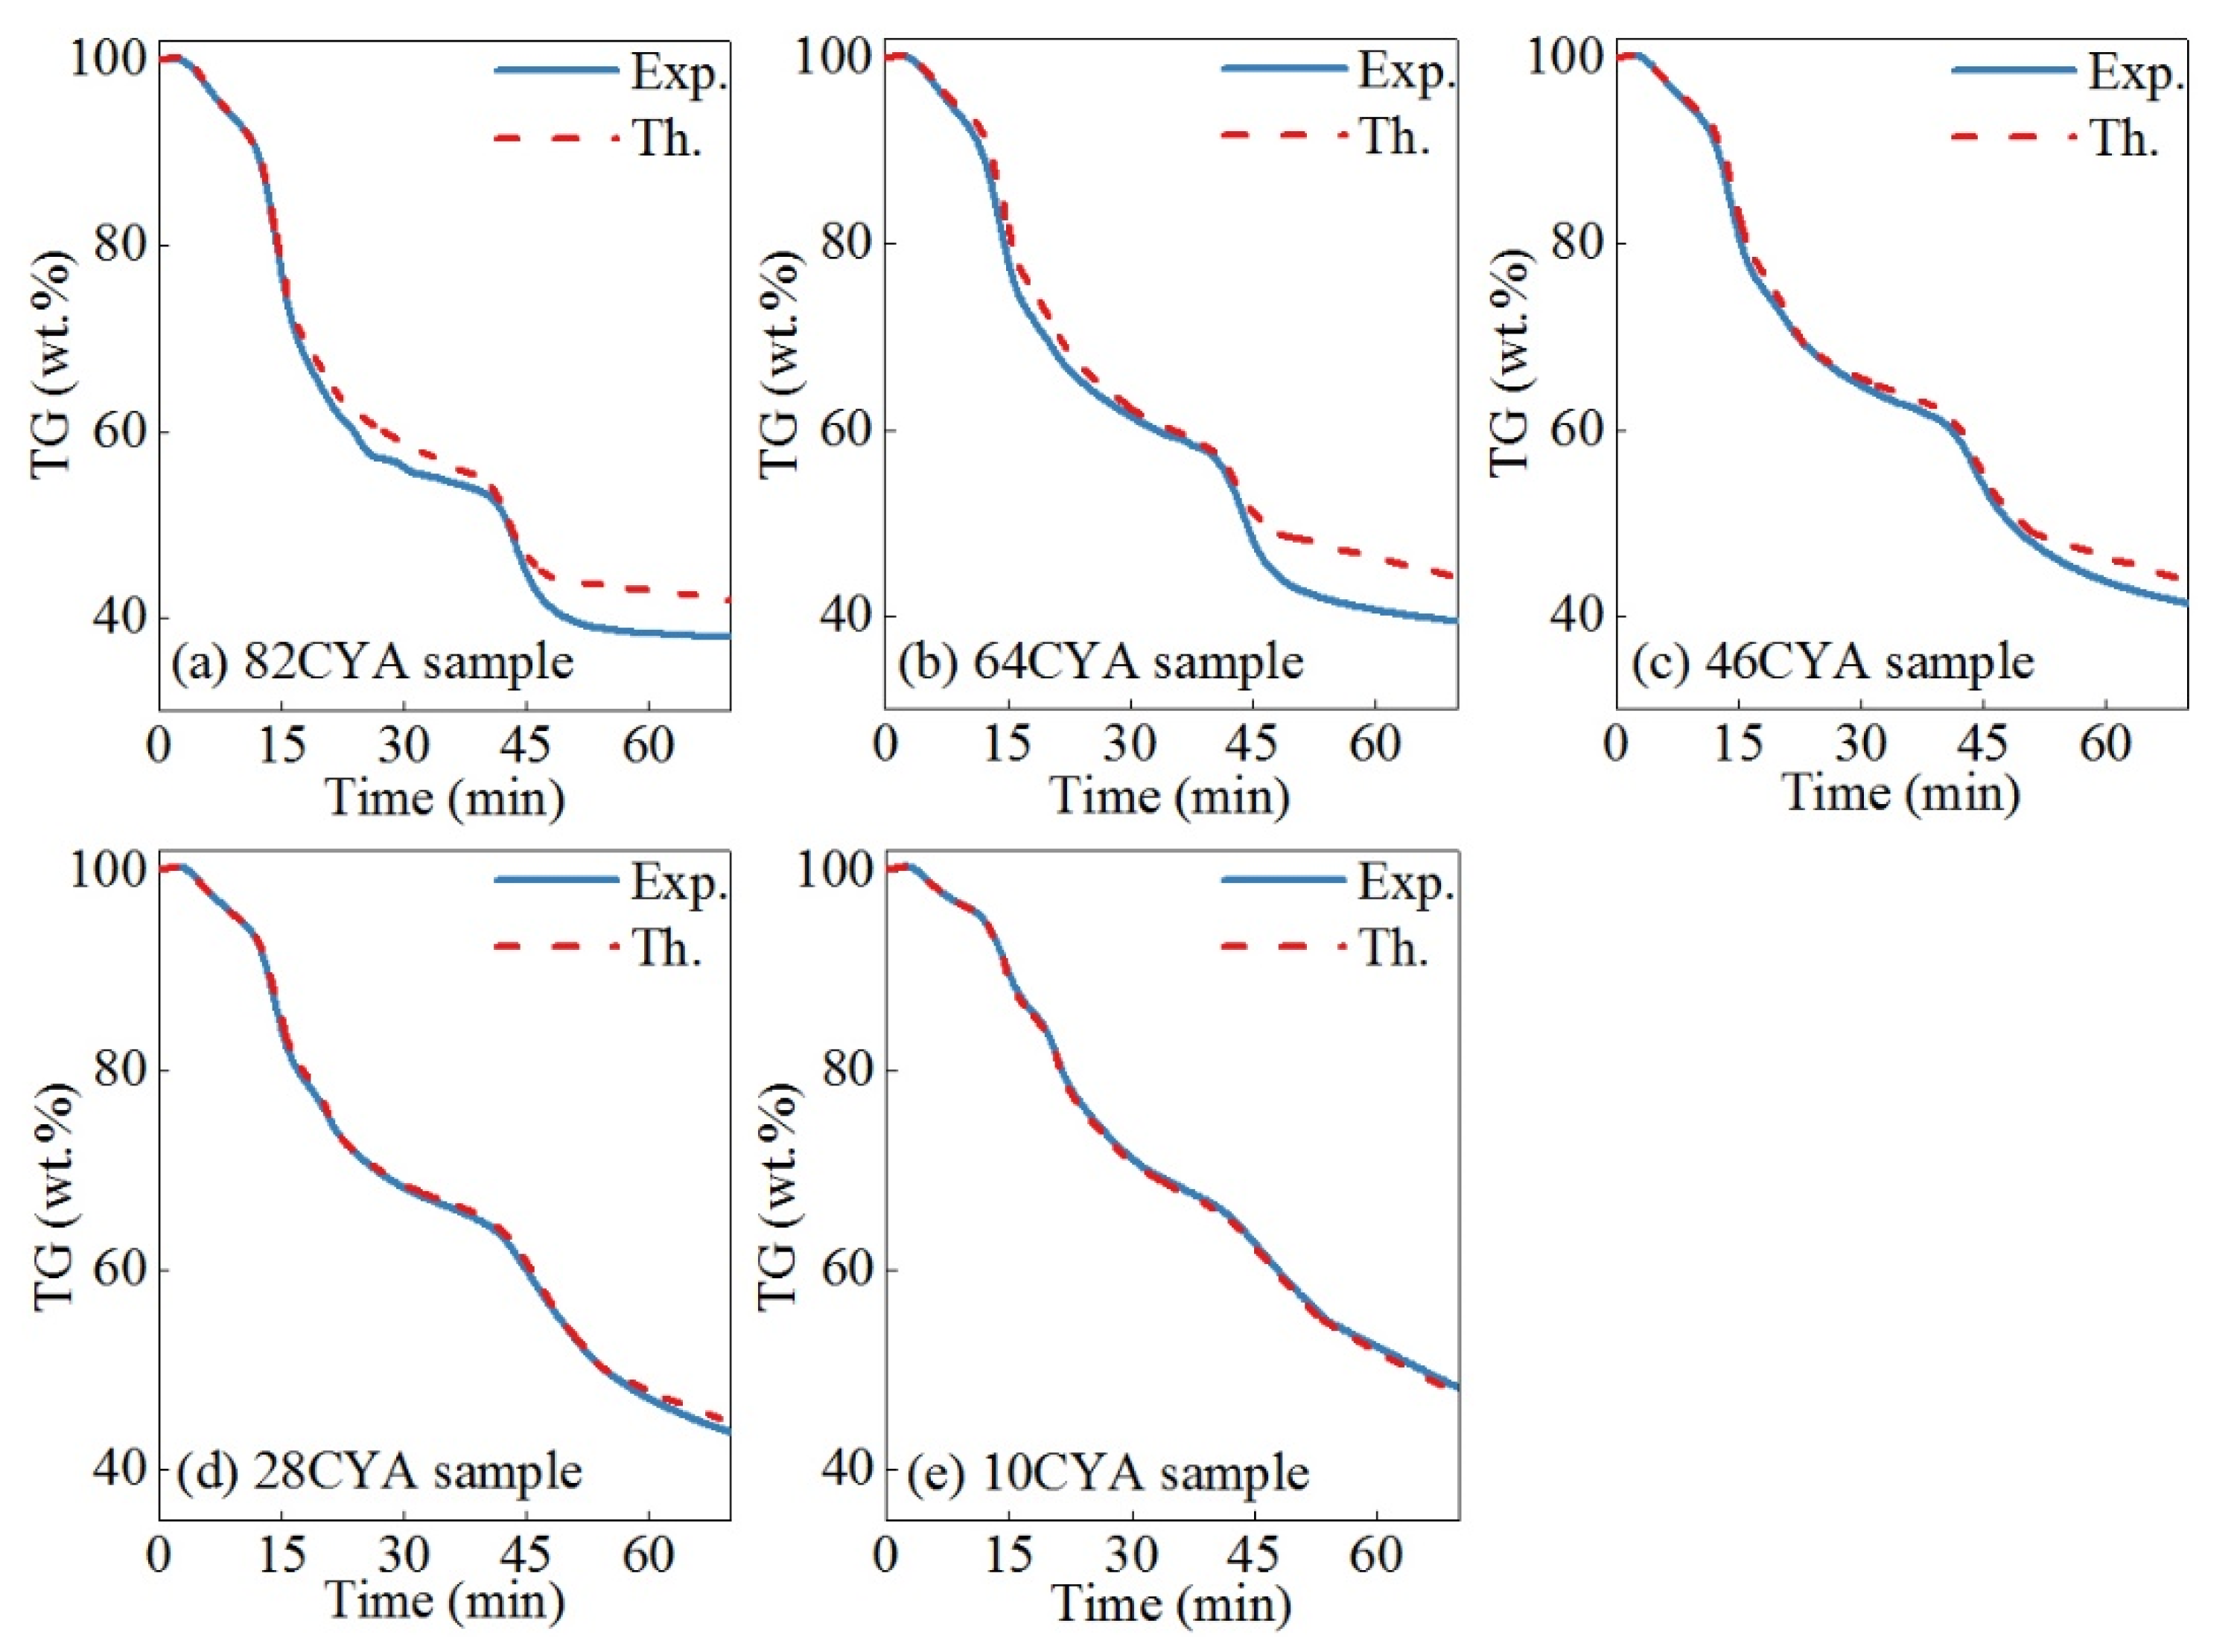
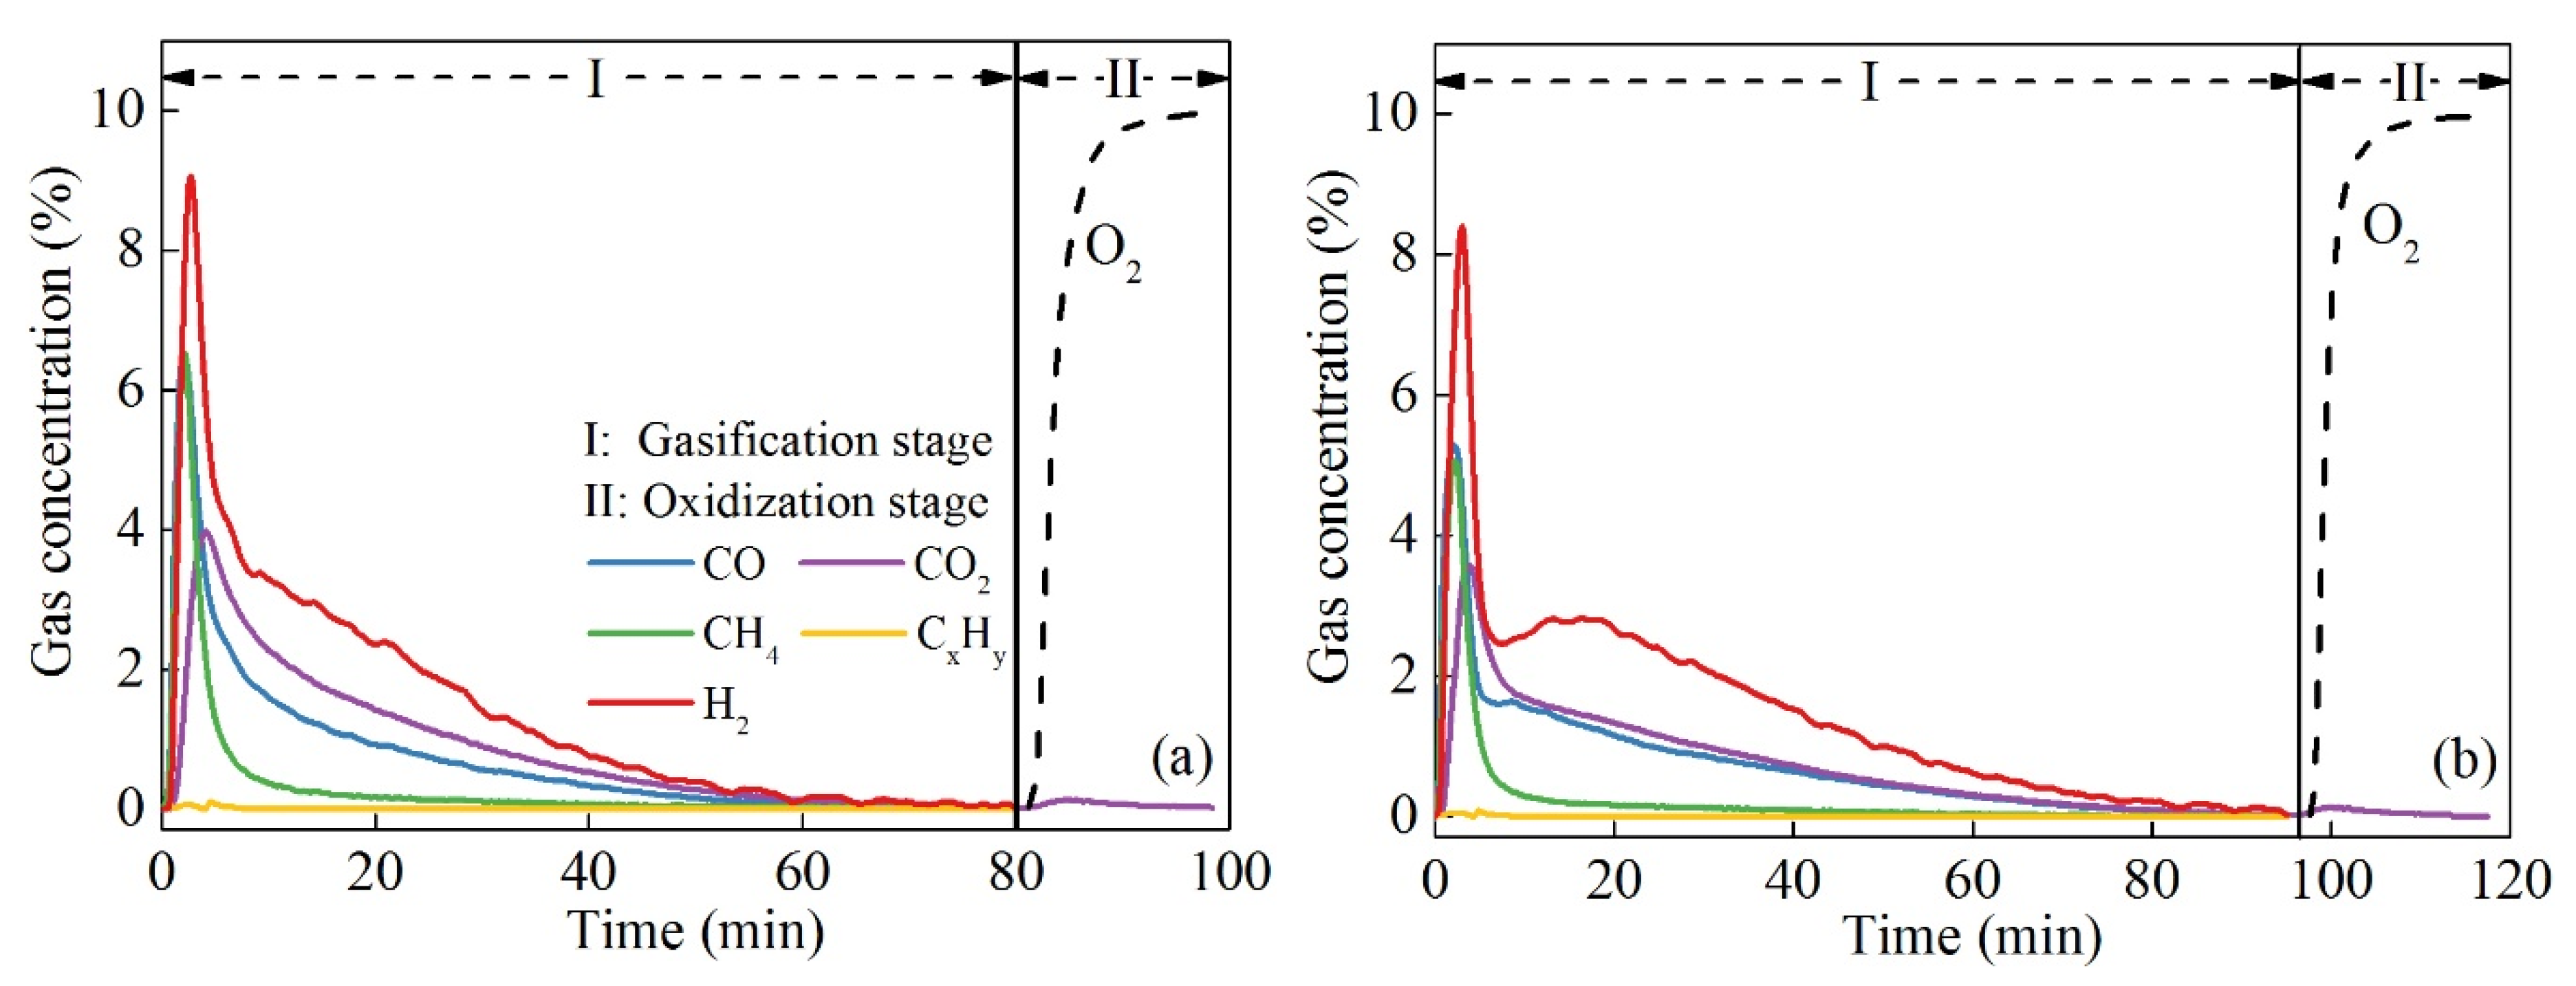
3.1. Thermogravimetric Characteristics and Gas Evolution

The thermogravimetric characteristics of chemical looping co-gasification were investigated in the TGA-FTIR. The experiment data obtained from TGA had high reliability and reproducibility, which was demonstrated by repeatable TGA results for the 82CYA sample (as shown in Figure S1 of the Supplementary Materials). The fuel blending ratio had a notable influence on the weight loss curves, as presented in Figure 2. Both cyanobacteria and coal presented a single weight loss peak during the pyrolysis process. However, the 320 °C peak temperature of the cyanobacteria pyrolysis was lower than the peak temperature of 470 °C obtained in the coal pyrolysis. This indicated that the cyanobacteria had higher pyrolysis reactivity than coal. The excellent pyrolysis reactivity of cyanobacteria was also observed in terms of a faster pyrolysis rate and lower initial pyrolysis temperature. The pyrolysis of mixture fuel could be equal to the sum of the individual component’s pyrolysis behaviors in the blends. The cyanobacteria and coal retained their characteristics during the mixture pyrolysis, including pyrolysis rate, initial pyrolysis temperature, and pyrolysis peak. The weight loss peaks originating from cyanobacteria and coal could be detected in the pyrolysis of all mixture fuels. The peak temperature obtained in the mixture fuel had no difference from that of the single fuel pyrolysis. The cyanobacteria gasification also showed higher reactivity than the coal gasification. The maximum gasification rate of cyanobacteria was 3.8 times higher than that of coal. Complete char gasification was only achieved in the CYA and 82CYA samples, in which the residual mass conformed to the mass of ash and reduced OC. The char gasification still proceeded in the other samples at the end of the isothermal process. Differences in the pyrolysis process, cyanobacteria, and coal interacted with each other in the gasification period. The gasification of cyanobacteria and coal could be considered as an integrated whole. The co-gasification characteristics were impacted by the fuel blending ratio such that the temperature of the initial gasification and the gasification peak had an apparent increase with blending more coal.
Figure 3 shows the gas evolution of coal and CYA samples under different reaction stages. It was expected to provide a basis for the subsequent analysis of the interaction effect and syngas yield. The evaporation of external water and internal water was analyzed in the absorbance spectra at 90 °C and 150 °C, respectively. The cyanobacteria compositions showed low heat resistance during the dewatering process. A small amount of carbonyl, aromatics, and alkyne could be detected under the temperature of 90 °C, except for the evaporated moisture. The dehydration and depolymerization reactions destroyed the structure of the cell wall [23]. The temperatures of 320 °C and 470 °C were selected to analyze the gas products generated from weight loss peaks during the pyrolysis process. Cyanobacteria pyrolysis not only had higher reactivity, but also released more C=O multi-functional groups, hydroxyl groups, and aromatic polymers. These gas products were evolved from a series of complex decomposition reactions of cellulose, hemicellulose, lignin, and polysaccharides [24]. The decomposition of the above organic matters resulted in the rapid release of cyanobacteria volatiles under the low temperature. Coal pyrolysis produced low-quality volatiles with a large amount of carbon dioxide, but a few carbonyl and hydrocarbon compounds. Blending cyanobacteria with coal could increase the syngas quality by providing more volatiles with abundant hydrocarbons, hydrogen-enriched gases, and oxygenated groups. Gas evolution of the char gasification process was evaluated under 800 °C and 890 °C. Carbon oxides became the major gas products in both coal and cyanobacteria gasification. The higher temperature promoted CO2 generation due to the enhanced char gasification and OC reduction reactions. Besides, the absorbance intensity of alkene and alkane was increased in the cyanobacteria gasification. The reason was that a high temperature was required to decompose carbonyl and aromatics into small molecular hydrocarbons [25].

3.2. Interaction Effect Analysis

The theoretical weight loss curves were compared with the experimental curves in Figure 4 to ascertain whether the interaction effect occurred during the chemical looping co-gasification. The degree of the interaction effect was quantitatively evaluated by the index MR, as shown in Table 2. With the comprehensive analysis of Figure 4 and Table 2, the following conclusions could be drawn: (1) an interaction effect mainly existed in the char gasification process; (2) the sample with a higher cyanobacteria blending ratio had a more prominent interaction effect.
The slight interaction effect was observed in the pyrolysis process in which the MR values ranged from 0.04 to 0.01. These MR values were several times smaller than those obtained in the gasification process. The fuel blending ratio and pyrolysis duration impacted the interaction effect of pyrolysis. A relatively high intensity of interaction effect was observed in the 82CYA and 64CYA samples, but the interaction effect could be negligible in the other samples with lower cyanobacteria content. The interaction effect also mainly appeared in the later stage of pyrolysis. The theoretical and experimental TG curves nearly overlapped with each other in the first ten minutes of pyrolysis. The above observation indicated that the interaction effect was highly related to the effect of cyanobacteria volatiles on coal pyrolysis. This result had a good agreement with the result of previous research [26]. The hydrogen radicals and oxygenated groups supplied by cyanobacteria would adsorb on the coal surface, interact with the radicals of coal, promote C-C breaking, and recombine as C-O-M complexes [20]. Involving these reactions could enhance the reactivity of coal pyrolysis and inhibit the semi-coke condensation reaction. The prominent interaction effect was observed in the char gasification process. The influence of cyanobacteria content on the interaction effect became apparent in this region. The difference between theoretical and experimental TG curves had a noticeable increase by increasing the cyanobacteria blending ratio. The 82CYA sample had the most prominent interaction. However, an inhibitive interaction and a negative MR were observed in the 10CYA sample, in which the experimental weight loss was slightly lower than the theoretical one.
The ash of mixture fuel was analyzed by X-ray fluorescence (XRF) in order to understand the influence of the fuel blending ratio on the interaction effect. Combined with Figure 5 and Table 2, the intensity of the interaction effect was found to be highly relevant to the (Na + K)/Al molar ratio of ash. The primary motive of the interaction effect was the catalytic effect of alkali metal hydroxides and carbonates on enhancing coal gasification [20]. However, the irreversible reaction between alkali metals and mineral matters (Al, Si) would generate aluminosilicates, such as KAlSiO4, NaAlSiO4, and KAlSi3O8. The aluminosilicates’ formation not only caused the deactivation of alkali metals, but also had an inhibition function in char gasification [27]. Therefore, a beneficial interaction existed in the sample with the (Na + K)/Al molar ratio > 1, in which the catalytically active alkali metals remained in the ash. The negative interaction was observed in the 10CYA sample, in which the sum of potassium and sodium content was smaller than the aluminum content. The formation of aluminosilicate could be demonstrated by the higher experimental content of alkali metals than the theoretical value because the aluminosilicates with better thermal stability could reduce the evaporative loss of alkali metals under high temperatures. The theoretical element content of ash (presented in Figure 5) was proposed in this study. The calculation method of the theoretical element content was consulted from that of the theoretical weight loss rate [17], as shown in Equation (10).
A s h t h = X c o a l A s h c o a l + X C Y A A s h C Y A
where X c o a l and X C Y A are the mass ratios of coal and cyanobacteria in the blends and A s h c o a l and A s h C Y A represent the element fraction obtained in coal and cyanobacteria ash, respectively.

3.3. Kinetic Parameters

During the kinetic analysis, the chemical looping co-gasification was divided into three pronounced regions based on the thermogravimetric characteristics. The fast pyrolysis region ranged within 180–460 °C; the second pyrolysis region was defined from 460 °C to 700 °C; and the range of 700–900 °C was selected as the char gasification region. The kinetic parameters calculated from HRM and SCM are shown in Table 3.
Both HRM and SCM achieved a low fitting degree in the fast pyrolysis region, particularly with the mixture fuels. The initial process of pyrolysis involved a large number of independent and parallel reactions with different activation energies. These reactions were influenced by each other and associated with heat and mass transfer [21]. The intricate mechanisms would be further complicated by introducing the OC and mixture of cyanobacteria and coal. It is an arduous task to obtain the kinetic parameters of the initial pyrolysis by the routine kinetics model. The second pyrolysis region had a tremendous fitting degree. The correlation coefficients R2 reached from the two models were generally above 0.99. In this region, the blending ratio had a relatively limited impact on the activation energy E and the pre-exponential factor A. This implied that the semi-coke condensation of cyanobacteria had similar reaction kinetics as that of coal. Therefore, the high pyrolysis reactivity of cyanobacteria was mainly attributed to the decomposition of organic components in the fast pyrolysis region. A better fitting performance was also realized in the char gasification region. Compared with SCM, HRM was more suitable in fitting the behaviors of cyanobacteria gasification. This indicated that cyanobacteria char had a small diffusional limitation, high specific surface area, and uniform pore structure. The high reactivity of cyanobacteria char was also exhibited in the kinetics results. The activation energies of char gasification dramatically increased with an increase in the coal blending ratio.

3.4. Fuel Blending Ratio

The influence of the fuel blending ratio was investigated in the fluidized bed reactor by adopting the hematite OC and dewatered mixture fuel. After several trials, the oxygen carrier-to-fuel ratio of 0.3 was determined as the optimum OC demand with respect to the highest syngas yield and acceptable carbon conversion efficiency. Although the higher OC content could accelerate carbon conversion, the syngas yield would have a remarkable decline. The excessive OC would oxidize syngas into CO2 and H2O and convert the partial oxidation of the CLG into the complete combustion process. Insufficient OC also was against the CLG performance. The oxygen carrier-to-fuel ratio of 0.2 could not provide enough lattice oxygen for fuel gasification. Similar results and detailed analysis could be found in the previous work [22].
Figure 6 presents the typical concentration distribution of outlet gases as a function of time. The pyrolysis gases were rapidly released at first and then were partly oxidized by the OC, resulting in a CO2 evolution peak. Subsequently, the concentration of CH4 and CxHy decreased dramatically to zero. This indicated the end of pyrolysis because the hydrocarbon gases could only be generated from the volatile matters under the CLG atmosphere. The slow char gasification was observed with a gradual decline in concentration of H2, CO, and CO2. The 46CYA sample presented a prominent peak of H2 generation. However, this hydrogen peak could not be found in the 64CYA sample due to the lower fixed carbon content. The fuel blending ratio also impacted the reaction duration. The gasification duration of the 46CYA sample was 17 min longer than that of the 64CYA sample. After the end of the gasification reaction, ten percent oxygen was injected with 90% nitrogen to oxidize the reduced OC. A small amount of CO2 was also detected in this period, indicating the combustion of the residual char. The carbon amount of the residual char could be calculated from the measured CO2 concentration.
The experiment of the 82CYA sample was repeated three times to verify the reproducibility of the fluidized bed tests. The errors of this lab-scale experiment were acceptable with the result that the standard deviations of carbon conversion efficiency and syngas yield were 2.05 and 0.08, respectively.
Figure 7 shows the influence of the fuel blending ratio on the gas yield and carbon conversion efficiency. In general, increasing the coal blending ratio could promote the H2 and CO2 yield, but dramatically decrease the CH4 generation and carbon conversion efficiency. The methane yield decreased from the highest 0.28 Nm3/kg to the lowest 0.08 Nm3/kg by a gradual increase in the coal blending ratio. Increasing the coal content could increase the H2 yield when the coal blending ratio was less than 72 wt.%. Although the cyanobacteria pyrolysis provided more hydrogen-enriched gases, the fixed carbon content was critical in the hydrogen generation by employing steam as the gasifying agent. However, further increasing the coal content would be against the H2 yield. The reason was the dramatic decline in carbon conversion efficiency. The coal char with more inert carbon had a compact structure. It was challenging to convert coal under the nitrogen/steam atmosphere completely. The coal blending ratio also had an impact on CO2 and CO yields. Blending more coal would result in a marked increase of CO2 yield, but a slight growth of CO yield. This was mainly attributed to the enhanced water gas shift reaction because the 0.3 oxygen carrier-to-fuel ratio could not oxidize more CO into CO2. As a result, the 46CYA sample had the highest syngas yield of 1.26 Nm3/kg. The carbon proportion of residual char was calculated within the range of 0.4–6.7%. The carbon balance is analyzed and reported in Figure S2 of the Supplementary Materials. The total percent of carbon in syngas and char lied in the range of 98.3–99.2%, which indicated that less tar was produced under these conditions.

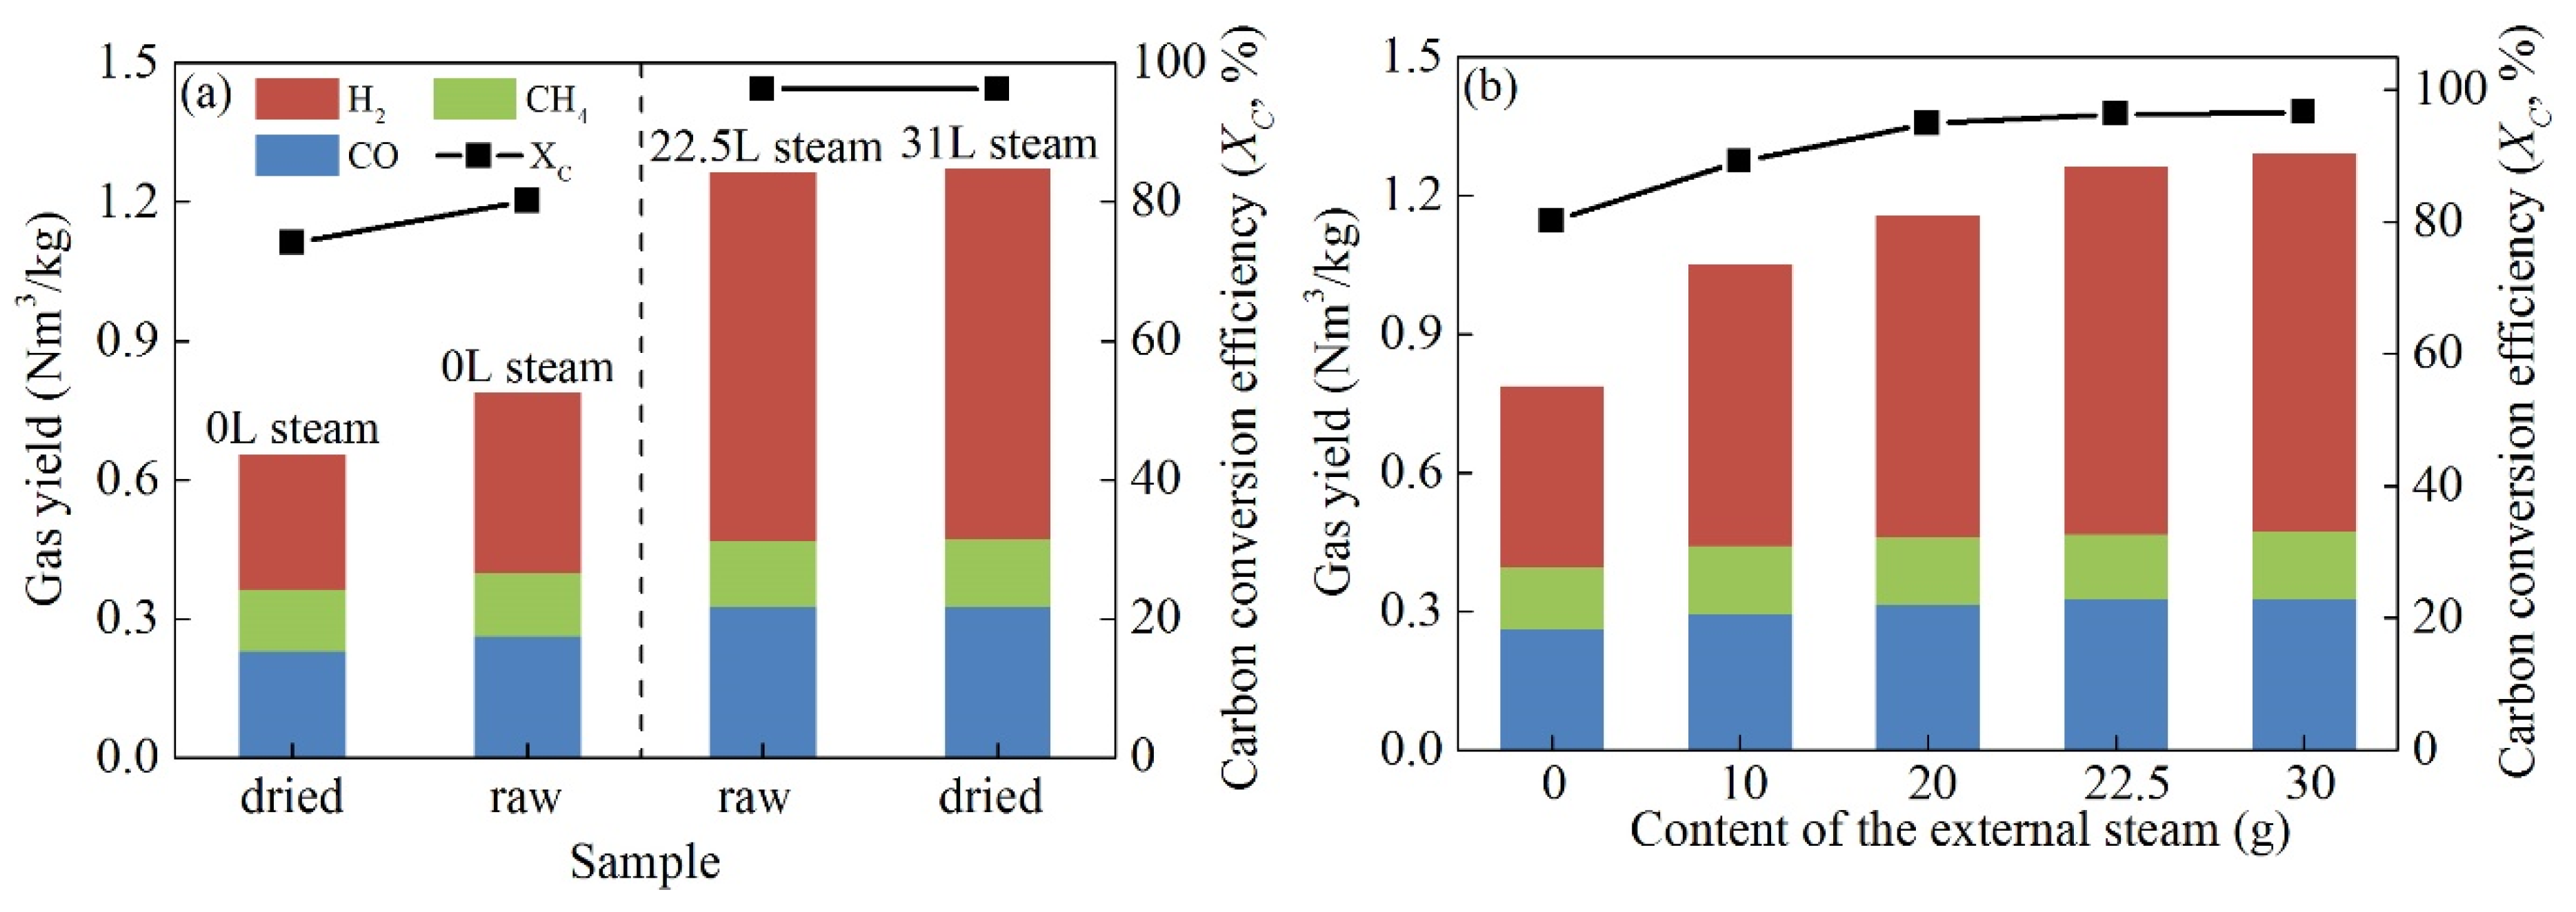
3.5. Cyanobacteria Residual Moisture

The influence of the cyanobacteria residual moisture was evaluated by comparing the co-gasification performance of the dewatered and raw fuels. The 46:54 mixture of cyanobacteria and coal was adopted as the fuel in this section, in which the dried basis determined the blending mass of cyanobacteria. Therefore, the actual mass of raw cyanobacteria was 6.53 times greater than that of the dewatered cyanobacteria when the blending mass of coal was the same. The steam flow of 20 g/h was maintained as constant in this section, and the duration of injecting steam was changed to control the steam content.
Figure 8 presents the syngas yield and carbon conversion efficiency of the raw/dewatered fuel under different contents of the injecting steam. Compared to the dewatered fuel, the raw fuel had an enhanced gasification performance under the absence of the external steam. Higher carbon conversion efficiency and H2 yield demonstrated that the cyanobacteria residual moisture could work inside char particles as the gasifying agent. The almost complete char gasification, over 97% carbon conversion efficiency, was achieved in the raw sample by injecting 22.5 g of external steam. However, above 31 g of external steam were required in the dewatered fuel to realize a similar gasification performance. It could be equivalent to around 5 g of residual moisture of cyanobacteria being able to substitute 8.5 g of external steam as the gasifying agent. The better gasification effect of cyanobacteria moisture was mainly attributed to the steam distribution. The external steam injected from the bottom of the fluidized bed had poor hydrodynamics and high viscous force. An inadequate gas-contact and a low relative velocity between the external steam and solid fuels were inevitable. The uniform distribution was the advantage of the cyanobacteria moisture. The evaporated moisture from the cyanobacteria would directly work inside of particles, which resulted in an enhanced exchange of heat and mass. Meanwhile, the contact time of the residual moisture and char particles would be prolonged by the capillary force and hydration adhesion [28].

4. Conclusions

To minimize the dewatering requirement, the chemical looping co-gasification of cyanobacteria and coal was investigated in this study. Meanwhile, this strategy was also expected to improve the coal CLG by enhancing the reactivity of char gasification and increasing the yield of gas products. The co-gasification behaviors were firstly evaluated in the TGA-FTIR, including thermogravimetric characteristics, gas evolution, interaction effect, and kinetic parameters. The influence of the oxygen carrier-to-fuel ratio, fuel blending ratio, and cyanobacteria moisture on the gasification performance was investigated in a batch fluidized bed. This study is expected to provide a basis for further research on the performance improvement in an interconnected fluidized bed and the renewable recovery of active nitrogen and phosphorus.
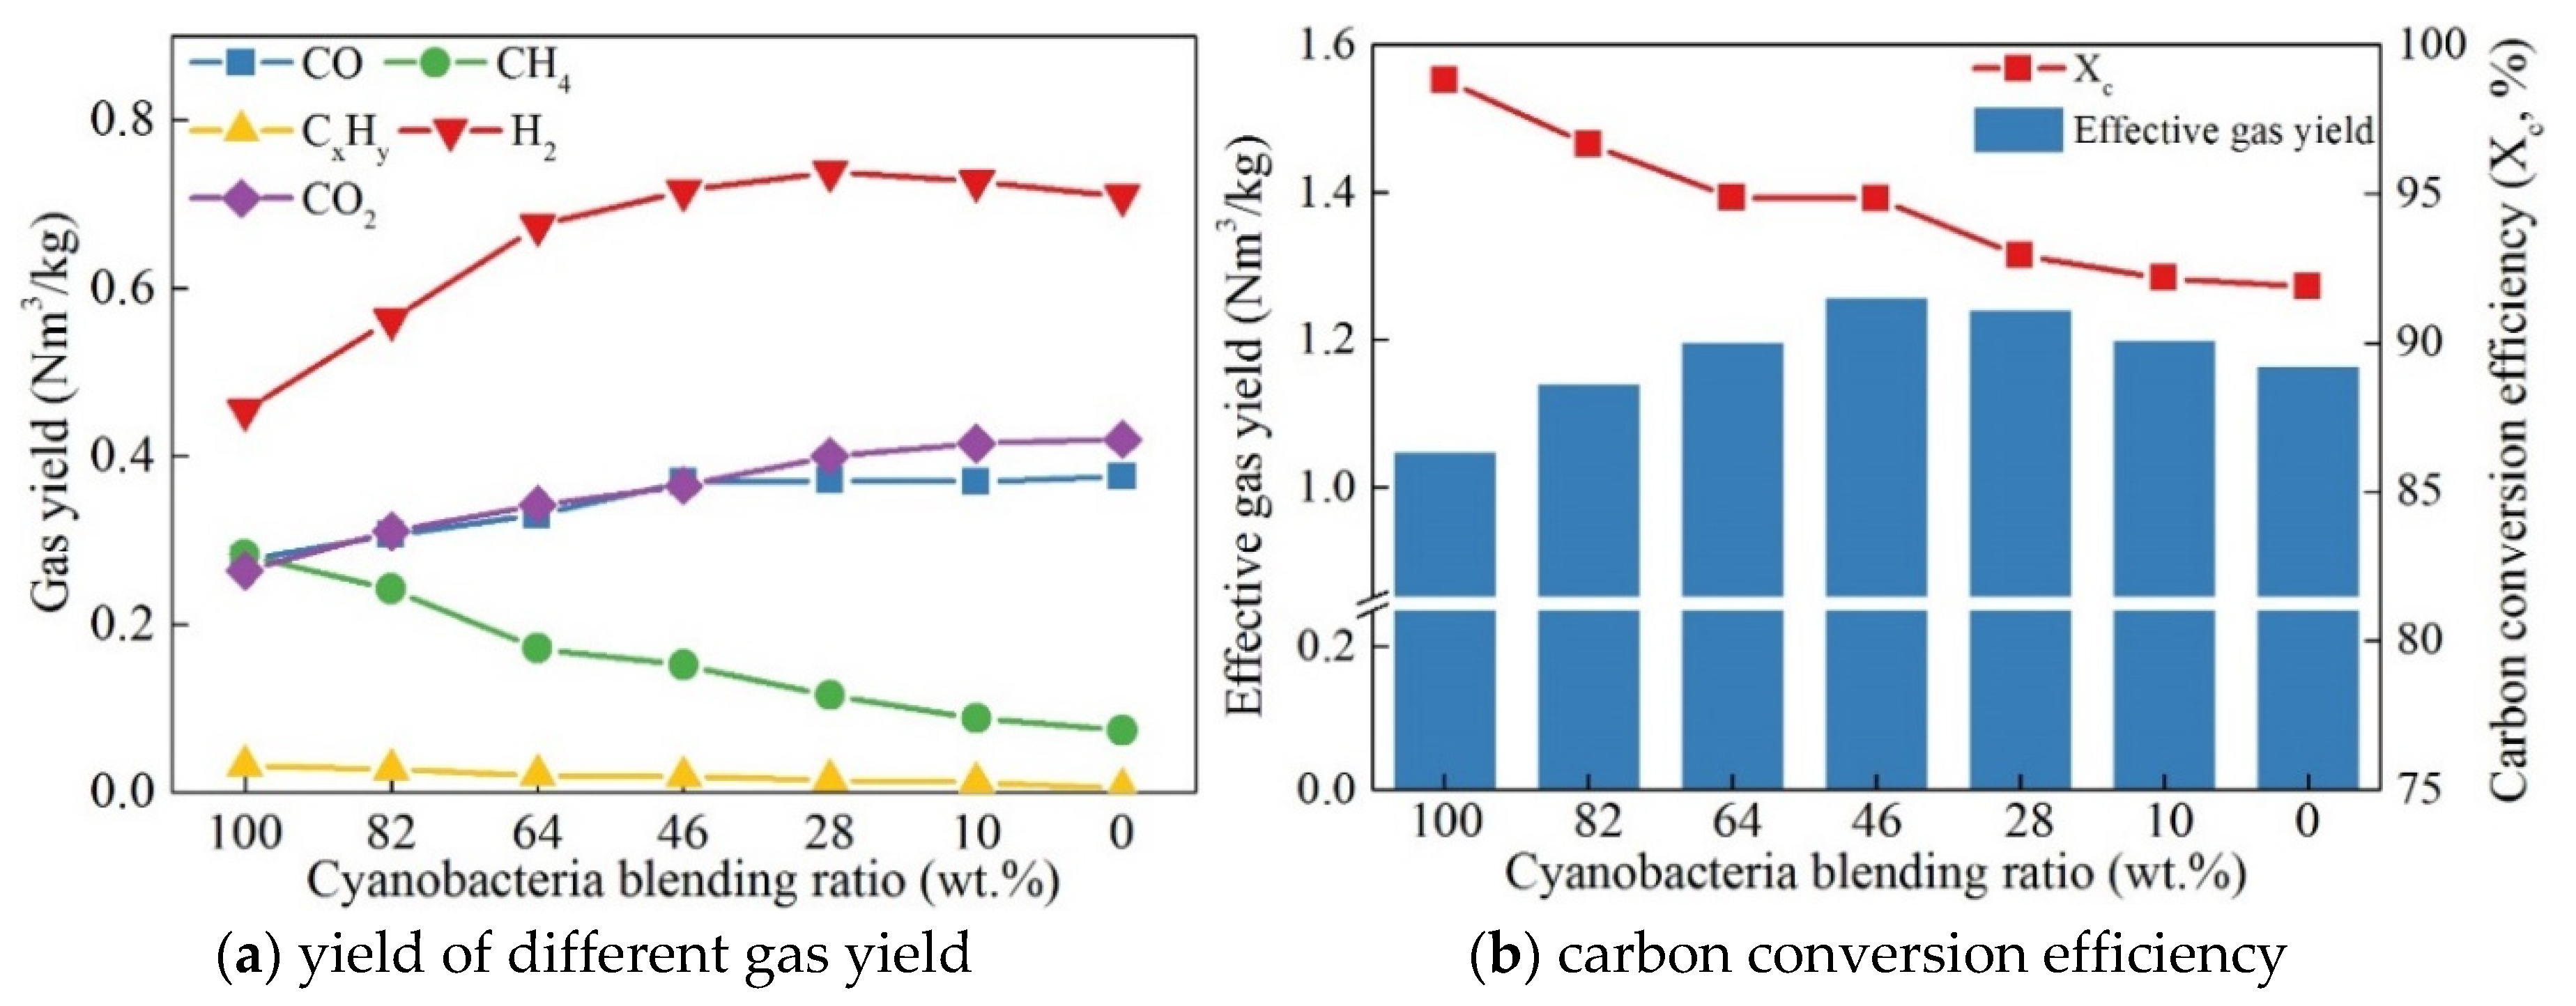
Cyanobacteria pyrolysis could improve the syngas quality by providing abundant hydrocarbons and hydrogen-rich gases. The highest syngas yield of 1.26 Nm3/kg was obtained in the mixture fuel of 46 wt.% cyanobacteria and 54 wt.% coal. Increasing the cyanobacteria blending ratio could increase the carbon conversion efficiency and CH4 yield, but decrease CO and H2 yields. The 0.3 oxygen carrier-to-fuel ratio was determined as the optimum OC demand in terms of the highest syngas yield and the acceptable carbon conversion efficiency.
The residual moisture of raw cyanobacteria not only could replace part of the injecting steam as the gasifying agent of coal, but also showed a better gasification effect than the free water. Compared with the injecting steam, the cyanobacteria moisture had an enhanced gas-solid contact, uniform distribution, and prolonged contact time.
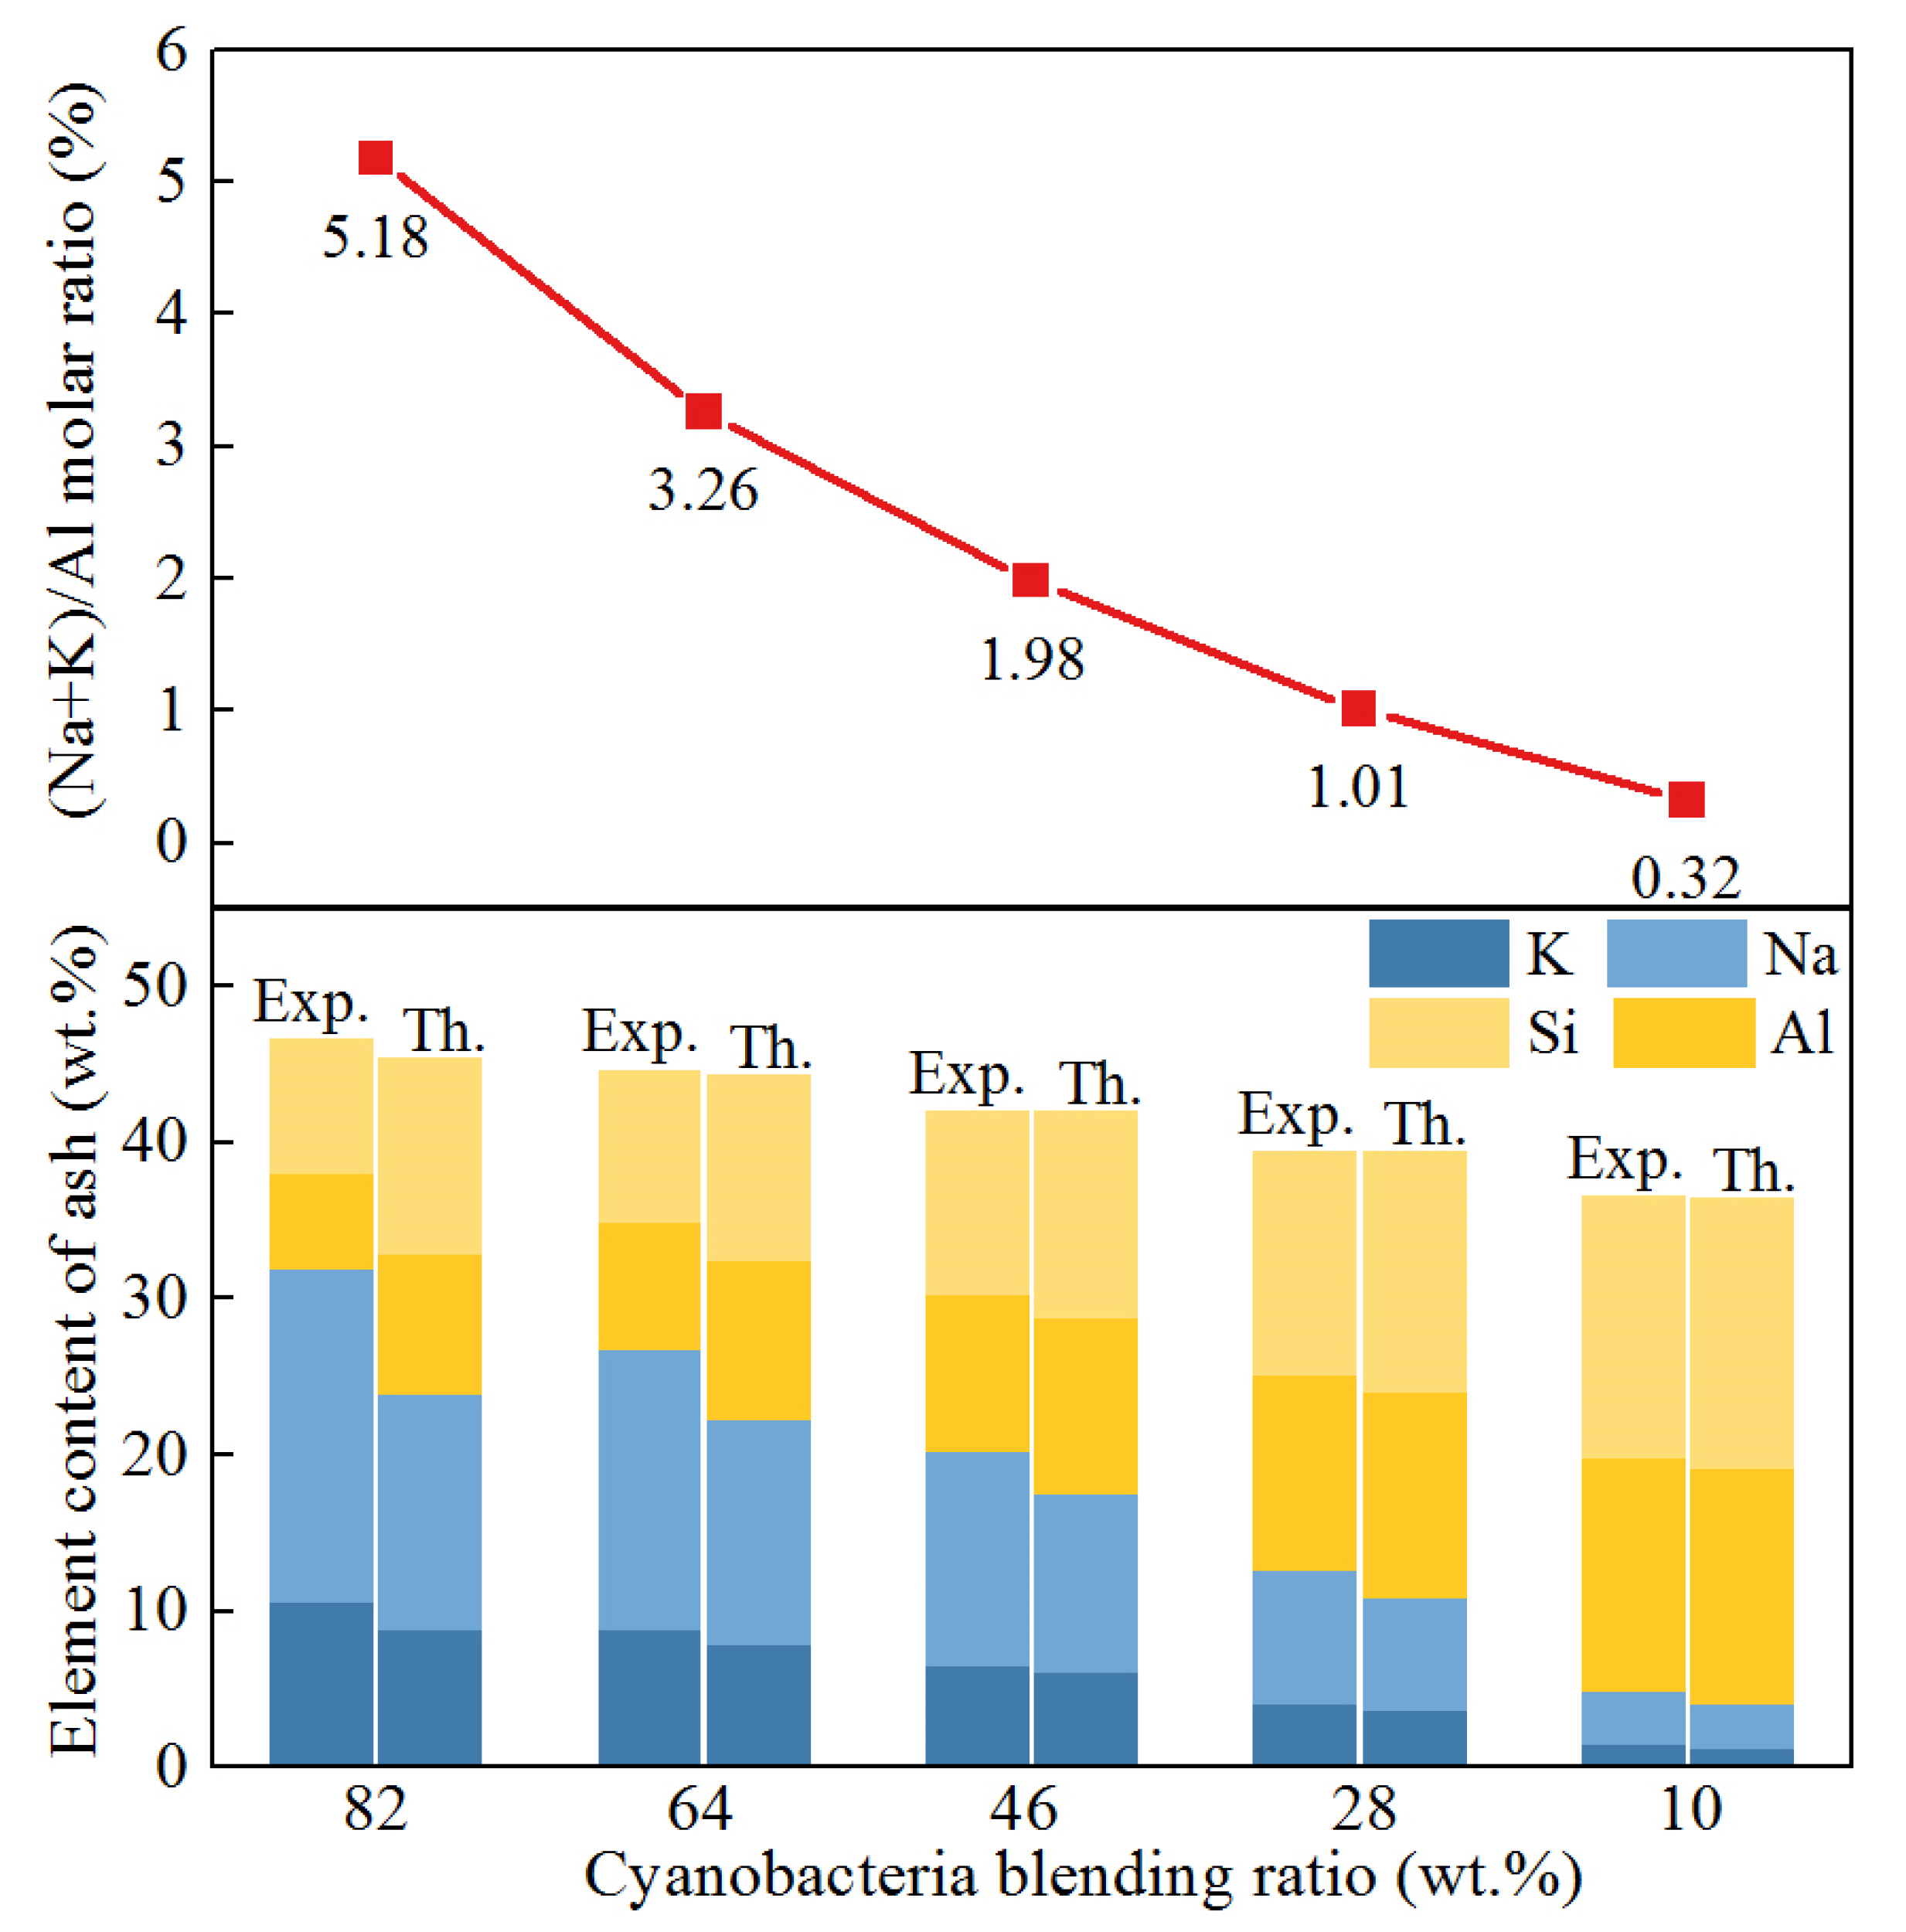
The reactivity of coal gasification was enhanced by blending cyanobacteria because of the interaction effect. The interaction effect of co-gasification was highly relevant to the (Na + K)/Al molar ratio of ash. The dominant motive for the interaction effect was the catalytic effect of alkali metals on char gasification. However, the formation of aluminosilicates would deactivate alkali metals and inhibit char gasification. The most prominent interaction effect occurred for the sample with 82 wt.% cyanobacteria and 28 wt.% coal, but a negative interaction effect was observed in the sample with 28 wt.% cyanobacteria and 72 wt.% coal.
Both homogeneous reaction and shrinking core models showed excellent performance in fitting the char gasification process. However, these two models were not applicable to the initial pyrolysis stage because of the intricate mechanisms. The homogeneous reaction model was more suitable in fitting cyanobacteria behaviors, and the shrinking core model was applicable to the sample with high coal content.

Supplementary Materials

The following are available online at https://www.mdpi.com/1996-1073/13/9/2352/s1, Figure S1: The repeated TGA experiment of the mixture fuel with 82 wt.% cyanobacteria and 18 wt.% coal (82CYA sample), Figure S2: The carbon balance as a function of the cyanobacteria blending ratio.

Author Contributions

Conceptualization, T.S., J.Z. and J.Y.; Methodology, T.S.; Software, T.S. and J.Y.; Validation, T.S. and L.B.; Formal Analysis, T.S.; Investigation, T.S., L.B. and J.Z.; Resources, L.B. and L.S.; Data Curation, T.S. and L.B.; Writing Original Draft Preparation, T.S.; Writing Review & Editing, T.S. and L.B.; Visualization, T.S.; Supervision, L.S. and L.B.; Project Administration, L.S.; Funding Acquisition, L.S. and T.S. All authors have read and agreed to the published version of the manuscript.

Funding

This research was funded by National Key R&D Program of China with grant number 2018YFB0605404, National Natural Science Foundation of China with grant number 51761135119, and Scientific Research Foundation of Graduate School of Southeast University with grant number YBPY1857.

Conflicts of Interest

The authors declare no conflict of interest.

References

  1. Janssen, E.M.L. Cyanobacterial peptides beyond microcystins–a review on co-occurrence, toxicity, and challenges for risk assessment. Water Res. 2019, 151, 488–499. [Google Scholar] [CrossRef] [PubMed]
  2. Schindler, D.W. Recent advances in the understanding and management of eutrophication. Limnol. Oceanogr. 2006, 51, 356–363. [Google Scholar] [CrossRef] [Green Version]
  3. Wang, J.; Wu, J. Occurrence and potential risks of harmful algal blooms in the East China Sea. Sci. Total Environ. 2009, 407, 4012–4021. [Google Scholar] [CrossRef] [PubMed]
  4. Li, W.; Li, W.; Liu, H. The resource utilization of algae—Preparing coal slurry with algae. Fuel 2010, 89, 965–970. [Google Scholar] [CrossRef]
  5. Aziz, M. Integrated supercritical water gasification and a combined cycle for microalgal utilization. Energy Convers. Manag. 2015, 91, 140–148. [Google Scholar] [CrossRef]
  6. Thiruvenkadam, S.; Izhar, S.; Yoshida, H.; Danquah, K.; Harun, R. Process application of Subcritical Water Extraction (SWE) for algal bio-products and biofuels production. Appl. Energy 2015, 154, 815–828. [Google Scholar] [CrossRef]
  7. Huynh, C.; Kong, S. Performance characteristics of a pilot-scale biomass gasifier using oxygen-enriched air and steam. Fuel 2013, 103, 987–996. [Google Scholar] [CrossRef]
  8. Doherty, W.; Reynolds, A.; Kennedy, D. The effect of air preheating in a biomass CFB gasifier using ASPEN Plus simulation. Biomass Bioenergy 2009, 33, 1158–1167. [Google Scholar] [CrossRef] [Green Version]
  9. Adanez, J.; Abad, A.; Garcia-Labiano, F.; Gayan, P.; de Diego, L.F. Progress in Chemical-Looping Combustion and Reforming technologies. Prog. Energy Combust. Sci. 2012, 38, 215–282. [Google Scholar] [CrossRef] [Green Version]
  10. Zaini, I.N.; Nurdiawati, A.; Aziz, M. Cogeneration of power and H2 by steam gasification and syngas chemical looping of macroalgae. Appl. Energy 2017, 207, 134–145. [Google Scholar] [CrossRef]
  11. Gu, H.; Shen, L.; Zhong, Z.; Niu, X.; Ge, H.; Zhou, Y.; Xiao, S.; Jiang, S. NO release during chemical looping combustion with iron ore as an oxygen carrier. Chem. Eng. J. 2015, 264, 211–220. [Google Scholar] [CrossRef]
  12. Leion, H.; Mattisson, T.; Lyngfelt, A. Solid fuels in chemical-looping combustion. Int. J. Greenh. Gas Control 2008, 2, 180–193. [Google Scholar] [CrossRef]
  13. Sjoström, K.; Chen, G.; Yu, Q.; Rosén, B.C. Promoted reactivity of char in co-gasification of biomass and coal: Synergies in the thermochemical process. Fuel 1999, 78, 1189–1194. [Google Scholar] [CrossRef]
  14. McKee, D.W. Gasification of graphite in carbon dioxide and water vapor—The catalytic effects of alkali metal salts. Carbon 1982, 20, 59–66. [Google Scholar] [CrossRef]
  15. Masnadi-Shirazi, M.S. Biomass/Fossil Fuel co-Gasification with and without Integrated CO2 Capture; University of British Columbia: Vancouver, BC, Cananda, 2014. [Google Scholar]
  16. Wang, Q.; Zhao, W.Z.; Liu, H.P.; Jia, C.X.; Li, S.H. Interactions and kinetic analysis of oil shale semi-coke with cornstalk during co-combustion. Appl. Energy 2011, 88, 2080–2087. [Google Scholar] [CrossRef]
  17. Wu, Z.; Yang, W.; Tian, X.; Yang, B. Synergistic effects from co-pyrolysis of low-rank coal and model components of microalgae biomass. Energy Convers. Manag. 2017, 135, 212–225. [Google Scholar] [CrossRef]
  18. Fermoso, J.; Stevanov, C.; Moghtaderi, B.; Arias, B.; Pevida, C.; Plaza, M.G.; Rubiera, F.; Pis, J.J. High-pressure gasification reactivity of biomass chars produced at different temperatures. J. Anal. Appl. Pyrolysis 2009, 85, 287–293. [Google Scholar] [CrossRef]
  19. Ishida, M.; Wen, C.Y. Comparison of zone-reaction model and unreacted-core shrinking model in solid—gas reactions—I isothermal analysis. Chem. Eng. Sci. 1971, 26, 1031–1041. [Google Scholar] [CrossRef]
  20. Mallick, D.; Mahanta, P.; Moholkar, V.S. Co-gasification of coal and biomass blends: Chemistry and engineering. Fuel 2017, 204, 106–128. [Google Scholar] [CrossRef]
  21. Szekely, J.; Evans, J.W. A structural model for gas—solid reactions with a moving boundary. Chem. Eng. Sci. 1970, 25, 1091–1107. [Google Scholar] [CrossRef]
  22. Yin, S.; Shen, L.H.; Dosta, M.; Hartge, E.-U.; Heinrich, S.; Liu, P.; Werther, J.; Song, T. Chemical looping gasification of biomass pellet with a Manganese ore as oxygen carrier in the fluidized bed. Energy Fuels 2018, 32, 11674–11682. [Google Scholar] [CrossRef]
  23. Ross, A.B.; Jones, J.M.; Kubacki, M.L.; Bridgeman, T. Classification of macroalgae as fuel and its thermochemical behaviour. Bioresour. Technol. 2008, 99, 6494–6504. [Google Scholar] [CrossRef] [PubMed]
  24. Marcilla, A.; Gomez-Siurana, A.; Gomis, C.; Gomis, G.; Chápuli, E.; Catalá, M.C.; Valdé, F.J. Characterization of microalgal species through TGA/FTIR analysis: Application to nannochloropsis sp. Thermochim. Acta 2009, 484, 41–47. [Google Scholar] [CrossRef]
  25. Fu, P.; Hu, S.; Sun, L.S.; Xiang, J.; Chen, Q.-Q.; Yang, T.; Zhang, J.-Y. Release characteristics and formation mechanism of gas products during rice straw and maize stalk pyrolysis. Proc. CSEE 2009, 29, 113–118. [Google Scholar]
  26. Puig-Gamero, M.; Lara-Diaz, J.; Valverde, J.L.; Sanchez-Silva, L.; Sánchez, P. Dolomite effect on steam co-gasification of olive pomace, coal and petcoke: TGA-MS analysis, reactivity and synergistic effect. Fuel 2018, 234, 142–150. [Google Scholar] [CrossRef]
  27. Habibi, R.; Kopyscinski, J.; Masnadi, M.S.; Lam, J.; Grace, J.R.; Mims, C.A.; Hill, J.M. Co-gasification of biomass and non-biomass feedstocks: Synergistic and inhibition effects of switchgrass mixed with sub-bituminous coal and fluid coke during CO2 gasification. Energy Fuels 2013, 27, 494–500. [Google Scholar] [CrossRef]
  28. Liu, K.; Zhang, Q.; Hu, H.; Li, A.; Yao, H. Influence of residual moisture on deep dewatered sludge pyrolysis. Int. J. Hydrog. Energy 2014, 39, 1253–1261. [Google Scholar] [CrossRef]
Figure 1. The schematic of the TGA-FTIR and batch fluidized bed system.
Energies 13 02352 g001
Figure 2. The TG and DTG curves of the co-gasification and single fuel gasification with a 2:1 fuel/OC mass ratio under argon/steam atmosphere. CYA, cyanobacteria.
Energies 13 02352 g002
Figure 3. The infrared absorbance spectra of gas products under different stages obtained from (a) the sample with 100 wt.% coal and (b) the sample with 100 wt.% cyanobacteria.
Energies 13 02352 g003
Figure 4. Comparison between experimental and theoretical TG curves.
Energies 13 02352 g004
Figure 5. The (Na + K)/Al molar ratio and the comparison between the experimental and theoretical content ratio of alkali metals and mineral matters.
Energies 13 02352 g005
Figure 6. The distribution of outlet gases obtained from (a) the sample with 64 wt.% cyanobacteria; (b) the sample with 46 wt.% cyanobacteria under 900 °C and a 0.3 oxygen carrier-to-fuel ratio.
Energies 13 02352 g006
Figure 7. The gas yield and carbon conversion efficiency as a function of the cyanobacterial blending ratio under 900 °C and a 0.3 oxygen carrier-to-fuel ratio.
Energies 13 02352 g007
Figure 8. The gas yield and carbon conversion efficiency obtained in the 46:54 mixture fuel of dewatered/raw cyanobacteria: (a) comparison between dewatered and raw samples; (b) raw sample under different contents of the external steam.
Energies 13 02352 g008
Table 1. Main characteristics of cyanobacteria and lignite coal (wt.%).
SampleAnalysis
Proximate AnalysisUltimate Analysis
MoisturearVolatile MatterdFixed CarbondAshdCHOaNS
Coal1542.340.317.464.42.930.21.01.5
Cyanobacteria84.781.28.710.144.76.738.310.00.3
Ash Analysis
SiO2Al2O3CaOFe2O3K2OMgONa2OP2O5Others
Coal47.039.14.85.21.00.90.30.11.6
Cyanobacteria3.00.62.70.828.98.014.340.61.1
Moisturear based on the received basis. Volatile Matterd, Fixed Carbond, and Ashd based on the dried basis. Oa by the difference.
Table 2. The interaction index MR of the pyrolysis and gasification process.
Sample82CYA64CYA46CYA28CYA10CYA
Pyrolysis0.04170.03220.03030.0150−0.0105
Gasification0.24230.22290.10160.0396−0.0229
Table 3. Kinetic parameters of the chemical looping co-gasification of cyanobacteria and coal obtained from the homogeneous reaction model (HRM) and the shrinking core model (SCM).
RegionModelKineticCYA82CYA64CYA46CYA28CYA10CYACoal
Fast pyrolysis regionHRME (kJ/mol)35.8438.6342.0842.7643.7348.0448.91
A (min−1)1173199301027119728933835
R20.9910.9790.9810.9840.9860.9830.989
SCME (kJ/mol)30.9632.6137.4838.0938.9840.2141.01
A (min−1)35.3971.98282.83309.94357.04446.28579.7
R20.9900.9810.9830.9770.9880.9870.992
Second pyrolysis regionHRME (kJ/mol)62.4963.2863.7663.4363.7764.0566.18
A (min−1)1.47 × 1031.61 × 1031.59 × 1031.58 × 1031.61 × 1031.75 × 1032.43 × 103
R20.9930.9920.9960.9910.9930.9920.991
SCME (kJ/mol)52.9853.8953.2553.5753.0953.9654.84
A (min−1)221.99300.64251.72274.99259.32295.19331.71
R20.9920.9890.9930.9920.9910.9910.992
Char gasification regionHRME (kJ/mol)136.43137.79142.24144.54149.41160.28162.47
A (min−1)7.98 × 1058.01 × 1051.11 × 1061.22 × 1061.90 × 1065.69 × 1067.00 × 106
R20.9990.9970.9960.9950.9940.9920.988
SCME (kJ/mol)116.62119.33125.19129.49135.93147.89150.95
A (min−1)6.51 × 1047.85 × 1041.33 × 1051.90 × 1053.59 × 1051.24 × 1061.70 × 106
R20.9910.9880.990.9910.9930.9940.995

