Article

Dependability Impact in the Smart Solar Power Systems: An Analysis of Smart Buildings

1
Informatics Center, Federal University of Pernambuco, Recife 50740-560, Brazil
2
Computing Department, Federal University of Vale do São Francisco, Salgueiro 56000-000, Brazil
*
Author to whom correspondence should be addressed.
Current address: Informatics Center, Cidade Universitária, Federal University of Pernambuco, Recife 50740-560, Brazil.
These authors contributed equally to this work.
Energies 2021, 14(1), 124; https://doi.org/10.3390/en14010124
Submission received: 31 July 2020 / Revised: 1 November 2020 / Accepted: 9 November 2020 / Published: 29 December 2020
(This article belongs to the Special Issue IoT for Smart Grids)

Abstract

:
The Internet has been going through significant transformations and changing the world around us. We can also see the Internet to be used in many areas, for innumerable purposes, and, currently, it is even used by objects. This evolution leads to the Internet of Things (IoT) paradigm. This new concept can be defined as a system composed of storage resources, sensor devices, controllers, applications, and network infrastructure, in order to provide specific services to its users. Since IoT comprises heterogeneous components, the creation of these systems, the communication, and maintenance of their components became a complex task. In this paper, we present a dependability model to evaluate an IoT system. Amid different systems, we chose to assess availability in a smart building. The proposed models allow us to calculate estimations of other measures besides steady-state availability, such as reliability. Thus, it was possible to notice that there was no considerable gain of availability in the system when applying grid-tie solar power or off-grid solar power. The grid-tie solar power system is cheaper than the off-grid solar power system, even though it produces more energy. However, in our research, we were able to observe that the off-grid solar power system recovers the applied financial investment in smaller interval of time.

1. Introduction

The evolution of communication systems and devices brought a great number of new applications. In the mobile context, the number of smart devices or objects capable of communicating and computing (e.g., sensors, home appliances, smartphones) has been growing [1]; consequently, it became necessary to create a heterogeneous communication network capable of connecting several types of objects. This paradigm is popularly known as the Internet of Things (IoT). S. Haller et al. [2] say that everyday gadgets are seamlessly combined into the data network and can turn vital partners in enterprise processes; also, services are possible to communicate with these “smart objects” across the Internet. With a large amount of information generated by sensors and actuators, a lot of new services became feasible in many different areas, such as industrial automation, healthcare, traffic, environmental, agriculture, livestock, and so forth [3].
In smart cities context, smart buildings are receiving more and more notoriety; smart buildings are those that use technology to share information about what is happening in the building itself, and then optimize its performance [4]. Smart buildings take advantage of the connectivity of IoT devices and management systems to remotely monitor and control several systems. The most fundamental feature of a smart building is that the core systems within it are linked in [5]; therefore, everything is connected (e.g., water meters, pumps, fire alarms, power, lighting, etc). They are also capable of generating data about their use, and through this information, it is possible to have a healthier, more economical, and sustainable buildings [6].
In general, sustainable buildings are called green buildings, which is the concept used to designate a building or space constructed based on criteria related to social, environmental, and economic sustainability; it also considers its entire useful life [7]. The planning, design, construction, and operations of green buildings have as main considerations: electricity application, water usage, indoor environmental condition, and the structure’s impacts on its locality [8]. Actions to reduce energy consumption and adoption of renewable technologies for energy generation are an important concern nowadays [9]. In this aspect, we consider many opportunities for automation, employing a set of sensors that detect motion, energy consumption of the lights, equipment, and so on.
In this paper, we propose a mechanism to identify the availability impact in two autonomous energy management systems. We also present a hierarchical model, comprising closed-form equations and Stochastic Petri Nets (SPNs) models to represent and evaluate the proposed system. The autonomous energy management system was chosen for analysis, considering local management infrastructure with redundancy. The result of this comparison showed that downtime in a grid-tie photovoltaic autonomous energy management system is similar to the hybrid; also, the deploying cost was compared between the two systems. Besides, our analysis showed that the autonomous energy management system with a hybrid photovoltaic system will have a faster financial investment return than using the grid-tie one.
In summary, the main contributions of this work are:
  • an SPN availability model for the smart photovoltaic management system;
  • the comparison between the implementation cost of the grid-tie and hybrid solar.
This paper is structured as follows: Section 2 depicts some of the main related works. Already, Section 3 discusses the fundamental concepts of the Internet of Things, solar power systems, and dependability modeling, and these concepts are important to comprehend this work. Section 4 introduces the management photovoltaic system infrastructure. Section 5 depicts the smart photovoltaic management system. Section 6 discusses the models suggested for describing such a system. Section 7 shows case studies and the outcomes that were achieved. Lastly, Section 8 depicts some outcomes of the paper and explains some drifts for future works.

2. Related Works

In this section, we describe some of the most relevant related works for our research. We divided it into two subsections, dependability in IoT systems and dependability in the solar power system. This distinction was performed because many of the works do not address both aspects together.

2.1. Dependability in IoT Systems

Currently, few works propose dependability evaluations in IoT infrastructures. Macedo et al. [10] proposed models based on Markov Chains, and the authors also proposed redundancy, in order to evaluate availability and reliability in IoT applications. The authors aimed at the issues of connectivity between the end devices. Each model suggested in their work addresses redundancy theories such as perfect exchange, not perfect exchange, and standby failure. Their outcomes display a meaningful increase in availability when there is redundancy in the Internet of Things systems.
The work proposed in [11] aims at evaluating the reliability in a smart agriculture system. In order to perform such evaluation the Riverbed Optimized Network Engineering Tools (OPNET) was employed considering two different computational visions, with and without using a cloud computing infrastructure for data storage, as well as communication using WiFi and Ethernet. As result of the work, the authors reported that the sensors are the components that most affect the reliability due to the time of communication between them and the router.
Li et al. [12] suggested a formally investigation of the reliability and perspectives that determine the expense of including an IoT system, including Service-Oriented Computing (SOC). Finite State Machines (FSM) and Markov Decision Process (MDP) models were employed to describe services’ structure and specify operations’ reliability. The results presented in [12] can aid in decision-making, alerting when it will be necessary to deploy a spare candidate service because of the reliability of the selected primary service is not high enough.
On the other hand, Andrade et al. [13] utilized Stochastic Petri Nets (SPN) models to describe a resolution for failure recovery on the Internet of Thing systems and held an intelligent healthcare system case study. The models allowed the authors to compute metrics such as availability and unavailability, further estimated in this work, applying distinct network connection types among objects.
In [14], the authors proposed the evaluation of dependability in a smart home system. In which, the data network paths of the IoT devices to a storage server were considered with and without redundancy. The result obtained showed that the maximum availability of 97.47% was reached using redundancy in all device paths.

2.2. Dependability in Solar Power System

Dependability evaluation in the solar power system can be found more easily in the literature than dependability in IoT.
Diaz et al. [15] performed a methodological strategy for increasing stand-alone solar power system conditions through dependability investigation, based on field and lab expertise, in which installations in rural zones were used as case studies. The sponsored dependability schemes revealed that depending on the incidents, failure/maintenance and energy deficit aspects affect a similar degree of the energy service implemented by a stand-alone solar power system. Furthermore, it revealed that values around 15% of failures per year are not rare, particularly in the primary and common crucial grades of a project in Europe rural zones.
On the other hand, in [16], the authors presented a standard methodology used to characterize a system’s reliability and availability. The models proposed through the methodology applied in a specific study case showed that mean availability is approaching 100% for five years. In which, the effective availability reported was 99.10%. The study also presented that Inverters are the most unreliable component.
In [17] the authors displayed a method for reliability, availability, and maintainability investigation of a grid-tie photovoltaic system performed utilizing an exponential distribution based on the Reliability Block Diagram method. Seven effective designs of the grid-tie solar-PV exchange systems were investigated in detail to determine the fittest probability density function (PDF). The outcomes reveal that the best PDF for some sub-assemblies, such as the photovoltaic module, connector, and charge controller, is exponential.
Already, in [18], the authors displayed research that focuses on the reliability and availability evaluation of grid-tie photovoltaic systems in the behavior of recurrent faults utilizing the Dynamic Bayesian Networks method (DBN). The authors formed the DBN arrangement and parameter models. The intermittent faults were formed by combining the Markov chains into the DBNs model. The reliability and availability of photovoltaic systems with centralized string and multi-string arrangements were investigated utilizing the suggested method. The outcomes revealed that the photovoltaic system’s reliability and availability with centralized configuration quickly decay confronted with those with string and multi-string arrangements.
All of the works presented in this section were extremely important for the development of our research, as they demonstrated dependability aspects in different systems, as well as showed us which components are important to carry out the proposed analyses. The models presented in those related works also became the basis for the models proposed here, mainly when considered collectively, making their value much larger than individually. It is worth mentioning that our work differs from others by joining IoT systems, solar energy systems and modeling techniques.

3. Background

This section explains the necessary concepts regarding the Internet of Things (IoT), dependability evaluation, and solar power systems, which are essential for an entire comprehension of this article.

3.1. Solar Power System

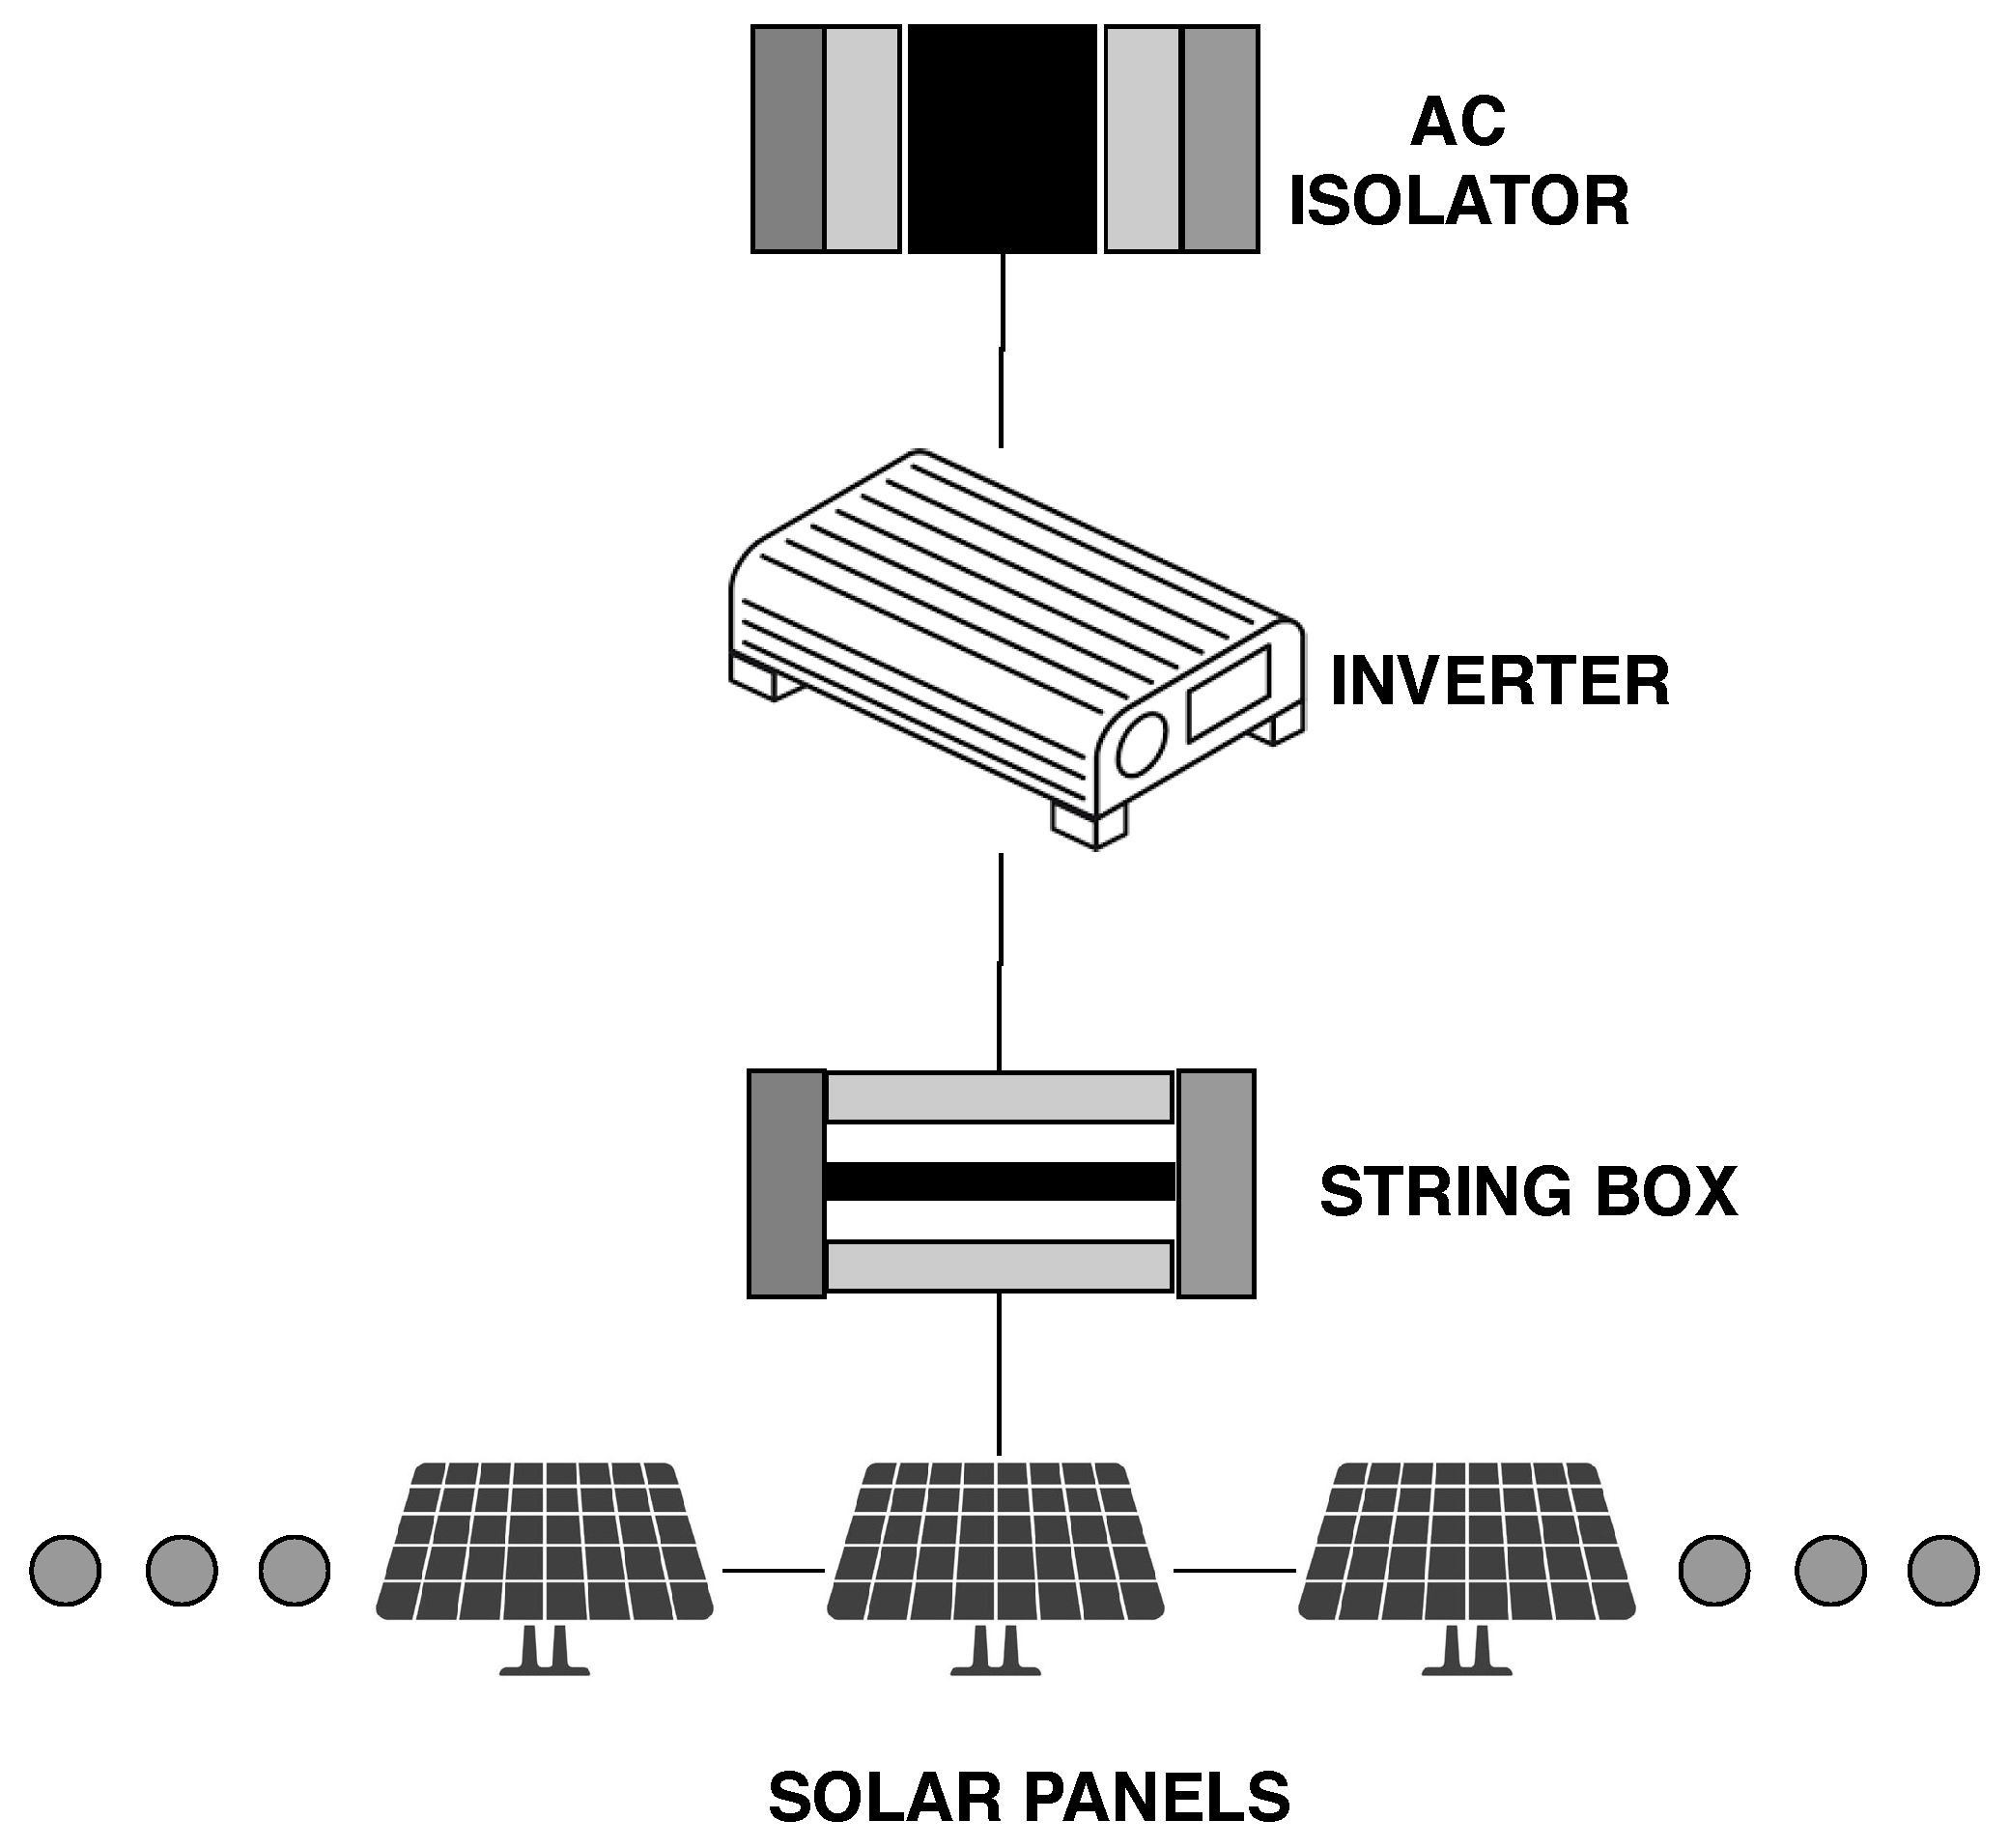
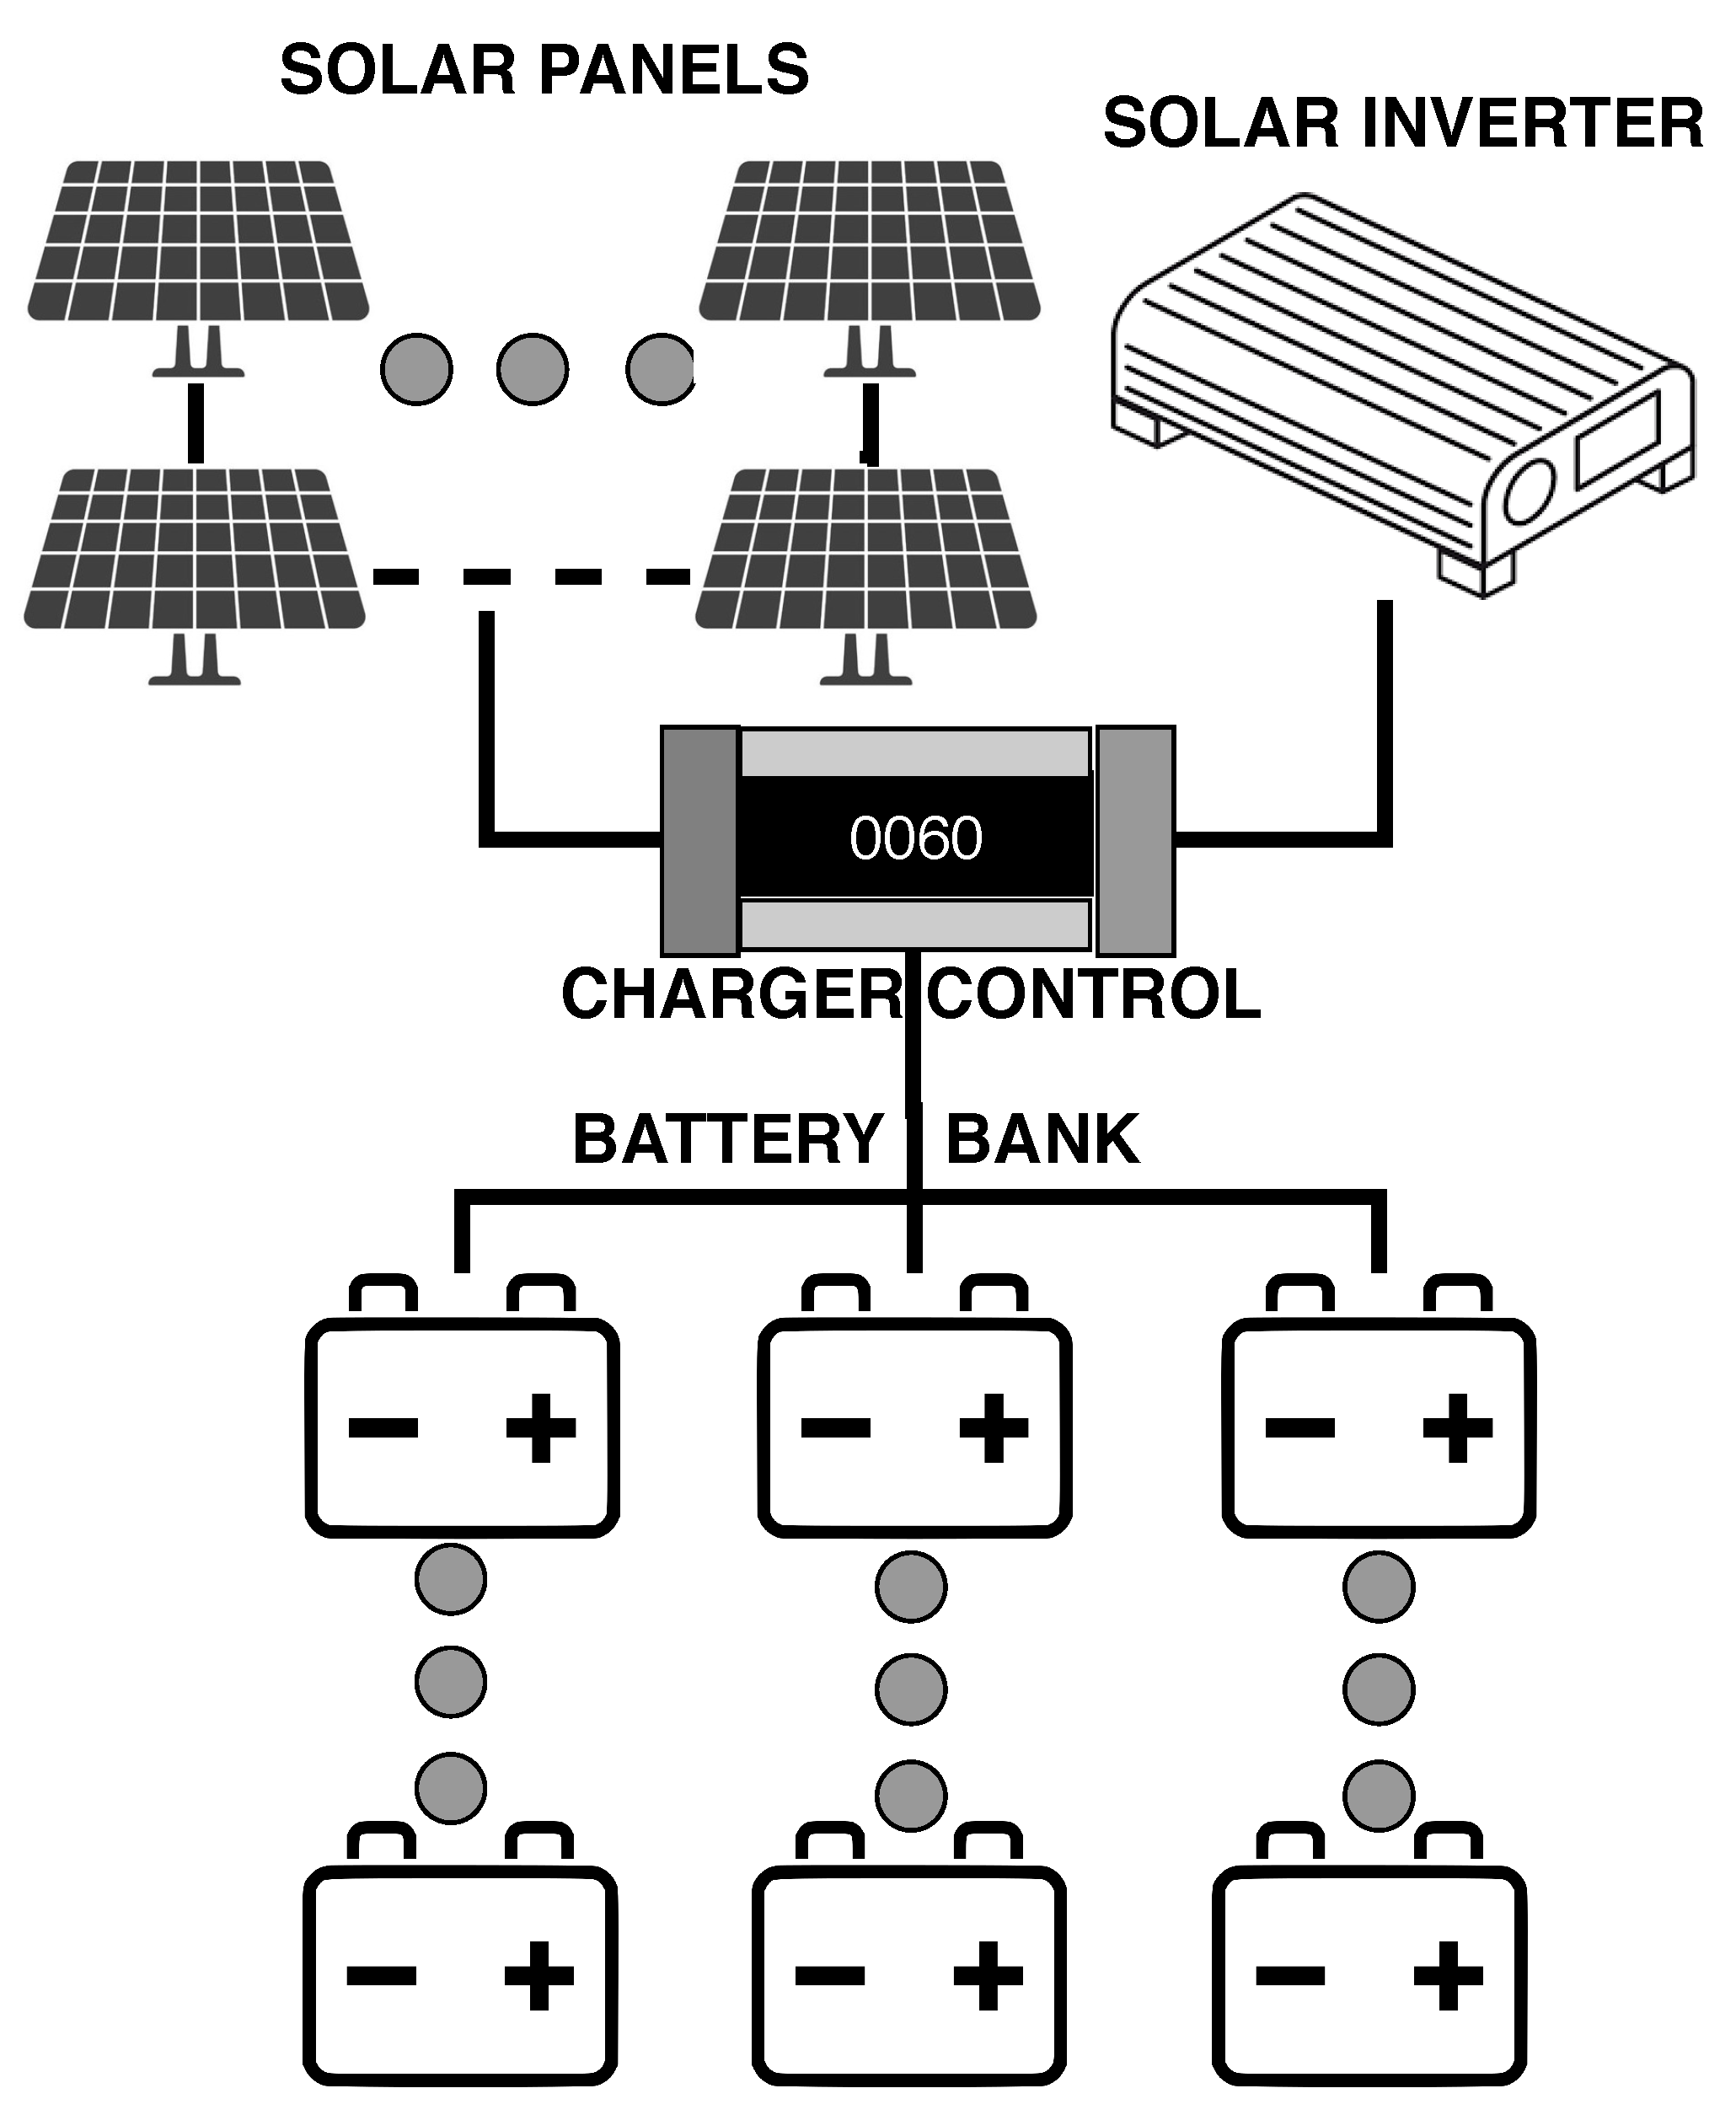
The solar power system directly supplies appliances that will use energy and are generally built for a specific local purpose. There are two basic types concerning solar energy systems; grid-tie (grid-connected) and off-grid (Stand-alone) [19]. The off-grid solar power is widely used in remote locations as it is often the most economical and practical way to get electricity in these places. This kind of system is generally composed of a solar panel or panel array, a charge controller, a battery or battery pack, and an inverter [20]. The grid-tie solar power is generally composed of an inverter, solar panels, string box, and AC isolator. This system kind is used in places that already have electricity with the purpose to supply part of the energy that will be consumed [21]. There is also the solar hybrid system, which connects one or more energy sources besides solar energy [19]. In this work, we compared a hybrid solar power and a grid-tie solar power system. In addition, the methodologies described in [21] were adopted for the sizing of the solar systems present in this work.
The use of batteries in an off-grid or hybrid system is common. Therefore, in these system kinds, the first step is to size the battery bank. The batteries used in the off-grid and the hybrid solar power systems store energy generated by solar panels. To determine the number of batteries of the system, it is necessary to know the amount of energy that should be stored (Wh-Watt-hour); besides, the system output voltage should be defined. According to [21], the stored energy can be calculated through the Equation (1).
E S = E C D D ,
where E C is the energy consumed ( W h ) daily, and D D is the discharge depth allowed (%). The next step is to define the batteries number connected in series. If we intend to calculate the batteries number connected in series, we use the Equation (2) [21].
N B S = S V B V ,
considering that the S V is the output voltage of the system (V-Volt), and B V is the output voltage of a battery (V).
However, it is also needed to determine the number of batteries connected in parallel. The battery bank load capacity will be used to determines the number of batteries connected in parallel (Ah-Ampere hour). It can be determined through the Equation (3) [21].
C B S = E S V B ,
the V B is the output voltage of the battery bank (V). On the other hand, the number of batteries connected in parallel can be calculated through the Equation (4) [21].
N B P = C B S C B ,
C B is the battery load capacity (Ah).
To know the number of solar panels to generate required energy, the designer can use two methods, daily heat stroke or maximum module current [21]. In this work, we considered only the daily heat stroke method because we adopted the charge controller with MPPT (Maximum Power Point Tracking). Besides, the grid-tie system always has an inverter with MPPT system. Equation (5) [21] shows how it is calculated the produced energy (Wh) daily by one solar panel in this method.
E P = E s × A m × η m ,
where E s is daily heat stroke (Wh/m 2 /daily). A m is module area (m 2 ). Finally, η m is module efficiency (%).
According to [21], all solar power systems with batteries should employ a charge controller or charge regulator. The charge controller is responsible to connect the solar panels and the batteries correctly. The choice of the charge controller depends on two parameters: operating voltage and maximum current provided by the set of solar panels. The maximum current can be calculated through Equation (6) [21].
C M = I S C × P P × F S ,
where I S C is the module short circuit current (A). P P is the amount of the panels connected in parallel. Finally, the F S is the security factor (%) used to ensure that the maximum current will not be exceeded under any circumstances [21].
The inverter is the electrical equipment able to convert direct current to alternating current (AC) [21]. The inverter is the component needed in the solar power system and is chosen according to input and output voltage. It should also supply the total power of the equipment to be fed [21]. According to [21], all grid-tie solar power system should employ a String box and an AC isolator. String box is protective equipment that isolates the photovoltaic energy production system, to prevent the risk of spreading electrical accidents, such as short circuits and electrical surges [21]. The AC isolator is the equipment responsible for connecting the inverter and electrical network safely [21]. This equipment, as well as the string box, are protection components for grid-tie solar power systems.

3.2. Reliability and Availability

The dependability is the capacity in which a contracted system reliably produces a service. This idea emerged due to the possibility of a breakdown of one or diverse system elements limiting it from addressing the offered service. Accordingly, dependability is straight associated with reliability. The reliability of a system at an instant t, is the probability of a system providing its service without failures up to t time [22]. Hence, given the start value 0 and the last value t expressed by the wide interval, [ 0 , t ) , the reliability is the possibility of an element operating without failure in that period [23]. Equation (7) defines the reliability.
R ( t ) = e 0 t λ ( t ) d t ,
where λ ( t ) is the immediate failure rate. If λ ( t ) = t ( 0 , ) , that is, constant, then the Time to Failure ( T T F ) is exponentially distributed with failure rate equal to λ . Therefore,
R ( t ) = e λ t .
Another significant dependability property is steady-state availability. The availability is determined the possibility of a system to continue working even if there are failures and repairs [23].
We can use the Mean Time to Failure ( M T T F ) and the Mean Time To Repair ( M T T R ) to calculate the availability. Similarly, one can use the system Downtime and Uptime, as it is shown in Equations (9) and (10), respectively.
A = E [ U p t i m e ] E [ U p t i m e ] + E [ D o w n t i m e ]
A = M T T F M T T F + M T T R .
The system’s M T T F can be determined by the integral of reliability as a time function, while the M T T R of a system can be determined from M T T F ’s use to deliver the aspired availability. The availability is provided by (A), and unavailability is provided by ( U A = 1 −A), as explained here.
M T T F = 0 t R ( t ) d t .
When T T F is exponentially distributed with rate λ , then
M T T F = 1 λ ,
and,
M T T R = M T T F × ( U A A ) .
If T T F (Time to Failure) and T T R (Time to Repair) are exponentially distributed with λ and μ , respectively, then:
A = μ μ + λ .
Finally, fault tolerance is also related to dependability, and it consists of the ability of a system to continue to function even though some components may fail [22].
The availability and reliability models can be classified as combinatorial and state-based [24,25]. Combinatorial models also take into account the structure of the system as well as the conditions of operation and failure; however, combinatorial models do not respond very well when the components of the system communicate in complex ways. The state-based models represent the system through its states/events and enable the representation of more complex dependence between components, more complex behaviors, which might be represented by phase-type distributions [25]. The choice of which model to adopt should be carefully studied. In order, the model represents system behavior correctly.

3.3. Stochastic Petri Nets

Petri Nets (PNs) denote one great modeling mechanism used to describe simultaneous, asynchronous, shared, parallel, deterministic, and stochastic processes [26]. These nets determine a term procedure that provides a numerical and graphical description, and it has scientific tools that permit confirmation of the features and exactness of illustrated systems. An extension of PNs is denoted as Stochastic Petri Nets (SPNs) [27]. SPNs mate a stochastic stop to individually clocked transition. Hence, stochastic petri nets can be isomorphic to Continuous Time Markov Chains (CTMC), and, consequently, they can give performance dimensions [28].

4. Photovoltaic System

In this section, we presented a general architecture photovoltaic system. This architecture includes the main components of grid-tie, and hybrid photovoltaic systems. Figure 1 shows the common components found in these types of systems. The solar panel is responsible for capturing energy from sunlight and transforming it into electrical energy, this element is indispensable in all photovoltaic systems. The battery is responsible for storing the energy captured by the solar panel, all hybrid photovoltaic system has this component. The utility grid, source of energy used when solar energy cannot supply the demand. This alternative energy source is used in hybrid and grid-tie systems. The building represents the set of elements that will consume electricity. It is worth mentioning that it is possible to have other sources of energy in addition to the previously mentioned.
However, as mentioned earlier, not all photovoltaic systems have all of these components. For example, a grid-tie systems do not have batteries. This makes this type of system the cheapest among the other types. Besides, depending on the tariff system adopted, the power grid can be used as a virtual battery. Figure 2 shows the components needed in this type of photovoltaic system. The inverter is the electrical equipment able to convert direct current to alternating current. The string box is protective equipment that isolates the photovoltaic energy production system, to prevent the risk of spreading electrical accidents. The AC isolator is the equipment responsible for connecting the inverter and electrical network safely.
Hybrid solar systems are an alternative for those who desire have more than one energy source. However, this type of system is more expensive than grid-tie system, mainly due to the number of batteries used to support the entire energy demand. On the other hand, it allows access to energy, even if there is a power failure in the utility grid. Figure 3 shows the necessary components in this type of system. The charge controller is responsible to connect the solar panels and the batteries correctly.
In this work, we considered a grid-tie and Hybrid systems to the smart photovoltaic system. The following section presents our proposal for energy management based on Internet of Things.

5. Autonomous Photovoltaic Management System

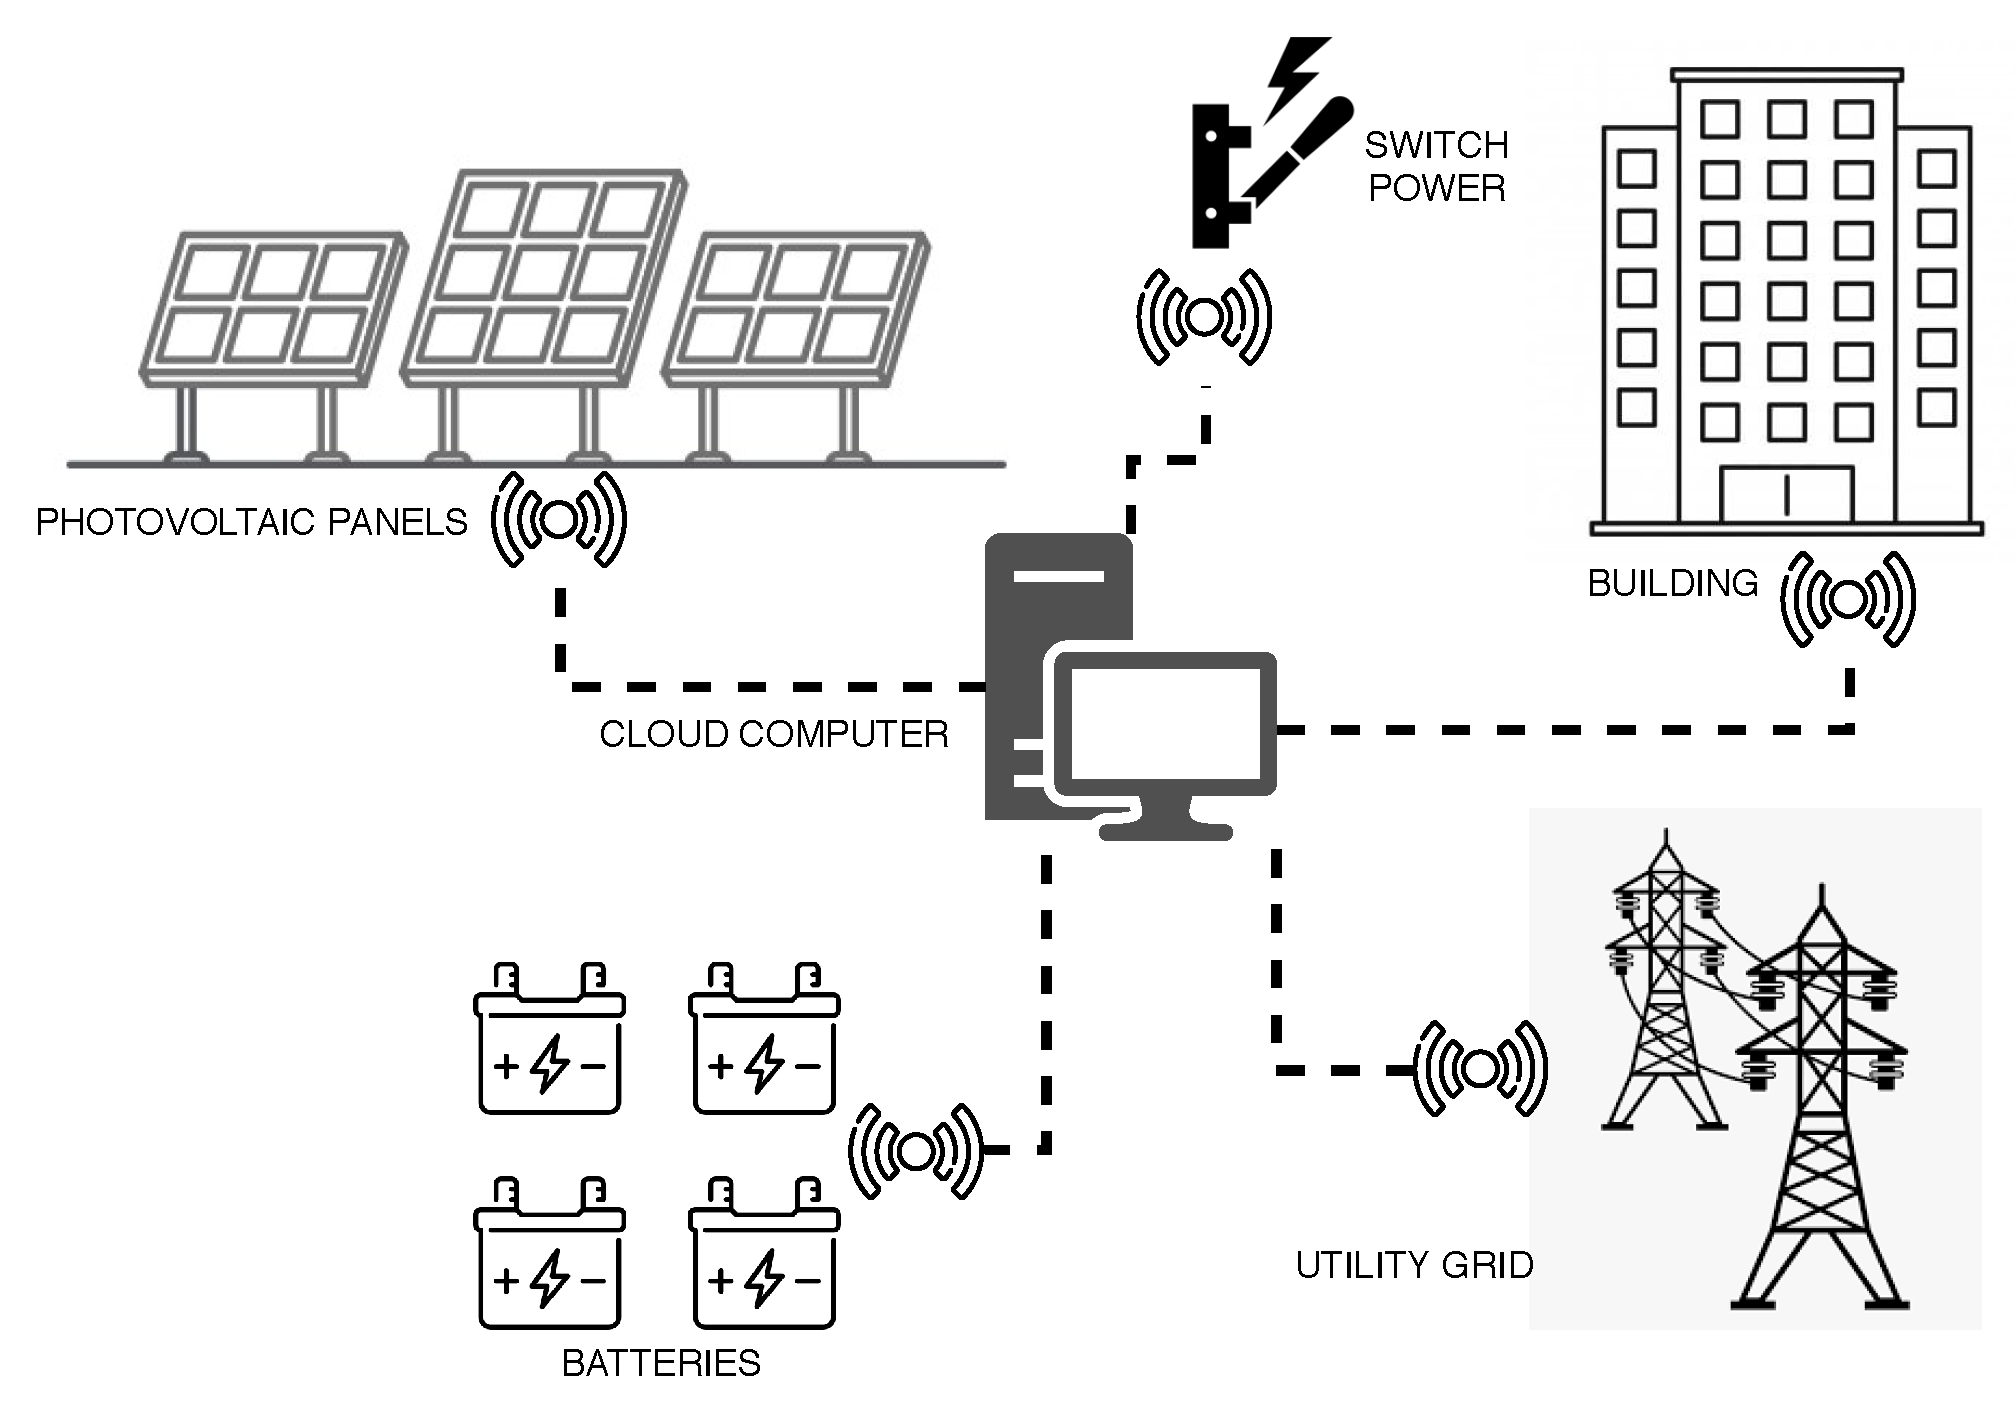
This section presents an autonomous management system for the photovoltaic system. This system adopts technologies based on cloud computing and the IoT to perform the building’s energy management. This is generic architecture, and can be adapted for any energy management system that contains the same principles. Figure 4 presents a macro view of the autonomous system for energy management. This system includes all the components presented in the previous section (with the presence of sensors). As well, it considers a cloud-computing infrastructure and one switch power, more details are provided below.
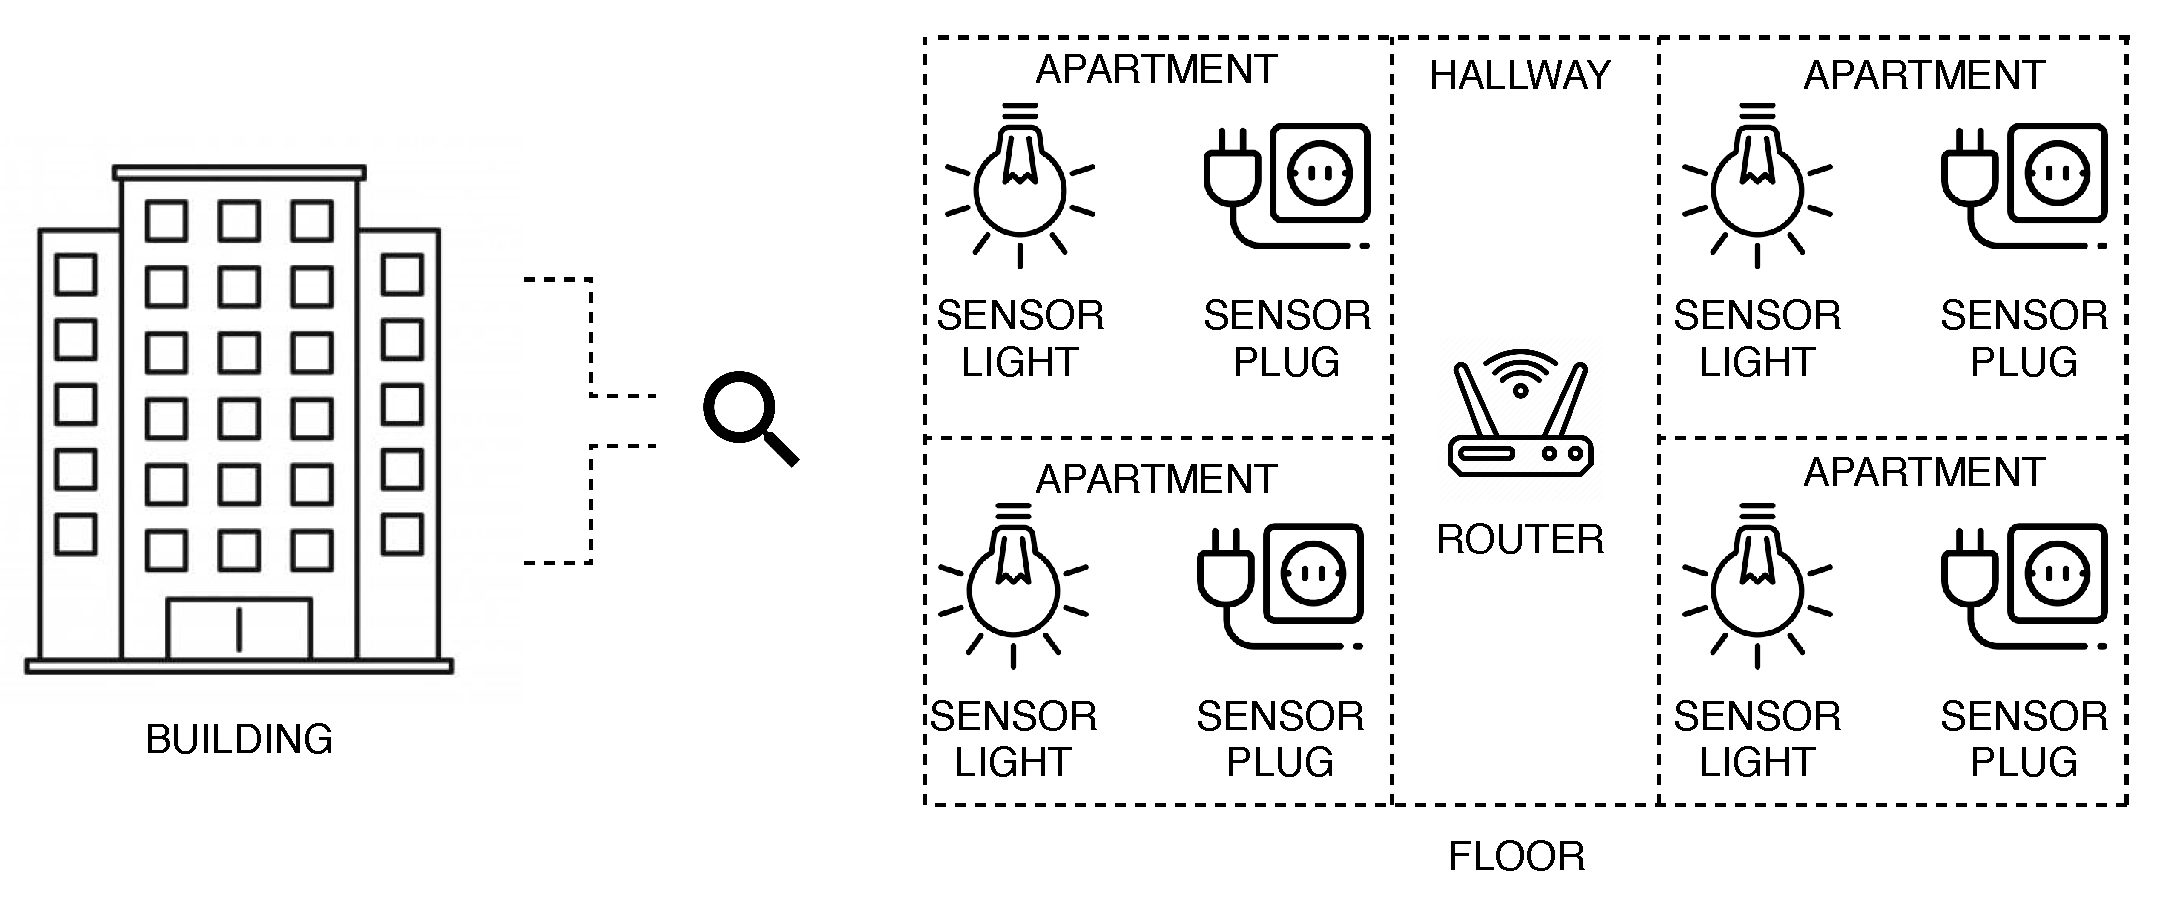
The sensor in the photovoltaic panels captures information about the amount of energy produces. Therefore, it is possible to determine whether the energy generated through the panels is adequate to supply the building in real-time (grid-tie system). Therefore on rainy and cloudy days, where there is little or no incidence of particles of sunlight, the solar system will remain off. Besides, it is easy to identify any defects in the panels. The sensor located in the battery pack has the purpose of informing about the charge level. It is then possible to determine whether the stored energy can supply the building’s demand (hybrid system). If the amount of energy stored in the battery is insufficient, the system will remain off, and the utility grid will remain turn on. The sensor located in the utility grid provides information on the amount of energy used. As well, it is possible to identify if there is a problem with the power supply. All information collected by the sensors is sent to cloud computing infrastructure, where the coordination system will make the appropriate decision for each situation Figure 5 shows the sensors used in the building.
The sensors present in the building capture information about the amount of energy being used to supply lights and electronic equipment. This information is necessary so that the control system (cloud computing infrastructure) can identify when it will be possible to use energy from the photovoltaic system. When possible, the control system (cloud computing) will send a signal to the actuator located on the switch power to activate the power supply directly from the photovoltaic panels (grid-tie system) or battery pack (hybrid system). Likewise, when it is not possible, the control system determines the actuator to activate the supply of energy via the utility grid. All data is transmitted through the routers present in the building.
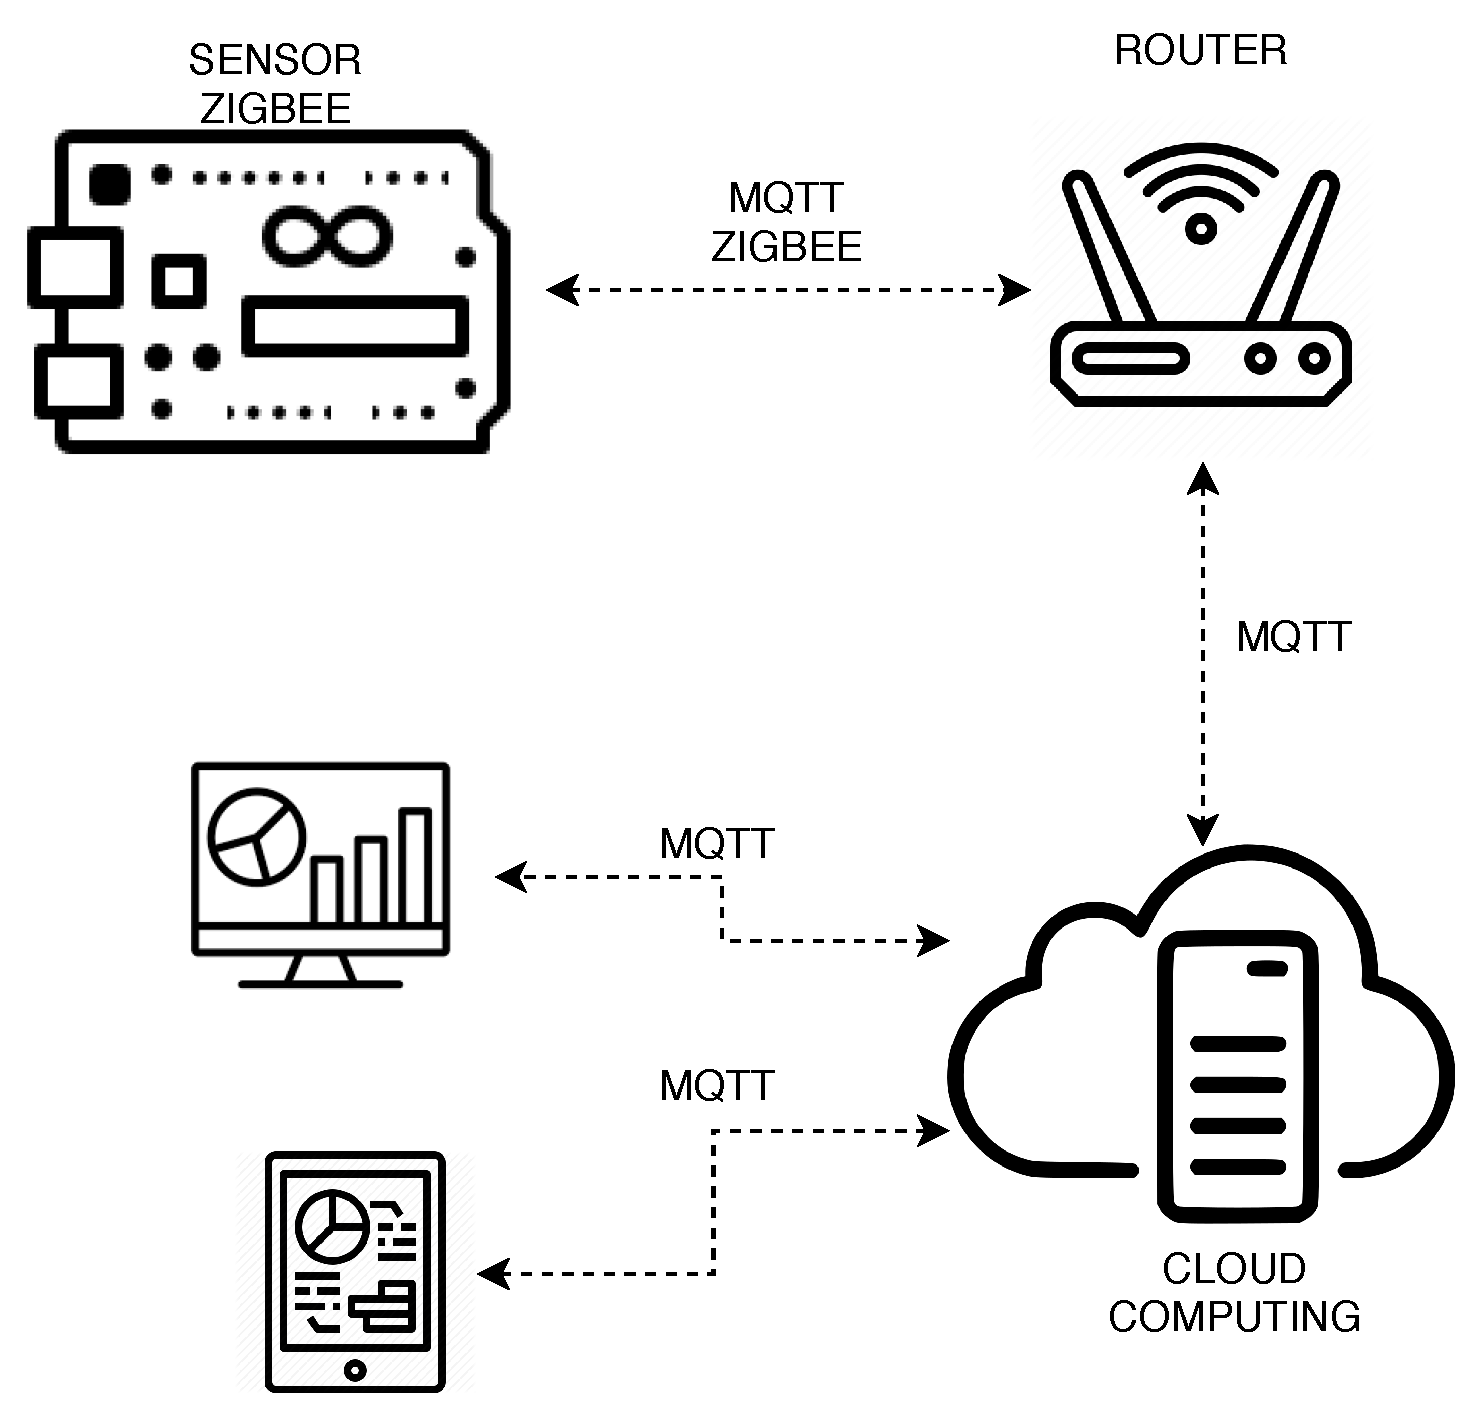
The adoption of sensors makes it possible to recognize the environment, making them powerful instruments for understanding complex things and responding to them efficiently. The sensors can communicate through different protocols, in this work we adopt the technology ZigBee (protocol based on the IEEE 802.15.4 standard) and MQTT (MQ Telemetry Transport-A lightweight messaging protocol for small sensors) to carry out the communication between components. Figure 6 shows the communication between the device and cloud computing. There is bidirectional communication between all components. However, this does not occur totally in practice. The sensors present in the photovoltaic system, batteries, and utility grid only send data. While the sensors located in the building send and receive data, and smart power switch only receives data.

6. Dependability Models

This section explains the models employed for steady-state availability evaluation. We used SPN and mathematical equations to symbolize the association among the elements earlier displayed in the Section 5 to perform the evaluation. Mercury www.modcs.org tool was adopted for SPN modeling analysis [29]. The principal contributions of this work are the models proposed in this section. These models are generic and can be used to evaluate various dependability metrics in real systems that adopt the same principles.

6.1. Model of the Building

This subsection describes the proposed model to estimate the M T T F to a single floor. The components that composed a single floor were described in Figure 5. Therefore, we have smart plug, smart light, and router. We recognize that the F _ M T T F and F _ M T T R ( M T T F and M T T R of the floor subsystem) are exponentially distributed. Therefore, the F _ M T T F can be estimated by integrating reliability as a time function described in Equation (15), while the system’s F _ M T T R can be obtained from the repair team’s reported data.
F _ M T T F = 0 R f ( t ) d t .
Reliability can be obtained by Equation (16), where λ e q is the immediate failure rate of the subsystem, considering that a single failure in any component brings the whole subsystem down. The λ e q can be obtained by summing all immediate failure rates of all components, as shown by Equation (17), where λ P L U G , λ L I G H T , and λ R O U T E R are the failure rate of the smart plugs, light meter sensors and router respectively.
R f ( t ) = e λ e q t
λ e q = X × λ P L U G + Y × λ L I G H T + Z × λ R O U T E R ,
where X represents the number of smart plugs, Y the number of light meter sensors, and Z the number of routers.
It is deserving declaring that the mathematical representations presented in this subsection are generic. Therefore, it allows each designer to represent the appropriate environment for each situation.

6.2. Model of the Hybrid Solar System

This subsection describes the proposed model to calculate the M T T F to a hybrid solar power system. Figure 3 describe the environment proposed, with the exception of the sensors present on the battery bank, on photovoltaic panels, and on the utility grid, as shown in Figure 4. Therefore, we have photovoltaic panels, batteries, inverter, charge control, sensors on panels, battery bank, and utility grid. We consider that the P V _ M T T F and P V _ M T T R ( M T T F and M T T R of the solar subsystem) are exponentially distributed. Therefore, the P V _ M T T F can be estimated by the reliability integration as a time function, as expressed in Equation (18), while the system’s P V _ M T T R can be obtained from the repair team’s reported data.
P V _ M T T F = 0 R f ( t ) d t .
Reliability can be obtained by Equation (19), where λ e q is the immediate failure rate of the subsystem, considering that a single failure in any component brings the whole subsystem down. The λ e q can be obtained by summing all immediate failure rates of all components, as shown by Equation (20), where λ P A N E L , λ C T R L , λ B A T T E R Y , λ I N V E R T E R , λ P S , λ B S , and λ U S are the failure rate of the solar panel, charge controller, battery, inverter, panel sensor, battery sensor, and utility grid sensor, respectively.
R P ( t ) = e λ e q t
λ e q = X × λ P A N E L + Y × λ B A T T E R Y + λ U S + Z × λ I N V E R T E R + W × λ C T R L + λ P S + λ B S ,
where X represents the number of panels, Y the number of batteries, Z the number of inverters, and W number of charger controls.
As in the previous subsection, the mathematical model presented here is generic. Therefore, the designer can manipulate the equations to represent a hybrid photovoltaic park as needed.

6.3. Model of Grid-Tie Solar System

This subsection describes the proposed model to calculate the M T T F to a grid-tie solar power system. It is deserving of declaration that the generic models presented in this subsection can be adapted to any grid-tie photovoltaic system. Figure 2 describe the environment proposed, with the exception of the sensors present on the on photovoltaic panels and on the utility grid, as shown in Figure 4. Therefore, we have photovoltaic panels, AC isolator, inverter, string box, sensors on panels, and sensor on the utility grid. We recognize that the P V _ M T T F and P V _ M T T R ( M T T F and M T T R of the solar subsystem) are exponentially distributed. Therefore, the P V _ M T T F can be estimated by the reliability integration as a time function, as expressed in Equation (21), while the system’s P V _ M T T R can be obtained from the repair team’s reported data.
P V _ M T T F = 0 R f ( t ) d t .
Reliability can be obtained by Equation (22), where λ e q is the immediate failure rate of the subsystem, considering that a single failure in any component brings the whole subsystem down. The λ e q can be obtained by summing all immediate failure rates of all components, as shown by Equation (23), where λ P A N E L , λ I S O , λ S T R , λ I N V E R T E R , λ P S , and λ U S are the failure rate of the solar panel, AC isolator, string box, solar inverter, panel sensor, and utility grid sensor respectively.
R P ( t ) = e λ e q t
λ e q = X × λ P A N E L + Y × λ I S O + Z × λ S T R + W × λ I N V E R T E R + λ P S + λ U S ,
where X represents the number of panels, Y number of AC isolators, Z number of string box, and W number of inverters.

6.4. SPN Availability Model of the Entire System

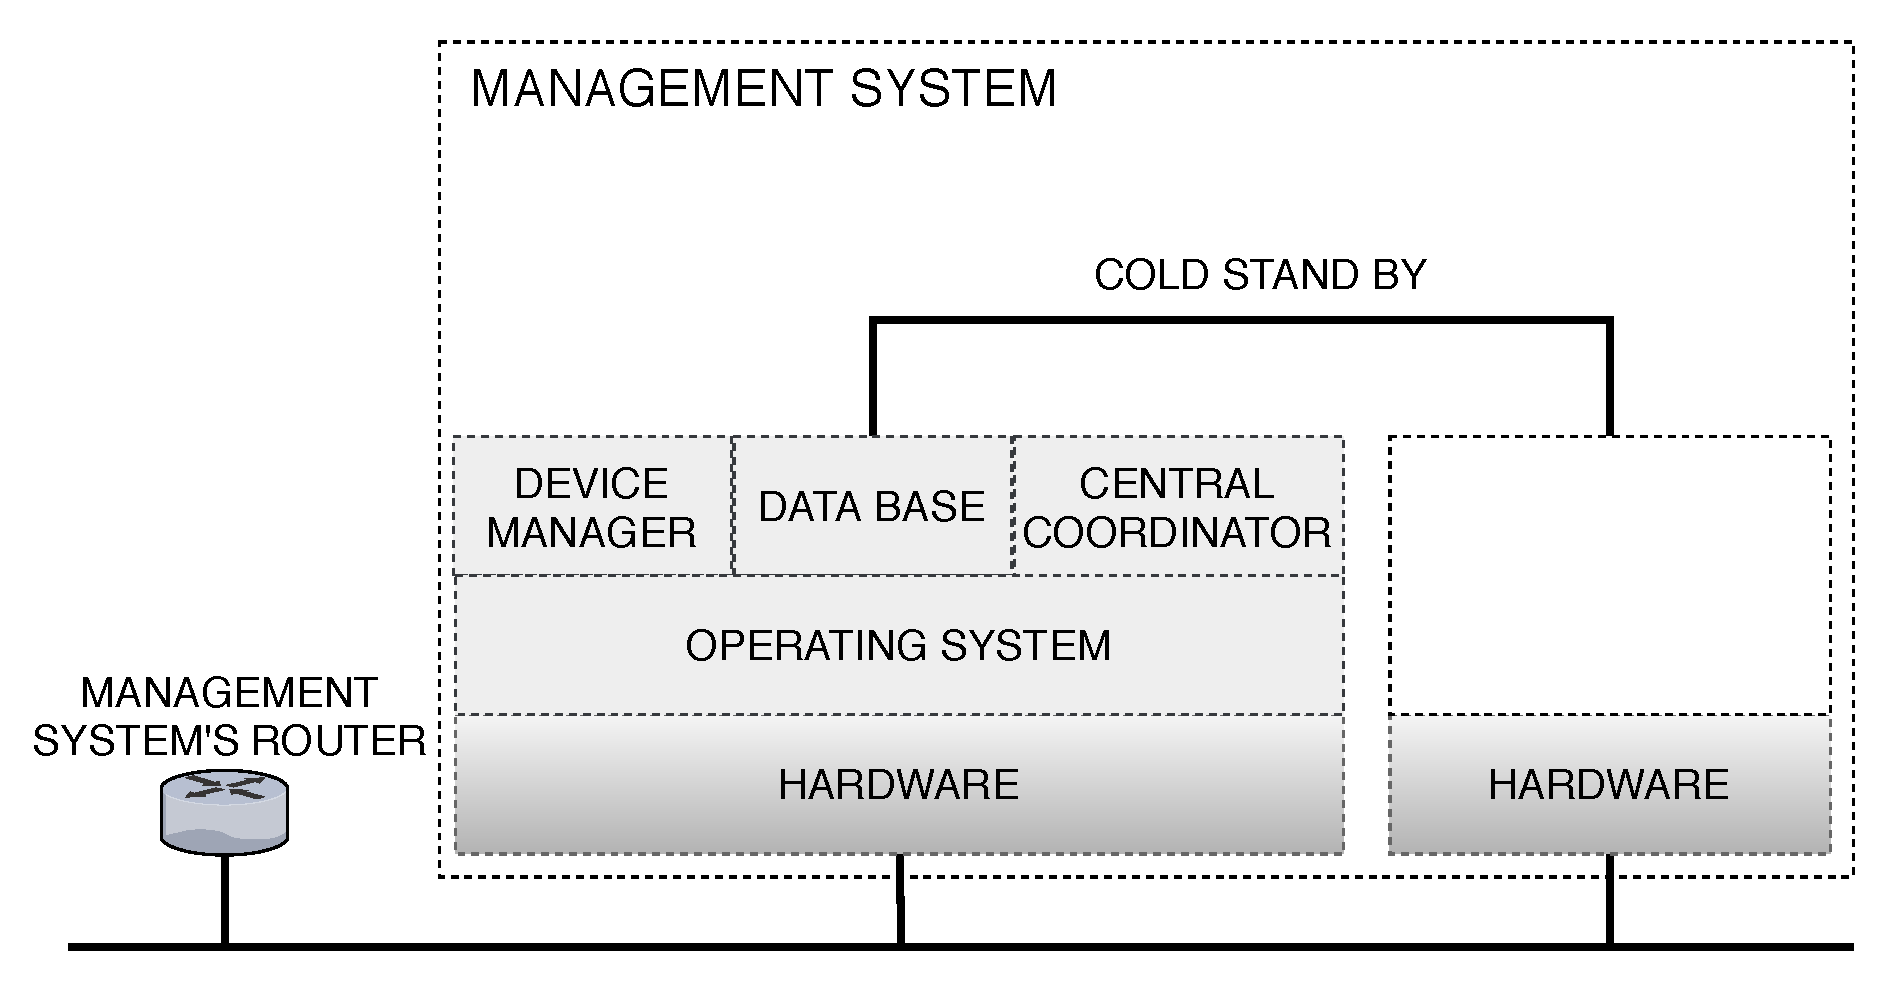
This section details the planned availability model for the whole system regarding a redundant local management infrastructure. Figure 7 shows the management system infrastructure.
This local infrastructure contains the minimum requirements with redundancy for the operation of the proposed system. However, to ensure greater availability, we adopt a cold standby redundancy system, so the secondary machine acts as a backup of the main machine. Therefore, the necessary O.S. and software environment setup will only be made after the primary break down of the first machine. Accordingly, to achieve availability metrics, we recognize six elements, router, hardware, operating system, device manager, database, and central coordinator. The device manager is an application capable of controlling every component besides conceiving the information analytically. A central coordinator is a software that analyzes the energy consumption and the energy generated by the solar energy system in order to activate or deactivate the solar energy system.
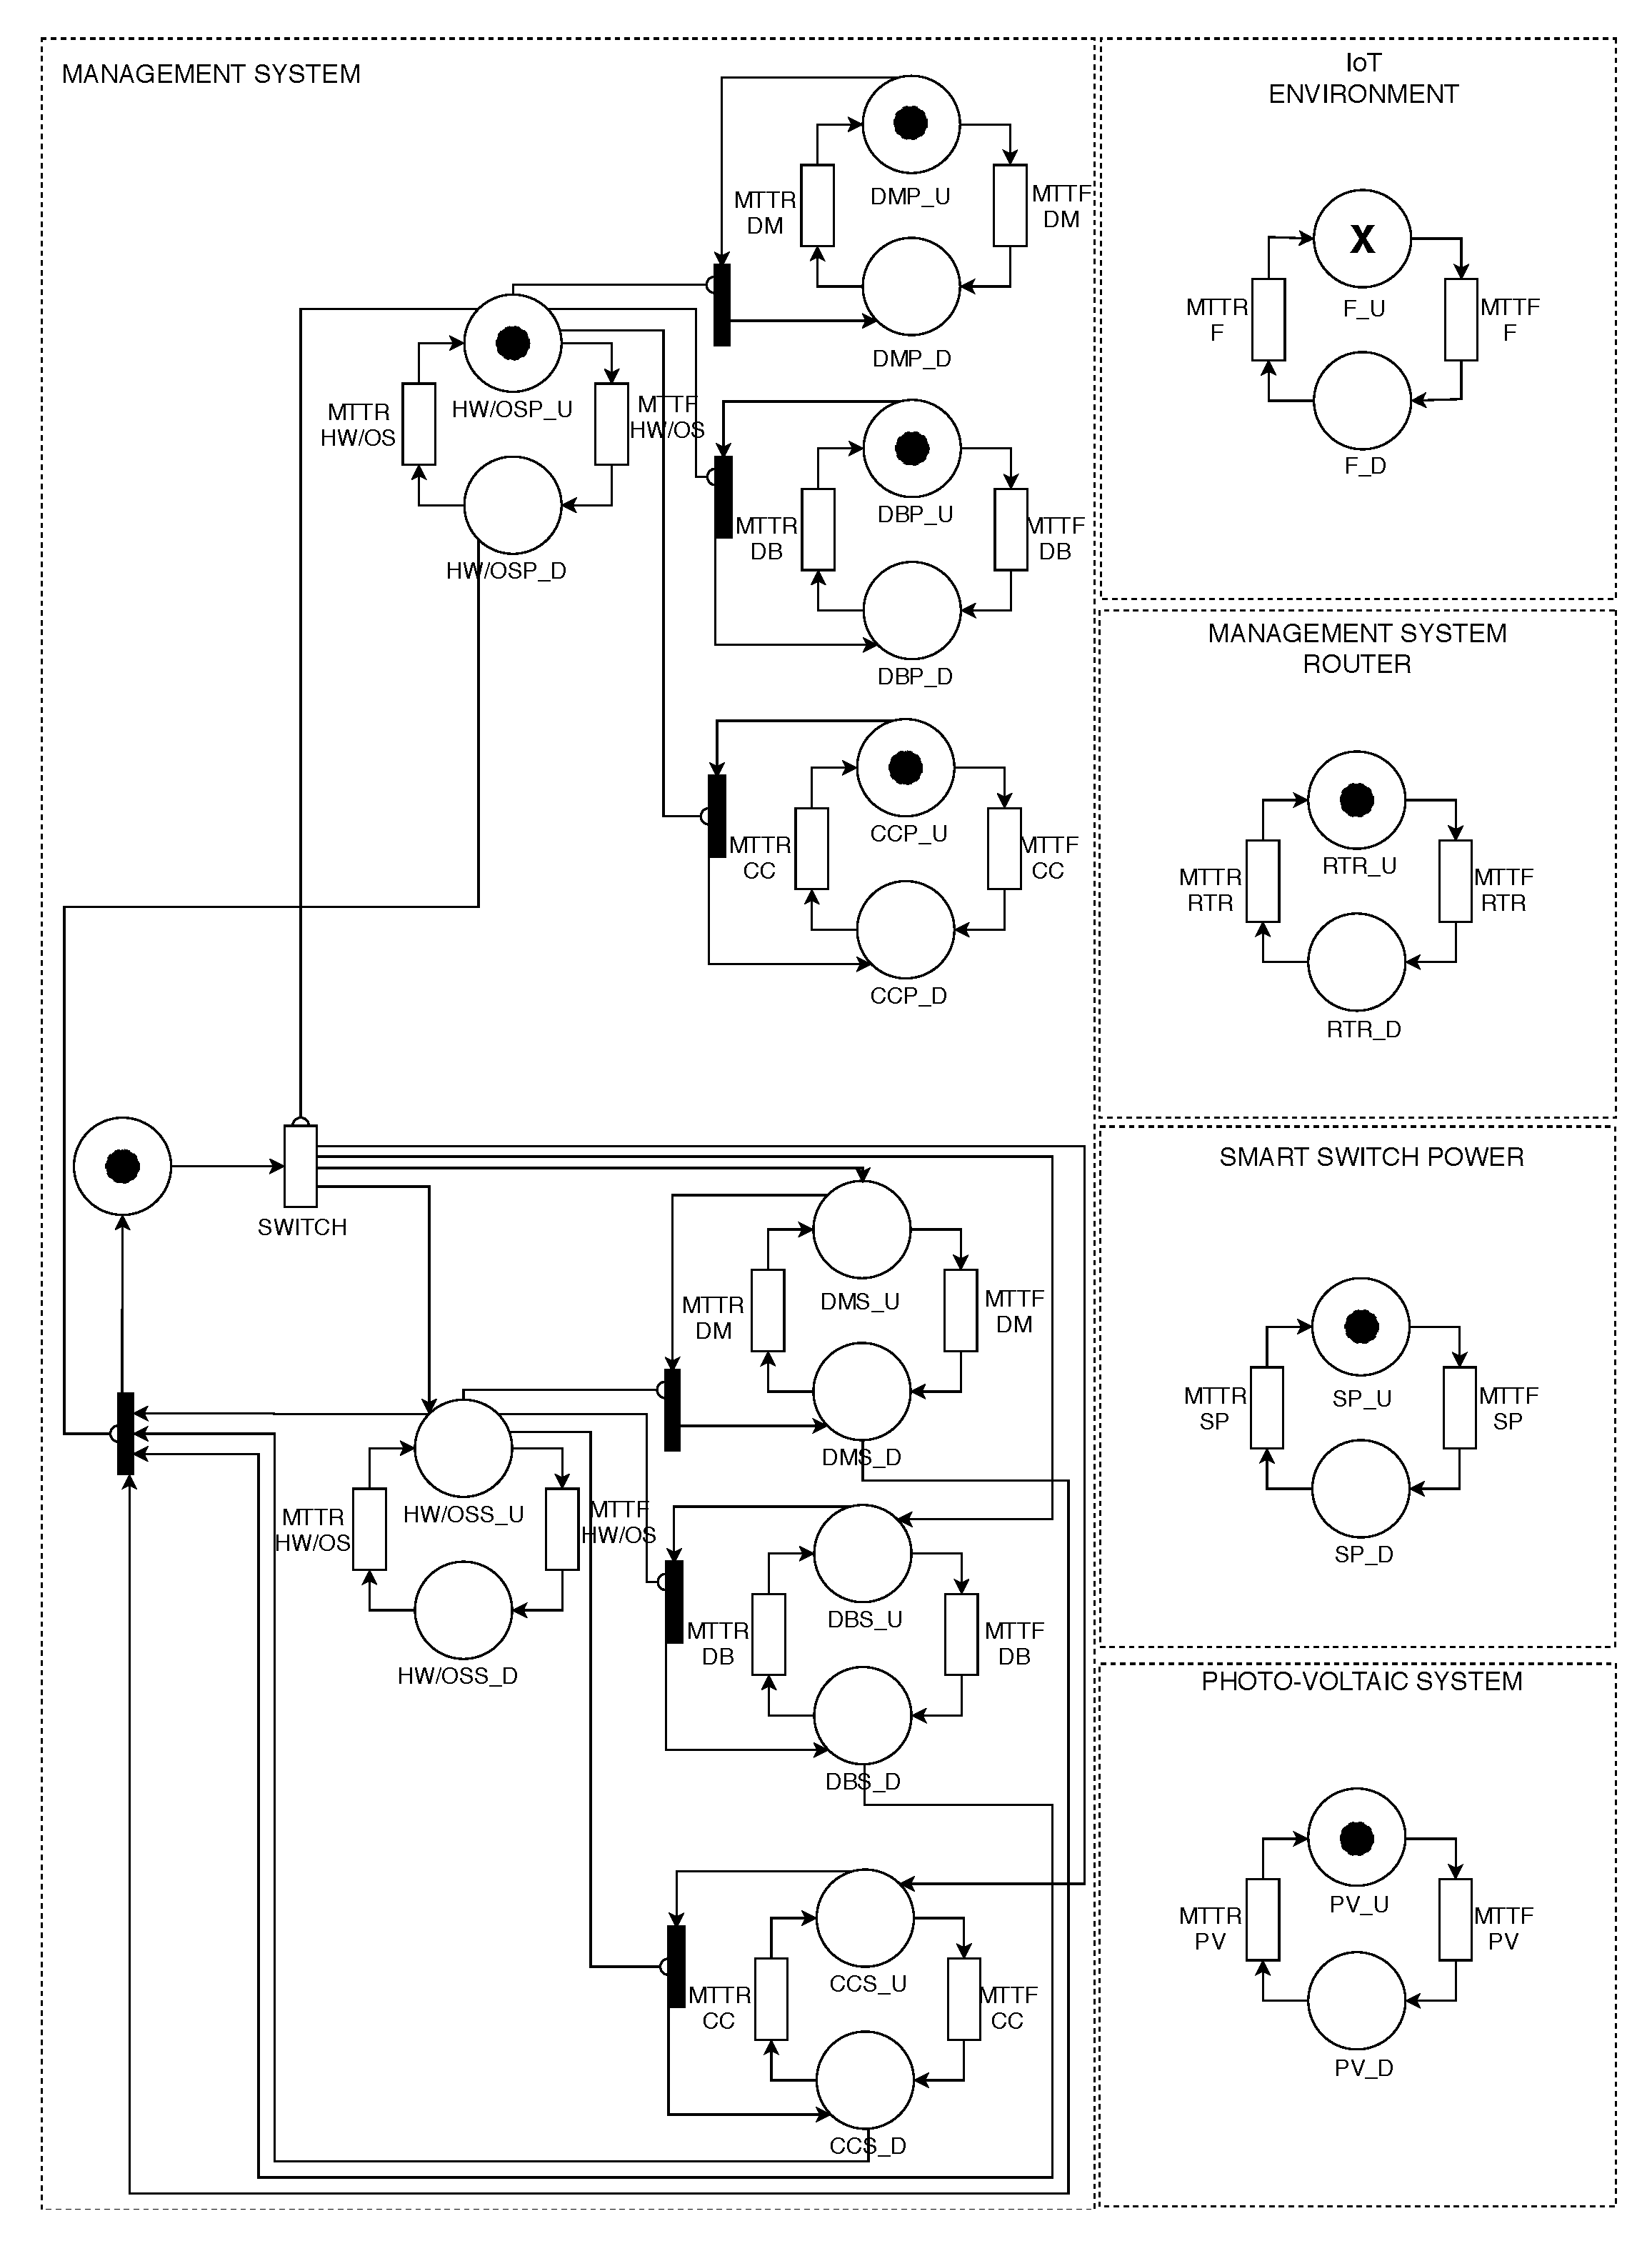
A Stochastic Petri Net (SPN), depicted in Figure 8, was developed to describe the cold-standby redundancy system, discriminated through regarding a non-negligible interval during switching among the computers in the appearance of a crash in one of them. The principal machine will ever become preference over another machine. The model also describes the solar power system and the internet of things environment. Therefore, it is possible to use the “same” model to evaluate both. However, it is necessary to use the corresponding M T T F and M T T R values for each model of the solar power system. The smart switch power and the router responsible for sending the environment data to the management system also presented in the model. The SPN model was used because it allows transitions with delay values exponentially distributed, which is necessary to represent the proposed system accurately. Besides, it enables the representation of system behavior and evaluation of required metrics simply and concisely.
The redundancy system comprises Hardware and Operating System (HW/OS), Device Manager (DM), Central controller (CC) and Database (DB). We assume, for the initial system state, that the primary server is operating, which is described through a token in the place: HW/OSP_U (hardware and operating system are up), DMP_U (device manager is up), CCP_U (central controller is up), and DBP_U (database is up). Every element has an MTTF, whose value is assigned to delay of its respective transition: MTTF_HW/OS (MTTF hardware and operating system), MTTF_DM (device manage’s MTTF), MTTF_CC (central controller’s MTTF), and MTTF_DB (database’s MTTF). These transitions follow a single-server semantic and their firing delays are exponentially distributed. The single-server semantic does not allow multiple firing events when the degree of activation is greater than one, i.e., the transition fires only once at a time. Therefore, when a component fails, the corresponding transition consumes a token from its “up” place to its “down” place. The failure of those components is denoted by the following places: DMP_D (DM is down), CCP_D (CC is down), DBP_D (DB is down), and HW/OSP_D (hardware and operating are down). When a component is down, it might be repaired by the maintenance team. Every element has an MTTR in some transitions in the model: HW/OS_MTTR (MTTR hardware and operating system), DM_MTTR (device manage’s MTTR), CC_MTTR (central controller’s MTTR), and DB_MTTR (database’s MTTR). These transitions also follow a single-server semantic and their firing delays are exponentially distributed. Therefore, when the component is down the transition may fire according to its MTTR, pulling out a token from the “down” place to the “up” place. However, when the primary server (hardware and operating system) fails, the SWITCH transition fires, making the auxiliary server move from the inactive state to enter the active state. This transition describes the moment to turn on the auxiliary server and transfer the workload to it, which takes less time than the time to repair the primary server. The second server is represented by the places: HW/OSS_U (hardware and operating system are up), DMS_U (device manager is up), CCS_U (central controller is up), and DBS_U (database is up). The failure of those components is denoted by the following places: DMS_D (DM is down), CCS_D (CC is down), DBS_D (DB is down), and HW/OSS_D (hardware and operating are down). The H W / O S _ M T T F can be estimated by integrating reliability as a time function, as expressed in Equation (24), whereas the system’s MTTRs can be obtained from the data reported from the repair team.
H W / O S _ M T T F = 0 R h w / o s ( t ) d t .
Reliability can be obtained by Equation (25), where λ e q is the immediate failure rate of all subsystem components. The λ e q can be obtained by summing all immediate failure rates of all components, as shown by Equation (26), where λ H W and λ O S are the failure rate of the hardware, and operating system, respectively.
R h w / o s ( t ) = e λ e q t
λ e q = λ H W + λ O S .
The F _ U and F _ D places described the building environment. The F _ U place represents that every element is active. Whereas, the Figure 5 describe only one floor of the building, this SPN model represents all floors we want, by the quantity of token in the F _ U place represent by X. The MTTF and MTTR of the building environment on a floor are represented in transitions F_MTTF and F_MTTR, respectively. The firing delay of F_MTTF transition corresponds to an exponential distribution, and the transition follows an infinite-server semantic, which enables the transition to fire multiple times simultaneously if there are enough tokens and the timing of events allows that. Therefore, it represents properly the fact that the failures of each floor subsystem are independent of each other. The F_MTTR transition corresponds to an exponential distribution and follows a single-server semantic.
The solar power system is described by P V _ U and P V _ D places. The P V _ U place symbolizes that every element of the solar power system is active. The MTTF and MTTR of the solar power system are represented in transitions PV_MTTF and PV_MTTR, respectively. These transitions also follow a single-server semantic, and their firing delays are exponentially distributed. Whereas, the Section 7.1.1 and Section 7.1.2 presented how the values of the transitions were obtained. The smart switch power sensor, which exchanges the electrical energy to solar energy and vice and versa, is represented by S P _ U and S P _ D places, it means active and inactive respectively. The failure and repair events for this component are represented by RTR_MTTF and RTR_MTTR transitions, respectively. These transitions also follow a single-server semantic and their firing delays are exponentially distributed. The router on the cloud computing system, which transmits data to the management system, is described by R T R _ U and R T R _ D places, indicating active and inactive, respectively. The failure and repair events for this component are represented by RTR_MTTF and RTR_MTTR transitions, respectively. These transitions also follow a single-server semantic and their firing delays are exponentially distributed. The black transitions are immediate, therefore these transitions fire as soon as they are enabled. Equation (27) expresses the availability of the whole system.
A = P # D M P _ U = 1 O R # D M S _ U = 1 A N D P # C C P _ U = 1 O R # C C S _ U = 1 A N D P # D B P _ U = 1 O R # D B S _ U = 1 A N D P # R T R _ U = 1 A N D P # F _ U = X A N D P # P V _ U = 1 A N D P # S P _ U = 1 ,
where, P denotes probability, and # indicates the fraction of tokens in a defined place. Accordingly, the system is available when the central controller (CC), device manager (DM), database (DB), router (RTR), solar power system (PV), smart switch power (SP), and all floors (F) are up. The annual uptime and downtime can be computed using Equations (28) and (29), respectively, considering that 8760 corresponds to the number of hours in a year.
U p t i m e = A × 8760 h
D o w n t i m e = 8760 h Uptime

7. Results

To evaluate the photovoltaic energy management system proposed in Section 5, a grid-tie and a hybrid photovoltaic system were considered. In the Section 7.1, the distinction of each case study is presented. The strategy suggested in this article brings toward report a smart building system for housing. It is worth mentioning that we are considering a building in Recife, Pernambuco, Brazil. Therefore, all variables that influence a photovoltaic project such as, heatstroke, fares, and temperature, are according to the region, but it can easily be applied to other cities and countries.
We are considered a building with fifteen floors, containing four apartments per floor. In each apartment have three smart plugs. These sensors aim at capturing data about the energy consumption of the electrical equipment. There are smart sensors to measure the energy consumed from the lights. Each apartment has a sensor of this type, as well as in the hallway of each floor. These data are used to predict when the solar power system can be used instead of electrical energy. The data are sent to the management system through a router present on each floor.

7.1. Photovoltaic Systems

In this subsection, define the approaches used for the autonomous energy management system when we adopt a hybrid and a grid-tie photovoltaic system. More details below.

7.1.1. Hybrid Solar System

The central idea to adopt a solution hybrid to the photovoltaic system is to determine the period of time that solar energy will be used. In this work, we determined that the autonomous power management system will activate the power supply through the batteries only during peak hours, when possible. Peak hours are, by definition, the period of the day when peak demand for electricity occurs. In Recife, due to the habits of the population, this time usually occurs between 5:30 p.m. and 8:30 p.m. In other words, we are not measuring the consumption of the whole day; we are only taking into consideration the period between 5:30 p.m. and 8:30 p.m., i.e., the peak hours.
To size the solar power system, it was necessary to determine the amount the energy that we intend to consume. For such, we used the OpenStudio software [30], in which we model a building with parameters previously mentioned. However, we inserted some electrical equipment and their usage time to determine the amount of energy that it spends with cooling, interior lighting, interior equipment, and fans. The model of the building considers the climate zone of Recife, State of Pernambuco, Brazil. The simulation results are shown in Table 1 for the peak period.
Figure 3 shows the components set in a off-grid or hybrid solar system. The system is composed of batteries, solar inverters, charge controllers, and solar panels. We determine the battery bank from the amount of energy average daily consumed. The daily consumption can be calculated through Equation (30), where 4588.05 kWh is the annual consumption of energy in peak time, and 365 the number of days the year.
E C = 4588.05 kWh 365 .
The energy that we will store in our battery bank can be calculated through Equation (1). To determine the energy total stored, we need to define the limit of discharge of the battery bank; we choose 50% as a limit of discharge. Thereby, we have a balance between energy consumption and the life cycle of the batteries.
To determine the number of batteries needed, it is necessary to define the operating voltage of the system. We defined the operating voltage as 48 V. Therefore, the batteries connected in series should produce 48 V. Each battery in our system has 12 V and 220 Ah. We used four batteries in series to produce the voltage needed. The battery bank load capacity is calculated through Equation (3), where the system’s operating voltage is 48 V. Equation (4) determines the number of batteries connected in parallel, where 220 Ah is the battery load capacity of each one.
To ensure the necessities of the system, we round the result to the next integer value. Therefore, we have a total of twelve batteries. Three set connected in parallel, with four batteries each. To determine the number of solar panels, we used the daily heat stroke. In this method, it is only valid when considered the use of charge controllers with MPPT resources. The first step is to know the module characteristics; the module chosen has 1.98 m tall, 0.992 m wide, and 17% of efficiency. The energy produced daily by one solar panel can be calculated through Equation (5), where 4.28 KWh is the daily average solar radiation in June. As June has the smaller daily average of solar radiation of the year in Brazil, our system will produce at least what we expect for that month. Table 2 shows the daily average of solar radiation in the whole year.
The modules number needed can be calculated through Equation (31). The result shows that we need 8.8 panels to supply the energy consumed daily. Therefore, considering the energy produced and charge controller output voltage, we adopted nine photovoltaic panels. It is worth point out that the chosen module has 37.3 V output voltage.
N M = E C E P .
The charge controller is defined through operation voltage and electric current provide by the solar modules. The electric current can be calculated in Equation (32), where 3 is the amount of the panels connected in parallel; and 9.33 A is the module short circuit current in standard test conditions. Therefore, we chose one charge controller that supports an input voltage 111.9 V, output voltage 48 V and maximum current 27.99 A.
C M = 3 × 9.33 A .
The solar inverter should be chosen through the voltage of specified input and output. Besides, the inverter should support the total power of the equipment and lights of the building. The total power can be calculated through Equation (33), where 12,570 Wh is the energy consumed in peak time daily, and 3 is the duration (in hours) of the peak time in Recife, Brazil.
P T = 12 , 570 W 3 h .
Therefore, we chose one inverter that supports the output power 4190 W, 48 V input voltage, and 220 V output voltage. In summary all components of the hybrid photovoltaic system are:
  • 9 panels photovoltaic;
  • 12 batteries;
  • 1 charge controller;
  • 1 inverter

7.1.2. Grid-Tie Solar Power System

The main idea to adopt a grid-tie solution for a photovoltaic system is to make the most of the energy generated in real-time. Therefore, we assume that when the energy generated by the photovoltaic panels is sufficient to supply the building’s demand, the autonomous management system will disconnect the connection to the utility grid, and will connect the connection with the photovoltaic system. It means the energy produced will be used when energy tariff is cheaper (8:00 a.m.–5:30 p.m.). Figure 2 shows the set components that composed a grid-tie photovoltaico system. The system is composed of a solar inverter, string boxes, solar panels, and AC isolator.
A way to determine the energy amount that we want to produce is to take into account the space available for the installation of solar panels. In this work, we considered that space available for the installation of solar panels support nine panels. The grid-tie solar power system has an inverter with MPPT. Therefore, the best way to calculate the energy produced by solar panels is by using the daily heat stroke method. For that, it is necessary to know the solar panel model that will be used in the system. We chose the same model used in the hybrid solar power system. This will help us to have a better comparison between grid-tie and off-grid solar power systems. The energy produced daily by all solar panels can be calculated through Equation (5).
The first step to inverter sizing is know if we can connect all panels in series. This can be performed by calculating the maximum output voltage of the string. That can be calculated through Equation (34), where 45.6 V is the panel open-circuit voltage in STC mode, and 9 is the number of panels. Finally, we used 10% as a security factor to ensure the proper functioning of the component. The last step is to know if the invert supports the panels’ max power. The max power can be calculated through Equation (35), where 330 W is the panel power, and 9 is the number of panels.
V O C , s t r i n g = 45.6 V × 9 × 1.1
P m a x = 330 W × 9 .
Therefore, the invert chosen should support at least an input voltage of 451.44 V and an input power of 2970 W. The string box and AC isolator are chosen using the same values obtained to size the inverter. In summary, all components of the hybrid photovoltaic system are:
  • 9 panels photovoltaic;
  • 1 string boxes;
  • 1 AC isolator;
  • 1 inverter

7.2. Results Obtained with the Proposed Models

The focus of this work is to assess the availability of an intelligent energy management system and its impacts. To perform this, we evaluated the autonomous energy management system in three aspects; availability, acquisition cost, and financial return. Therefore, we compare an autonomous energy management system applied to a grid-tie photovoltaic system. We compared it with a hybrid photovoltaic system.
The availability models presented in Section 6 are used to assess availability for the autonomous energy management system. It is worth mentioning that availability was calculated for each autonomous management system. We input some MTTF and MTTR values to evaluate the models proposed in this work. These values were extracted from the literature [31,32,33,34,35,36,37]. The MTTF and MTTR values for components used in models can be seen in Table 3.

7.2.1. Autonomous Energy Management System: Availability

This sub-subsection presents the availability analysis of the autonomous energy management system. To perform this, we compared the availability of an autonomous energy management system with a grid-tie photovoltaic system with a hybrid photovoltaic system. Table 4 shows the results of the available metrics of the autonomous energy management system of a building. To evaluate the availability, it was considered 15 floors, and that all the components on all floors have to be working. Besides, all components of the photovoltaic system and management infrastructure have to be working. The results showed that both autonomous energy management system downtime considering fifteen floors is more than 48 h for the whole system. Therefore, it implies two days of unavailability approximately. It shows that the system will supply the energy demand in 363 days of the year. We obtained values similar to both systems, this occurs due to the high MTTF values of the solar power system components. Therefore, the solar power system has few impacts on the availability of the whole system.

7.2.2. Autonomous Energy Management System: Deploying Cost

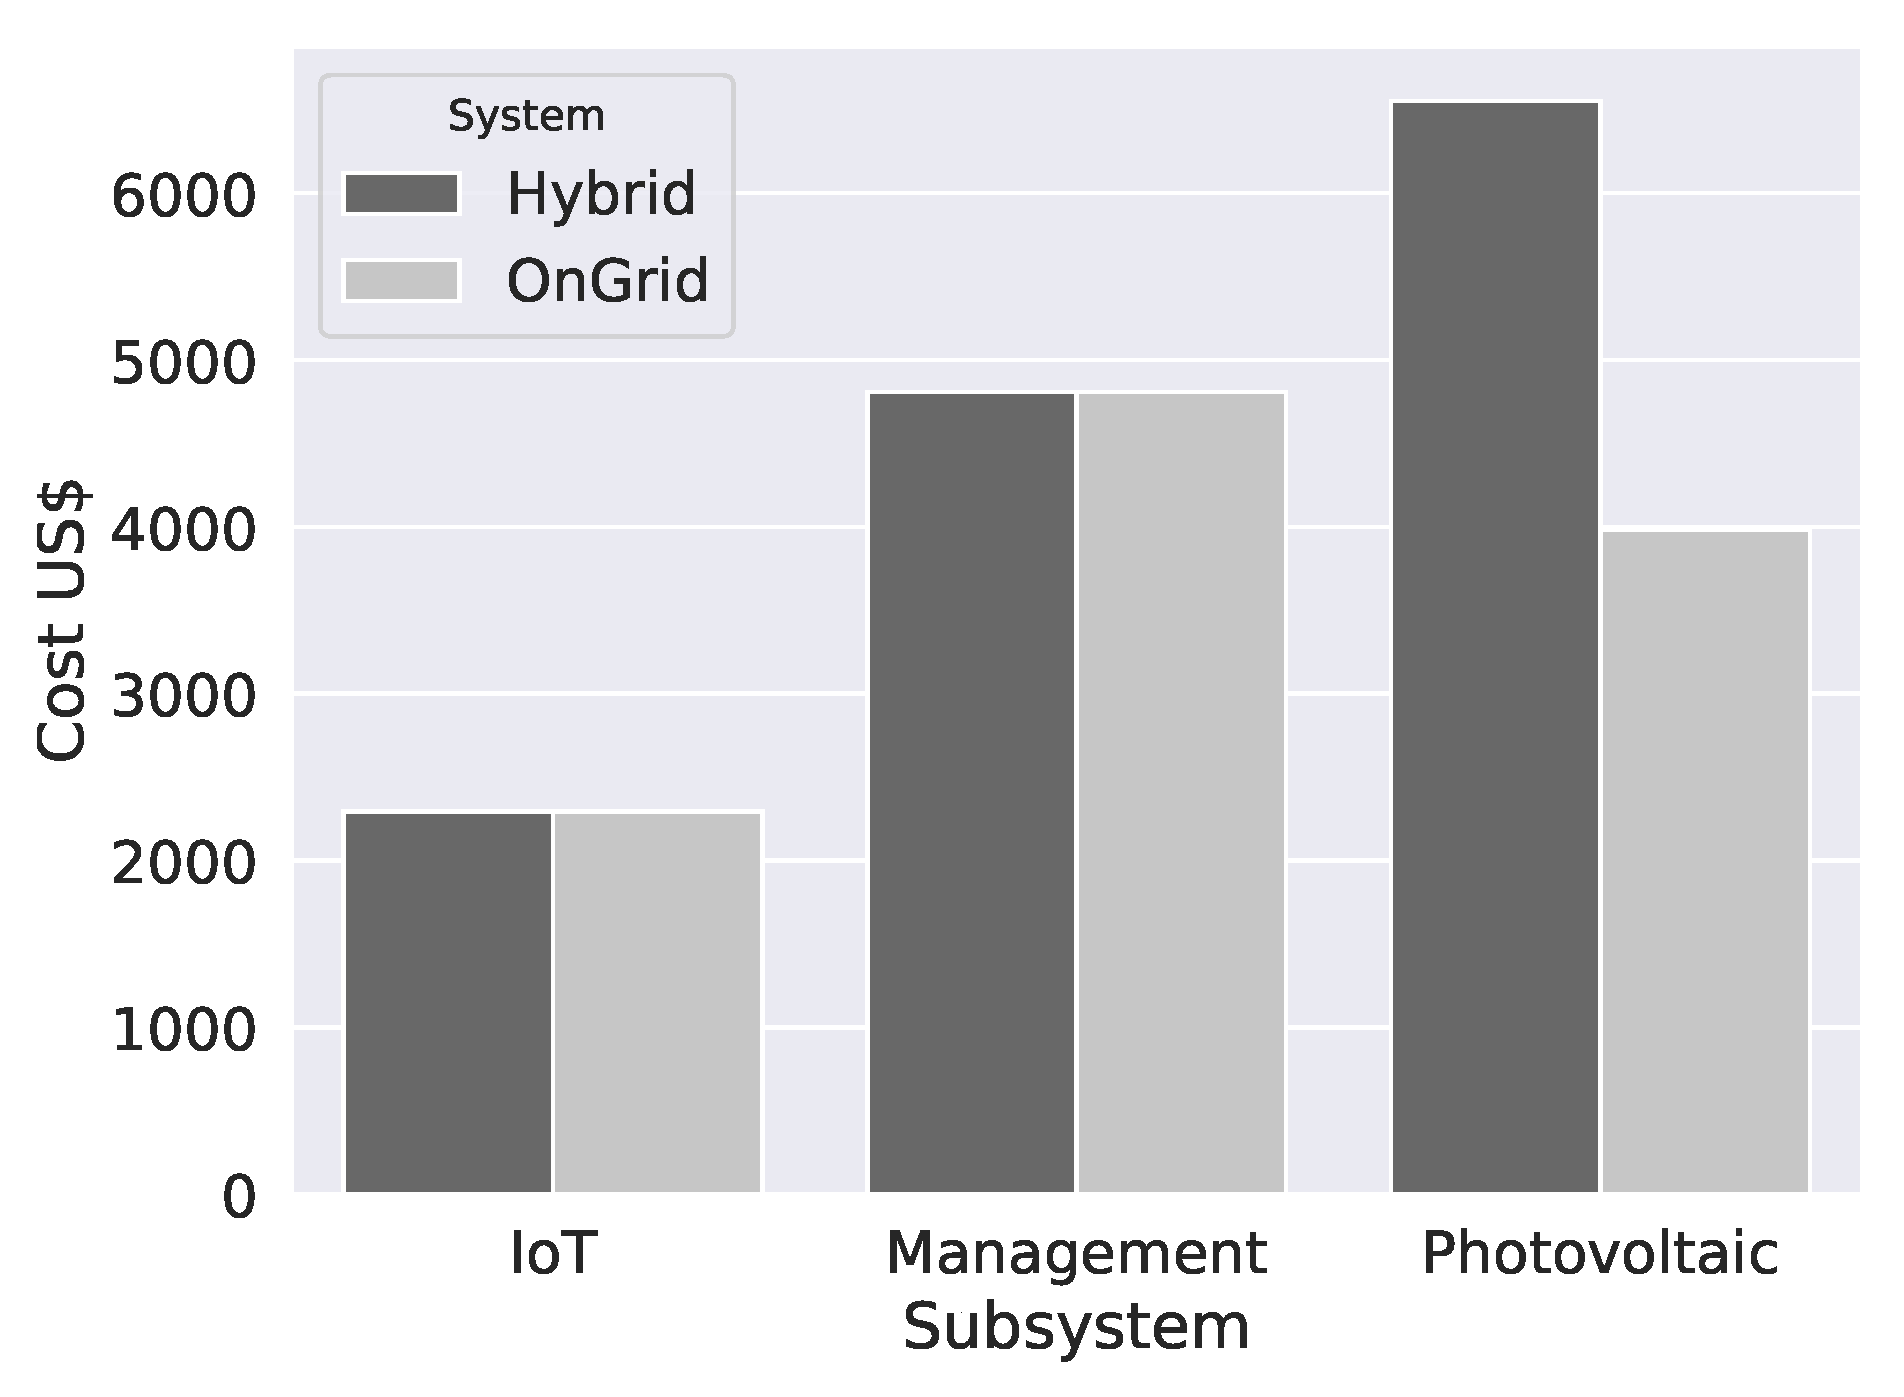
This sub-subsection describes the deploying cost of the autonomous energy management system. The analysis takes into account the acquisition cost of the three sub-systems (building components, management infrastructure, and photovoltaic system components). Table 5 shows the results of the acquisition cost to the smart solar power system to a building. The building IoT sub-system has an acquisition cost of the 2312.93 US$. The sub-system is composed of the 197 sensors/actuators, and 15 routers. The solar power sub-system has an acquisition cost of the 6554.28 US$ to the hybrid system. The hybrid system is composed of 9 solar panels, 1 inverter, 12 batteries, 1 charge controller, and three sensors. The grid-tie solar power system has an acquisition cost of the 3983.05 US$. The sub-system is composed of 9 solar panels, 1 inverter, 1 string box, 1 AC isolator, and three sensors. The management sub-system has an acquisition cost of the 4808.50 US$. The total hybrid solar power system acquisition cost to the whole system is 13,656.24 US$ to supply the needed demand energy in peak time. The grid-tie solar power system acquisition cost to the whole system is 12,742.10 US$. Figure 9 also summarizes the values in Table 5.

7.2.3. Autonomous Energy Management System: Cost Reduction

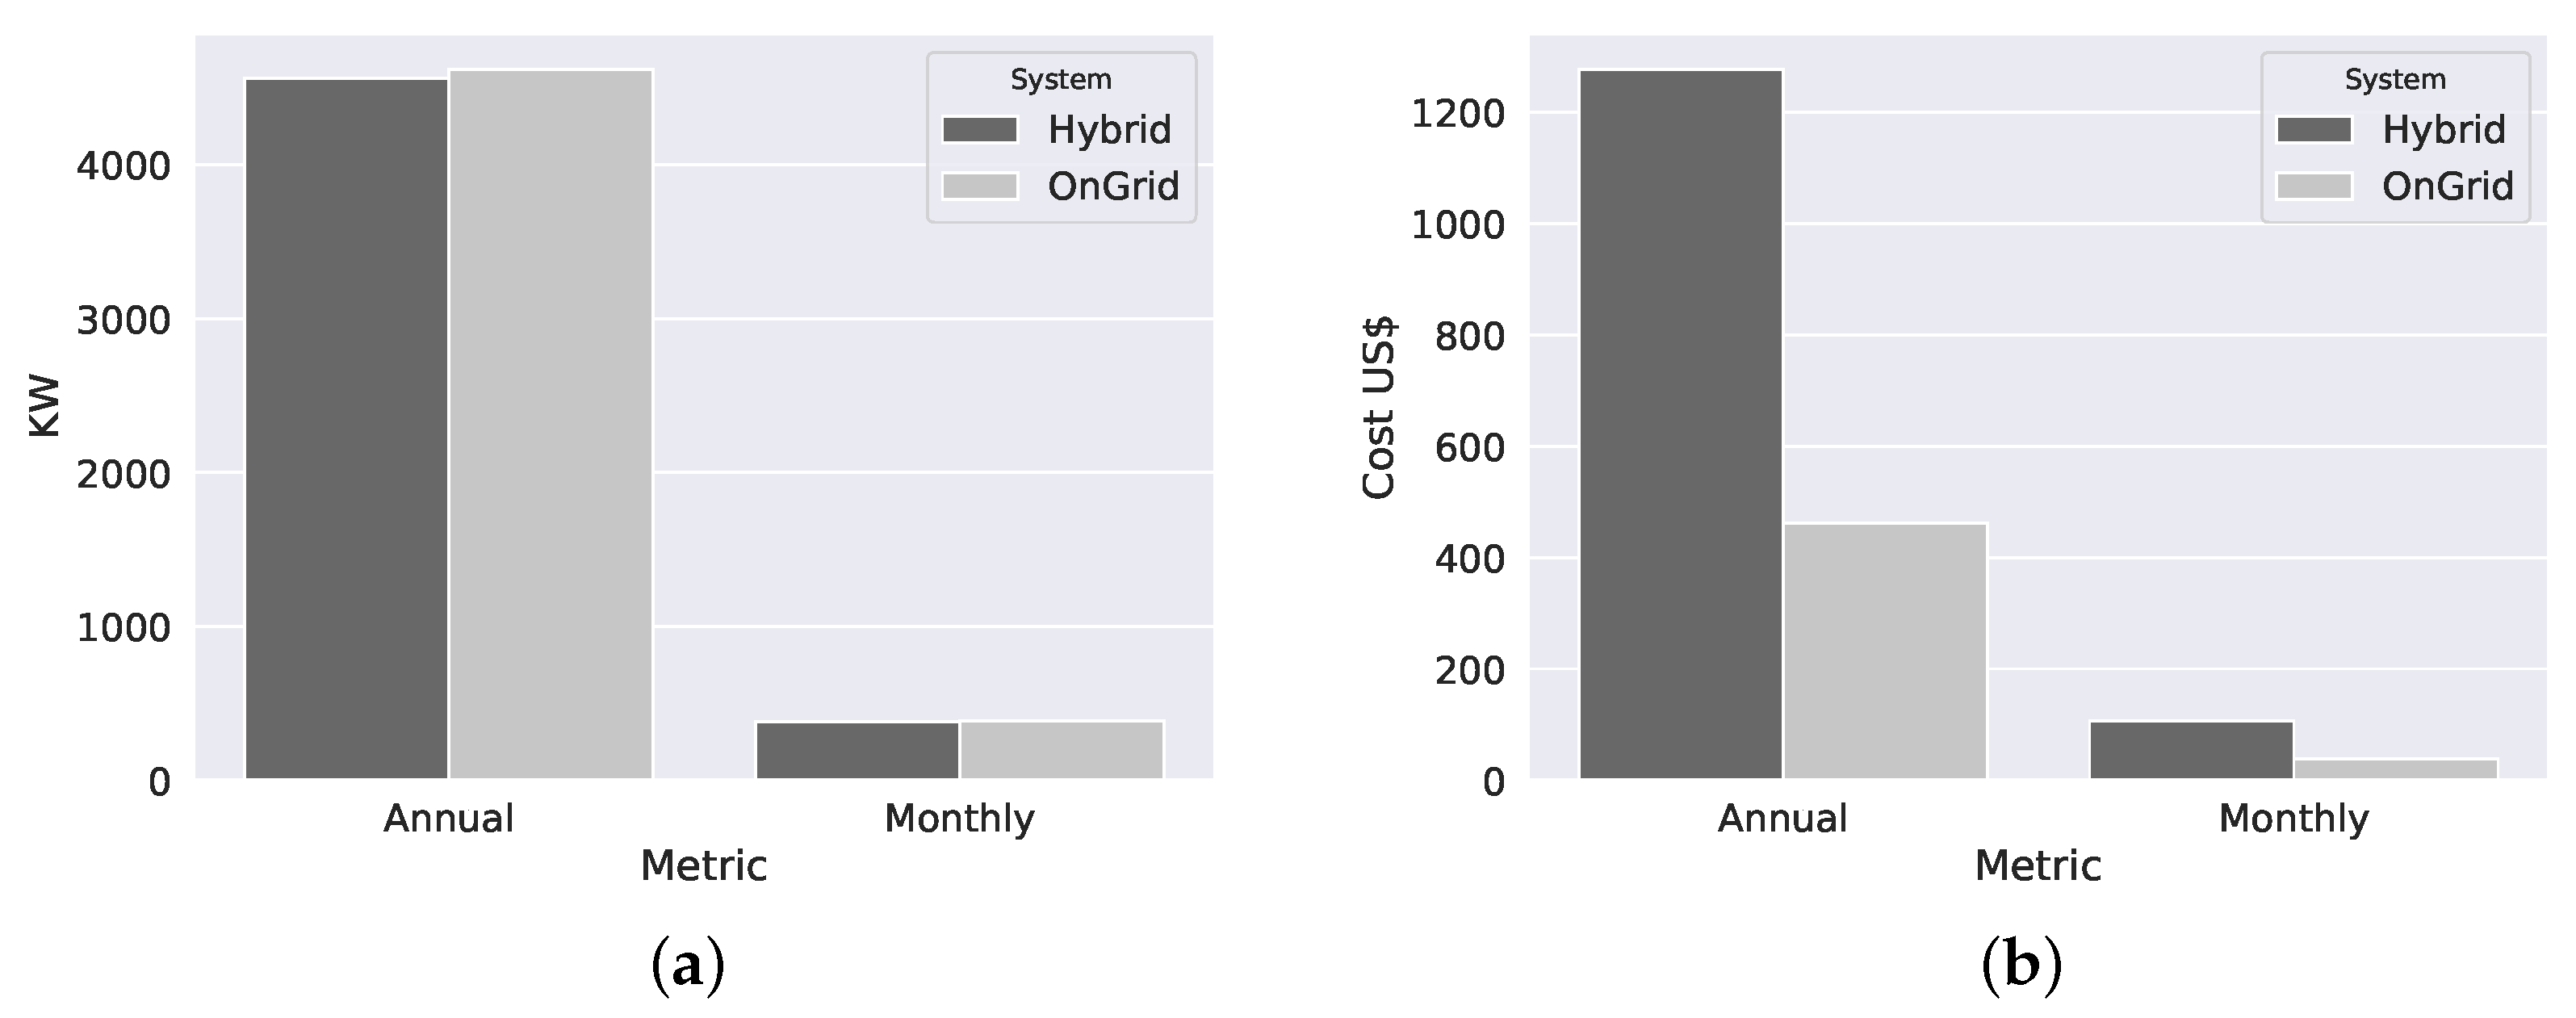
This section presents the cost reduction obtained with the adoption of the autonomous energy management system for both cases. Table 6 shows the energy reduction by the two autonomous energy management systems, with the respective cost. As mentioned in the previous sections, the autonomous energy management system with a hybrid photovoltaic system will only be activated during peak hours (5:30 p.m. to 8:30 p.m.). The autonomous energy management system with a grid-tie photovoltaic system will only be activated during the “outside the range” period (8:30 a.m. to 5:30 p.m.). Therefore, to know the real cost reduction with energy, it was considered the fare amount in Recife, Pernambuco, Brazil in peak time and “outside of range”. However, the currency using in this work is the American dollar, and the fare value is 1.1584 R$ to peak time, and 0.4639 R$ to “outside of range” (Brazilian currency) per kilowatt. Therefore, it was necessary to convert the fare value to the American dollar. According to the dollar price from 9th December 2019, the fair values are 0.28 US$ to peak time and 0.10 US$ to “outside of range” by the kilowatt. Figure 10 also summarizes the values in Table 6.
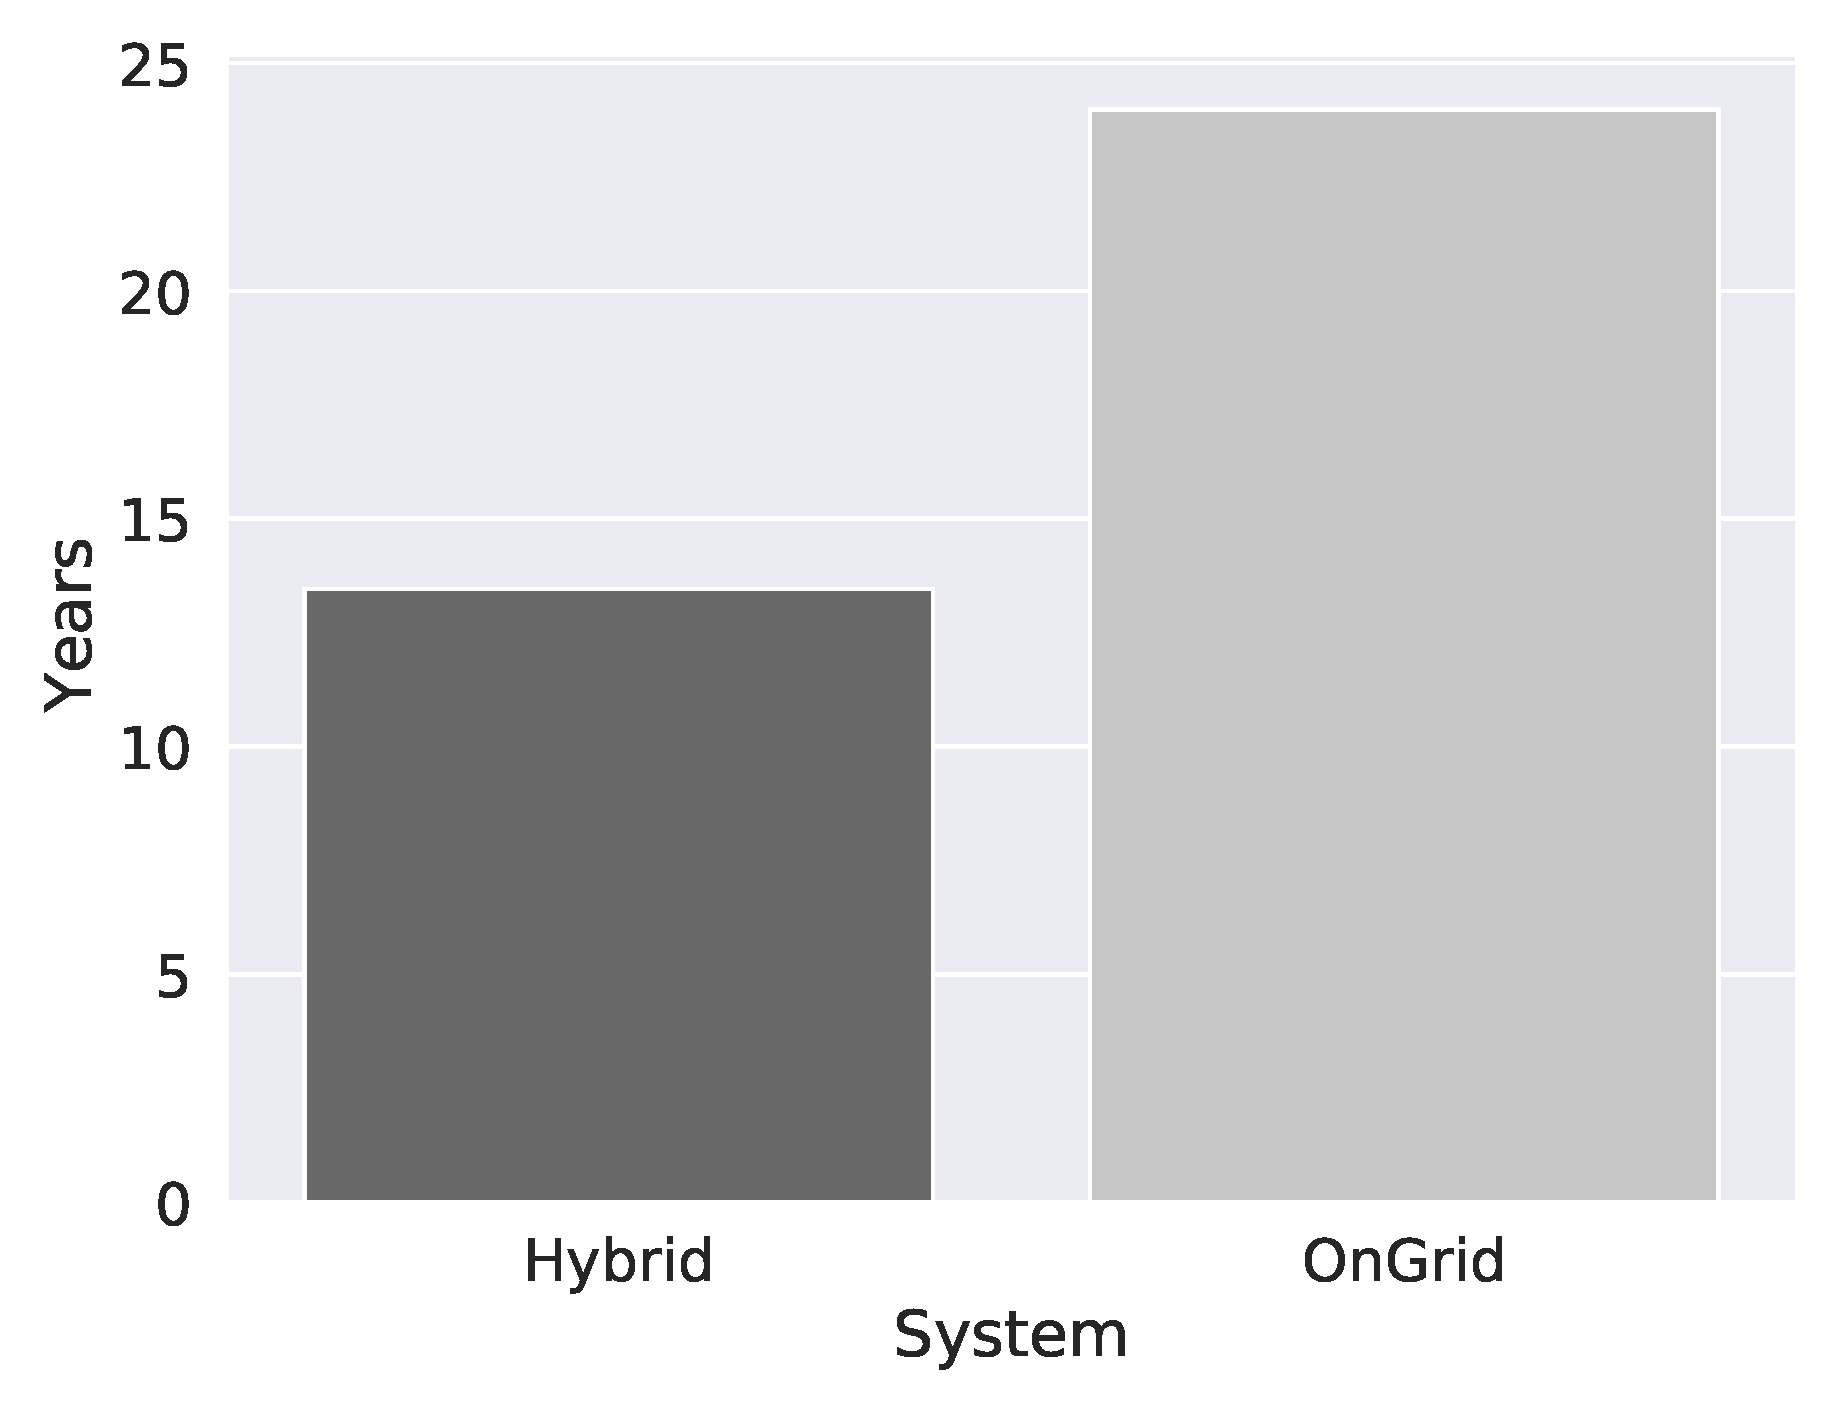
The autonomous energy management system with a photovoltaic hybrid system can replace the electrical energy by solar energy in 363 days of the year (availability). The reduction with energy cost is 1277.61 US$ annually adopting this system. However, it is necessary to consider the acquisition cost to know the real gain with autonomous energy management systems. Considering the acquisition cost and the value saved with autonomous energy management system adoption, we have a total of 10.68 years to offset all the investment. However, according to [21] the battery cycle life is from 5 to 10 years, then it is necessary to add to acquisition cost another battery bank. Therefore, we have a real total of 13.46 years to offset all the investment. The autonomous energy management system with grid-tie photovoltaic system also can be used in 363 days of the year. The system deployment reduces the value spent with energy in 462.17 US$ annually. However, is needed to consider the acquisition cost to know the real gain with autonomous energy management systems adoption. Then, considering the acquisition cost and the value saved with smart energy system adoption, we have a total of 23.98 years to offset all the investment. Figure 11 shows the total of years to offset all investment in both system.

8. Discussion

The research described in this paper had its principal contribution to a hierarchical modeling approach for designing an internet of things system, bringing the availability aspects into account. SPN model was created to describe and evaluate the suggested system. A case study was performed, targeting a smart building system.
The annual uptime of the autonomous energy management system with a grid-tie photovoltaic system is very similar to the autonomous energy management system with hybrid one, about 8710 h. This means the system is available in almost 363 days of the year. We also compared the deployment cost of the whole system between both autonomous energy management systems. In this analysis, we noted that the whole autonomous energy management system with a grid-tie photovoltaic configuration is cheaper than the whole autonomous energy management system with the hybrid photovoltaic one. This occurs because the grid-tie photovoltaic system has the number of components smaller than the hybrid photovoltaic one. This creates a difference in deployment cost of 2571.23 US$. However, the autonomous energy management system with the hybrid photovoltaic system has less time to recover the investment than the autonomous energy management system with grid-tie photovoltaic one. It happens due to the kilowatt value at a peak time when autonomous energy management system with hybrid photovoltaic is active, is more expensive than kilowatt value “outside of range”, when autonomous energy management system with grid-tie photovoltaic system is activated. This creates a difference in the value saved with the electricity of 815.44 US$ annually. It is worth mentioning that we considered the best-case scenario, which is to change the battery set around 10 years.
There are some other works in the literature that use energy management systems in order to reduce the cost. In [38], the authors proposed a schedule-based energy management system that reduces energy costs by 15.51%. The work proposed in this document estimates to reduce the energy cost by 19.05%. Although the main contribution of this work is the availability models, our architecture is effective in relation to cost deduction. It is worth mentioning that our availability models can be extended to a huge amount of IoT-based energy management system.
The modeling strategy suggested hither shall obtain relevant for designing the internet of things base for smart buildings, hence the organizations accountable for those systems could implement Service Level Agreement (SLA) guarantees. However, this work is limited to the cloud computing architecture presented in Section 6. As future works, a commercial building could be analyzed similarly, but including the assessment of more complex systems with specific functions related to the business requirements and goals. Besides, we also intend to generalize the SPN model to include the management system with any cloud architecture.

Author Contributions

E.A. is the main author, he wrote most part of the paper, and he conducted and performed the case studies. The results were also analyzed for him. P.P. was responsible for rewriting some parts to make it clear, also he helped to analyze the results. J.D. reviewed and rewrote some parts of the paper, and he also reviewed the models. P.M. is the advisor, and he is responsible for reviewing and making it sure that the paper is correct, and the results are right. All authors have read and agreed to the published version of the manuscript.

Funding

This research received no external funding.

Conflicts of Interest

The authors declare no conflict of interest.

References

  1. Stojkoska, B.L.R.; Trivodaliev, K.V. A review of Internet of Things for smart home: Challenges and solutions. J. Clean. Prod. 2017, 140, 1454–1464. [Google Scholar] [CrossRef]
  2. Haller, S. Internet of Things: An Integral Part of the Future Internet, Future Internet Conference. Available online: http://services.future-internet.eu/images/1/16/A4_Things_Haller.pdf (accessed on 15 July 2018).
  3. Zanella, A.; Bui, N.; Castellani, A.; Vangelista, L.; Zorzi, M. Internet of things for smart cities. IEEE Internet Things J. 2014, 1, 22–32. [Google Scholar] [CrossRef]
  4. Lin, K.; Chen, M.; Deng, J.; Hassan, M.M.; Fortino, G. Enhanced fingerprinting and trajectory prediction for IoT localization in smart buildings. IEEE Trans. Autom. Sci. Eng. 2016, 13, 1294–1307. [Google Scholar] [CrossRef]
  5. Khanda, K.; Salikhov, D.; Gusmanov, K.; Mazzara, M.; Mavridis, N. Microservice-based iot for smart buildings. In Proceedings of the 2017 31st International Conference on Advanced Information Networking and Applications Workshops (WAINA), Taipei, Taiwan, 27–29 March 2017; pp. 302–308. [Google Scholar]
  6. Arun, S.; Selvan, M. Intelligent residential energy management system for dynamic demand response in smart buildings. IEEE Syst. J. 2017, 12, 1329–1340. [Google Scholar] [CrossRef]
  7. Balaban, O.; de Oliveira, J.A.P. Sustainable buildings for healthier cities: Assessing the co-benefits of green buildings in Japan. J. Clean. Prod. 2017, 163, S68–S78. [Google Scholar] [CrossRef]
  8. Dwaikat, L.N.; Ali, K.N. Green buildings cost premium: A review of empirical evidence. Energy Build. 2016, 110, 396–403. [Google Scholar] [CrossRef]
  9. García, O.; Chamoso, P.; Prieto, J.; Rodríguez, S.; de la Prieta, F. A serious game to reduce consumption in smart buildings. In International Conference on Practical Applications of Agents and Multi-Agent Systems; Springer: Porto, Portugal, 2017; pp. 481–493. [Google Scholar]
  10. Macedo, D.; Guedes, L.A.; Silva, I. A dependability evaluation for Internet of Things incorporating redundancy aspects. In Proceedings of the 2014 IEEE 11th International Conference on Networking, Sensing and Control (ICNSC), Miami, FL, USA, 7–9 April 2014; pp. 417–422. [Google Scholar]
  11. Kamyod, C. End-to-end reliability analysis of an IoT based smart agriculture. In Proceedings of the 2018 International Conference on Digital Arts, Media and Technology (ICDAMT), Phayao, Thailand, 25–28 February 2018; pp. 258–261. [Google Scholar]
  12. Li, L.; Jin, Z.; Li, G.; Zheng, L.; Wei, Q. Modeling and analyzing the reliability and cost of service composition in the IoT: A probabilistic approach. In Proceedings of the 2012 IEEE 19th International Conference on Web Services (ICWS), Honolulu, HI, USA, 24–29 June 2012; pp. 584–591. [Google Scholar]
  13. Andrade, E.; Nogueira, B. Dependability evaluation of a disaster recovery solution for IoT infrastructures. J. Supercomput. 2018, 1–22. [Google Scholar] [CrossRef]
  14. Ştefan, V.K.; Otto, P.; Alexandrina, P.M. Considerations regarding the dependability of Internet of Things. In Proceedings of the 2017 14th International Conference on Engineering of Modern Electric Systems (EMES), Oradea, Romania, 1–2 June 2017; pp. 145–148. [Google Scholar]
  15. Diaz, P.; Egido, M.A.; Nieuwenhout, F. Dependability analysis of stand-alone photovoltaic systems. Prog. Photovolt. Res. Appl. 2007, 15, 245–264. [Google Scholar] [CrossRef] [Green Version]
  16. Collins, E.; Dvorack, M.; Mahn, J.; Mundt, M.; Quintana, M. Reliability and availability analysis of a fielded photovoltaic system. In Proceedings of the 2009 34th IEEE Photovoltaic Specialists Conference (PVSC), Philadelphia, PA, USA, 7–12 June 2009; pp. 002316–002321. [Google Scholar]
  17. Sayed, A.; El-Shimy, M.; El-Metwally, M.; Elshahed, M. Reliability, Availability and Maintainability Analysis for Grid-Connected Solar Photovoltaic Systems. Energies 2019, 12, 1213. [Google Scholar] [CrossRef] [Green Version]
  18. Cai, B.; Liu, Y.; Ma, Y.; Huang, L.; Liu, Z. A framework for the reliability evaluation of grid-connected photovoltaic systems in the presence of intermittent faults. Energy 2015, 93, 1308–1320. [Google Scholar] [CrossRef]
  19. Reinders, A.; Verlinden, P.; Van Sark, W.; Freundlich, A. Photovoltaic Solar Energy: From Fundamentals to Applications; John Wiley & Sons: Hoboken, NJ, USA, 2017. [Google Scholar]
  20. O’Connor, J.P. Off Grid Solar: A Handbook for Photovoltaics with Lead-Acid or Lithium-Ion Batteries, 2nd ed.; Old Sequoia Publishing: Anchorage, AK, USA, 2019. [Google Scholar]
  21. Marcelo Gradella Villalva, J.R.G. Energia Solar Fotovoltaica-Conceitos e Aplicações; Saraiva Educação SA: São Paulo, Brazil, 2012. [Google Scholar]
  22. Avizienis, A.; Laprie, J.C.; Randell, B.; Landwehr, C. Basic Concepts and Taxonomy of Dependable and Secure Computing. IEEE Trans. Dependable Secur. Comput. 2004, 1, 11–33. [Google Scholar] [CrossRef] [Green Version]
  23. Trivedi, K.S. Probability and Statistics with Reliability, Queuing, and Computer Science Applications; Wiley Online Library: Hoboken, NJ, USA, 1982; Volume 13. [Google Scholar]
  24. Doyle, S.A.; Dugan, J.B. Dependability assessment using binary decision diagrams (BDDs). In Proceedings of the Twenty-Fifth International Symposium on Fault-Tolerant Computing, Pasadena, CA, USA, 27–30 June 1995; pp. 249–258. [Google Scholar]
  25. Bolch, G.; Greiner, S.; De Meer, H.; Trivedi, K.S. Queueing networks and Markov Chains: Modeling and Performance Evaluation with Computer Science Applications; John Wiley & Sons: Hoboken, NJ, USA, 2006. [Google Scholar]
  26. German, R. Performance Analysis of Communication Systems with Non-Markovian Stochastic Petri Nets; John Wiley & Sons, Inc.: Hoboken, NJ, USA, 2000. [Google Scholar]
  27. Marsan, M.A.; Balbo, G.; Conte, G.; Donatelli, S.; Franceschinis, G. Modelling with Generalized Stochastic Petri Nets, 1st ed.; John Wiley & Sons, Inc.: Hoboken, NJ, USA, 1994. [Google Scholar]
  28. Molloy, M.K. On the Integration of Delay and Throughput Measures in Distributed Processing Model. Ph.D. Thesis, University of California, Los Angeles, CA, USA, 1981. [Google Scholar]
  29. Silva, B.; Matos, R.; Callou, G.; Figueiredo, J.; Oliveira, D.; Ferreira, J.; Dantas, J.; Lobo, A.; Alves, V.; Maciel, P. Mercury: An integrated environment for performance and dependability evaluation of general systems. In Proceedings of the Industrial Track at 45th Dependable Systems and Networks Conference, DSN, Rio de Janeiro, RJ, Brazil, 22–25 June 2015. [Google Scholar]
  30. Guglielmetti, R.; Macumber, D.; Long, N. OpenStudio: An Open Source Integrated Analysis Platform; Technical Report; National Renewable Energy Lab. (NREL): Golden, CO, USA, 2011.
  31. Dantas, J.; Matos, R.; Araujo, J.; Maciel, P. Models for Dependability Analysis of Cloud Computing Architectures for Eucalyptus Platform. Int. Trans. Syst. Sci. Appl. 2012, 8, 13–25. [Google Scholar]
  32. Cooper, T.; Farrell, R. Value-chain engineering of a tower-top cellular base station system. In Proceedings of the 2007 IEEE 65th Vehicular Technology Conference-VTC2007-Spring, Dublin, Ireland, 22–25 April 2007; pp. 3184–3188. [Google Scholar]
  33. Cisco Packet Tracer-Networking Simulation Tool. Available online: https://www.netacad.com/web/about-us/cisco-paket-tracer (accessed on 10 July 2019).
  34. Kim, D.S.; Machida, F.; Trivedi, K.S. Availability modeling and analysis of a virtualized system. In Proceedings of the 2009 15th IEEE Pacific Rim International Symposium on Dependable Computing, Shanghai, China, 16–18 November 2009; pp. 365–371. [Google Scholar]
  35. Rohouma, W.; Molokhia, I.; Esuri, A. Comparative study of different PV modules configuration reliability. Desalination 2007, 209, 122–128. [Google Scholar] [CrossRef]
  36. Zini, G.; Mangeant, C.; Merten, J. Reliability of large-scale grid-connected photovoltaic systems. Renew. Energy 2011, 36, 2334–2340. [Google Scholar] [CrossRef]
  37. Carrasco, L.M.; Narvarte, L.; Lorenzo, E. Operational costs of A 13,000 solar home systems rural electrification programme. Renew. Sustain. Energy Rev. 2013, 20, 1–7. [Google Scholar] [CrossRef] [Green Version]
  38. Zhao, Z.; Lee, W.C.; Shin, Y.; Song, K.B. An optimal power scheduling method for demand response in home energy management system. IEEE Trans. Smart Grid 2013, 4, 1391–1400. [Google Scholar] [CrossRef]
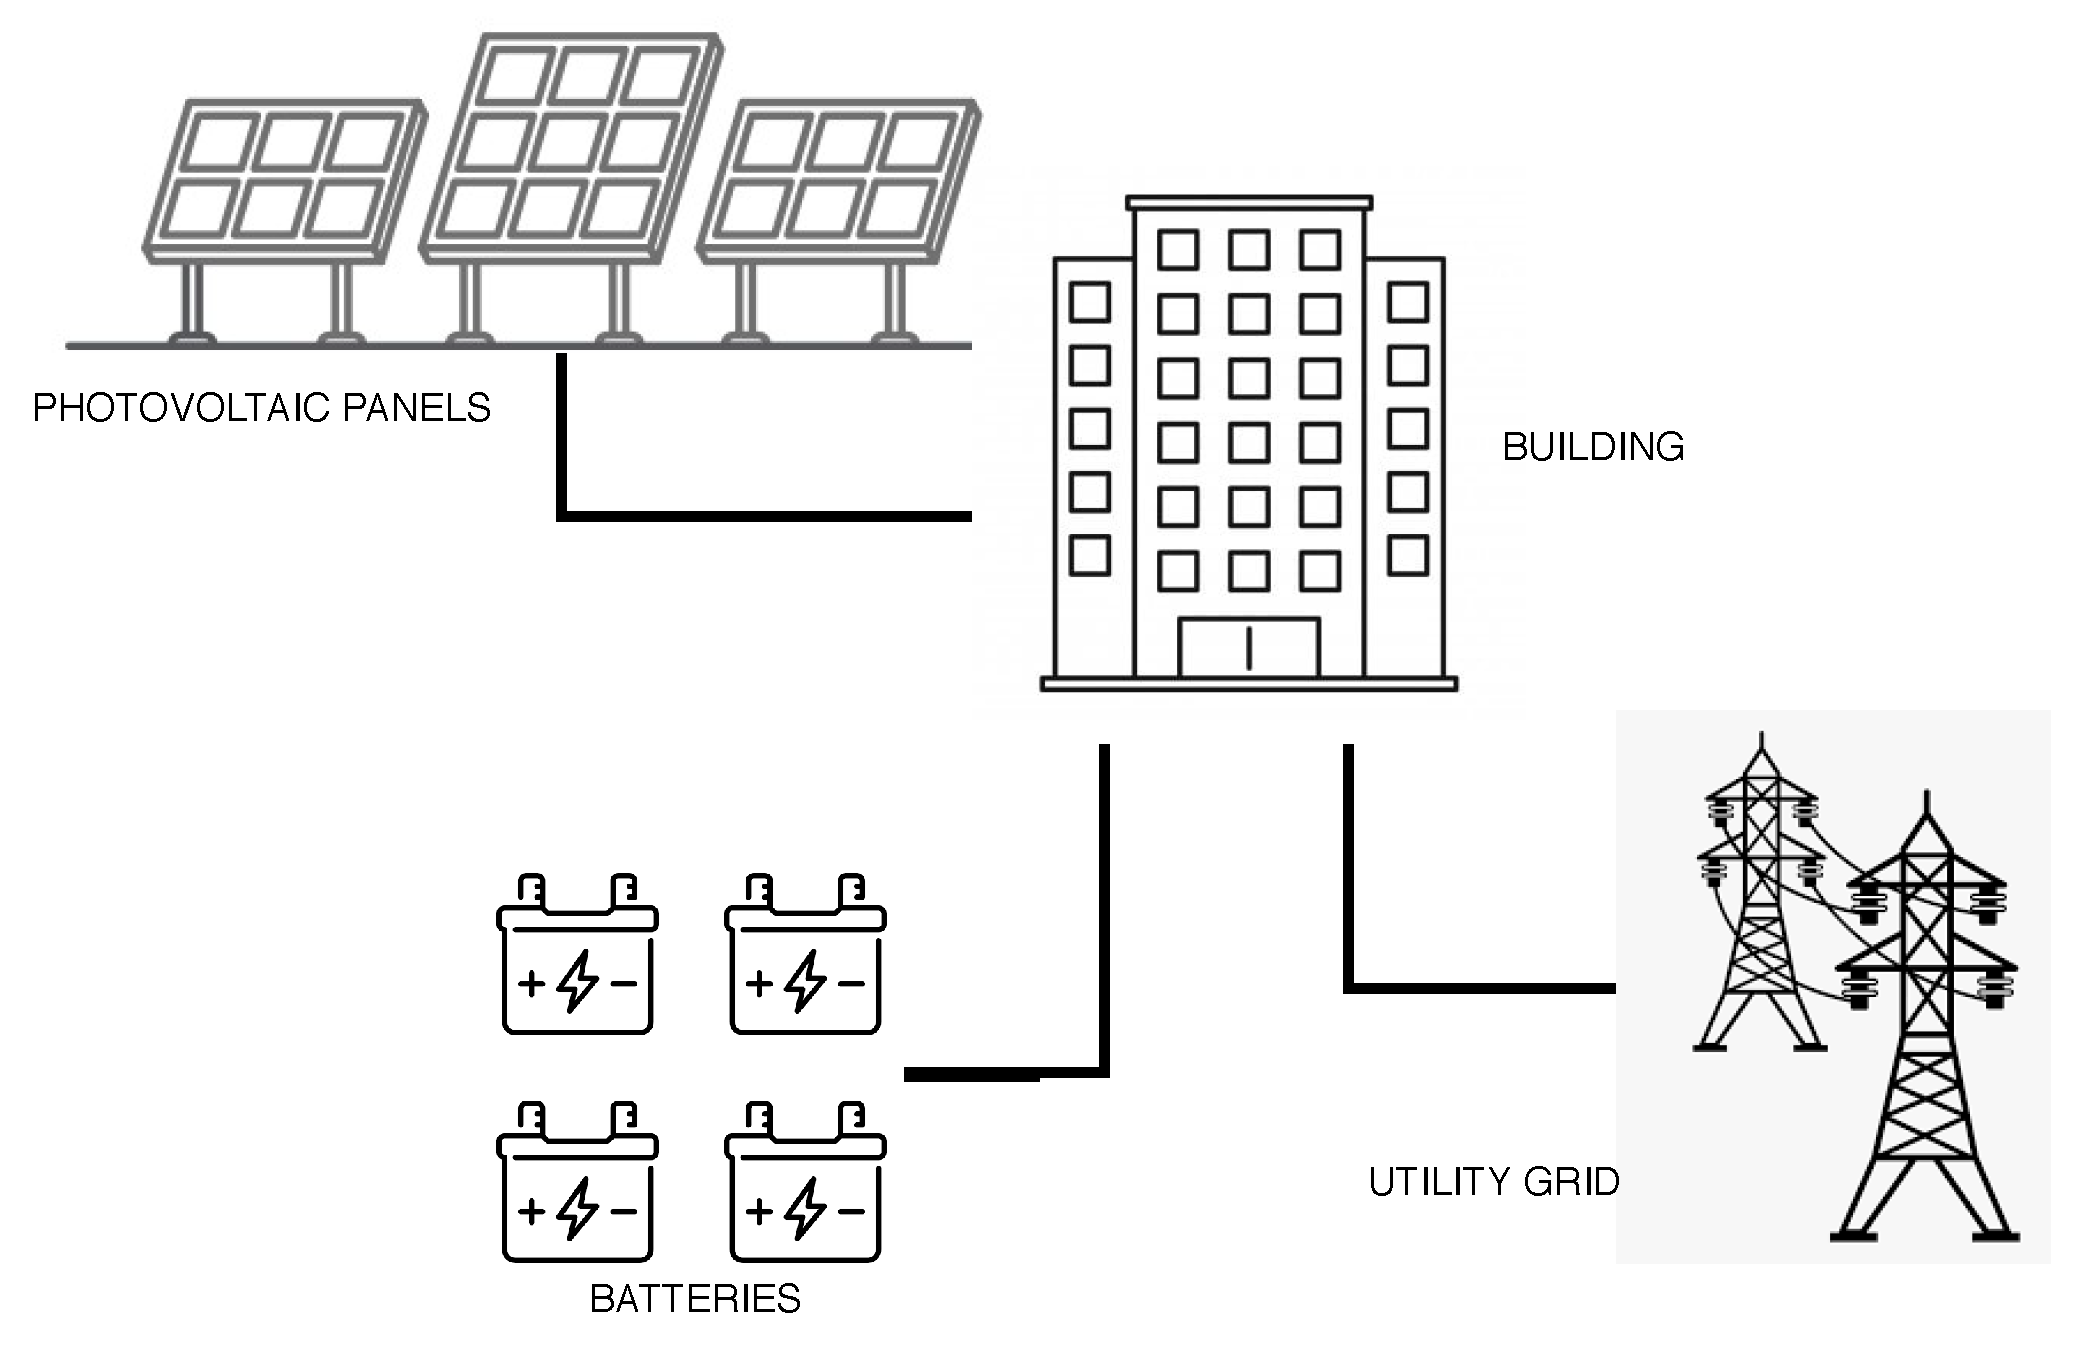
Figure 1. Common components in a photovoltaic system.
Energies 14 00124 g001
Figure 2. Grid-tie photovoltaic system main components.
Energies 14 00124 g002
Figure 3. Hybrid photovoltaic system main components.
Energies 14 00124 g003
Figure 4. Proposed Internet of Things (IoT) environment.
Energies 14 00124 g004
Figure 5. Building’s sensors.
Energies 14 00124 g005
Figure 6. Communication between sensors and cloud computing.
Energies 14 00124 g006
Figure 7. Local management infrastructure.
Energies 14 00124 g007
Figure 8. Stochastic Petri Net (SPN) to entire system with local management.
Energies 14 00124 g008
Figure 9. Equipment cost.
Energies 14 00124 g009
Figure 10. (a) KW consumed. (b) Value spent.
Energies 14 00124 g010
Figure 11. Years to offset all the investment.
Energies 14 00124 g011
Table 1. Annual electricity Peak Demand (KW).
Jan.Feb.Mar.Apr.MayJun.Jul.Aug.Sep.Oct.Nov.Dec.
Cooling182.20181.17184.03182.42175.51169.83167.39166.18171.06172.99180.88184.04
Lighting117.91117.91117.91117.91117.91117.91117.91117.91117.91117.91117.91117.91
Equipment76.50976.50976.50976.50976.50976.50976.50976.50976.50976.50976.50976.509
Fans11.77611.75411.55411.75611.33011.25510.90910.85111.09111.09111.70911.810
Total388.40387.35390.01388.60381.26375.51372.73371.45376.58378.61387.02390.31
Table 2. Daily heat stroke, monthly average.
Month[kWh/m 2 · Daily]
Jan.5.84
Feb.5.94
Mar.5.88
Apr.5.15
May.4.47
Jun4.18
Jul.4.30
Aug.5.03
Sep.5.45
Oct.5.78
Nov.6.05
Dec.6.06
Table 3. Input values for SPN.
ComponentMTTF (Hours)MTTR (Hours)
Hardware61,3208
Operating System14401
Sensors/Actuators300,0001
Docker29001
Controller Manager7001
Data Base14401
Device Manager7001
Router26,0008
Inverter24,8208
Charge Controller70,0808
Solar Panel219,0008
Battery47,8298
Table 4. Availability metrics results to whole system.
MetricHybridGrid-Tie
Uptime8710.95 h8711.78 h
Downtime49.05 h48.21 h
Availability99.4494%99.4496%
Table 5. Equipment cost.
ComponentsHybrid US$Grid-Tie US$
IoT components2293.462293.46
Management infrastructure4808.504808.50
solar components6554.283983.05
Total13,656.2411,085.01
Table 6. Energy produced/reduction cost.
HybridGrid-Tie
MetricAverage-KWhUS$Average-KWhUS$
Annual4562.911277.614621.78462.17
Monthly380.24106.46385.1438.51
Daily12.673.5412.831.28
Publisher’s Note: MDPI stays neutral with regard to jurisdictional claims in published maps and institutional affiliations.