Abstract
An experimental study was performed to investigate the effects of the arrangement of fan-shaped film cooling holes and density ratio (DR) on heat transfer coefficient augmentation. Both single- and multi-row fan-shaped film cooling holes were considered. For the multi-row fan-shaped holes, the heat transfer coefficient was measured at DRs of 1 and 2, and both staggered and inline arrangements of holes were considered. For the single-row fan-shaped holes, DR = 1.0, 1.5, 2.0, and 2.5 and M = 1.0 and 2.0 conditions were tested. The mainstream velocity was 20 m/s, and the turbulence intensity and boundary layer thickness were 3.6% and 6 mm, respectively. The heat transfer coefficient was measured using the one-dimensional transient infrared thermography method. The results show that an increased heat transfer coefficient augmentation is observed between film cooling holes for the case with a smaller hole pitch and higher blowing ratio. For the given fan-shaped hole parameters, the effects of the row-to-row distance and hole arrangement are not significant. In addition, as the velocity difference between the mainstream and coolant increases, the heat transfer coefficient ratio increases.
1. Introduction
Turbine inlet temperatures have continuously been increased to improve the efficiency of gas turbines. As a result, modern gas turbines operate under conditions that exceed allowable material temperatures. Accordingly, the heat load and thermal stress of gas turbine blades have also seen increases, and appropriate cooling techniques are essential to assure the required life of the gas turbine blades. For gas turbine blades, various cooling techniques have been studied. Film cooling, a typical external cooling technique for turbine blades, protects the blade surface from hot gas by injecting coolant through discrete holes or slots installed on the turbine blade surface [1]. The performance of the film cooling technique is generally evaluated through film cooling effectiveness, η, which is defined as follows.
Many studies have been conducted to improve film cooling effectiveness, and it has been shown that it is affected by the shape of the film cooling holes and the hole arrangement. Wright et al. [2] measured the film cooling effectiveness of cylindrical holes and fan-shaped holes at density ratios (DRs) of 1.0 and 1.4 using the pressure sensitive paint technique. They showed that the film cooling effectiveness of fan-shaped holes was higher than that of cylindrical holes for various blowing ratios (M) as the momentum reduction created by the fan-shaped configurations allows the jets to remain attached to the surface and the increased density ratios enhance the spreading of the jets resulting in increased laterally averaged film cooling effectiveness. For a double row of cylindrical holes, Afejuku et al. [3] found that the film cooling effectiveness of a staggered configuration was higher than that of an inline configuration. Zhang et al. [4] installed a vortex generator downstream from cylindrical holes and fan-shaped holes to improve the film cooling effectiveness, and higher film cooling effectiveness appeared when a vortex generator was installed downstream of the fan-shaped holes. Schroeder et al. [5,6] measured the effect of in-hole roughness on film cooling from a shaped hole and the effect of high freestream turbulence on flowfields of shaped film cooling holes. They showed that the film cooling effectiveness of holes with in-hole roughness was smaller than the case with smooth holes due to the increased mixing between coolant and the mainstream [5] and the elevated freestream turbulence increased velocity fluctuations surrounding the coolant jet, resulted in increased lateral spread of coolant [6].
For the application of the fan-shaped hole on gas turbine, some researchers have studied the cooling performance of fan-shaped hole on turbine blades. Bacci et al. [7] measured the film cooling effectiveness on a turbine vane. They found that the correlations developed for flat plate configurations overestimated the film cooling effectiveness at the pressure side and the last cooling hole row of the suction side. Li et al. [8] measured the film cooling effectiveness on a full-coverage film cooled turbine vane with three hole configurations: cylindrical hole, compound angle hole, and fan-shaped hole.
Since the heat transfer coefficient around film cooling holes is augmented due to the increased turbulence caused by the interaction between the mainstream and the coolant, research on heat transfer coefficient augmentation is essential for accurate cooling design. Hay et al. [9] showed that the heat transfer coefficient ratio () for a hole with an injection angle of 90° was higher than that for a hole with an injection angle of 35°. Some researchers have studied the effects of hole shape on heat transfer coefficient augmentation. For example, Yu et al. [10] showed that the heat transfer coefficient augmentation was lower for a hole with forward and lateral expansion than a cylindrical hole. Bonanni et al. [11] found that the heat transfer coefficient ratio decreased with the increased non-cylindrical part of a fan-shaped hole. Haydt et al. [12] measured the heat transfer coefficient augmentation at the sweep of the compound angles of fan-shaped film cooling holes at various blowing ratios. They showed that the area covered by the coolant increased as the compound angle increased, and, as a result, the laterally averaged heat transfer coefficient also increased. Anderson et al. [13] investigated the influence of approach flow characteristics with a fan-shaped hole. They found that the increased boundary layer thickness resulted in a decreased heat transfer coefficient for all blowing ratios, and the heat transfer coefficient augmentation was higher for laminar boundary layer case due to the flow transition caused by the coolant injection. Nikparto et al. [14] investigated the effect of upstream unsteady wakes on the distribution on heat transfer coefficient. The effect of coolant crossflow on heat transfer of a fan-shaped hole was studied by Fraas et al. [15]. They found that heat transfer coefficient ratio was higher for the perpendicular coolant flow cases than the parallel coolant flow cases.
Previous studies on heat transfer coefficient augmentation with film cooling have focused mainly on cylindrical holes. In addition, studies on fan-shaped holes have only looked at limited DRs, whereas the effects of hole arrangement on heat transfer coefficient have rarely been studied. Therefore, the effects of hole pitch, row-to-row distance, and hole arrangement methods on the heat transfer coefficient augmentation of a fan-shaped film cooling hole were experimentally studied, and the effects of DR and blowing ratio were also investigated.
2. Experimental Setup and Theory
2.1. Experiment Setup
Figure 1 shows the experimental facility. To heat the mainstream air immediately, a mesh heater (700 mm by 700 mm) was installed upstream from the contraction area, and a power supply (MKS-3500 A, up to 1500 A at 35 V) was used to supply power to the mesh heater. During the heat transfer test, the mainstream air was heated to about 330 K. The flow rate of the coolant was controlled using an electronic mass flow controller (FMA-2600series, Omega) and supplied through a plenum chamber with mesh screens and a honeycomb. In this study, experiments were conducted for DRs of 1.0, 1.5, 2.0, and 2.5, and, to simulate the DR, nitrogen gas (DR = 1.0), carbon dioxide gas (DR = 1.5), and a mixture of SF6 (sulfur hexafluoride) and nitrogen gas (DR = 2.0 and 2.5) were used as a coolant. The temperature change of the test surface was measured with an IR camera (FLIR A655sc, FLIR). The test section was made of TSR-832 using an additive manufacturing process. The thermal diffusivity (α) of the test section was 0.128 mm2/s, and the thermal conductivity (k) was 0.203 W/mK. Black paint with an emissivity of about 0.97 was applied to the surface of the test section.
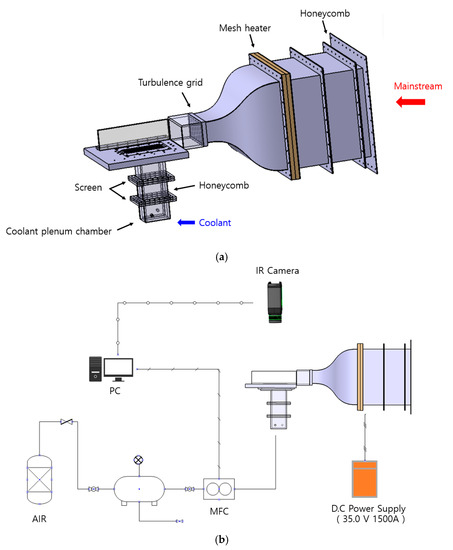
Figure 1.
Experimental facility: (a) overview of test facility; and (b) schematic of experimental setup.
The detailed view of the film cooling hole used in the experiment is shown in Figure 2. A fan-shaped film cooling hole with a diameter (D) of 1.5 mm was used, and the injection angle (θ) to the flow direction was 35°. Both the forward expansion angle ( and lateral expansion angle ( were 10°. The length of the cylindrical inlet portion ( was 3D, and the length of the hole ( was 9D. To investigate the effects of hole arrangement on the heat transfer coefficient augmentation, triple-row film cooling holes were considered, as shown in Figure 3. In Figure 3, p is the pitch between holes and L is the row-to-row distance of the film cooling holes.
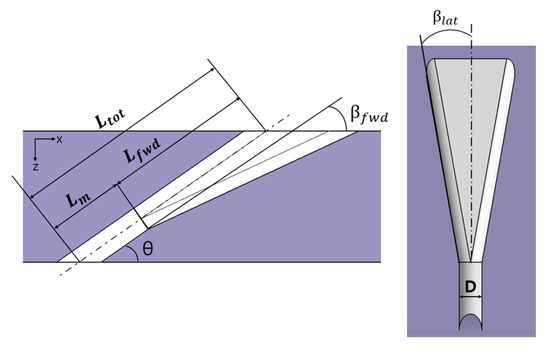
Figure 2.
Geometry of fan-shaped hole.
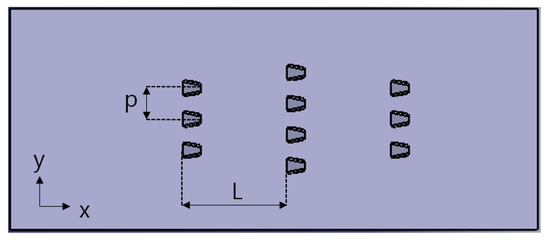
Figure 3.
Schematic of staggered arrangement test section.
2.2. Theory
In the field of turbine heat transfer, transient measurement techniques with an assumption of a one-dimensional semi-infinite solid model have been widely applied, and, in this study, a one-dimensional transient IR thermography method was applied [16]. Assuming that the heat transfer in the test section occurs only in one dimension, the heat conduction equation inside the solid becomes
The initial condition and boundary conditions are as follows.
Equation (2) can be expressed as the finite difference equation in
Equation (6), where is the finite difference form of the Fourier number (Equation (7)).
With film cooling, the boundary condition at the surface (Equation (5)) becomes
Using the solution for Equation (6) and the boundary condition (Equation (8)), the history of the surface heat flux can be calculated. Through a simple development (Equations (8) and (9)), Equations (10) and (11) can be derived.
From the transient test, the temperature-heat flux relation at each time step can be derived as shown in Figure 4, and, from those data, a regression line can be obtained. Then, the slope of the regression line represents the heat transfer coefficient, and the y-intercept can be expressed as a function of slope (heat transfer coefficient) and film cooling effectiveness.
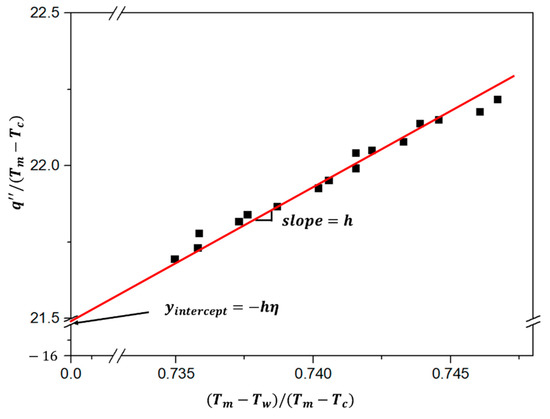
Figure 4.
Linear fitting of heat flux and wall temperature.
2.3. Experimental Conditions
The experimental conditions are shown in Table 1. The experiment was performed at the mainstream velocity of 20 m/s. The turbulence intensity measured at 15 mm upstream from the hole exit was 2.7%, the length scale was 1.45 mm. The boundary layer thickness was 6 mm. Figure 5 shows the distribution of mainstream velocity and turbulence intensity.

Table 1.
Experimental conditions.
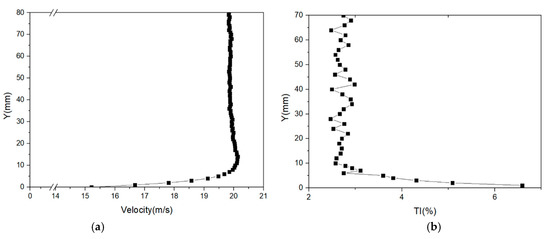
Figure 5.
Distribution of flow field characteristics: (a) velocity; and (b) turbulence intensity.
Table 2 presents the test matrix. For triple-row fan-shaped film cooling holes, the heat transfer measurement with three hole pitches (p/D = 5, 7.5, 10), three row-to-row distances (L/D = 20, 25, 30), and two arrangement methods (staggered and inline) were considered. For a single row of holes, the effect of the DRs (DR = 1.0, 1.5, 2.0, 2.5) on the heat transfer coefficient was investigated at blowing ratios of 1.0 and 2.0. The density ratio (DR) and blowing ratio (M) are defined as follows.
Table 2.
Test matrix.
2.4. Uncertainty Analysis
The uncertainty analysis was conducted using methods by Moffat [17]. The estimated uncertainties in time (t), surface temperature (Tw), thermal conductivity(k), mainstream temperature, (Tm), and coolant temperature (Tc) were 0.02 s, 0.3 °C, 0.0085 W/mK, 0.5 °C, and 0.5 °C, respectively. Estimated uncertainty was 12% for h/ho = 1.0 and 15.6% for h/ho = 1.28. As explained in Section 2.2, 1D semi-infinite solid model was applied to measure the heat transfer coefficient and the effect of 3D conduction near holes could not be considered. Thus, measured uncertainty in the heat transfer coefficient would be higher near the film cooling hole where the effect of 3D conduction is significant.
3. Results and Discussion
The measured results were expressed as the ratio of the heat transfer coefficient with film cooling (h) to the heat transfer coefficient without film cooling (ho). The mean value of the heat transfer coefficients for both sides of the test section without holes was used as the heat transfer coefficient without film cooling (Figure 6). A laterally averaged heat transfer coefficient ratio (hlateral/ho) and the overall averaged heat transfer coefficient ratio (hlateral/ho) were used to compare the heat transfer coefficient augmentation quantitatively, and the hlateral was taken within one pitch near the hole, as shown in Figure 6.
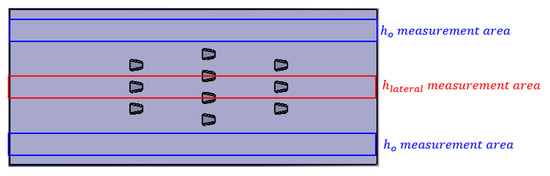
Figure 6.
Schematic of measurement area.
3.1. Effect of Hole Pitch
The distributions of the heat transfer coefficient ratio (h/ho) for the three hole pitches (p/D) at M = 1.0 and M = 2.0 are shown in Figure 7. As mentioned above, the measured uncertainty near hole would be larger than estimated due to the 3D conduction effect.
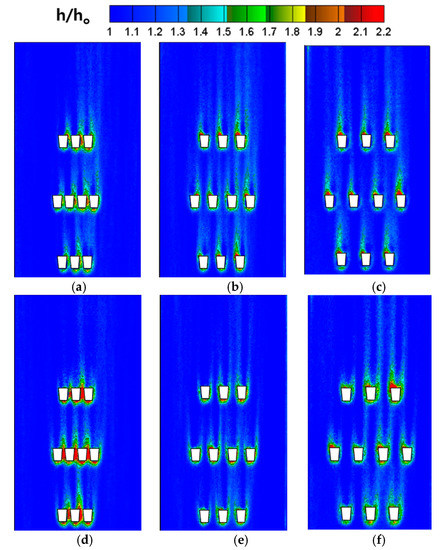
Figure 7.
Distribution of h/ho for different hole pitch cases: (a) p/D = 5, M = 1.0; (b) p/D = 7.5, M = 1.0; (c) p/D = 10, M = 1.0; (d) p/D = 5, M = 2.0; (e) p/D = 7.5, M = 2.0; and (f) p/D = 10, M = 2.0.
For M = 1.0 (Figure 7a–c), the heat transfer coefficient augmentation for different hole pitches did not show a distinct difference. However, at M = 2.0 (Figure 7d–f), an increased heat transfer coefficient was observed for the smaller hole pitch case (p/D = 5, Figure 7d).
For a qualitative comparison of the augmentation with different hole pitches, the laterally averaged heat transfer coefficient ratio (hlateral/ho) and the overall averaged heat transfer coefficient ratio (haverage/ho) are presented in Figure 8 and Figure 9. For M = 1 (Figure 8a and Figure 9a), hlateral/ho and haverage/ho were not significantly affected by the hole pitch. For M = 2 (Figure 8b and Figure 9b), hlateral/ho near the hole exits was much higher for the p/D = 5 case. It seems that the interaction between the coolant jets from the adjacent film cooling holes becomes significant if the hole pitch is below a certain threshold. For the current study, the effect of hole pitch on the heat transfer coefficient augmentation was significant for p/D=5, and cases with larger pitches (p/D=7.5 and 10) did not show meaningful differences.
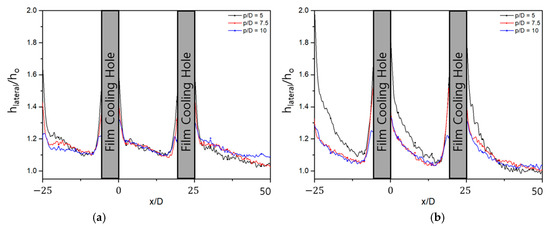
Figure 8.
hlateral/ho for different hole pitch cases: (a) M = 1.0; and (b) M = 2.0.
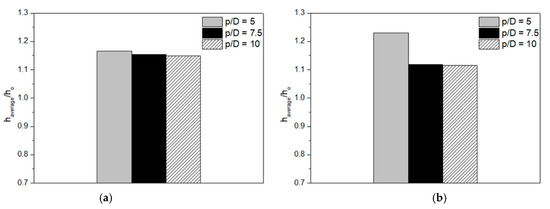
Figure 9.
haverage/ho for different hole pitch cases: (a) M = 1.0; and (b) M = 2.0.
3.2. Effect of Row-to-Row Distance
Figure 10 shows the distribution of h/ho for different row-to-row distance cases. For both blowing ratios, the h/ho distributions did not show a significant dependency on the row-to-row distance. The laterally averaged heat transfer coefficient ratio (hlateral/ho) of each row and the overall averaged heat transfer coefficient ratio (haverage/ho) in Figure 11 and Figure 12 show that hlateral/ho and haverage/ho at each blowing ratio were almost the same regardless of the row-to-row distance. If the distance between the rows is further reduced, the heat transfer coefficient may increase as the turbulence around the downstream hole is affected by the coolant injected from upstream holes. However, under the given experimental conditions, it seemed that the distance between the rows was sufficiently large, and there was little effect from the coolant injected from the upstream holes on the heat transfer coefficient augmentation of the downstream holes.
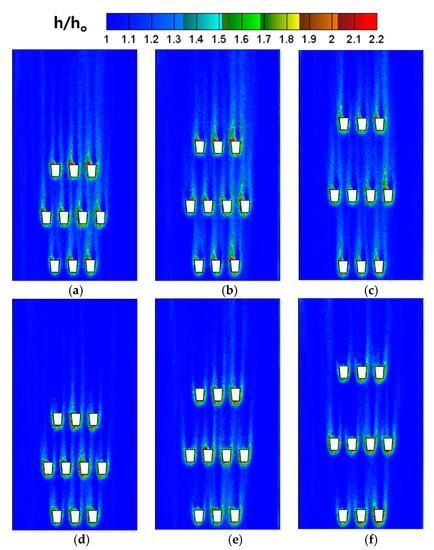
Figure 10.
Distribution of h/ho for different row-to-row distance cases: (a) L/D = 20, M = 1.0; (b) L/D = 25, M = 1.0; (c) L/D = 30, M =1.0; (d) L/D = 20, M = 2.0; (e) L/D = 25, M = 2.0; and (f) L/D = 30, M = 2.0.
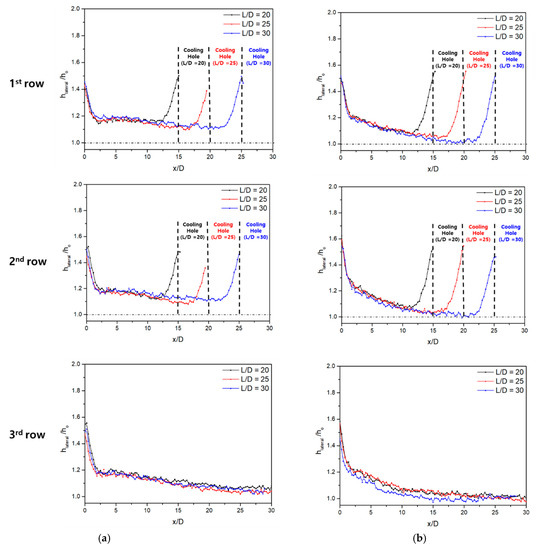
Figure 11.
hlateral/ho for different row-to-row distance cases: (a) M = 1.0; and (b) M = 2.0.
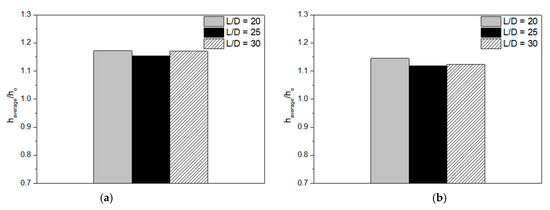
Figure 12.
haverage/ho for different hole row-to-row distance cases: (a) M = 1.0; and (b) M = 2.0.
3.3. Arrangement Effects
The heat transfer coefficients of the staggered and inline arrangements of fan-shaped holes were measured to investigate the effects of hole arrangement on the heat transfer coefficient augmentation. The distribution of h/ho is shown in Figure 13. Figure 13 shows a similar h/ho distribution around the holes for both the staggered and inline arrangements for both blowing ratios.
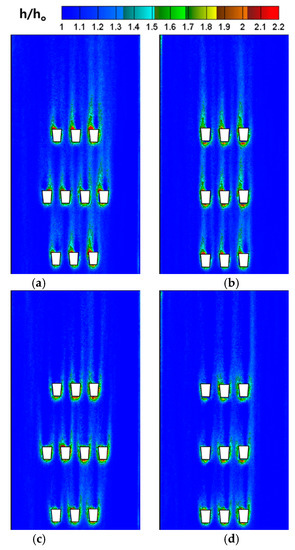
Figure 13.
Distribution of h/ho for selected hole arrangements (a) staggered, M = 1.0; (b) inline, M = 1.0; (c) staggered, M = 2.0; and (d) inline, M = 2.0.
The laterally averaged heat transfer coefficient ratio (hlateral/ho) in Figure 14 and the overall averaged heat transfer coefficient ratio (haverage/ho) in Figure 15 show that, regardless of arrangement method, hlateral/ho along the flow direction and haverage/ho were almost the same for both blowing ratios. As the coolant injected from the upstream holes did not affect the flow around the downstream holes, as explained in Section 3.2, it seemed that the effect of the hole arrangement was also not significant for the given test condition. If the row-to-row distance decreases further, the heat transfer coefficient augmentation might also be affected by the arrangement.
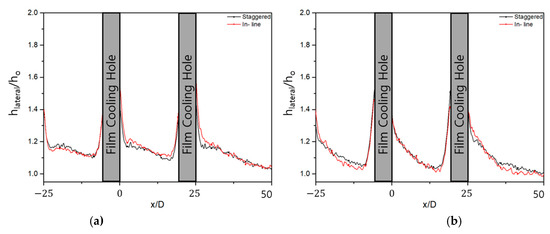
Figure 14.
hlateral/ho for staggered and inline hole arrangements: (a) M = 1.0; and (b) M = 2.0.
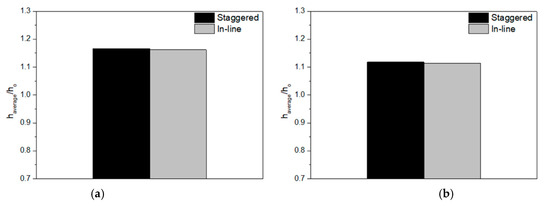
Figure 15.
haverage/ho for staggered and inline hole arrangements: (a) M = 1.0; and (b) M = 2.0.
3.4. Effect of Density Ratio (DR)
To investigate the effect of DR on heat transfer coefficient augmentation, heat transfer coefficients were measured at various DRs from DR = 1.0 to 2.5 for a single row of fan-shaped film cooling holes. Corresponding velocity and momentum ratios for the blowing ratios at each DR are also given in Table 3. The blowing ratio, velocity, and momentum ratios are calculated based on the coolant velocity at the cylindrical inlet portion and the mainstream velocity.
Table 3.
Velocity and momentum ratios for various coolant injection conditions.
Figure 16 presents the h/ho distribution for four DRs. For M = 1.0 (Figure 16a–d), h/ho at the downstream holes was higher in the higher DR cases. When the coolant was injected from the holes, shear stress was generated due to the velocity difference between the coolant jet and the mainstream, and this induced the increase of local turbulence. The increased turbulence enhanced the mixing between the mainstream and the coolant more actively and resulted in a higher heat transfer coefficient [18]. Therefore, as the DR increased, the velocity difference increased, resulting in higher heat transfer coefficient augmentation.
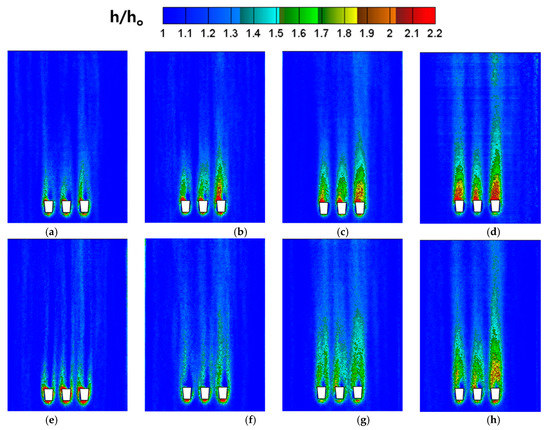
Figure 16.
Distributions of h/ho for different density ratios: (a) DR = 1.0, M = 1.0; (b) DR = 1.5, M = 1.0 (c) DR = 2.0, M =1.0; (d) DR = 2.5, M = 1.0; (e) DR = 1.0, M = 2.0; (f) DR = 1.5, M = 2.0; (g) DR = 2.0, M = 2.0; and (h) DR = 2.5, M = 2.0.
For M = 2.0 (Figure 16e–f), the DR = 1.0 case had the highest h/ho value, and the DR = 1.5 case had the lowest h/ho value near the hole exit. However, the area with a high h/ho for the DR = 1.0 case (Figure 16e) rapidly narrowed as it progressed downstream. For this case, due to the high momentum ratio of 4 at the cylindrical inlet portion, as shown in Table 3, the injected coolant may have lifted off from the wall, and the coolant jet had little effect on the thermal boundary layer far from the hole. Note that the velocity ratio for the DR=1.5 case (Figure 16f) was 1.33. For this case, as the coolant passed through the diffusion portion in the fan-shaped film cooling hole, the velocity of the coolant decreased, and the velocity ratio may have approached unity. Therefore, the local turbulence increase may have been smaller than in other cases, which resulted in the lowest augmentation of the heat transfer coefficient for the DR = 1.5 case.
For the DR =1.0 case (Figure 16a,e), as the velocity ratio was higher for the higher blowing ratio, as shown in Table 3, h/ho was higher for M = 2.0. On the contrary, for the DR = 1.5 case (Figure 16b,f), the DR = 2.0 case (Figure 16c,g), and the DR = 2.5 case (Figure 16d,h), the velocity difference decreased as the blowing ratio increased, and this resulted in the smaller h/ho for the higher blowing ratio.
Figure 17 shows the hlateral/ho for the tested DRs. At M = 1.0 (Figure 17a), the hlateral/ho increased as the DR increased due to the increased velocity difference between the mainstream and coolant jet. At M = 2.0 (Figure 17b), hlateral/ho generally also increased as the DR increased. However, for the DR = 1.0 case, hlateral/ho was the highest near the hole exit but showed a rapid decrease downstream due to the coolant lift-off, as explained above.
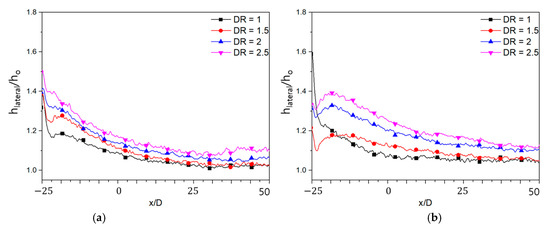
Figure 17.
hlateral/ho for different density ratios: (a) M = 1.0; and (b) M = 2.0.
Figure 18 shows the haverage/ho for the tested DRs. At M = 1.0 (Figure 18a), the haverage/ho increased as DR increased. At M = 2.0 (Figure 18b), the haverage/ho generally increased as DR increased. However, for the DR = 1.5 case, haverage/ho was the lowest as the velocity ratio approached unity.
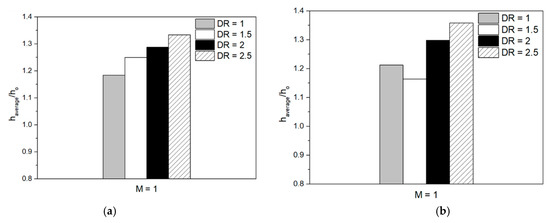
Figure 18.
haverage/ho for different density ratios: (a) M = 1.0; and (b) M = 2.0.
4. Conclusions
In this study, a one-dimensional transient heat transfer technique using IR thermography was applied to measure the heat transfer coefficient augmentation around the fan-shaped film cooling holes for three hole pitches (p/D), three row-to-row distances (L/D), two hole arrangements (staggered and inline), and four density ratios (DRs). The conclusions based on the experimental results are as follows.
- At M = 1.0, the effects of the hole pitch were not considerable. At M = 2.0, an increased heat transfer coefficient augmentation was observed for the smallest hole pitch case (p/D = 5).
- The effects of the row-to-row distance and the hole arrangement were not observed due to the relatively large row-to-row distance in the current study.
- In the measurement of the heat transfer coefficient augmentation with various DRs, the heat transfer coefficient increased as the velocity difference between the mainstream and coolant increased.
Author Contributions
Conceptualization, Y.S.K. and J.S.K.; methodology, Y.S.K. and J.Y.J.; software, Y.S.K. and J.Y.J.; validation, Y.S.K. and J.Y.J.; formal analysis, Y.S.K.; investigation, Y.S.K. and J.Y.J.; resources, J.S.K.; data curation, Y.S.K.; writing—original draft preparation, Y.S.K.; writing—review and editing, J.S.K. and Y.S.K.; visualization, Y.S.K.; supervision, J.S.K.; project administration, H.C.; funding acquisition, J.S.K. and H.C. All authors have read and agreed to the published version of the manuscript.
Funding
This work was funded by the Ministry of Industry, Trade & Energy (Republic of Korea) through the Aerospace Component Technology Development Program (Grant No. 10083654) and Korea Energy Technology Evaluation and Planning (Grant No. 20193310100050).
Conflicts of Interest
The authors declare no conflict of interest.
Nomenclature
| Symbol | Abbreviation |
| D | hole diameter |
| DR | density ratio |
| Fo | Fourier number |
| h | heat transfer coefficient (W/m2·K) |
| k | thermal conductivity (W/m·K) |
| L | row-to-row distance |
| M | blowing ratio |
| p | hole pitch |
| q’’ | heat flux (W/m2) |
| t | time(s) |
| T | temperature (K) |
| TI | turbulence intensity (%) |
| U | velocity (m/s) |
| x | distance from the hole exit along flow direction (m) |
| z | distance from the surface along vertical direction (m) |
Greek Symbols
| Symbol | Abbreviation |
| α | thermal diffusivity (m2/s) |
| θ | injection angle (˚) |
| ρ | density (kg/m3) |
| η | film cooling effectiveness |
Subscripts
| Symbol | Abbreviation |
| c | coolant parameters |
| f | film parameters |
| i | initial condition |
| w | wall surface parameters |
| ∞ | free stream parameters |
References
- Jones, T. FILM COOLING. Int. J. Med. Mushrooms 2006, 7, 321–379. [Google Scholar] [CrossRef]
- Wright, L.M.; McClain, S.T.; Clemenson, M.D. Effect of Density Ratio on Flat Plate Film Cooling With Shaped Holes Using PSP. J. Turbomach. 2011, 133, 041011. [Google Scholar] [CrossRef]
- Afejuku, W.O.; Hay, N.; Lampard, D. The Film Cooling Effectiveness of Double Rows of Holes. J. Eng. Power 1980, 102, 601–606. [Google Scholar] [CrossRef]
- Zhang, C.; Wang, J.; Luo, X.; Song, L.; Li, J.; Feng, Z. Experimental Investigation on the Flat-Plate Film Cooling Enhancement Using the Vortex Generator Downstream for the Cylindrical Hole and Fan-Shaped Hole Configurations. ASME Paper No. 2019-GT-90671. In Proceedings of the ASME Turbo Expo, Phoenix, AZ, USA, 17–21 June 2019. [Google Scholar]
- Schroeder, R.P.; Thole, K.A. Effect of In-Hole Roughness on Film Cooling From a Shaped Hole. J. Turbomach. 2016, 139, 031004. [Google Scholar] [CrossRef]
- Schroeder, R.P.; Thole, K.A. Effect of High Freestream Turbulence on Flowfields of Shaped Film Cooling Holes. J. Turbomach. 2016, 138, 091001. [Google Scholar] [CrossRef]
- Bacci, T.; Picchi, A.; Facchini, B. Flat Plate and Turbine Vane Film-Cooling Performance with Laid-Back Fan-Shaped Holes. Int. J. Turbomach. Propuls. Power 2019, 4, 14. [Google Scholar] [CrossRef]
- Li, W.; Li, X.; Ren, J.; Jiang, H. Experimental investigation of wall thickness and hole shape variation effects on full-coverage film cooling performance for a gas turbine vane. Appl. Therm. Eng. 2018, 144, 349–361. [Google Scholar] [CrossRef]
- Hay, N.; Lampard, D.; Saluja, C.L. Effects of Cooling Films on the Heat Transfer Coefficient on a Flat Plate With Zero Mainstream Pressure Gradient. J. Eng. Gas Turbines Power 1985, 107, 105–110. [Google Scholar] [CrossRef]
- Yu, Y.; Yen, C.H.; Shih, T.I.P.; Chyu, M.K.; Gogineni, S. Film Cooling Effectiveness and Heat Transfer Coefficient Distributions Around Diffusion Shaped Holes. J. Heat Transf. 2002, 124, 820–827. [Google Scholar] [CrossRef]
- Bonanni, L.; Facchini, B.; Tarchi, L.; Maritano, M.; Traverso, S. Heat Transfer Performance of Fan-Shaped Film Cooling Holes: Part I—Experimental Analysis. In Heat Transfer, Parts A and B; ASME International: New York, NY, USA, 2010; Volume 4, pp. 1561–1571. [Google Scholar]
- Haydt, S.; Lynch, S. Heat Transfer Coefficient Augmentation for a Shaped Film Cooling Hole at a Range of Compound Angles. J. Turbomach. 2020, V05BT19A026, 1–30. [Google Scholar] [CrossRef]
- Anderson, J.B.; Bogard, D.G.; Dyson, T.E.; Webster, Z.D. Direct Experimental Measurements of Heat Transfer Coefficient Augmentation Due to Approach Flow Effects. J. Turbomach. 2019, 141, 031011. [Google Scholar] [CrossRef]
- Nikparto, A.; Rice, T.; Schobeiri, M.T. Experimental and Numerical Investigation of Heat Transfer and Film Cooling Effectiveness of a Highly Loaded Turbine Blade Under Steady and Unsteady Wake Flow Condition. ASME Paper No. 2017-GT-65012. In Proceedings of the ASME Turbo Expo, Charlotte, NC, USA, 26–30 June 2017. [Google Scholar]
- Fraas, M.; Glasenapp, T.; Schulz, A.; Bauer, H.-J. Film Cooling Measurements for a Laidback Fan-Shaped Hole: Effect of Coolant Crossflow on Cooling Effectiveness and Heat Transfer. J. Turbomach. 2019, 141, 041006. [Google Scholar] [CrossRef]
- Smith, D.E.; Bubb, J.V.; Popp, O.; Grabowski, H.; Diller, T.E.; Schetz, J.A.; Ng, W.F. An Investigation of Heat Transfer in a Film Cooled Transonic Turbine Cascade: Part I—Steady Heat Transfer. ASME Paper No. 2000-GT-0202. In Proceedings of the ASME Turbo Expo, Munich, Germany, 8–11 May 2000. [Google Scholar]
- Moffat, R.J. Describing the uncertainties in experimental results. Exp. Therm. Fluid Sci. 1988, 1, 3–17. [Google Scholar] [CrossRef]
- Boyd, E.J.; McClintic, J.W.; Chavez, K.; Bogard, D.G. Direct Measurement of Heat Transfer Coefficient Augmentation at Multiple Density Ratios. J. Turbomach. 2016, 139, 011005. [Google Scholar] [CrossRef]


Publisher’s Note: MDPI stays neutral with regard to jurisdictional claims in published maps and institutional affiliations. |
© 2021 by the authors. Licensee MDPI, Basel, Switzerland. This article is an open access article distributed under the terms and conditions of the Creative Commons Attribution (CC BY) license (http://creativecommons.org/licenses/by/4.0/).