Article

Effect of Renewable Energy to Reduce Carbon Emissions under a Flexible Production System: A Step Toward Sustainability

Department of Industrial Engineering, Yonsei University, 50 Yonsei-ro, Sinchon-dong, Seodaemun-gu, Seoul 03722, Korea
*
Author to whom correspondence should be addressed.
Energies 2021, 14(1), 215; https://doi.org/10.3390/en14010215
Submission received: 25 November 2020 / Revised: 21 December 2020 / Accepted: 29 December 2020 / Published: 3 January 2021

Abstract

:
Renewable energy and environmental issues are receiving considerable attention worldwide along with the technological development of production system for reducing global warming. Due to the use of smart technologies, the rate of carbon emission and energy utilization have become very high and are directly related to different industries. This study focuses on the effect of renewable energy on the advancement of smart production with a flexible production rate as well as the reduction of carbon emission to build a sustainable smart production system. A mathematical model is developed to maximize the profit of the smart production system for economic development while considering technological and environmental issues. The model is solved analytically, and we obtain closed and quasi-closed form solutions. A numerical experiment is performed, and a comparison with previous studies indicates that our method achieves more profit than existing ones. Additionally, we highlight the major effect of renewable energy. Different graphical representations of the decision variables prove the convergence of the model. A sensitivity analysis and graphical representation are presented in this paper, and some recommendations for industry are provided by simulating this model in different scenarios.

1. Introduction

To create sustainable supply chains, the effect of renewable energy plays a critical role. Sustainability mainly depends on three pillars, i.e., economic, environmental, and social (Ahmed and Sarkar, [1]). The effect of renewable energy is related to all three pillars in the following manner: for economic development, industries utilize traditional energy with greater cost. Thus, as a cost-effective measure, renewable energy can be a partial component of the total energy consumed by an industry (Sarkar and Sarkar, [2]). Dong et al. [3] discussed about the major drivers for the decoupling indicators among economic and energy related issues. For environmental concerns, renewable energy can be generated from biogas, biofuel, green products, household waste or industrial waste. Thus, environmental pollution can be reduced through the production of renewable energy. Regarding the social aspect, significant human labor is required to produce renewable energy. As a result, several jobs can be created. Therefore, it can be understood that the use of renewable energy is a major factor in the sustainability of supply chains.
To achieve sustainability, industries must maintain sustainable production system (SPS) as well as adhere to the three basic rules of sustainability. Many industries only focus on economic profit rather than social and environmental improvement. However, almost all governments are attempting to implement environmental measures to prevent damage and address social issues (Ahmed and Sarkar, [1]). As a result, industries must follow government regulations and conduct business by considering social and environmental issues along with the economic aspects. Several industries have assigned different priorities to these three issues and some industries have focused on all three aspects equally. Based on a literature review, it is found that the latter exceeds the former (Jemai et al., [4]). To maintain equal weightage, industries must generate greater profit, cause less environmental damage, and enable social improvement in the form of job creation and other activities.
In existing literature, several studies have focused on production system (PS), even though these models were considered with traditional production system (Sarkar et al., [5]). However, sustainable smart production system (SSPS) with flexible production rates have not been studied yet. The main advantage of applying flexibility in the production rate is that it may vary within a certain known range with a maximum and minimum value (see for reference Sarkar et al., [6]). By controlling the production rate, the rate of defective item production can be controlled. In spite of this, a small percentage of random defective items are still produced in the system, which is the harsh reality for industries. This study addresses this research gap in an effective manner to allow the generation of greater profit compared to other studies in existing literature.
Regarding the business strategy, industries are always striving to reduce carbon emission (CE) and sell the excess carbon cap to other industries. Hence, the revenue from the basic demand along with that generated by trading excess carbon cap are the significant benefits for the industries. This strategy is utilized in this study, where the demand is specified as being dependent on the selling price. The current research can fulfill the existing research gap through SSPS to consider environmental and social issues.
This paper is arranged in the following manner. Section 2 presents the literature review; Section 3 describes the model formulation and solution methodology of the model; Section 4 presents numerical experiments, graphical representations, sensitivity analysis, and managerial insights. Finally, Section 5 presents the conclusions and future scope of this study.

2. Literature Review

2.1. Renewable Energy

The necessity of renewable energy is well-known because of the shortages of non-renewable energy. Industries are attempting to utilize the combination of renewable and non-renewable energy to reduce electric energy costs due to production and maintenance by utilizing renewable energy (Khan et al., [7]). Due to considerable technological development, the energy consumption is increasing continuously (Wang et al., [8]). As a result, the necessity of renewable energy is also increasing. Lee and Moon [9] optimized the effectiveness of energy efficiency for a wireless sensor network by utilizing a traditional non-renewable energy source. Sarkar et al. [10] developed a traditional production model based on non-renewable energy and proved that the non-renewable energy cost is considerable for a production system. Thus, the cost should be reduced by utilizing renewable energy. Sarkar et al. [11] discussed the effect of failure rate in a smart production system for the case of defective products through traditional energy. Their study also indicates the necessity of renewable energy for flexible or smart PS. Ahmed and Sarkar [1] introduced renewable energy as a future energy source for traditional production system under the sustainable supply chain framework. Rasti-Barzoki and Moon [12] discussed the sustainable goal of the energy efficiency under the rebound effect. Dong and Pan [13] explained a decomposition approach for the evolution of renewable energy between several countries through the Kaya equation.

2.2. Sustainable Smart Production System (SSPS)

Based on the recent environmental situation, governments have imposed regulations on industries with respect to CE. Industries must take the initiative to consider environment sustainability along with their own profit. A flexible production system is considered to be a smart production system (SMPS) (Sarkar et al., [14]). By applying a flexible production rate, the industry has technologically improved the basic traditional system. However, defective items are still produced randomly (Mishra et al., [15]). Along with the development of technologies, the industries have taken initiatives to care for the environment. The CE reduction strategy is considered to reduce the CE from the production system (Mishra et al., [16]). Dong et al. [17] introduced a CO 2 reduction strategy through PM 2.5 emission reduction to make a major environment. In this direction, Dong et al., [18] also developed another CO 2 emission reduction strategy for the developed and undeveloped countries. Our study follows this direction of research.

2.3. Variable Demands under the Effect of Energy

Recently, Moon et al. [19] discussed the advantages and disadvantages of corporate sales for promotions. Their model considered the optimal selling price for the SMPS based on an actual case study in South Korea. They explained all about the variable demand but did not consider energy issue in their study. Rasti-Barzoki and Moon [12] introduced the relationship between selling price under sustainable goals, energy, and the efficiency level. They utilized a game strategy but did not consider the concept of smart production. Taleizadeh and Mokhtarzadeh [20] proved that pricing strategy is more important for any product with or without warranty. They discussed both the online and offline price of products without any consideration of energy. Taleizadeh et al. [21] developed a pricing strategy model with the reduction of CE, although a smart or flexible production system was not contemplated nor the energy consideration was there. Masud et al. [22] introduced an advanced payment system to obtain the best selling price and maximize profit through the economical achievement without the thinking of effectiveness of energy issues. Tseng et al. [23] discussed the production of green products such that the CE could be reduced. However, they did not consider smart production. Sarkar et al. [24] established the same for a production system, which is utilized by considering flexible production rate. Though none of these authors considered the effect of renewable energy. There is a huge research gap of effectiveness for the renewable energy with a variable demand.

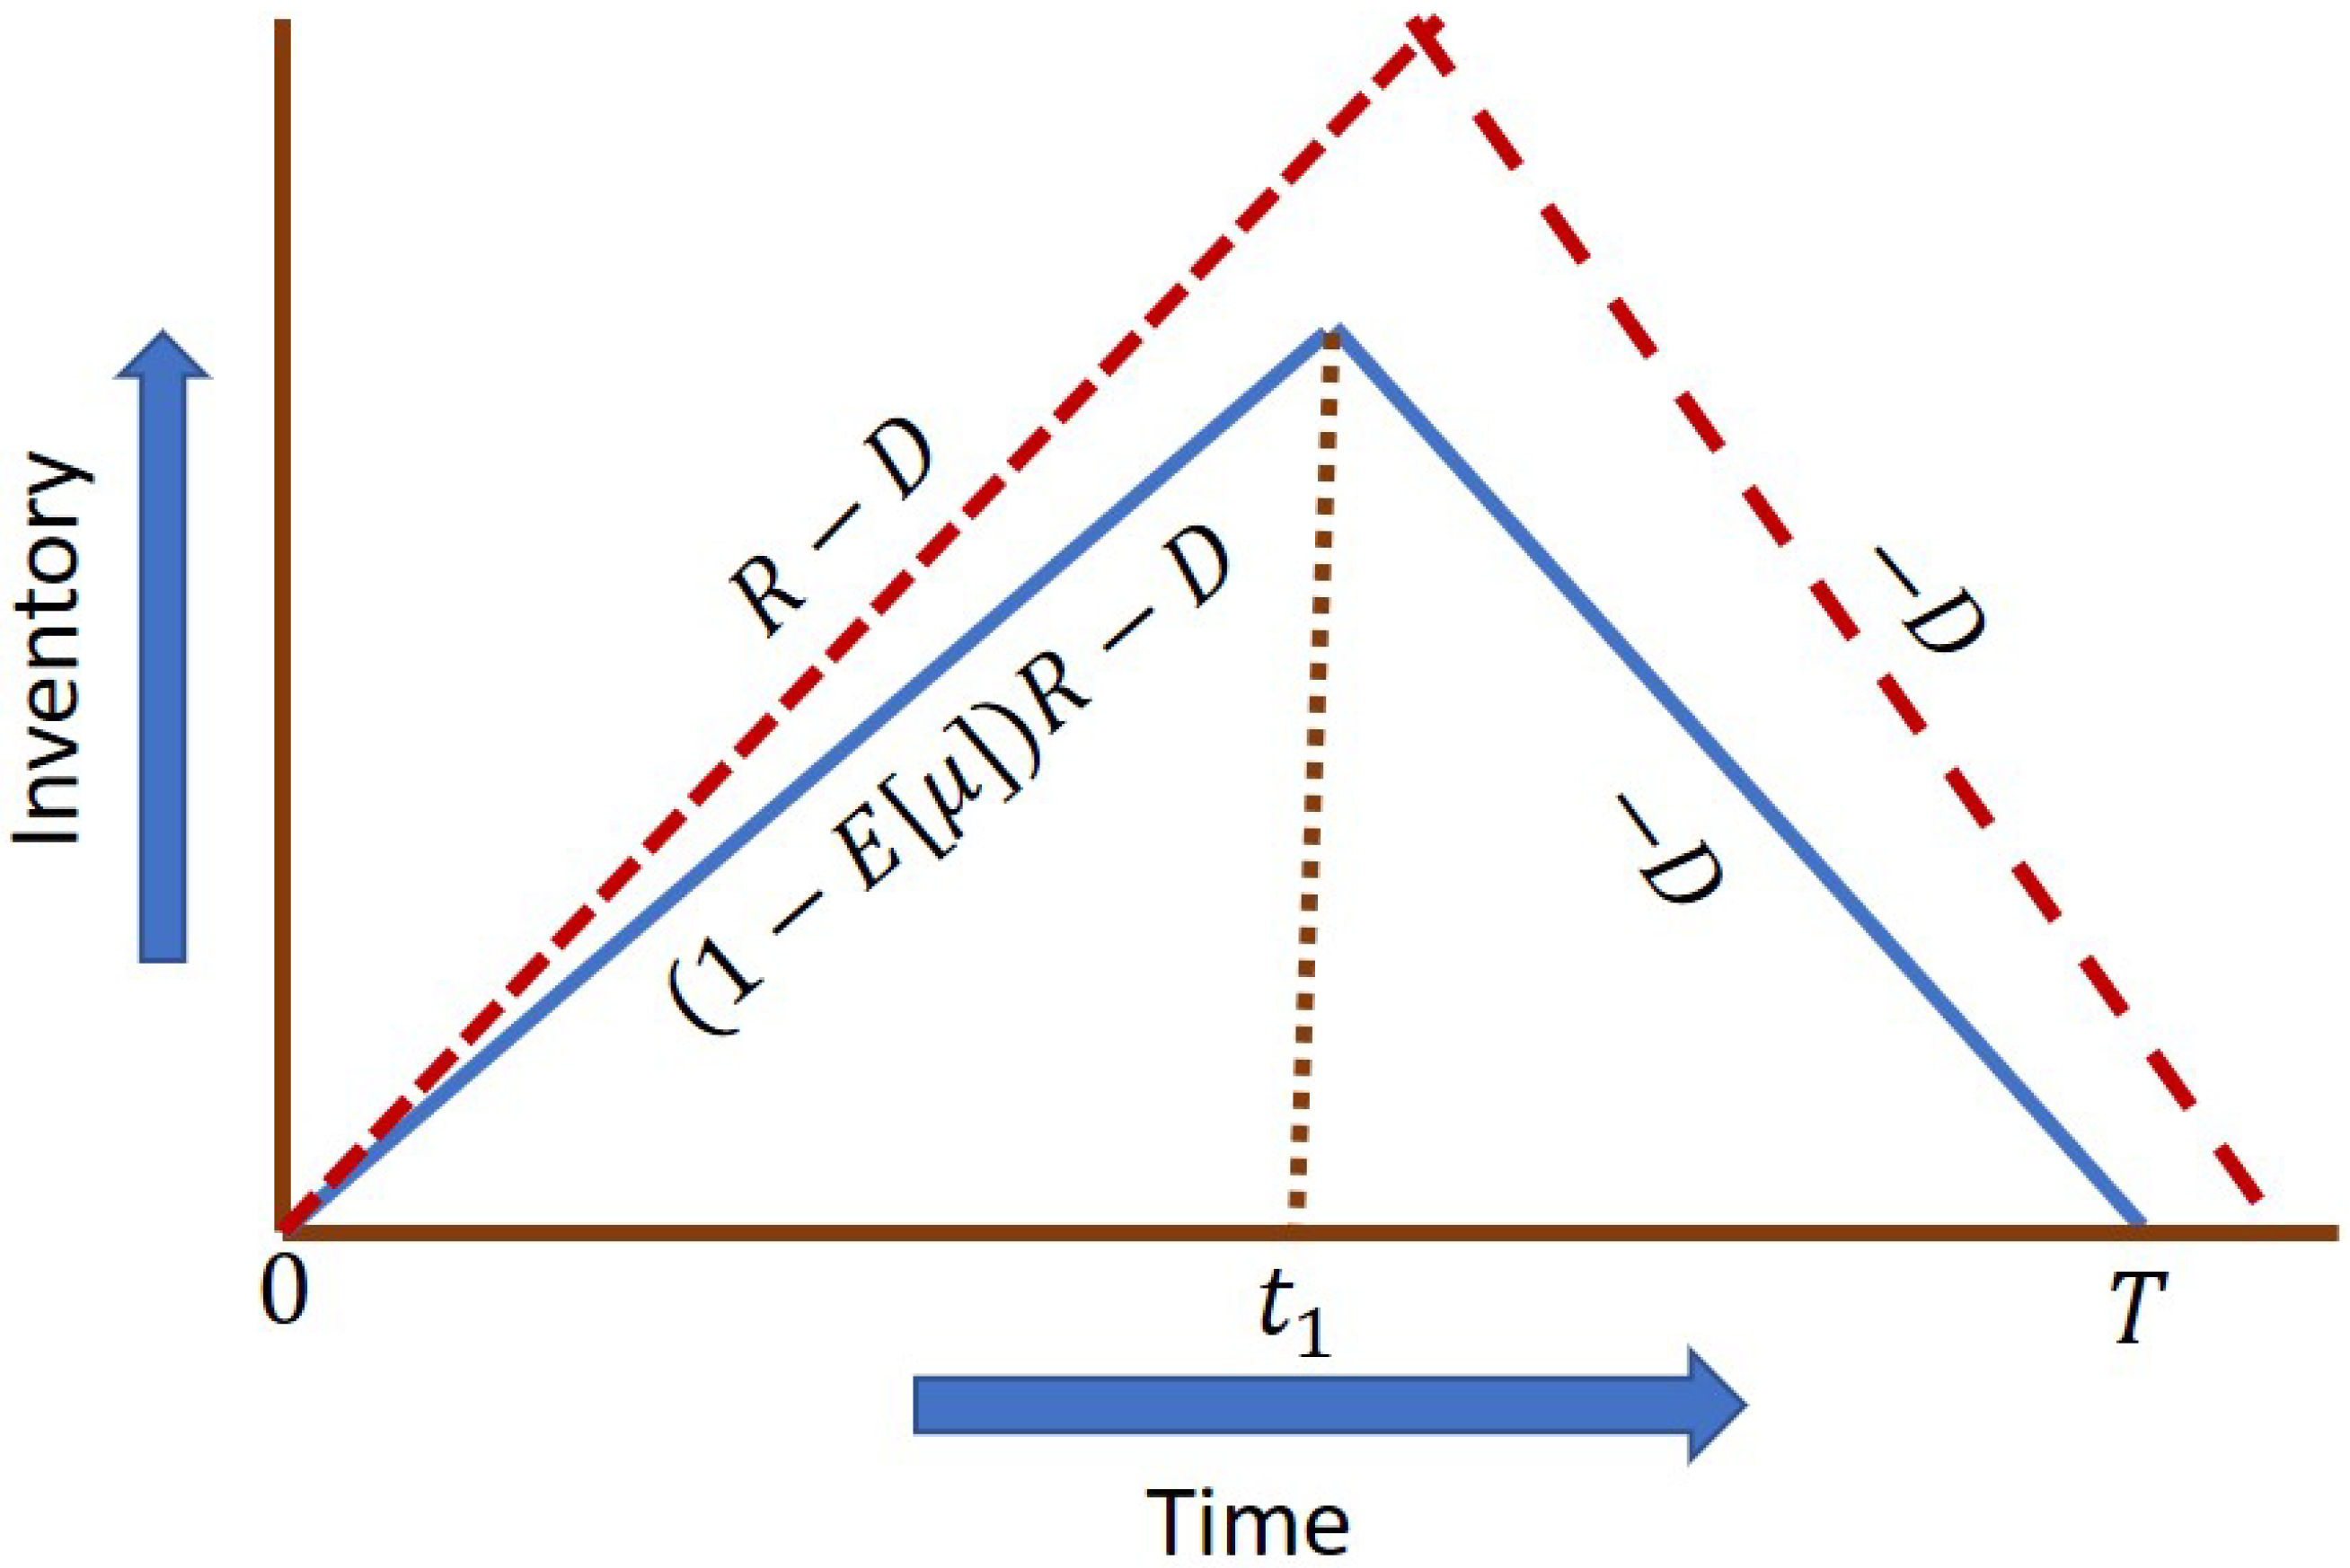
2.4. Flexible Production Rate

Generally, industries prefer to produce products with perfect quality. Perfect production depends on several factors such as the raw material, machine breakdown, skilled labor inefficiency, and long-run machine running. Based on the literature, the generation of defective products can be reduced by utilizing the flexibility in PS (see for reference Saxena et al., [25]). The flexibility of PS can be considered in several ways such as variable production rate, automated, and semi-automated PS.
It is already confirmed that flexible PS are better than traditional PS (Sarkar and Chung, [26]). Therefore, by utilizing the flexibility of PS, defective products can be reduced and maintain proper scheduling for product delivery can be maintained. However, the exact timing of rework is crucial because if rework is delayed, then a huge holding cost might be incurred. The exact time of reworking was implemented by Sarkar [27]. However, the major issue is that the author utilized a basic traditional production system whereas our study considers an SMPS. Although, Sarkar and Sarkar [2] developed an SMPS to obtain the perfect timing of reworking, they only concentrated on a specific biofuel production system. Therefore, a literature gap exists in this domain. Recently, Dey et al. [28] introduced an autonomation policy within an SMPS to enable automatic inspection without the use of labor. Kang et al. [29] discussed skilled/semi-skilled/or unskilled labor. Their study utilized this autonomation policy for an SMPS. The major concept of variable production rate, which lies in between a certain maximum and minimum limit of the production rate, is utilized from the study by Sarkar et al. [6]. It was ultimately proved by Glock [30] and Sarkar et al. [31] that the flexibility of PS can reduce defective items. However no other studies have concluded that by utilizing flexible PS, the CE can also be controlled. Our study utilizes the flexibility of the production rate and an investment for CE reduction. Regarding the production scheduling, we follow the studies by Cárdenas-Barrón & Melo [32] and Sarkar et al. [33] for specific products, which are derived from returnable transport items. Gautam et al. [34] obtained the strategic policy for different products to create a sustainable system. Table 1 presents a comparison between previous studies and our proposed model.

3. Mathematical Model

An SSPS is developed with a flexible production rate under the effect of renewable energy, in which imperfect products are manufactured randomly. The imperfect items are discarded from the system and the perfect items are held for sale. The selling price-dependent demand of the product is considered. To obey government regulations, carbon tax is assumed to be paid. Renewable energy is used and an investment is implemented to reduce the CE from the SSPS. The notation of the model is described below:
Notation
Decision variables
S p selling price of unit product ($/unit)
Tcycle time of the production system (year)
Rflexible production rate of the SSPS (unit)
Cinvestment to reduce CE from the SSPS ($)
Parameters
S t setup cost of the SSPS ($/setup)
S t energy cost to set up the SSPS ($/setup)
S h cost for holding the product ($/unit/year)
S h energy cost for holding the inventory ($/unit/year)
S d scrap cost for obsolete inventory ($/scrap item)
D ( S p ) demand of products (units)
B c carbon cap of SSPS (kg/year)
B 1 carbon emitted for holding the product (kg/year)
B 2 carbon emitted for obsolete item (kg/year)
B 3 carbon emitted during the setup of the system (kg/year)
B 4 carbon emitted during production (kg/year)
B 5 environmental effect of CE (kg/year)
β 1 shape parameter related to CE reduction
β 2 fraction of CE reduction due to investment
γ obsolesce rate of inventory
a 1 tool/die cost of the SSPS ($/unit)
a 1 energy cost during production ($/unit)
a 2 development cost of the SSPS ($)
a 2 energy cost to develop the SSPS ($)
a 3 material cost for the products ($/production lot)
E [ μ ] expected value of imperfect products
S μ cost for imperfect products ($/imperfect product)
S μ cost of energy due to imperfect production ($/imperfect product)
α tax paid for CE ($/unit emission)

3.1. Model Formulation

From a market survey, it was found that if the selling price of the product is reduced while maintaining the quality, then the product demand is increased. Thus, this study is developed with selling price-dependent demand D ( S p ) = b 1 b 2 S p b 3 S p 2 , where b 1 , b 2 , b 3 are scaling parameters. The demand is considered as a quadratic function of the selling price. This type of demand pattern can be found for industrial products such as electronic gadgets.
The SSPS produces a single type of product with flexible production rate. In a flexible production system, the unit production cost varies with the production rate. This cost consists of a combination of the raw material cost, development cost, and the tool/die cost. Except for the raw material cost, the energy cost has a major effect on the development of a product and the tool/die cost. The flexible production cost along with the energy cost due to production is obtained as follows: ( a 1 + a 1 ) R + ( a 2 + a 2 ) R + a 3 D ( S p ) .
As a flexible production system is considered, the setup cost is critical. The effect of renewable and traditional energy is adopted for finalizing the production setup. The setup cost and energy cost for setup per cycle of the SSPS can be written as ( S t + S t ) T .
Even though flexible production is used along with the utilization of renewable and non-renewable energy, there are still some imperfect products during the production process. From the literature, (Cárdenas-Barrón, [35]), the defect rate of production is constant, but in reality the defect production rate is random (Sarkar et al., [24]). None of the aforementioned studies have considered the effect of renewable energy. This study considers the utilized energy for the production process as a combination of renewable and non-renewable energy. However, within the produced items, E [ μ ] items are found to be imperfect and the remaining ( 1 E [ μ ] ) are perfect products, which are held for sale. The defective item cost and energy cost related to defective items of the production system is ( S μ + S μ ) E [ μ ] R T .
To calculate the cost of holding the inventory, the amount of holding products should be calculated. Figure 1 represents the present inventory position for the SSPS. The governing differential equation of the inventory is given by
d I ( t ) d t = ( 1 E [ μ ] ) R D ( S p ) ; 0 t t 1 ; I ( 0 ) = 0 D ( S p ) ; t 1 t T ; I ( t ) = 0 .
Solving the above equations, the inventory at time t can be obtained as follows:
I ( t ) = ( ( 1 E [ μ ] ) R D ( S p ) ) t ; for I ( 0 ) = 0 . D ( S p ) ( T t ) ; for I ( T ) = 0 .
Using the continuity condition, the inventory at the point t 1 can we expressed as follows:
( ( 1 E [ μ ] ) R D ( S p ) ) t 1 = D ( S p ) ( T t 1 ) t 1 = D ( S p ) T ( 1 E [ μ ] ) R . Therefore , the total inventory = 0 t 1 ( ( 1 E [ μ ] ) R D ( S p ) ) t d t + t 1 T D ( S p ) ( T t ) d t = ( 1 E [ μ ] ) R t 1 2 2 + D ( S p ) T 2 2 T t 1 D ( S p ) = D ( S p ) T 2 2 D 2 ( S p ) T 2 2 ( 1 E [ μ ] ) R = D ( S p ) T 2 2 1 D ( S p ) ( 1 E [ μ ] ) R . The average inventory is = D ( S p ) T 2 1 D ( S p ) ( 1 E [ μ ] ) R .
Thus, the holding and energy cost of the inventory is
= ( S h + S h ) D ( S p ) T 2 1 D ( S p ) ( 1 E [ μ ] ) R .
γ % of products are found to be obsolete or wasted during storage. Thus, the scrap cost of obsolete products is
= γ ( S p S d ) D ( S p ) T 2 1 D ( S p ) ( 1 E [ μ ] ) R .
Industries attempt to reduce CE and utilize the best effect of renewable energy. The utilization of the renewable and non-renewable energy, instead of only non-renewable energy reduces CE. Furthermore, industries invest to reduce the CE from the system. The investment for CE reduction is C. Due to investment for renewable energy and technological development, β 2 fraction of CE is reduced. The depletion of average CE is C R = β 2 ( 1 e β 1 C ) (Mishra et al., [16]). The allocated CE cost is α B c .
The CE costs are required in a different part of the SSPS. The CE cost per cycle related to setup of the SSPS is α B 3 T . The CE cost for holding products is α B 1 D ( S p ) T 2 1 D ( S p ) ( 1 E [ μ ] ) R and α B 2 γ D ( S p ) T 2 1 D ( S p ) ( 1 E [ μ ] ) R for the obsolete inventory. The cost of CE per cycle for production is α B 4 D ( S p ) T T = α B 4 D ( S p ) . The environmental impact for CE for the inventory is α B 5 D ( S p ) T T = α B 5 D ( S p ) .
Therefore, the total CE cost is
= α B 3 T + B 1 D ( S p ) T 2 1 D ( S p ) ( 1 E [ μ ] ) R + B 2 γ D ( S p ) T 2 1 D ( S p ) ( 1 E [ μ ] ) R + ( B 4 + B 5 ) D ( S p ) .
The CE after the investments is as follows:
= B 3 T + B 1 D ( S p ) T 2 1 D ( S p ) ( 1 E [ μ ] ) R + B 2 γ D ( S p ) T 2 1 D ( S p ) ( 1 E [ μ ] ) R + ( B 4 + B 5 ) D ( S p ) 1 β 2 ( 1 e β 1 C ) .
Thus,
α [ B c B 3 T + B 1 D ( S p ) T 2 1 D ( S p ) ( 1 E [ μ ] ) R + B 2 γ D ( S p ) T 2 1 D ( S p ) ( 1 E [ μ ] ) R + ( B 4 + B 5 ) D ( S p ) 1 β 2 ( 1 e β 1 C ) ]
can be saved for the reduction of CE for the SSPS.
The selling price of the product is S p . Thus, the revenue of the SSPS per cycle is S p D ( S p ) .
Therefore, the profit per cycle of the SSPS can be written as follows:
Π ( S p , R , T , C ) = S p D ( S p ) ( S t + S t ) T ( a 1 + a 1 ) R + ( a 2 + a 2 ) R + a 3 D ( S p ) ( S h + S h ) D ( S p ) T 2 1 D ( S p ) ( 1 E [ μ ] ) R ( S μ + S μ ) E [ μ ] R T C γ ( S p S d ) D ( S p ) T 2 1 D ( S p ) ( 1 E [ μ ] ) R + α [ B c ( B 3 T + B 1 D ( S p ) T 2 1 D ( S p ) ( 1 E [ μ ] ) R + B 2 γ D ( S p ) T 2 1 D ( S p ) ( 1 E [ μ ] ) R + ( B 4 + B 5 ) D ( S p ) ) 1 β 2 ( 1 e β 1 C ) ] .
Remark 1.
If this study does not consider the effect of renewable energy and ignores the concept of flexible production rate with no defective items, then the results converge to that of the study by Mishra et al. [16].
Remark 2.
If this study ignores the concept of renewable energy, flexible production, and considers no random defective rate, no carbon cap and tax, then the results converge to that of the study by Sarkar et al. [36].
Remark 3.
In conjunction with Remark 2, if this study ignores the random defective rate and consists of fixed defective production, then the results converge to that of the study by Cárdenas-Barrón, [35].

3.2. Solution Methodology

The equations are solved with a classical optimization method. Differentiating Equation (1) partially with respect to S p , we obtain
Π S p = b 1 2 b 2 S p 3 b 3 S p 2 + ( ( a 1 + a 1 ) R + ( a 2 + a 2 ) R + a 3 ) ( b 2 + 2 b 3 S p ) + ( λ 1 λ 2 ) [ ( ( S h + S h ) + γ ( S p S d ) ) + α 1 β 2 ( 1 e β 1 C ) ( B 1 + γ B 2 ) ] γ D ( S p ) T 2 1 D ( S p ) ( 1 E [ μ ] ) R .
Solving Π S p = 0 , the optimal value of S p can be denoted as follows:
S p * = λ 3 3 b 3 .
Partially differentiating with respect to another decision variable, R, we obtain
Π R = 1 R 2 ( a 2 + a 2 ) D ( S p ) ( D ( S p ) ) 2 T 2 ( 1 E [ μ ] ) R ( ( S h + S h ) + γ ( S p S d ) ) + α 1 β 2 ( 1 e β 1 C ) ( B 1 + γ B 2 ) a 1 D ( S p ) + E [ μ ] ( S μ + S μ ) T .
Equating Π R = 0 , the optimal value of R can be written as follows:
R * = a 2 D ( S p ) λ 4 a 1 D ( S p ) + E [ μ ] ( S μ + S μ ) T .
Differentiating Equation (1) with respect to T, we obtain
Π T = 1 T 2 ( S t + S t ) + S p E [ μ ] R α B 3 1 β 2 ( 1 e β 1 C ) D ( S p ) 2 1 D ( S p ) ( 1 E [ μ ] ) R ( S h + γ ( S p S d ) ) + α 1 β 2 ( 1 e β 1 C ) ( B 1 + γ B 2 ) .
Solving Π T = 0 , the optimal cycle time ( T * ) is
T * = S t + S p E [ μ ] R α B 3 1 β 2 ( 1 e β 1 C ) λ 5 .
Partially differentiating Equation (1) with respect to C, we can obtain
Π C = 1 T 2 ( S t + S t ) + S p E [ μ ] R α B 3 1 β 2 ( 1 e β 1 C ) D ( S p ) 2 1 D ( S p ) ( 1 E [ μ ] ) R ( ( S h + S h ) + γ ( S p S d ) ) + α 1 β 2 ( 1 e β 1 C ) ( B 1 + γ B 2 ) .
Equating Π C = 0 , the optimal values of the decision variable can be obtained as follows:
C * = ln α β 1 β 2 λ 6 β 1 .
(Please see Appendix A for the values of λ 1 , λ 2 , λ 3 , λ 4 , λ 5 , and λ 6 )

4. Numerical Analysis

In this section, a numerical experiment, sensitivity analysis, and managerial analysis are presented.

4.1. Numerical Experiments

Three numerical experiments are conducted to validate the model using Mathematica 11.3. The data are obtained from Mishra et al. [16].

4.1.1. Example 1

The cost for setup ( S t ) and energy cost for setup ( S t ) are $ 57 /setup and $ 3 /setup, respectively. The holding cost ( S h ) and energy for holding the products are $ 0.05 /unit/year and $ 0.01 /unit/year, respectively. The development cost a 2 and energy cost a 2 due to development are $ 2400 and $ 100 , respectively. The tool/die cost is a 1 and its energy costs are $ 0.009 /unit and $ 0.001 /unit, respectively. The raw material cost ( a 3 ) is considered as $ 9 /unit. The scrap cost for obsolete inventory is $ 2 /unit. The CE at different parts of the production system are B 1 = 1.6 kg/year, B 2 = 0.6 kg/year, and B 3 = 60 kg/year. The carbon cap is considered as 900 kg/year. The fractional rate γ is 0.6 . The scaling parameters related to demand are b 1 = 960 , b 2 = 2 , and b 3 = 0.2 . The shape parameter of CE is 3. The production of defective items follows a uniform distribution, where [ x , y ] is the range of the distribution with the condition 0 < x < y < 1 . For the numerical experiment, the range is considered as [ 0.008 , 0.012 ] and the cost of defective items and their energy cost are assumed as $ 0.019 /unit and $ 0.001 /unit, respectively. The optimal values of the decision variables along with the average profit of the proposed model can be obtained as follows.
The optimal value of flexible production rate is obtained as 397.33 units/cycle, where the optimal cycle length is 0.23 year. The optimal selling price is $ 54.84 /unit and the optimal investment to lessen the CE is $ 2.84 . The average profit of the SSPS is obtained as $ 1907.40 /cycle.
Figure 2a presents the maximum profit with respect to the optimal production rate. Figure 2b shows the maximum value of profit when the selling price is optimal. At the optimal cycle time, the maximum profit is shown in Figure 2c. Figure 2d describes the maximum profit with respect to the optimal investment for CE. All figures are concave in nature.
If this study is compared with that by Mishra et al. [16], it can be observed that the latter considered the production rate and demand to be constant. This study considers flexible production rate and the demand is selling price-dependent. The profit achieved by Mishra et al. [16] is $ 223.07 /cycle, whereas the profit achieved in this study is $ 1907.40 /cycle, which is approximately nine times greater.

4.1.2. Example 2

If only the non-renewable energy (Khan et al., [7]) is used instead of renewable energy for the setup the production system as $ 13 /setup, the profit of the SSPS is obtained as $ 1865.41 /cycle. The profit is less than the profit obtained for using both renewable and non-renewable energy. Therefore, the combination of renewable and non-renewable energy is better choice than only the non-renewable energy considering other non-comparative situation as constant.

4.1.3. Example 3

If the shape parameter for the the CE is reduced to 0.5 , the profit of the SSPS is reduced to $ 1895.12 /cycle. It indicates the specification and necessity of shape parameter for in CE expression.

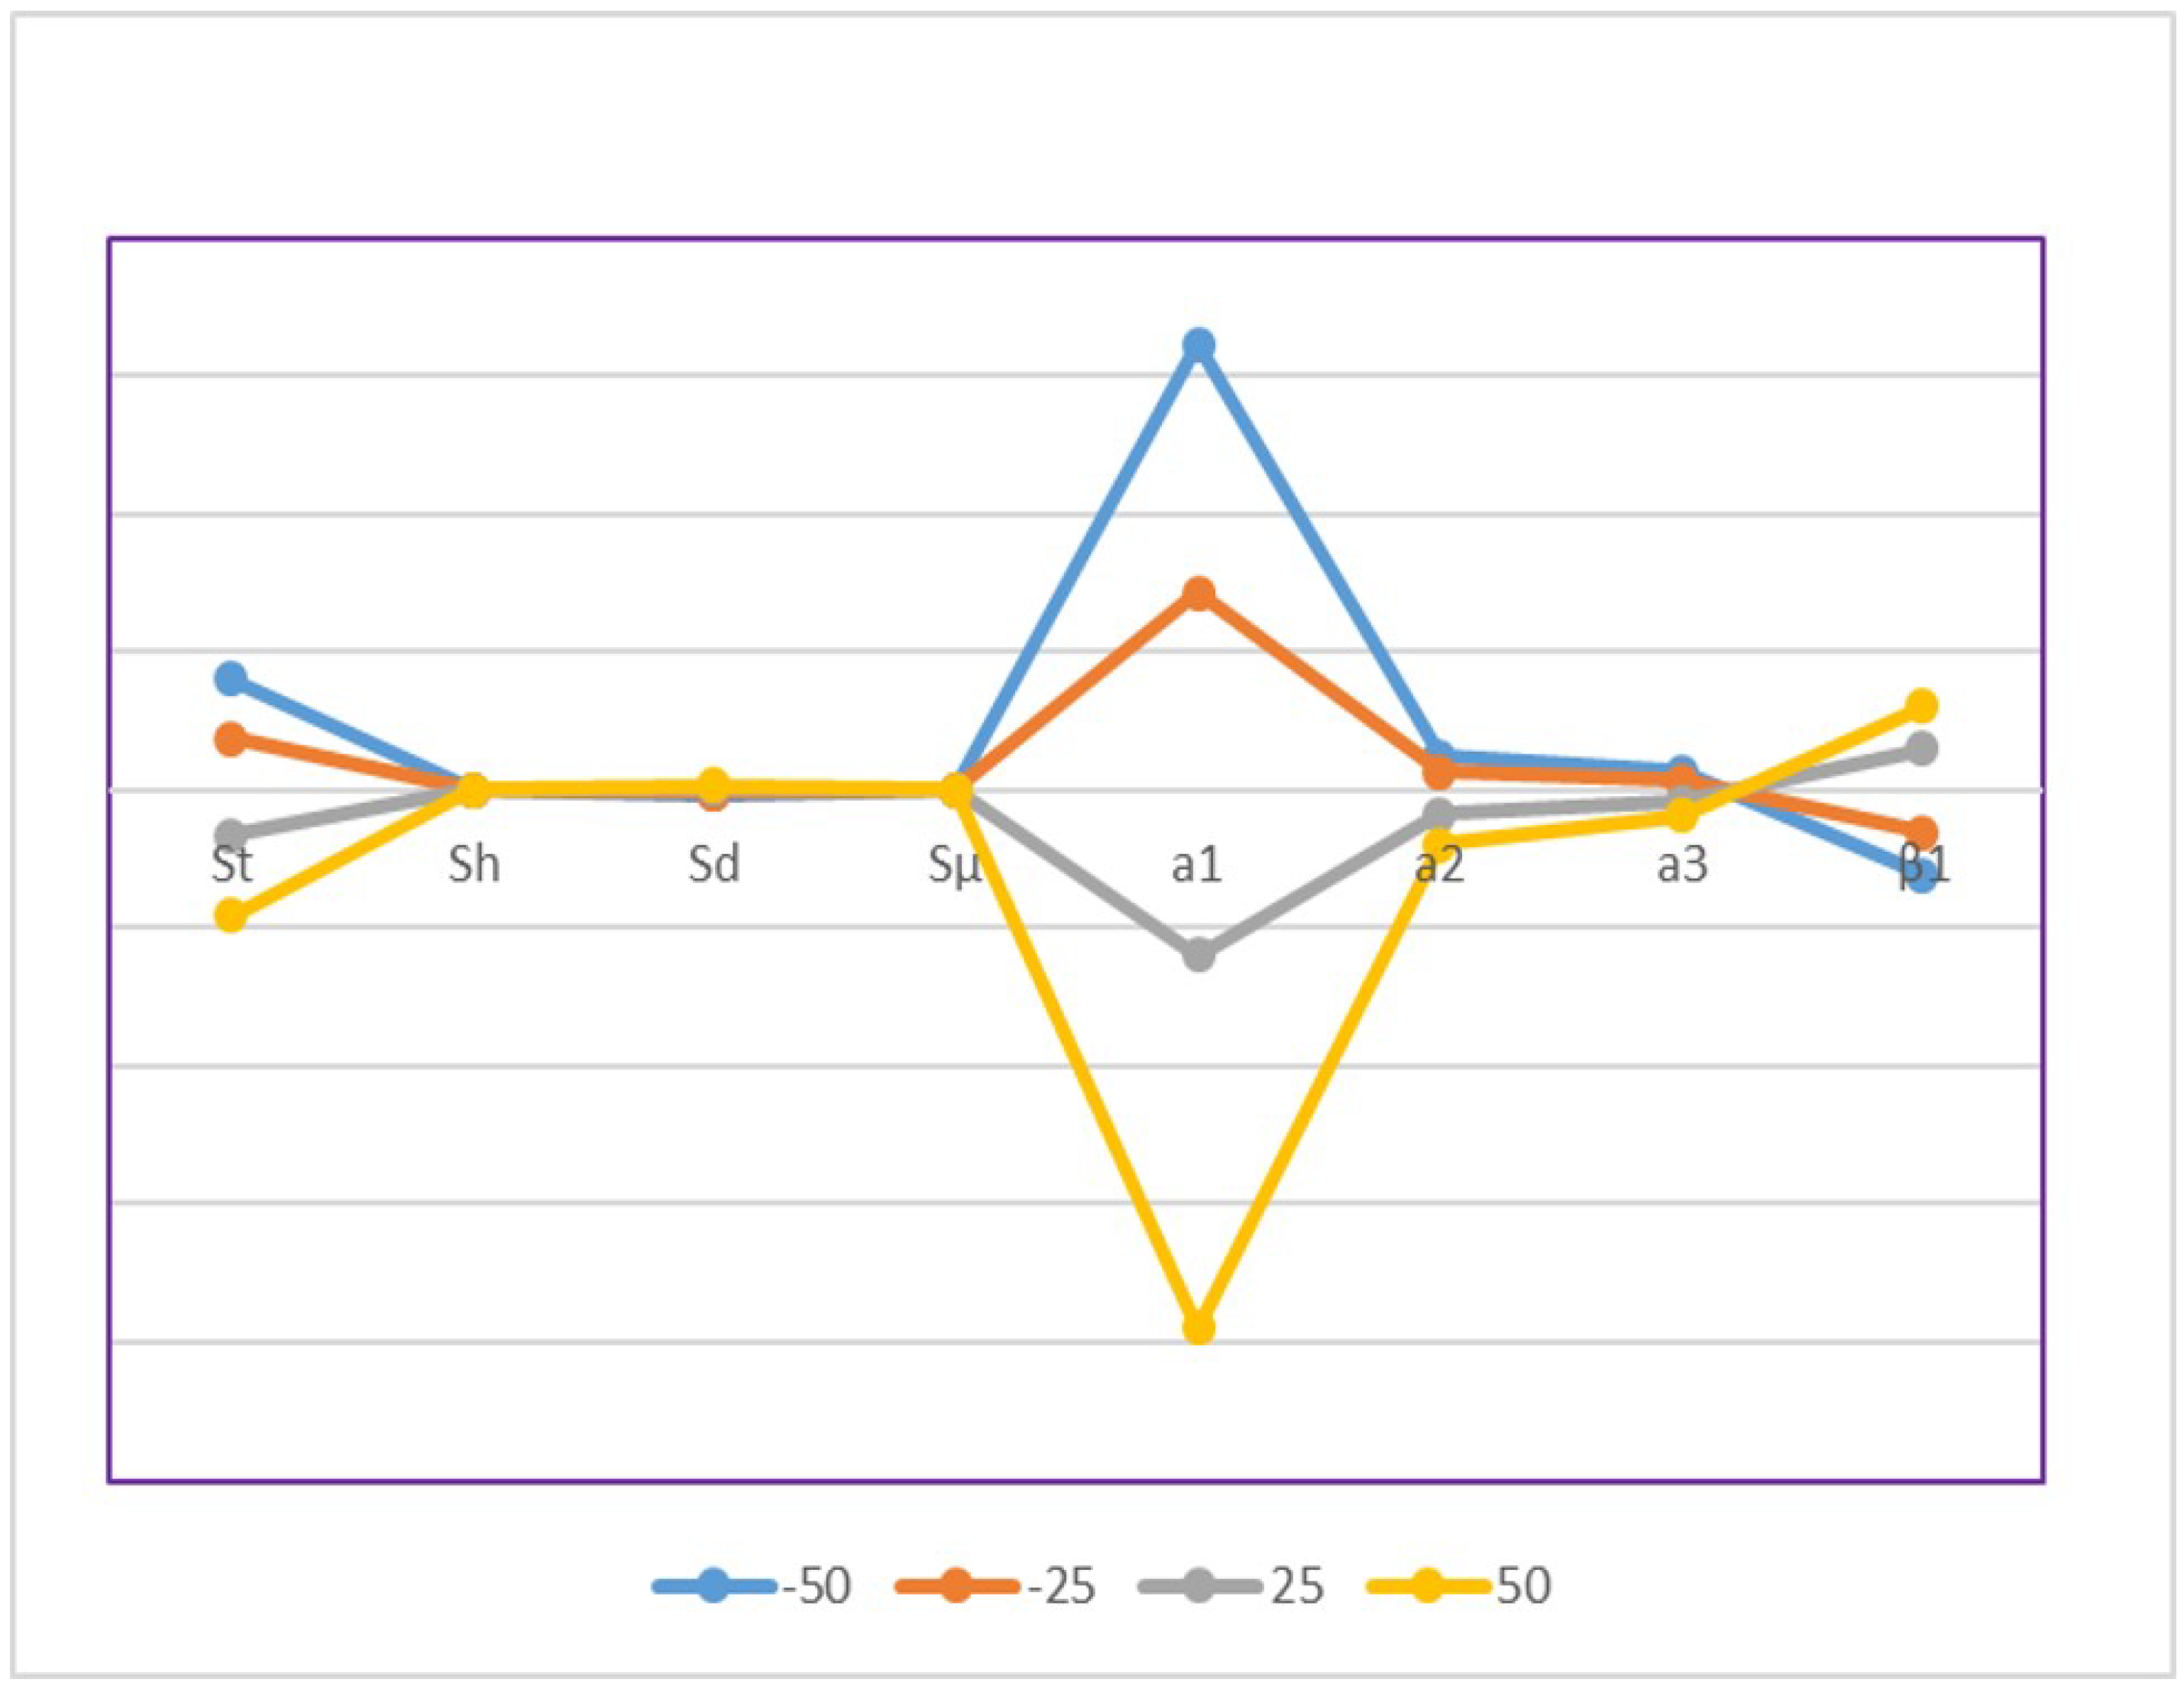
4.2. Sensitivity Analysis

A sensitivity analysis was conducted based on the important parameters of the model. For 50 % , 25 % , + 25 % , and + 50 % variation in the cost, the extent of change of each parameter provides the change in profit (see Table 2). It is apparent that if the costs increase, then the profit decreases. However, with a change of 50 % in any cost in any direction, we need to know the variation of profit to gauge the applicability of the parameters. It is found that the setup cost changes by almost 17 % in the range [ 50 % , + 50 % ] with the changes in total profit. Although, this is the second most sensitive cost among all parameters, the changes are not excessive owing to the use of flexibility in the production system. The tool/die cost is the most sensitive cost among all costs. Within the range [ 50 % , + 50 % ], it varies 72 % with the change in the profit. The development cost is the third most sensitive cost.
The above results can be mainly explained by the utilization of a flexible system rather than a traditional system. If a traditional manufacturing system is utilized, it is possible that a different cost can be the most sensitive cost. Due to utilization of flexible production, the changes in the scrap cost, defective cost are considerably less sensitive. As a major benefit, the CE reduction parameter is less sensitive than the other major costs of the system. Due to utilization of technological development, less products are held, and as a result, it is significantly less sensitive, even though it is an important cost for the inventory system. The important consideration for any flexible system is that the raw material must be perfect such that the rate of defective products should be less. However, from the changes, it is found to be considerably less sensitive. This indicates that the technological growth in the production system can help reduce defective production and promote reduction in CE, even though the raw material may not be always be perfect. Figure 3 graphically shows the changes in the profit with the change in key parameters.

4.3. Managerial Insights

The results of this can provide the following industrial insights:
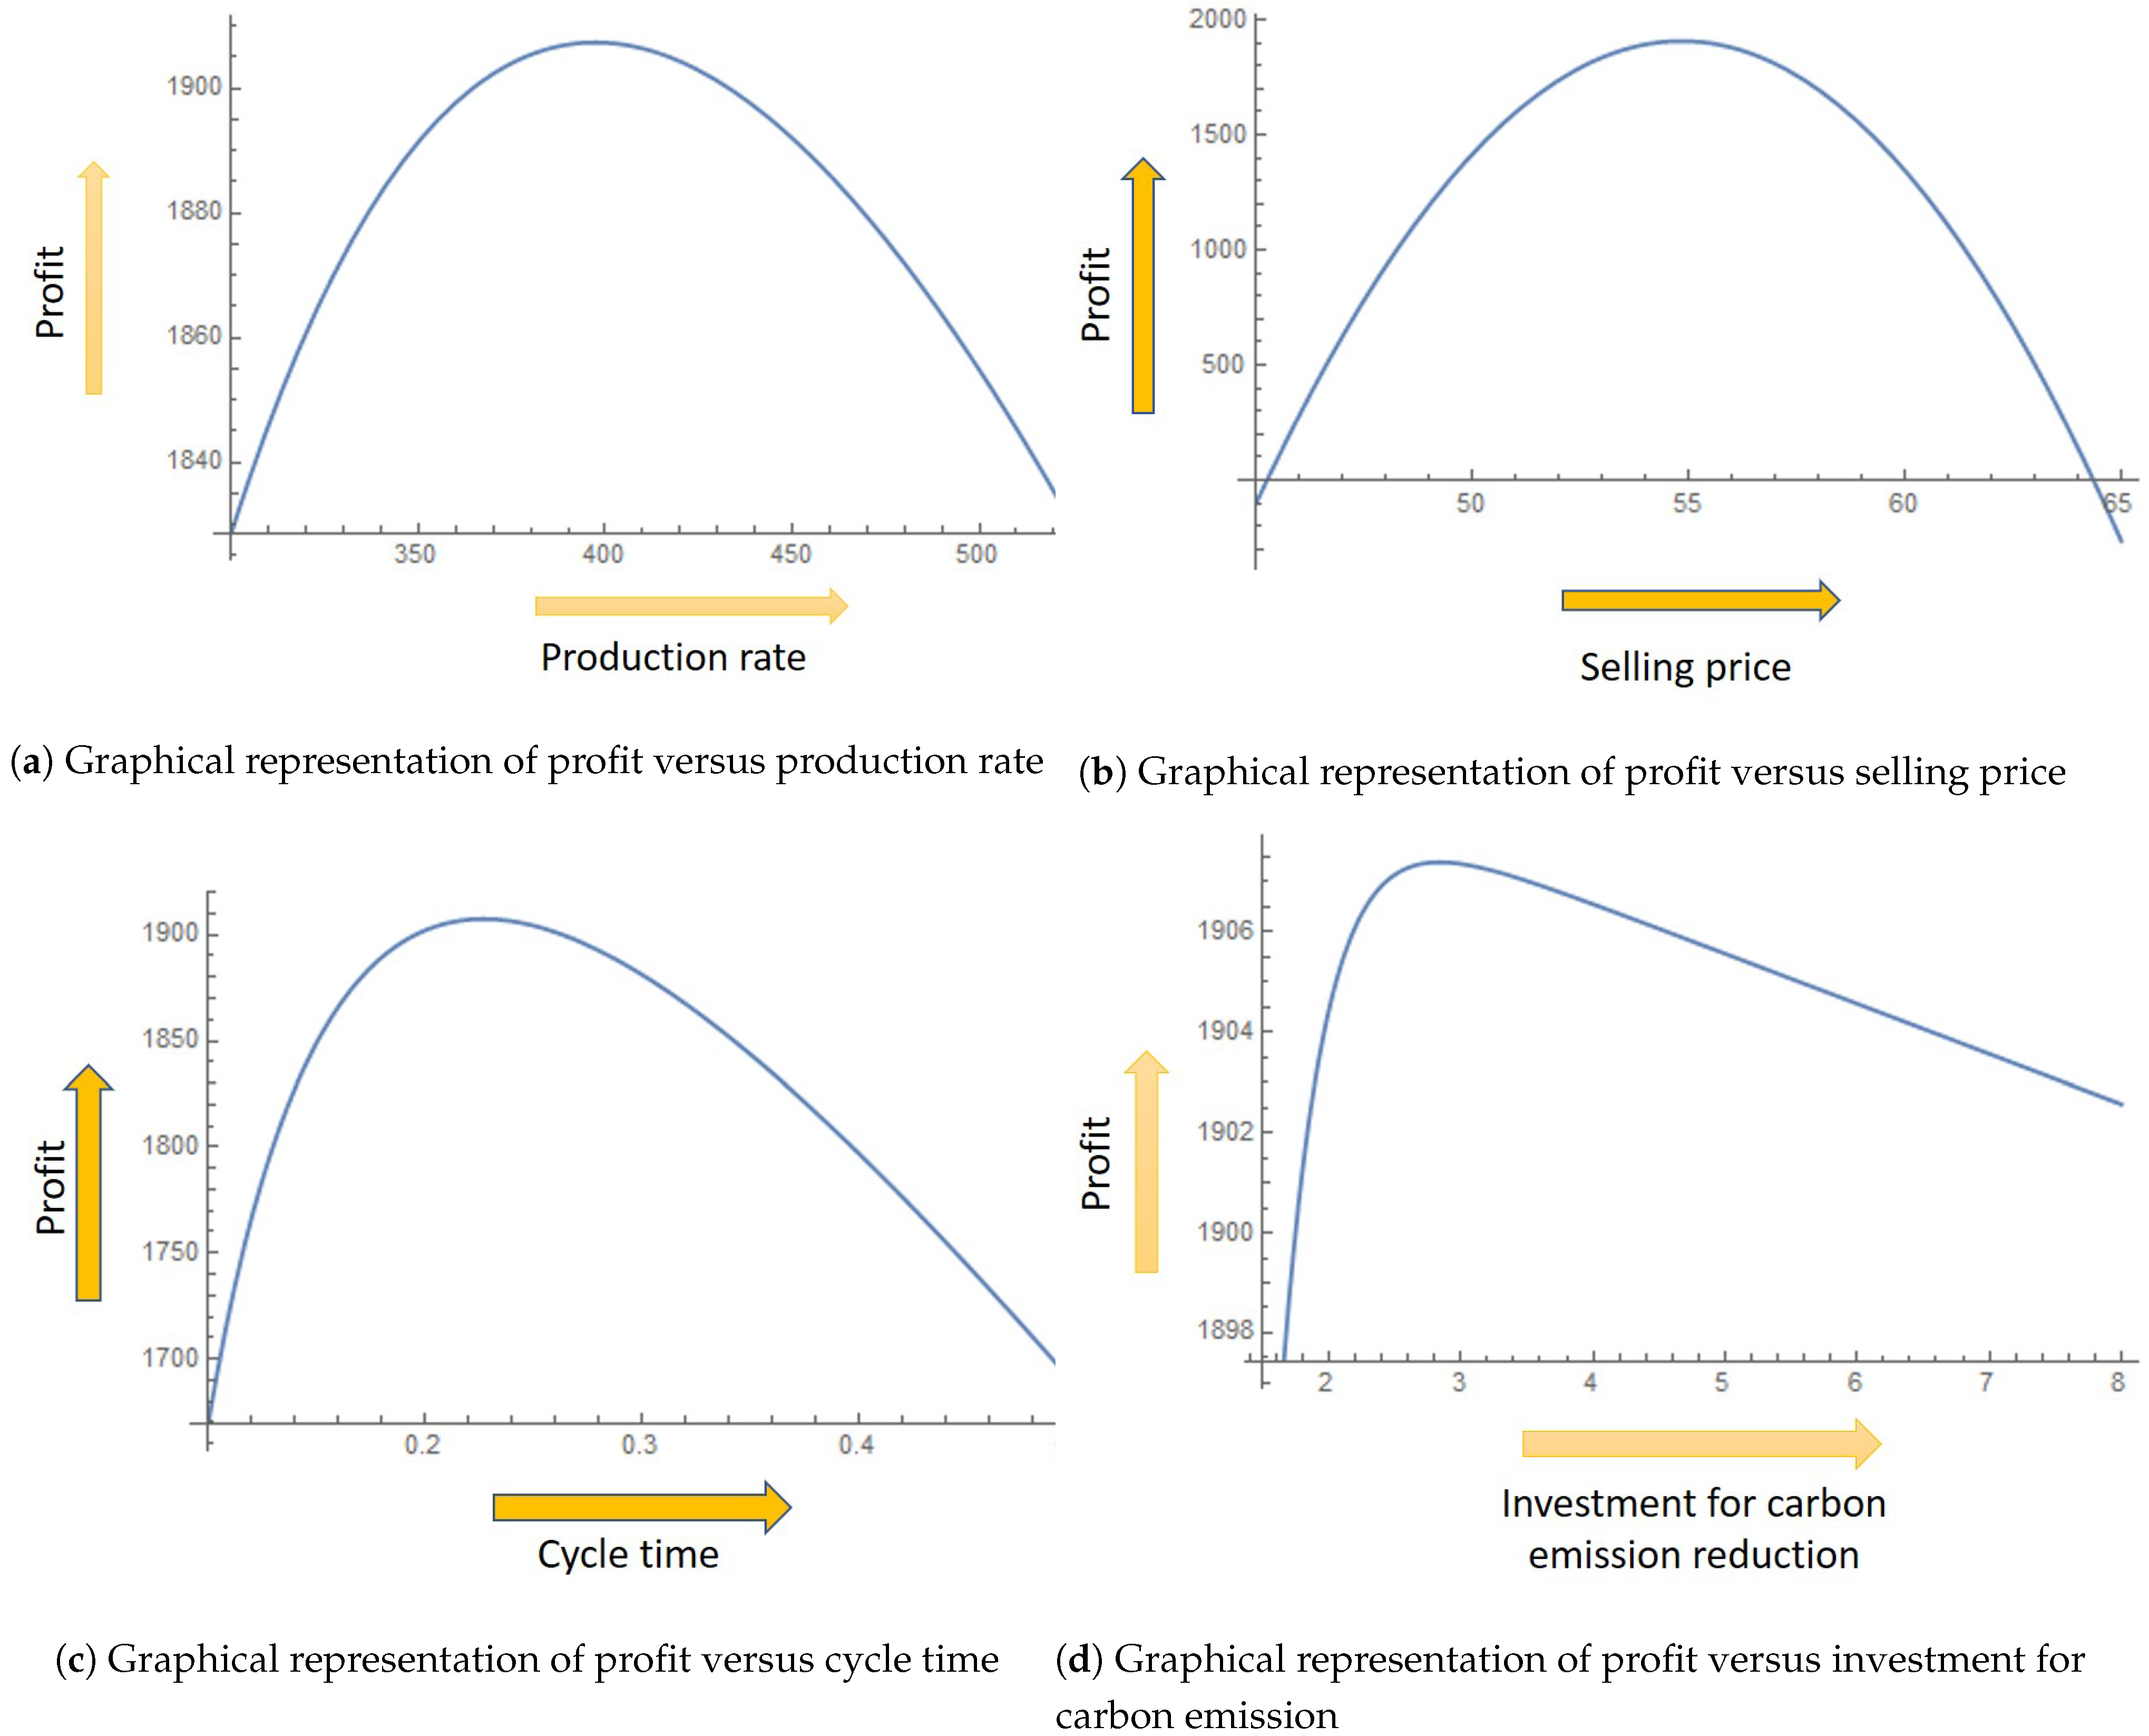
  • By utilizing flexible PS, the manager can control the rate of defective production and CE. The manager can plan to sell excess carbon cap to other companies by reducing CE. Hence, it is better to choose a flexible production system rather than a traditional production system. In Mishra et al. [16], the constant production gave less total profit and more CE than the proposed study.
  • It is deemed fruitful to invest to reduce the CE in any SSPS. However, it is better to use the investment in the technological growth of the SSPS, which can increase CE reduction. Therefore, it is recommended that managers implement an investment policy for the technological growth of the SSPS to achieve flexible or smart production to control the CE in a sustainable manner. This is strong recommendation from the findings of the sensitivity of this study. It shows the effectiveness of the shape parameter β 1 .
  • The selling price of any product is essential for the marketability of the product. Therefore, the price should be fixed based on the market survey of similar products in the market. By maintaining the same quality, the optimal selling price should be identified, which can maximize the profit. It can be demanded from the same study of Mishra et al. [16] that variable selling price with energy effect makes more profit rather than the constant demand without energy consideration.

5. Conclusions

The study considered a sustainable smart production system with a flexible production rate. An investment was applied to reduce the carbon emission. The carbon-cap policy was used to gain more profit. Both renewable and non-renewable energy were used for the production system.This study aimed to include the effect of renewable energy and use an SSPS with a flexible production rate. The SSPS needs more energy, specially when the production rate is flexible. Only using of the non-renewable energy is more costly than the combine effect of renewable and non-renewable energy. Using of renewable energy can save more cost and also carbon-emission can be reduced. Flexible production was utilized to reduce the number of defective items and minimize the CE (Sarkar et al., [14]). It was found that the CE and the amount of defective products were reduced under the proper utilization of renewable energy. The optimal selling price was found by fixing the quality of products, which was maintained under the optimal amount of investment. An additional investment is always a burden for any industry. However, utilizing this additional investment can additionally limit CE. As a result, the additional optimal investment can provide opportunities to industries to generate profit from the cap-trade strategy along with the benefits of renewable energy (Mishra et al., [15]). The extra CE capacity can be sold to other industries that require an increased CE limit for production or transportation. The total profit is maximized under the optimal utilization of renewable energy and reduction of CE. For further study, the demand based on the online and offline selling price together may be considered. (Moon et al., [19]). In this study, we have only considered the opportunity to sell the extra amount of CE. Further studies can be conducted by considering the cap-trade strategy with different limits. It is observed that the development cost is the most sensitive cost. Thus, it is better to use investment to reduce the development cost under the flexible production system with appropriate utilization of renewable energy (Rasti-Barzaoki and Moon, [12]). It can be an fruitful idea to optimize the consumed energy instead of using renewable energy. In this direction, this paper can be extended again. The carbon emission measurement can be conducted within several countries to obtain the insights and major ideas to reduce the emission. This can be a major further extension using a decomposition principal (Dong et al., [3]).

Author Contributions

Conceptualization, modelling, computational analysis, and draft writing were done by M.S.; writing—review and editing, investigation and validation, and supervision were done by B.D.C. All authors have read and agreed to the published version of the manuscript.

Funding

This work was supported by the Yonsei University Research Fund (Post Doc. Researcher Supporting Program) of 2019 (project no.: 2019-12-0016).

Institutional Review Board Statement

Not applicable.

Informed Consent Statement

Not applicable.

Data Availability Statement

All data are given in the paper. Separately there is no other data.

Conflicts of Interest

The authors declare no conflict of interest.

Abbreviations

SSPSsustainable smart production system
SSCMsustainable supply chain management
SCMsupply chain management
SCMsupply chain
GSCMgreen supply chain management
SMPSsmart production system
SPSsustainable production system
EOQeconomic order quantity
CEcarbon emission
PSproduction system

Appendix A

λ 1 = ( b 2 + 2 b 3 S p ) T 2 λ 2 = ( b 2 + 2 b 3 S p ) D ( S p ) T ( 1 E [ μ ] ) R λ 3 = ( b 1 2 b 2 S p ) + ( ( a 1 + a 1 ) R + ( a 2 + a 2 ) R + a 3 ) ( b 2 + 2 b 3 S p ) + ( λ 1 λ 2 ) [ ( ( S h + S h ) + γ ( S p S d ) ) + α 1 β 2 ( 1 e β 1 C ) ( B 1 + γ B 2 ) ] γ D ( S p ) T 2 1 D ( S p ) ( 1 E [ μ ] ) R λ 4 = ( D ( S p ) ) 2 T 2 ( 1 E [ μ ] ) R ( ( S h + S h ) + γ ( S p S d ) ) + α 1 β 2 ( 1 e β 1 C ) ( B 1 + γ B 2 ) λ 5 = D ( S p ) 2 1 D ( S p ) ( 1 E [ μ ] ) R ( ( S h + S h ) + γ ( S p S d ) ) + α 1 β 2 ( 1 e β 1 C ) ( B 1 + γ B 2 ) λ 6 = B 3 T + D ( S p ) T 2 1 D ( S p ) ( 1 E [ μ ] ) R ( B 1 + B 2 γ ) + ( B 4 + B 5 ) D ( S p )

References

  1. Ahmed, W.; Sarkar, B. Management of next-generation energy using a triple bottom line approach under a supply chain framework. Resour. Conserv. Recycl. 2019, 150, 104431. [Google Scholar] [CrossRef]
  2. Sarkar, M.; Sarkar, B. How does an industry reduce waste and consumed energy within a multi-stage smart sustainable biofuel production system? J. Clean. Prod. 2020, 262, 121200. [Google Scholar] [CrossRef]
  3. Dong, F.; Li, J.; Wang, Y.; Zhang, X.; Zhang, S.; Zhang, S. Drivers of the decoupling indicator between the economic growth and energy-related CO2 in China: A revisit from the perspectives of decomposition and spatiotemporal heterogeneity. Sci. Total Environ. 2019, 685, 631–658. [Google Scholar] [CrossRef] [PubMed]
  4. Jemai, J.; Chung, B.D.; Sarkar, B. Environmental effect for a complex green supply-chain management to control waste: A sustainable approach. J. Clean. Prod. 2020, 277, 122919. [Google Scholar] [CrossRef]
  5. Sarkar, B.; Sarkar, M.; Ganguly, B.; Cárdenas-Barrón, L.E. Combined effects of carbon emission and production quality improvement for fixed lifetime products in a sustainable supply chain management. Int. J. Prod. Econ. 2021, 231, 107867. [Google Scholar] [CrossRef]
  6. Sarkar, B.; Guchhait, R.; Sarkar, M.; Pareek, S.; Kim, N. Impact of safety factors and setup time reduction in a two-echelon supply chain management. Robot. Comput.-Integr. Manuf. 2019, 55, 250–258. [Google Scholar] [CrossRef]
  7. Khan, I.; Jemai, J.; Han, L.; Sarkar, B. Effect of electrical energy on the manufacturing setup cost reduction, transportation discounts, and process quality improvement in a two-echelon supply chain management under a service-level constraint. Energies 2020, 12, 3733. [Google Scholar] [CrossRef] [Green Version]
  8. Wang, Z.; Bui, Q.; Zhang, B.; Nawarathna, C.L.K.; Mombeuil, C. The nexus between renewable energy consumption and human development in BRICS countries: The moderating role of public debt. Renew. Energy 2021, 165, 381–390. [Google Scholar] [CrossRef]
  9. Lee, J.H.; Moon, I. Modeling and optimization of energy efficient routing in wireless sensor networks. Appl. Math. Model. 2014, 38, 2280–2289. [Google Scholar] [CrossRef]
  10. Sarkar, B.; Omair, M.; Choi, S.B. A Multi-Objective Optimization of Energy, Economic, and Carbon Emission in a Production Model under Sustainable Supply Chain Management. Appl. Sci. 2018, 8, 1744. [Google Scholar] [CrossRef] [Green Version]
  11. Sarkar, M.; Sarkar, B.; Iqbal, M.W. Effect of energy and failure rate in a multi-item smart production system. Energies 2018, 11, 2958. [Google Scholar] [CrossRef] [Green Version]
  12. Rasti-Barzoki, M.; Moon, I. A game theoretic approach for car pricing and its energy efficiency level versus governmental sustainability goals by considering rebound effect: A case study of South Korea. Appl. Energy 2020, 271, 115196. [Google Scholar] [CrossRef]
  13. Dong, F.; Pan, Y. Evolution of renewable energy in BRI countries: A combined econometric and decomposition approach. Int. J. Environ. Res. Public Health 2020, 17, 8668. [Google Scholar] [CrossRef] [PubMed]
  14. Sarkar, M.; Pan, L.; Dey, B.K.; Sarkar, B. Does the Autonomation Policy Really Help in a Smart Production System for Controlling Defective Production? Mathematics 2020, 8, 1142. [Google Scholar] [CrossRef]
  15. Mishra, M.; Hota, S.K.; Ghosh, S.K.; Sarkar, B. Controlling Waste and Carbon Emission for a Sustainable Closed-Loop Supply Chain Management under a Cap-and-Trade Strategy. Mathematics 2020, 8, 466. [Google Scholar] [CrossRef] [Green Version]
  16. Mishra, U.; Wu, J.Z.; Sarkar, B. A sustainable production-inventory model for a controllable carbon emissions rate under shortages. J. Clean. Prod. 2020, 256, 120268. [Google Scholar] [CrossRef]
  17. Dong, F.; Yu, B.; Pan, Y. Examining the synergistic effect of CO2 emissions on PM2.5 emissions reduction: Evidence from China. J. Clean. Prod. 2019, 223, 759–771. [Google Scholar] [CrossRef]
  18. Dong, F.; Wang, Y.; Su, B.; Hua, Y.; Zhang, Y. The process of peak CO2 emissions in developed economies: A perspective of industrialization and urbanization. J. Clean. Prod. 2019, 141, 61–75. [Google Scholar] [CrossRef]
  19. Moon, I.; Xu, J.; Feng, X.; Ruan, X. Cooperative sales promotion with a point-sharing policy: Advantages and limitations. Omega 2020, 94, 102038. [Google Scholar] [CrossRef]
  20. Taleizadeh, A.A.; Mokhtarzadeh, M. Pricing and two-dimensional warranty policy of multi-products with online and offline channels using a value-at-risk approach. Comput. Ind. Eng. 2020, 148, 106674. [Google Scholar] [CrossRef]
  21. Taleizadeh, A.A.; Hazarkhani, B.; Moon, I. Joint pricing and inventory decisions with carbon emission considerations, partial backordering and planned discounts. Ann. Oper. Res. 2020, 290, 95–113. [Google Scholar] [CrossRef]
  22. Mashud, A.H.M.; Wee, H.M.; Sarkar, B.; Li, Y.H.C. A sustainable inventory system with the advanced payment policy and trade-credit strategy for a two-warehouse inventory system. Kybernetes 2020. [Google Scholar] [CrossRef]
  23. Tseng, S.H.; Wee, H.M.; Song, P.S.; Jeng, S. Optimal green supply-chain model design considering full truckload. Kybernetes 2019, 48, 2150–2174. [Google Scholar] [CrossRef]
  24. Sarkar, B.; Dey, B.K.; Pareek, S.; Sarkar, M. A single-stage cleaner production system with random defective rate and remanufacturing. Comput. Ind. Eng. 2020, 150, 106861. [Google Scholar] [CrossRef]
  25. Saxena, N.; Sarkar, B.; Singh, S.R. Selection of remanufacturing/production cycles with an alternative market: A perspective on waste management. J. Clean. Prod. 2020, 245, 118935. [Google Scholar] [CrossRef]
  26. Sarkar, M.; Chung, B.D. Flexible work-in-process production system in supply chain management under quality improvement. Int. J. Prod. Res. 2020, 58, 3821–3838. [Google Scholar] [CrossRef]
  27. Sarkar, B. Mathematical and analytical approach for the management of defective items in a multi-stage production system. J. Clean. Prod. 2019, 218, 896–919. [Google Scholar] [CrossRef]
  28. Dey, B.K.; Pareek, S.; Tayyab, M.; Sarkar, B. Autonomation policy to control work-in-process inventory in a smart production system. Int. J. Prod. Res. 2020. [Google Scholar] [CrossRef]
  29. Kang, C.W.; Babar, B.M.; Sarkar, B.; Imran, M. Effect of inspection performance in smart manufacturing system based on human quality control system. Int. J. Adv. Manuf. Tech. 2018, 94, 4351–4364. [Google Scholar] [CrossRef]
  30. Glock, C.H. A comment: Integrated single vendor single buyer model with stochastic demand and variable lead time. Int. J. Prod. Econ. 2009, 122, 790–792. [Google Scholar] [CrossRef]
  31. Sarkar, B.; Guchhait, R.; Sarkar, M.; Cárdenas-Barrón, L.E. How does an industry manage the optimum cash flow within a smart production system with the carbon footprint and carbon emission under logistics framework? Int. J. Prod. Econ. 2019, 213, 243–257. [Google Scholar] [CrossRef]
  32. Cárdenas-Barrón, L.E.; Melo, R.A. A fast and effective MIP-based heuristic for a selective and periodic inventory routing problem in reverse logistics. arXiv 2020, arXiv:2004.04188. [Google Scholar]
  33. Sarkar, B.; Tayyab, M.; Kim, N.; Habib, M.S. Optimal production delivery policies for supplier and manufacturer in a constrained closed-loop supply chain for returnable transport packaging through metaheuristic approach. Comput. Ind. Eng. 2019, 135, 987–1003. [Google Scholar] [CrossRef]
  34. Gautam, P.; Kishore, A.; Khanna, A.; Jaggi, C.K. Strategic defect management for a sustainable green supply chain. J. Clean. Prod. 2019, 233, 226–241. [Google Scholar] [CrossRef]
  35. Cárdenas-Barrón, L.E. Economic production quantity with rework process at a single-stage manufacturing system with planned backorders. Comput. Ind. Eng. 2009, 57, 1105–1113. [Google Scholar] [CrossRef]
  36. Sarkar, B.; Cárdenas-Barrón, L.E.; Sarkar, M.; Singgih, M.L. An economic production quantity model with random defective rate, rework process and backorders for a single stage production system. J. Manuf. Syst. 2014, 33, 423–435. [Google Scholar] [CrossRef]
Figure 1. Inventory position of the sustainable smart production system.
Energies 14 00215 g001
Figure 2. Graphical representation of profit versus the decision variables.
Energies 14 00215 g002
Figure 3. Sensitivity analysis for key parameters.
Energies 14 00215 g003
Table 1. Comparison between previous studies and the current study.
Author(s)Model
Type
Production
Rate
Defective
Rate
Carbon
Emission
Sarkar et al. [5]SSCMConstantConstantConsidered
Sarkar et al. [6]SCMFlexible
Mishra et al. [16]SPSConstantConsidered
Taleizadeh et al. [21]EOQ Considered
Tseng et al. [23]SCMConstantConsidered
Saxena et al. [25]SCMConstantConstantConsidered
Dey et al. [28]ProductionConstantRandom
Proposed researchSSPSFlexibleRandomConsidered
− indicates not applicable.
Table 2. Changes in the profit of the SSPS with changes in key parameters.
ParametersChanges
(in %)
Changes of Π S
(in %)
ParametersChanges
(in %)
Changes of Π S
(in %)
S t
(Setup cost)
−50 + 8.09 S h
(Holding cost)
−50 + 0.02
−25 + 3.73 −25 + 0.01
+25 3.22 +25 0.01
+50 9.05 +50 0.02
S d
(Scrap cost)
−50 0.32 S μ
(Defective item cost)
−50 + 0.01
−25 0.16 −25 + 0.004
+25 + 0.16 +25 0.004
+50 + 0.32 +50 0.01
a 1
(Tool/die cost)
−50 + 32.37 a 2
(Development cost)
−50 + 2.45
−25 + 14.32 −25 + 1.34
+25 11.89 +25 1.71
+50 39.01 +50 3.92
a 3
(Material cost)
−50 + 1.32 β 1
(Carbon emission reduction parameter)
−50 6.14
−25 + 0.72 −25 3.05
+25 0.86 +25 + 3.03
+50 1.87 +50 + 6.05
Publisher’s Note: MDPI stays neutral with regard to jurisdictional claims in published maps and institutional affiliations.

