Article

Integrated Assessment Modeling of China’s Shale Gas Resource: Energy System Optimization, Environmental Cobenefits, and Methane Risk

1
School of Economy and Management, China University of Petroleum Beijing, Beijing 102249, China
2
Institute of Energy, Environment and Economy, Tsinghua University, Beijing 100084, China
3
College of Geosciences, China University of Petroleum Beijing, Beijing 102249, China
*
Author to whom correspondence should be addressed.
Energies 2021, 14(1), 53; https://doi.org/10.3390/en14010053
Submission received: 21 November 2020 / Revised: 15 December 2020 / Accepted: 15 December 2020 / Published: 24 December 2020

Abstract

:
Comprehensive evaluation of shale gas resource, which plays a role in energy system optimization, atmospheric environmental cobenefit, and methane risk, has long been ignored in China. This research aims to fill this gap and conduct a study based on the China-Multi-pollutant Abatement Planning and Long-term benefit Evaluation model to answer the research question, “When considering environmental and climate risks, does the shale gas resource in China exert a negative or positive effect?” Results show that shale gas plays an important role in replacing coal and optimizing the energy structure. Shale gas can also effectively help reduce the key local pollutant emissions. Approximately 84.85 thousand of deaths (persons) and 32.24 billion yuan of economic loss can be avoided in 2030 with the reduction of SO2 and NOx. The methane risk, which has been disregarded in China when evaluating cobenefits, is also considered in this study. The economic loss due to methane leakage is estimated to reach approximately 2.76 billion yuan on average in 2030. Overall, the net atmospheric environmental cobenefit could reach 68.61 billion yuan on average in 2030, accounting for 0.04% of China’s GDP. This study provides positive evidence for an integrated assessment of shale gas resource in coal-dominant developing countries.

1. Introduction

Shale gas resources are widely distributed globally, mainly in North America, Central Asia, the Middle East, North Africa, and Southern Africa [1]. However, the shale gas study in China is relatively limited [2], and study from the comprehensive assessment aspect is lacking. This paper contributes to the current literature via its integrated analysis on the shale gas development in China, including energy system optimization, environmental cobenefit, and climate risk. The study is designed to answer the questions “What are the main challenges in China’s shale gas development? Is it worth promoting shale gas in China despite the comprehensive impacts?”
The reason why these questions are important to answer is that shale gas has drawn wide attention for its development in such countries as the United States, Canada, and United Kingdom. Especially regarding environmental impact and climate risk. The environmental impact [3,4,5,6] and climate risk [7] of shale gas are the focus of discussion. Westaway R. et al. and Stamford L. et al. [3,4,5] hold two extreme views on the potential impact of shale gas in the UK, and have conducted multiple rounds of debate. Turk J.K. et al. [7] showed that shale gas in the UK will increase the carbon budget overruns and may have an impact on the country’s climate change goals. These issues are of vital importance both nationally and internationally. Nevertheless, such comprehensive studies in China remain lacking. On the other hand, shale gas also plays an important role in energy substitution. But we noticed the proportion of gas varied in different countries, e.g., in 2018 approximately 19.63% in the United States, of which 58.69% is shale gas [8,9], and only 5.50% in China, of which 9.61% is shale gas [8,10]. In general, gas is an important realistic replacement for coal, considering the small proportion of gas used in China and its lack of research, the gap in comprehensive studies on shale gas should be filled. This study aims to answer the aforementioned questions.
First, studies in gas-dominant countries have provided answers to the questions for a comprehensive environmental impact analysis. For comprehensive research, Cooper J et al. [11,12] conducted the first study and analysis of the overall sustainability of shale gas in the UK, they used 14 indicators for evaluation, and the conclusions are multifaceted. Therefore, the pros and cons of shale gas use are difficult to conclude based on a single level of research; this is one of the reasons why we hope to fill the gaps in China’s research and conduct more comprehensive discussions. Moreover, as for the atmospheric environment and health benefits, earlier related studies were carried out by Jenner S. and Lamadrid A.J. [13] and Bunch A.G. et al. [14], they all came to a positive conclusion regarding shale gas. Of course, there are still some scholars arguing about this issue [3,4,5]. In terms of economic benefits, the research of Bilgilih F [15] and Solarin S.A. et al. [16] proved the positive impact of shale gas on the U.S. economy. Research on shale gas about its economic benefits in European countries has produced some different opinions. Grecu E. et al. [17] used CBA (Cost Benefit Analysis) to evaluate shale gas production in Romania and showed that the shale gas exploitation has no real benefits in the long run in densely populated areas; Saussay A [18] and Cooper J [19] also believe that the economic success of American shale gas may not be replicated in European countries. It can be seen that a reasonable analysis angle of shale gas should be diverse and comprehensive, while such comprehensive discussion is lacking in China, so this paper aims to show the comprehensive impact of shale gas development in China to complete this worldwide story on shale gas.
Second, this paper contributes to studies on shale gas from the environmental impact on the consumption process. The research of the effect of shale gas consumption in China started late and has focused on energy substitution [20,21,22], carbon footprint and carbon reduction [20,22,23,24,25], and economic benefits [21,26]. Few quantitative studies on environmental impacts exist, and research focusing on health impacts is limited. Empirical studies (e.g., in Chongqing and Sichuan) are many, but few studies are from the perspective of the entire industry, including consumption processes, are available. International research on shale gas has mainly focused on the environmental impact [12,27], health problems [28,29], and sustainability studies considering social issues [11,12]; the United Kingdom, the United States, and Canada pay more attention to such issues, and showed strong concerns about the environment and health. To the best of our knowledge, the gas consumption research in China needs to be further expanded. The gas consumption in the electricity generation, industry, residential, and commercial sectors also has an unignorable impact on energy structure optimization and environmental benefits compared with coal consumption; Chen Y. et al. [20] and Chang Y. et al. [22] have mentioned these benefits. From the demand-driven aspect, this paper plans to answer the environmental impact question from the consumption side. Studies on the current gas consumption in China mainly focus on top-down analysis and the use of the computable general equilibrium (CGE) model to study the impact of natural gas consumption on the economy [30] and carbon emissions [31]. Nonetheless, the gas consumption description in CGE is at the sectoral level and could not reflect the influence of technology improvement. Therefore, this study plans to improve the gas consumption description further on the basis of the bottom-up model, with gas consumption calculated in consideration of residential heating and cooking, road transport, and industry material and combustion.
Third, the shale gas development will certainly lead to climate risk, such as methane leakage. The United States, the United Kingdom, and Canada mainly use baseline monitoring methods based on typical shale gas regions [32,33] combined with some predictive models [34] to conduct such studies, in addition, there are also studies on ozone [35] and hydrocarbons [36]. Based on these studies using actual observational data, methane emissions are indeed a climate risk worthy of attention. On the other hand, in China, some scholars have gained some enlightenment based on the US methane emission measures [37] but did not expand quantitative research based on specific data, in most environmental benefit studies [20,38], the consideration of methane leakage is limited, only mentioned in small amounts in research. Thus, considering the above two aspects, this study adds the methane leakage and climate risk of shale gas in China to the comprehensive environmental cobenefit analysis.
In addition, although shale gas may generate methane risks, some studies on different gas supply approaches can provide inspiration for methane treatment. For example, [39] used life cycle assessment methods to evaluate the carbon footprint of flue gas treatment, and proposed a new method for flue gas treatment; there are also some studies that have verified that wastewater treatment can synthesize natural gas [40], and introduced the use of carbon dioxide as a carbon source to produce energy storage media to solve solar energy-related problems [41]. The methane emitted from shale gas can also be recycled and utilized through related technologies to synthesize useful gases, etc.
What’s more, we noticed that the use of shale gas will be challenged in other ways [42]. Including the social influence and public attitude [11,43,44], shale gas extraction, recovery and reuse technology [45,46,47,48,49,50], government subsidy pressure [51,52], and so on. At the social impact level, the study of Cooper J et al. [11] in the United Kingdom shows that the use of shale gas can bring employment opportunities and financial benefits to local communities, but it needs to overcome social barriers such as low public support. Actually, public opposition is a worldwide problem [42], and shale gas extraction in densely populated areas (such as northern England) and more remote “primitive” environments (such as Poland and Bolivia) is prone to cause public opposition; Leaders and residents in the southern United States [43] maintain somewhat paradoxical perceptions with respect to shale energy development. While in Weiyuan County, China [44], nearly half of the people were found to support relevant policies, a very small number completely oppose it. In terms of shale gas extraction, recovery and reuse technology, the problem that has always been explored is how to determine the potential and limitations of shale gas [46,47,48] through various technologies, and improve shale gas recovery rate by carbon dioxide injection technology [49] and heating treatment [50]. In addition, there are concerns about government subsidies for shale gas use in China; Liu J. et al. [51] and Bai Y. et al. [52] showed that shale gas development needs subsidies in the early stages, and fiscal subsidies are effective incentives for shale gas investment. So, while shale gas brings benefits, it will also face challenges. On the whole, there are more positive effects, and the negative impacts can be solved through technological advancement and policy norms with the passage of time. These international research conclusions can provide references for the promotion and use of shale gas in China.
Lastly, given that there are few comprehensive studies on China’s shale gas development, does that mean the shale gas in China is not a good research object? The answer is “No.” The future use of shale gas in China has great potential [53,54,55,56,57], many scholars have conducted research on shale gas potential areas such as Sichuan and Chongqing. In the long run, shale gas will perform well and there is more room for improvement [21,58]. Some studies believe that the shale gas industry in Chongqing is more sustainable than that in Sichuan [59]. A study has also predicted that shale gas, even under the reference (REF) scenario, will start to play a role in the power system after 2025, and the main application areas in the technical breakthrough scenario will be East and North China [23]. Based on the reality in China, according to relevant policy information [60,61,62,63], the distribution of China’s shale gas resources is shown in Figure 1. China’s shale gas resources are unevenly distributed, mainly distributed in Sichuan Province, Xinjiang Wuer Autonomous Region, Chongqing City, Guizhou Province, Hubei Province, Hunan Province, and Shaanxi Province; Guizhou Province and Yunnan Province are potential areas of shale gas resources; and the recoverable shale gas resources in the Yangtze River Economic Zone account for more than 60% [63]. Compared with North America and other regions with rich shale gas resources, although China has relatively small resources, the potential for future development cannot be ignored. Shale gas is widely distributed in various geological periods in China [64]. Its reserves continue to increase, and the proven rate is low [65]. The 3500 m shale gas exploration technology will be improved and surpassed [66]. From the 14th Five-Year Plan, the Chinese government will vigorously promote the development of shale gas and strive to increase shale gas production in 2030. By 2035, the proportion of shale gas in China’s natural gas production will increase from less than 1/10 to about 1/3 [67]; natural gas dependence on foreign countries exceeded 40% in 2019 [68], so the development of shale gas can undoubtedly help reduce external dependence and ensure energy security. Further, it can be seen from Figure 1 that the distribution of shale gas is relatively concentrated, which is convenient for mining and quantitative production, but this will also make the regional air pollution and methane impact more prominent. Therefore, this article needs to conduct a comprehensive analysis of China’s shale gas topics that lack comprehensive research around these issues.
The remainder of this paper is organized as follows. Section 2 is the methodology design of this article, including model description and scenario setting. Section 3 discusses the impact of shale gas development on the improvement of energy structure. Section 4 evaluates the positive environmental cobenefit for local pollutant reduction and the negative impacts of methane leakage and climate risk. In Section 5, the main conclusions and discussions are provided.

2. Methodology

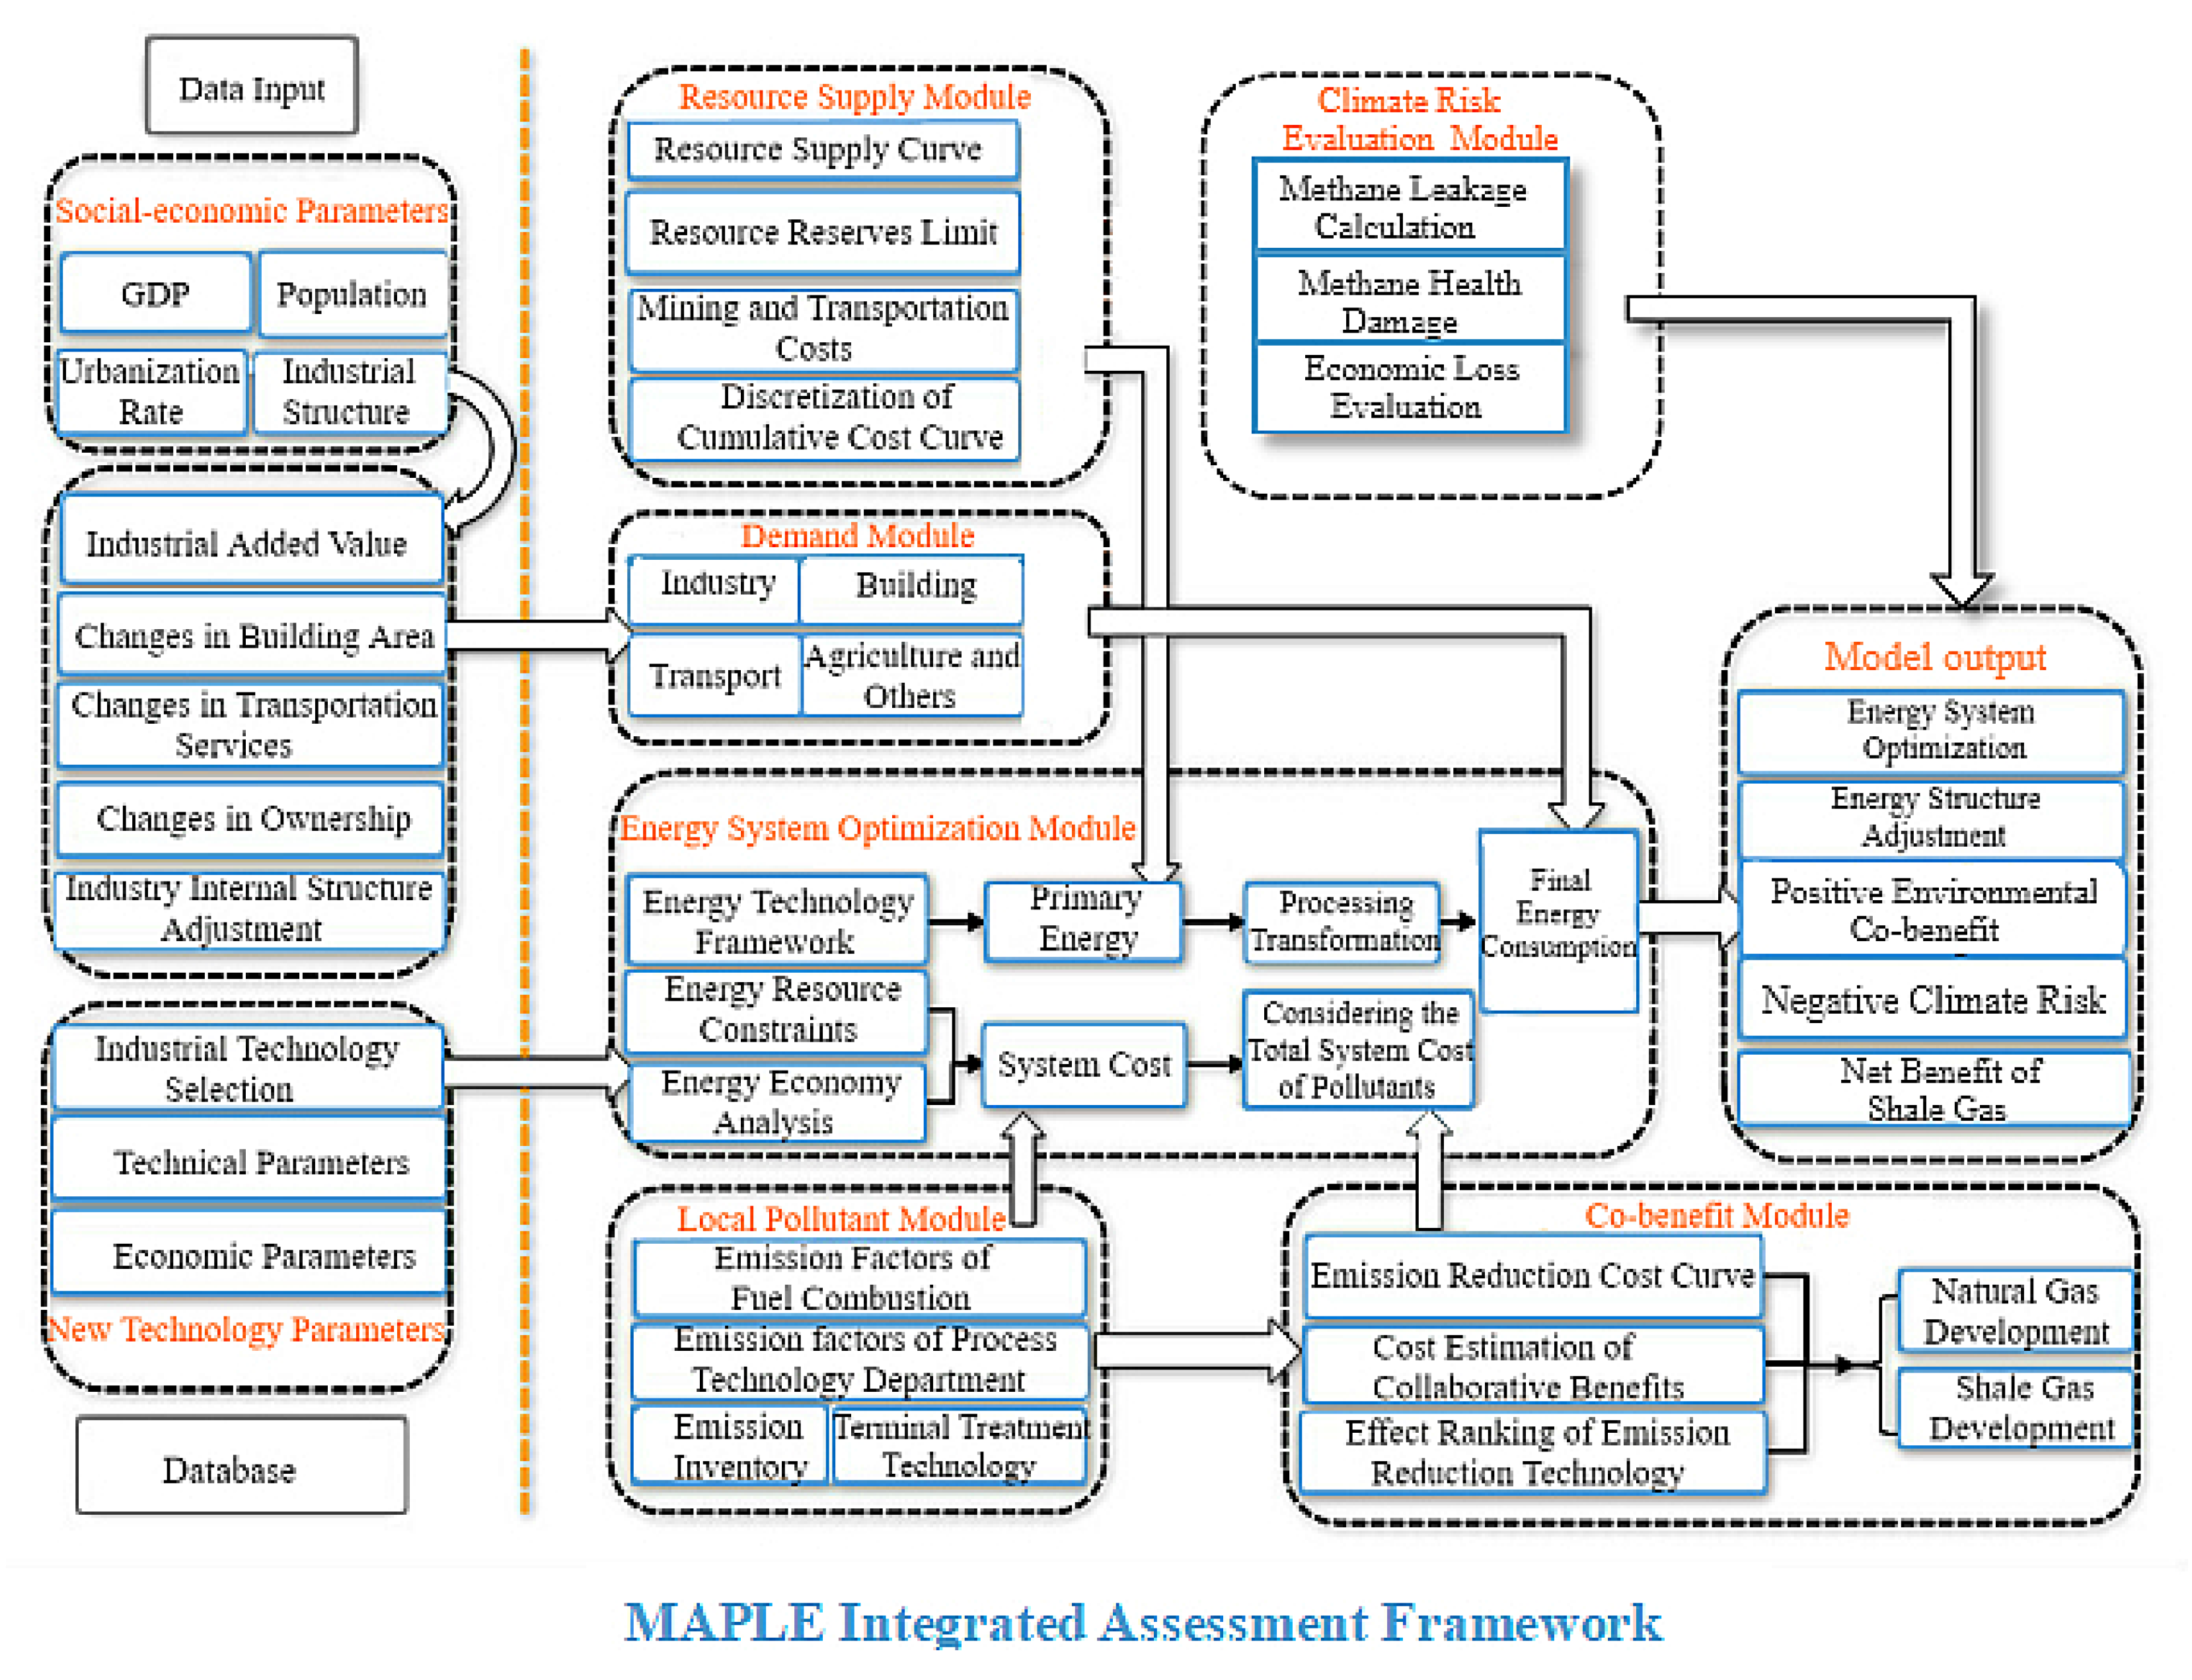
2.1. Model Description

Most of China’s research focuses on greenhouse gas emissions throughout the life cycle [20,22,23,24,25], comparison of energy substitution [20,21,22], and economic benefits [21,26]. Most of these studies have shown the advantages of shale gas from the perspective of energy substitution; at the same time, they also show that the economic benefits of shale gas are not optimistic, and there are still different opinions on its environmental emission reduction effects. So, we will discuss these issues further. At the same time, we found that the existing studies lack air quality models for atmospheric research and pollutant emission coefficients based on technology for nationwide studies. Thus, this paper aims to focus on the atmospheric environmental cobenefit based on emission coefficient linked at the technological level.
The analysis is based on the China-Multi-pollutant Abatement Planning and Long-term benefit Evaluation (China-MAPLE) model. It is a technology-rich model based on the Reference Energy System. The MAPLE model elucidates the full processes, including mining, processing, energy conversion and distribution, and final energy consumption, in the energy system. The model also describes technological improvement, the complex internal relations among processes, and the external constraints of the energy system.
The main frame structure of the model is shown in Figure 2. The core modules of the model are energy system analysis and pollutant emission modules. The resource supply module provides a resource supply curve based on the distribution, import, and export of major resources in the energy system analysis module. The final energy demand prediction module predicts the future energy service demand with exogenous economic parameters and assumptions. The resource supply module is composed of resource supply curve, resource reverse limit, and production costs. The demand module establishes the main influencing factors by departments and inputs the demand of final energy consumption into the energy system optimization module. Then, the system cost is provided for the energy system optimization module through the calibration of major pollutant emissions and technology composition in the local pollutant module. The cobenefit module is based on the pollutant module, adding the cost of emission reduction to determine the total system cost of pollutants. Meanwhile, the climate risk evaluation module is added to calculate the methane leakage and its damage to human health and economic development during the development of shale gas. The model output is determined collectively with the climate risk evaluation and energy system optimization modules. In accordance with the scenario design or emission constraints, the model calculates and selects the optimal technology combination and fuel consumption in the future in medium and long term to determine the specific role of shale gas development in energy system optimization and structure adjustment. The model also comprehensively considers the positive environmental cobenefit and negative climate risk and eventually obtains the net benefit of shale gas development for the environment.
The objective function is to minimize the total cost of the energy system under the conditions of meeting the given demand and constraints. The costs include investment and dismantling costs, the fixed and variable costs of operation and maintenance, the costs of energy extraction and import, export earnings, distribution costs, taxes, and subsidies. The objective function of the model also includes the residual value of assets and the welfare loss caused by demand reduction. Formulas (1) and (2) are the objective functions of the model.
V A R _ O B J ( z ) = r R E G R E G _ O B J ( z , r )
R E G _ O B J ( z , r ) = y Y ( 1 + d r , y ) T Y y × A C ( r , y ) R V A ( z , r )
where NPV represents the net present value of the system, and d r , y is the discount rate. TY represents the target year of discount, Y represents the time period, R refers to regions, AC(r,y) is the annual operation cost of region r in year y, and RVA is the residual value of assets.
The decision variables of the model are the variables that need to be solved by the model. These variables can refer to the parameters of energy extraction, conversion, and utilization processes in the energy system, as well as the activity levels of energy carriers and emissions. They are the basis for calculating the objective function and constraint conditions. Table 1 lists the main decision variables and explanations. The decision variables of this article are OBJ(y0), D ( r , t , d ) , N C A P ( r , v , p ) , C A P ( r , v , t , p ) , C A P T ( r , v , t , p , s ) , A C T ( r , v , t , p , s ) , F L O W ( r , v , t , p , c , s ) , S I N ( r , v , t , p , c , s ) / S O U T ( r , v , t , p , c , s ) , T R A D E ( r , t , p , c , s , i m p ) , T R A D E ( r , t , p , c , s , exp ) . These decision variables are directly related to y0, r, t, d, v, p, s, c, imp, exp, and other parameters, where y0 is the beginning of the period, r is region, t is period, d is demand, v is period, p is new technology, s is stage, c is commodities, imp denotes import, exp denotes export. These variables and parameters have been described in detail in the model, including not only the total sstem, but also the description at the sectoral level, and the description at the sub-sectoral level. The sector takes into account all sectors and technologies that consume natural gas, such as industrial heat consumption, road traffic and residential heating, and so on.

2.2. Supply Curve

This study introduces a resource supply curve. The main resources contain nonrenewable resources, such as coal, oil, and natural gas, and renewable resources, such as hydropower, wind power, and solar power resources. The research considers different sources of resources (domestic production and import and export sources), diverse production areas based on domestic production resources (such as North, East, Northeast, Central South, Southeast, and West China), and the supply of resources under different production capacities and costs. For the bottom-up energy optimization model, the price gradient of resource supply will directly affect the technology selection and then make the optimized technology structure of the energy system more reasonable than before.
The following are the basic principles for the endogenous price of resource supply: 1) the order of use of resources is strictly in accordance with the level of cost; 2) if the price exceeds the cost, then the resource will be completely exhausted. That is, from the exploitation of resources, the deposit will be exploited until it is exhausted. Exceptions include adequately large storage. Therefore, Formulas (3)–(5) are used in this study.
Z t = i t 1 q i
C ( q , z ) = min x i i = 1 J c i × x i
and
x i R i ,   i   there   is   q = i = 1 J x i
where Z t is the cumulative mining amount based on time, q i is the total mining amount of mineral storage i, C ( q , z ) is the cost function, x i is the currently mined amount of mineral storage i, c i is the unit mining cost of mineral storage i, and R i is the total remaining volume of mineral storage i.
The short-term cumulative cost curve will show an upward trend with the increase in the extraction volume, i.e., the extraction cost will gradually increase, the intercept of the cost function will increase, and the unit extraction cost of the remaining reserves will continue to increase with the extraction process. High-quality mineral deposits with low mining costs per unit of reserves are often preferentially mined. With the development of the mining process, other reserves are gradually used. In consideration of the increase in the amount of new investment, the slope of the unit mining cost curve will decrease. In the long run, with the reduction in remaining mineral reserves, the difficulty and cost of mining will increase. Hence, when the mining reaches a certain degree, the unit mining cost will increase rapidly.

2.3. Scenario Design of Shale Gas Development

The medium- and long-term development goals of shale gas development and utilization in China are that during “the 14th Five-Year Plan” and “the 15th Five-Year Plan” periods, China’s shale gas industry will accelerate its development. The scenario considers the potential of marine development and shale gas breakthroughs within continental and marine–land transitional facies, with a number of large-scale shale gas fields newly discovered. We assume that an effective scale development will be achieved, and the shale gas production will reach 80–100 billion cubic meters by 2030. Detailed information on the production forecast of China’s natural gas and shale gas is indicated in Figure 3.
BP Energy Outlook (2035) [69] predicts that China’s shale gas production will maintain an average annual growth rate of 33% from 2025 to 2035 and will account for 13% of the global shale gas increase by 2035. Therefore, from the preceding analysis, three scenarios based on the current situation (Table 2), namely, reference (REF), shale gas moderate development (SGMD), and shale gas ambitious development (SGAD), are selected for analysis. Under the SGMD scenario, shale gas production is expected to reach 10.833 million cubic meters in 2030, with 40% share. In the SGAD scenario, shale gas production will reach 130 million cubic meters in 2030, accounting for 43%.

3. Results on Energy System Optimization

3.1. Final Energy Demands

Figure 4 and Figure 5, respectively, show the final energy consumption and the final energy consumption structure in the main years in the three cases. The unit of the ordinate in Figure 4 is million ton of standard coal equivalent (tce). For the final energy consumption, coal consumption will continue to account for the largest share under the baseline scenario, that is, at 42% in 2025 and 38% in 2030, followed by oil and electricity consumption. In 2030, natural gas (excluding shale gas) consumption will continue to rise, reaching 25 million tons of standard coal, accounting for 4% of the final energy consumption; the shale gas consumption will increase to 57 million tons, with 1% share.
Under the SGMD scenario, coal, oil products, and electricity will remain the three largest parts of the final energy consumption structure for a long period of time in the future, and coal, oil, and electricity will account for 37%, 28%, and 21%, respectively, in 2030. The consumption of natural gas (excluding shale gas) will show an upward trend in total and proportion, reaching 274 million tons of standard coal by 2030, with 6% share. Shale gas consumption is forecast to reach 51 million tons of standard coal in 2025 and 76 million tons of standard coal in 2030, accounting for 1% and 2% of the final energy consumption, respectively.
In the SGAD scenario, coal consumption will still be the largest by 2025 and 2030, but the proportion of final energy consumption will drop to 41% and 36%, respectively, followed by the consumption of oil products and electricity. Natural gas (excluding shale gas) consumption will achieve a large increase in this scenario; it is expected to reach 329 million tons of standard coal in 2030, accounting for 8%. Shale gas consumption will also reach 91 million tons of standard coal by 2030, with 2% share.

3.2. Primary Energy Demand

In the baseline scenario, the total consumption of primary energy can reach 5.67 and 5.90 billion tons of standard coal in 2025 and 2030, respectively. Among them, coal and conventional natural gas will be the two largest parts of primary energy consumption, accounting for 46.34% and 22.48% in 2030, respectively. They are followed by the consumption of nonfossil energy and oil. Shale gas will also become an important part of the primary energy consumption structure, with the consumption expected to reach 253 and 367 million tons of standard coal in 2025 and 2030, accounting for 4.47% and 6.22%, respectively.
The total primary energy depletion in SGMD is 2.23 billion tons of standard coal less than that in 2025 in the REF scenario. In 2030, coal will still account for the largest share of primary energy consumption at 41.19%; conventional natural gas is second only to coal at 20.80%; nonfossil energy and oil consumption are expected to account for 24.41% and 7.85%, respectively. Shale gas consumption could come up to 344 million tons of standard coal with a share achieving 5.75%.
Under the SGAD scenario, 5.52 and 5.77 billion tons of primary energy of standard coal will be consumed in 2025 and 2030, respectively. Coal still accounts for the largest proportion of primary energy consumption, but the proportion will drop to 36.33% by 2030. Conventional natural gas and nonfossil energy will occupy a more important position. In 2030, the consumption of conventional natural gas is expected to reach 1.46 billion tons of standard coal, with 25.35% share; nonfossil energy consumption is forecast to reach 1.421 billion tons of standard coal, accounting for 24.63%. Petroleum will account for 6.45% and 6.68% of primary energy consumption in 2025 and 2030, respectively. Shale gas consumption is going to exceed oil in 2030, accounting for 7.01% of primary energy consumption. Details of the primary energy consumption and consumption structure under the three scenarios are presented in Figure 6 and Figure 7, respectively.

3.3. Power Generation Structure

The power generation and power generation structure in the main years in the three cases are shown in Figure 8 and Figure 9, respectively. Total power generation will reach 7758.11 TWh by 2025 under the REF scenario, with coal power accounting for the largest share of the power generation structure at 50.37%, followed by hydropower and wind power, which account for 18.31% and 15.74%, respectively. Nuclear power, gas power, and solar power will account for 8.52%, 5.25%, and 1.75%, respectively, and the remainder will be oil power, biomass power, tidal power, and other energy power, each reaching less than 1% of total power generation. By 2030, the total amount of coal-fired power will increase to 9027.86 TWh, but its share in the power generation structure will drop to 48.36%; hydropower will also decrease to 16.95%, whereas wind power is forecast to increase to 17.43%. The proportions of nuclear power, gas power, and solar power in the power generation structure will increase by 9.32%, 6.13%, and 1.80%, respectively.
In the SGMD scenario, the total power generation is expected to be 7890.56 and 8690.53 TWh in 2025 and 2030, respectively. Coal power, which is the largest source for power generation, is expected to reach 42.47% and 37.54% of the power generation structure in 2025 and 2030, respectively. It is followed by hydropower and wind power, which will account for 18.14% and 15.40% of the power generation structure, respectively, in 2030. Next is nuclear power, which will account for 8.34% of the total power generation in 2030. Gas power will be less than solar power, with a value of 635.65 TWh in 2030, accounting for 7.31%. Solar power is expected to account for 12.93% in 2030. The generation of biomass, oil, tidal, and other energy power will account for less than 1% of the power generation structure.
The total power generation in SGAD will have an increase of 4.07% and 0.31% compared with that in SGMD in 2025 and 2030, respectively. Coal power is going to account for the largest proportion of the power generation structure in 2030 at 36.28%, a remarkable drop from the 43.32% share in 2025. It is followed by hydropower and wind power. Hydropower is forecast to account for 18.14% in 2025 and will decline to 15.91% in 2030. Wind power is going to attain 12.67% in 2025 and rise to 14.74% in 2030. Gas and solar power generation will have great development, with anticipated portions of 12.76% and 12.63% of the power generation structure, respectively. Nuclear power is estimated to be 7.31% in 2030. The generation of other types of energy will still have a very small share.

3.4. Carbon Emissions

Under the REF scenario, carbon emissions will continue to rise, reaching 11.22 billion tons in 2025 and 11.184 billion tons in 2030. In the SGMD scenario, the margin of carbon emission increase is predicted to be small, achieving 10.54 and 10.58 billion tons in 2025 and 2030, respectively. Under the SGAD scenario, carbon emissions will first increase and then decrease and are expected to account for 10.34 and 9.94 billion tons in 2025 and 2030, respectively. The peak will be reached before 2030.

4. Key Local Pollutant Emissions and Environmental Health Impacts

4.1. Emissions of SO2 and NOX

The details of SO2 and NOx emissions in major years are shown in Figure 10 (the unit of the vertical axis in the figure is kiloton (kt). Less SO2 in the SGMD scenario will be discharged compared with that in the REF scenario. The emissions will be reduced by 3.49 and 5.77 million tons in 2025 and 2030, respectively, with the extent of 12.20% and 18.10%, respectively. Of them, 26.13 million tons will be discharged in 2030. The SGAD scenario has a higher emission reduction effect than the two other scenarios. The emission reduction will be increased by 5.38 and 6.91 million tons in 2025 and 2030, respectively. Compared with the general situation, the emission will be decreased by 21.50% and 26.40%. The emission will be 19.22 million tons in 2030. In terms of sectoral emission reduction, the SO2 emission reduction effect of the industrial sector is more significant than that of the residential sector. The transportation sector is not the main emission sector of SO2. Compared with the REF scenario, the SGMD scenario indicates that the SO2 emission reduction of the industrial sector will be 3.39 million tons in 2025 and 5.52 million tons in 2030. Under the SGAD scenario, the SO2 emission reduction of the industrial sector will be 5.30 million tons more than that in the general scenario in 2025 and 6.81 million tons in 2030. Given that the industrial sector emits more SO2 than the transportation and residential sectors, the effect of shale gas development on SO2 emission reduction is the best in the industrial sector. Therefore, we conclude that the more radical the shale gas development is, the more obvious the effect of SO2 emission reduction will be. The SO2 emission reduction effect of shale gas development varies for different departments.
At all levels, the SGMD scenario emits less NOx than the REF scenario; the emissions will be reduced by 4.26 and 6.78 million tons in 2025 and 2030, respectively, accounting for 16.9% and 23.7%, respectively. In 2030, the emission will be 21.78 million tons. A higher emission reduction effect will be shown in the SGAD scenario. On the basis of the SGMD scenario, emissions in the SGAD scenario will be reduced by 2.41 and 3.52 million tons in 2025 and 2030, respectively, with decreases of 11.50% and 16.20%, respectively. The emission will be 18.26 million tons in 2030. From the point of view of sector, the industrial sector will make a more remarkable NOx emission reduction effect compared with the transport and residential sectors. Compared with the REF scenario, the SGMD scenario will induce a reduction in the NOx emission of the industrial sector by 1.90 million tons in 2025 and 3.07 million tons in 2030. Under the SGAD scenario, the industrial sector will emit 2.16 million tons of NOx less than that of the SGMD scenario in 2025 and 2.85 million tons in 2030.

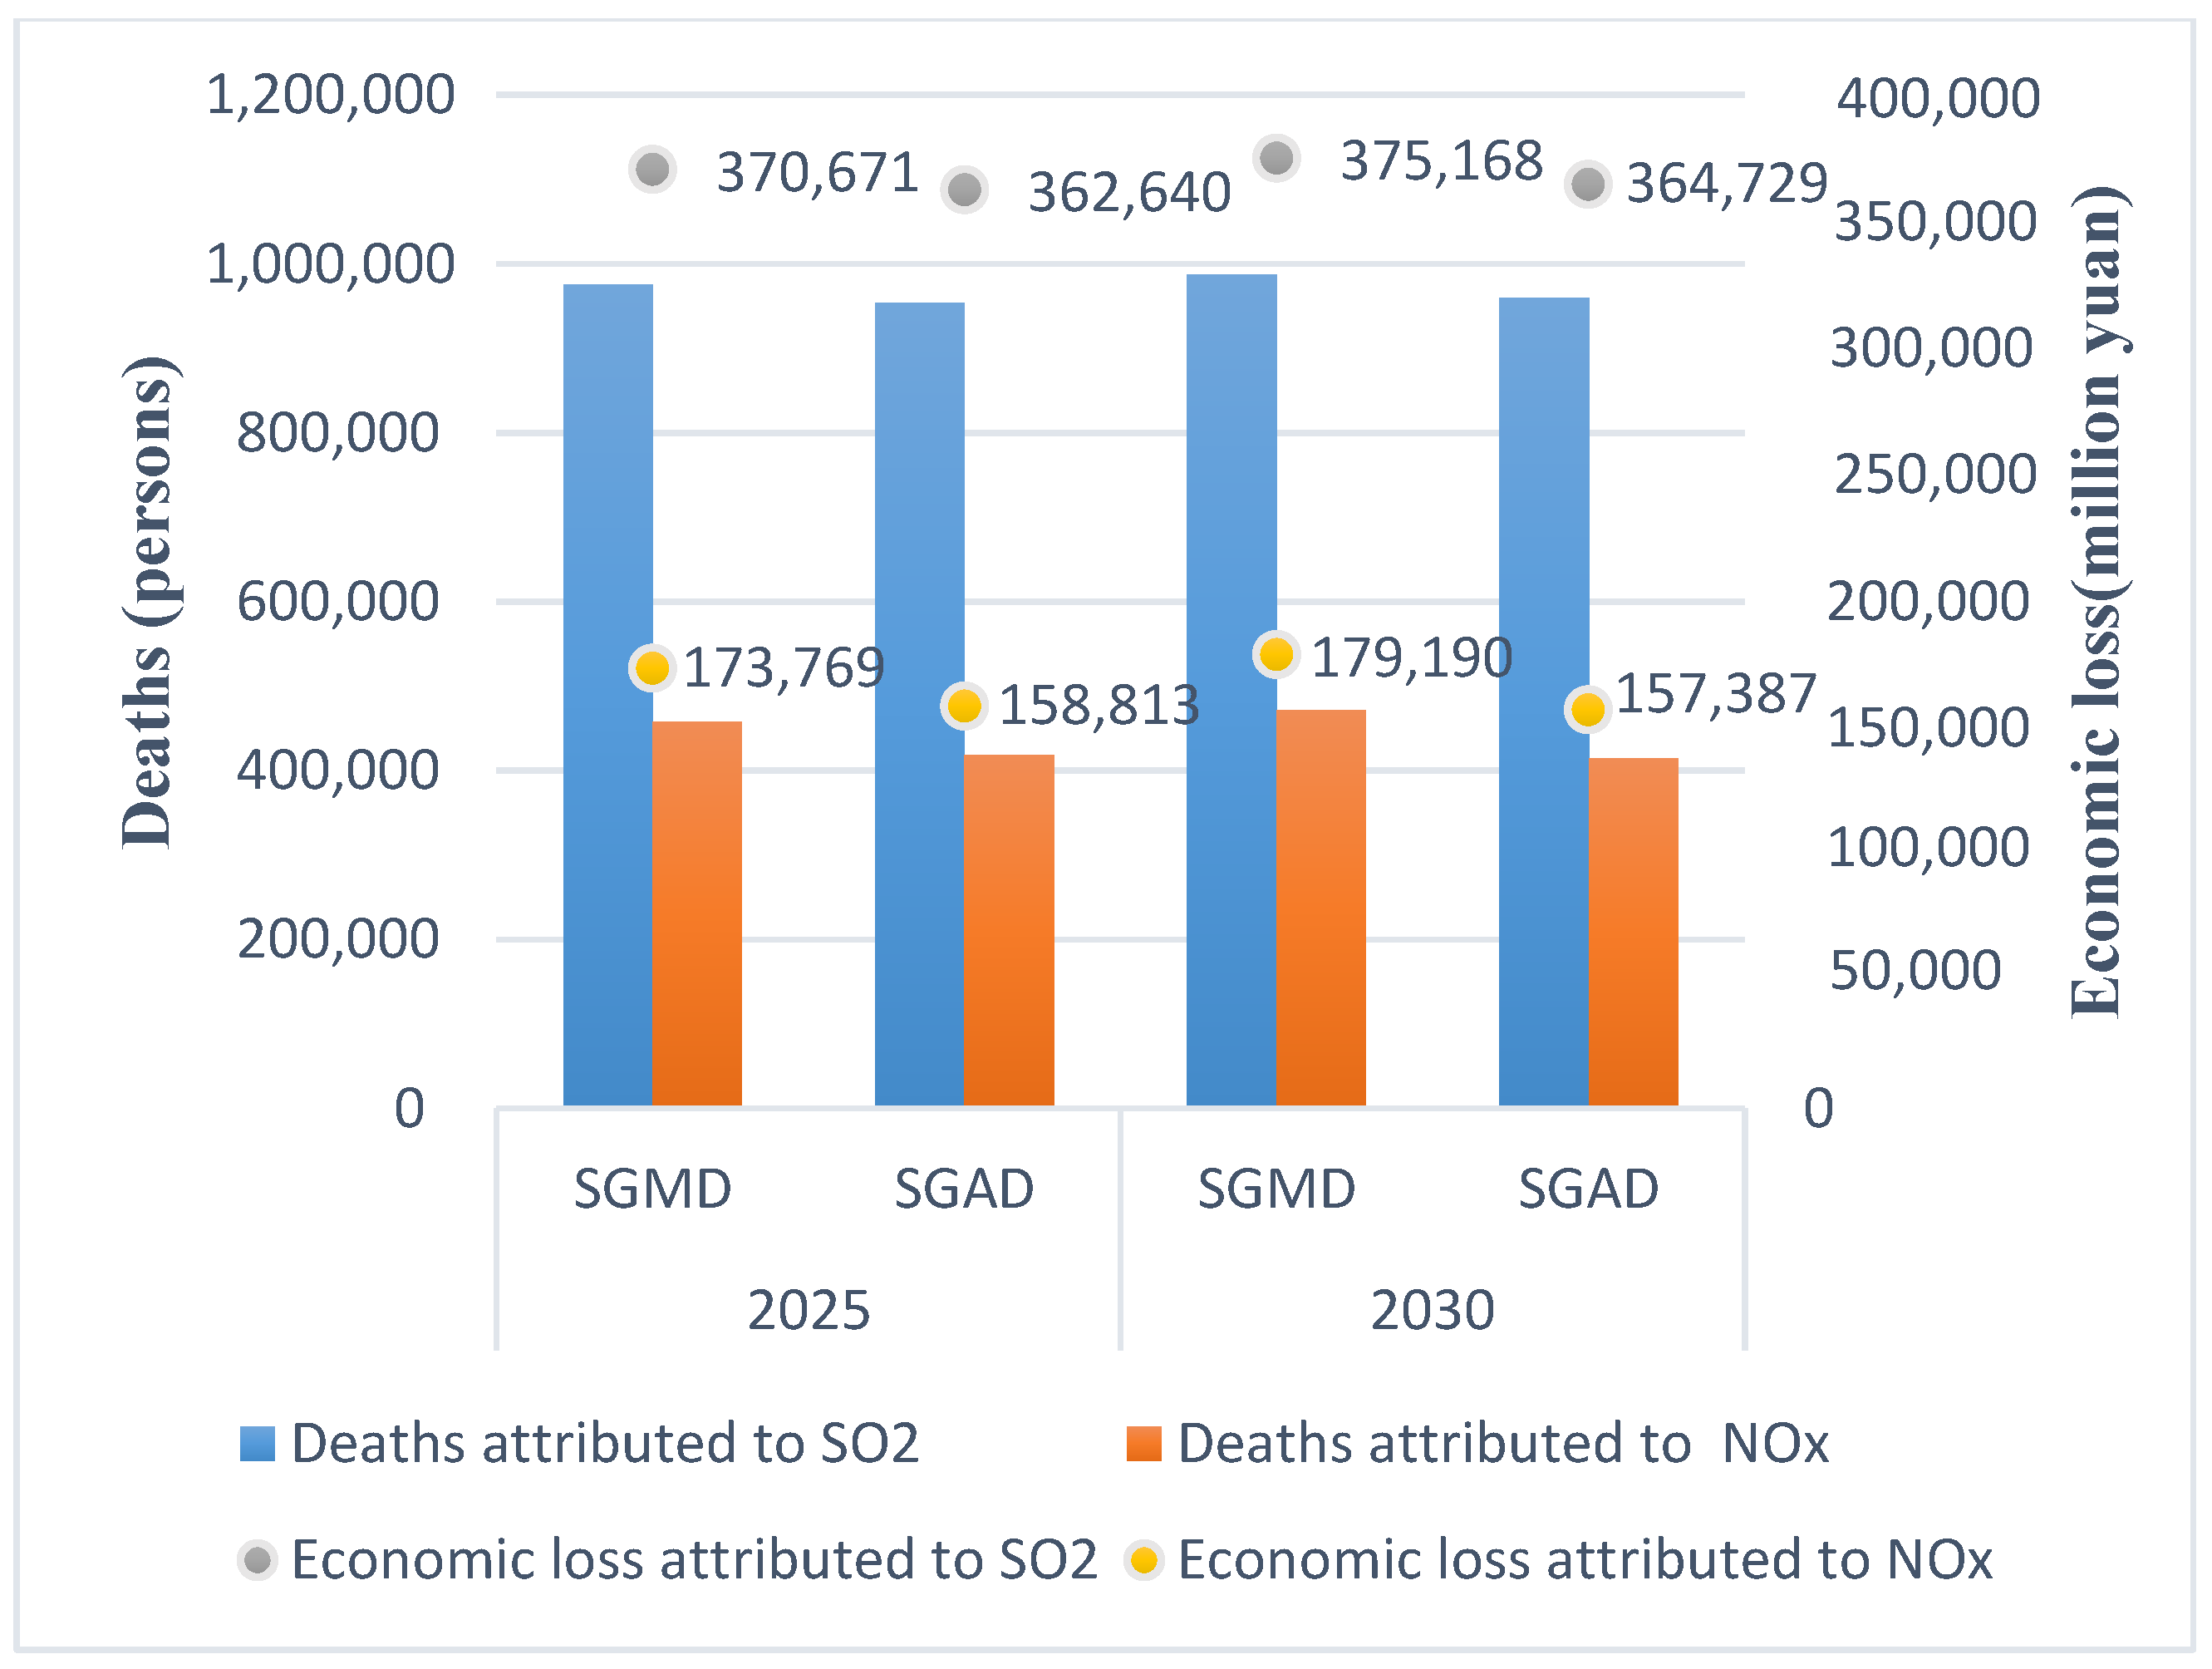
4.2. Environmental Health Impacts of SO2 and NOX

The development of shale gas can reduce the number of deaths due to NOx and SO2 (Figure 11). In the context of the radical development of shale gas, the coal replacement effect of shale gas is prominently reflected. Compared with the general scenario, it produces less SO2 and NOx, resulting in reductions of 27,472 and 57,377 deaths in 2030, respectively.
Simultaneously, as the shale gas development reduces the number of deaths attributed to SO2 and NOx, the economic losses caused by SO2 and NOx will also decrease, and economic losses will be avoided in SGAD. The economic losses caused by SO2 and NOx in SGAD will be reduced by 3.00% and 12.00%, respectively, in 2030, compared with those in SGMD. The calculation of the main parameters of SO2 and NOx and the exposure response coefficient are from the research results of Holnicki P. et al. (2018), Chen D. et al. (2014), and Cao et al. (2011).

4.3. Methane Leakage

Regardless of the calculation method, the aggressive development of shale gas results in an increase of approximately 20% in methane emissions compared with the SGMD scenario (Table 3). The calculated methane emissions under the calculation methods adopted by Zhu S. [70], NDRC/UNDP [71], and IPCC 2006 guidelines (small) [72] are relatively close. The SGAD methane emissions in 2030 will be in the range of 400–700 kt, and their respective gaps will be nearly 100 kt. The methane emissions calculated in accordance with the IPCC 2006 guidelines (middle) and IPCC 2006 guidelines (large) [72] are much higher than those based on the aforementioned three methods. The emissions under SGAD in 2030 will be 2387.70 and 4084.75 kt.
Different emissions of methane occur at various links in the shale gas development process under diverse accounting methods (Table 4). From the accounting methods of Zhu S. [70] and NDRC/UNDP [71], similar amounts of methane are emitted from the natural gas extraction and transmission links. Most methane emissions are from the natural gas consumption link under the accounting methods of Zhu S. [70] and NDRC/UNDP [71]. In the calculation method of IPCC 2006 [72], the methane emission of natural gas exploitation is much higher than that of other links.

4.4. Environmental Health Impact of Methane

Based on the IPCC [73] fifth assessment report, the obtained GWP (Global Warming Potential) value of methane emission is shown in Table 5.
It can be seen that methane is a powerful greenhouse gas. In 100 years, its global warming potential will be about 28 times that of carbon dioxide. If calculated in 20 years, the warming potential of methane will be more than 80 times that of carbon dioxide. Therefore, under such a high global warming potential, based on the calculation data of shale gas methane leakage in Section 4.3, it can be seen that the environmental impact of shale gas methane leakage is indeed a concern.
The death toll and economic loss caused by methane under different scenarios are shown in Figure 12. Different accounting methods have significantly diverse calculation results for the total number of deaths due to methane emissions. The total number of deaths will be far more than other accounting methods by adopting the IPCC 2006 guidelines (middle) and IPCC 2006 guidelines (large) [72]. For all accounting methods, the number of deaths caused by methane emission in SGAD will be higher than that in SGMD. When the accounting method in the IPCC 2006 guideline [72] is adopted, the death toll in the natural gas exploitation stage is much higher than that in other stages, and the proportion of total deaths is over 73%. Under the accounting method of Zhu S. [70] and NDRC [71], a minimal difference in the distribution of deaths in each stage exists. The methane leakage in the natural gas consumption link accounts for the highest proportion of total deaths under the accounting method of Zhu S. [70], and the methane leakage in the natural gas transmission link accounts for the highest proportion of total deaths under the accounting method of NDRC [71].
The economic losses of methane leakage vary greatly under different accounting methods. The economic losses caused by methane emissions calculated using the IPCC 2006 guidelines (middle) and IPCC 2006 guidelines (large) [72] are much higher than the calculation results of Zhu S. [70], NDRC/UNDP [71], and IPCC 2006 guidelines (small) [72]. Different accounting methods have diverse distributions of economic losses in each natural gas stage. Under the accounting method of IPCC 2006 guidelines [72], the economic loss induced by the natural gas exploitation stage accounts for 80% of the total loss in the entire process, followed by the consumption stage, and, finally, the processing stage. Under the accounting methods of Zhu S. [70] and NDRC/UNDP [71], the proportion of economic losses caused by the four stages is approximately the same, with a small total amount.
The economic losses caused by the development of shale gas in SGAD are more than those in SGMD. Under the accounting methods of Zhu S. [70] and NDRC/UNDP [71], the economic loss in SGAD will be 123.68 and 148.62 million yuan more than that in SGMD in 2030, respectively. Under the accounting methods of IPCC 2006 guidelines (small), IPCC 2006 guidelines (middle), and IPCC 2006 guidelines (large) [72], the economic loss in SGAD will be 196.23, 673.67, and 1144.44 million yuan more than that in SGMD in 2030, respectively.

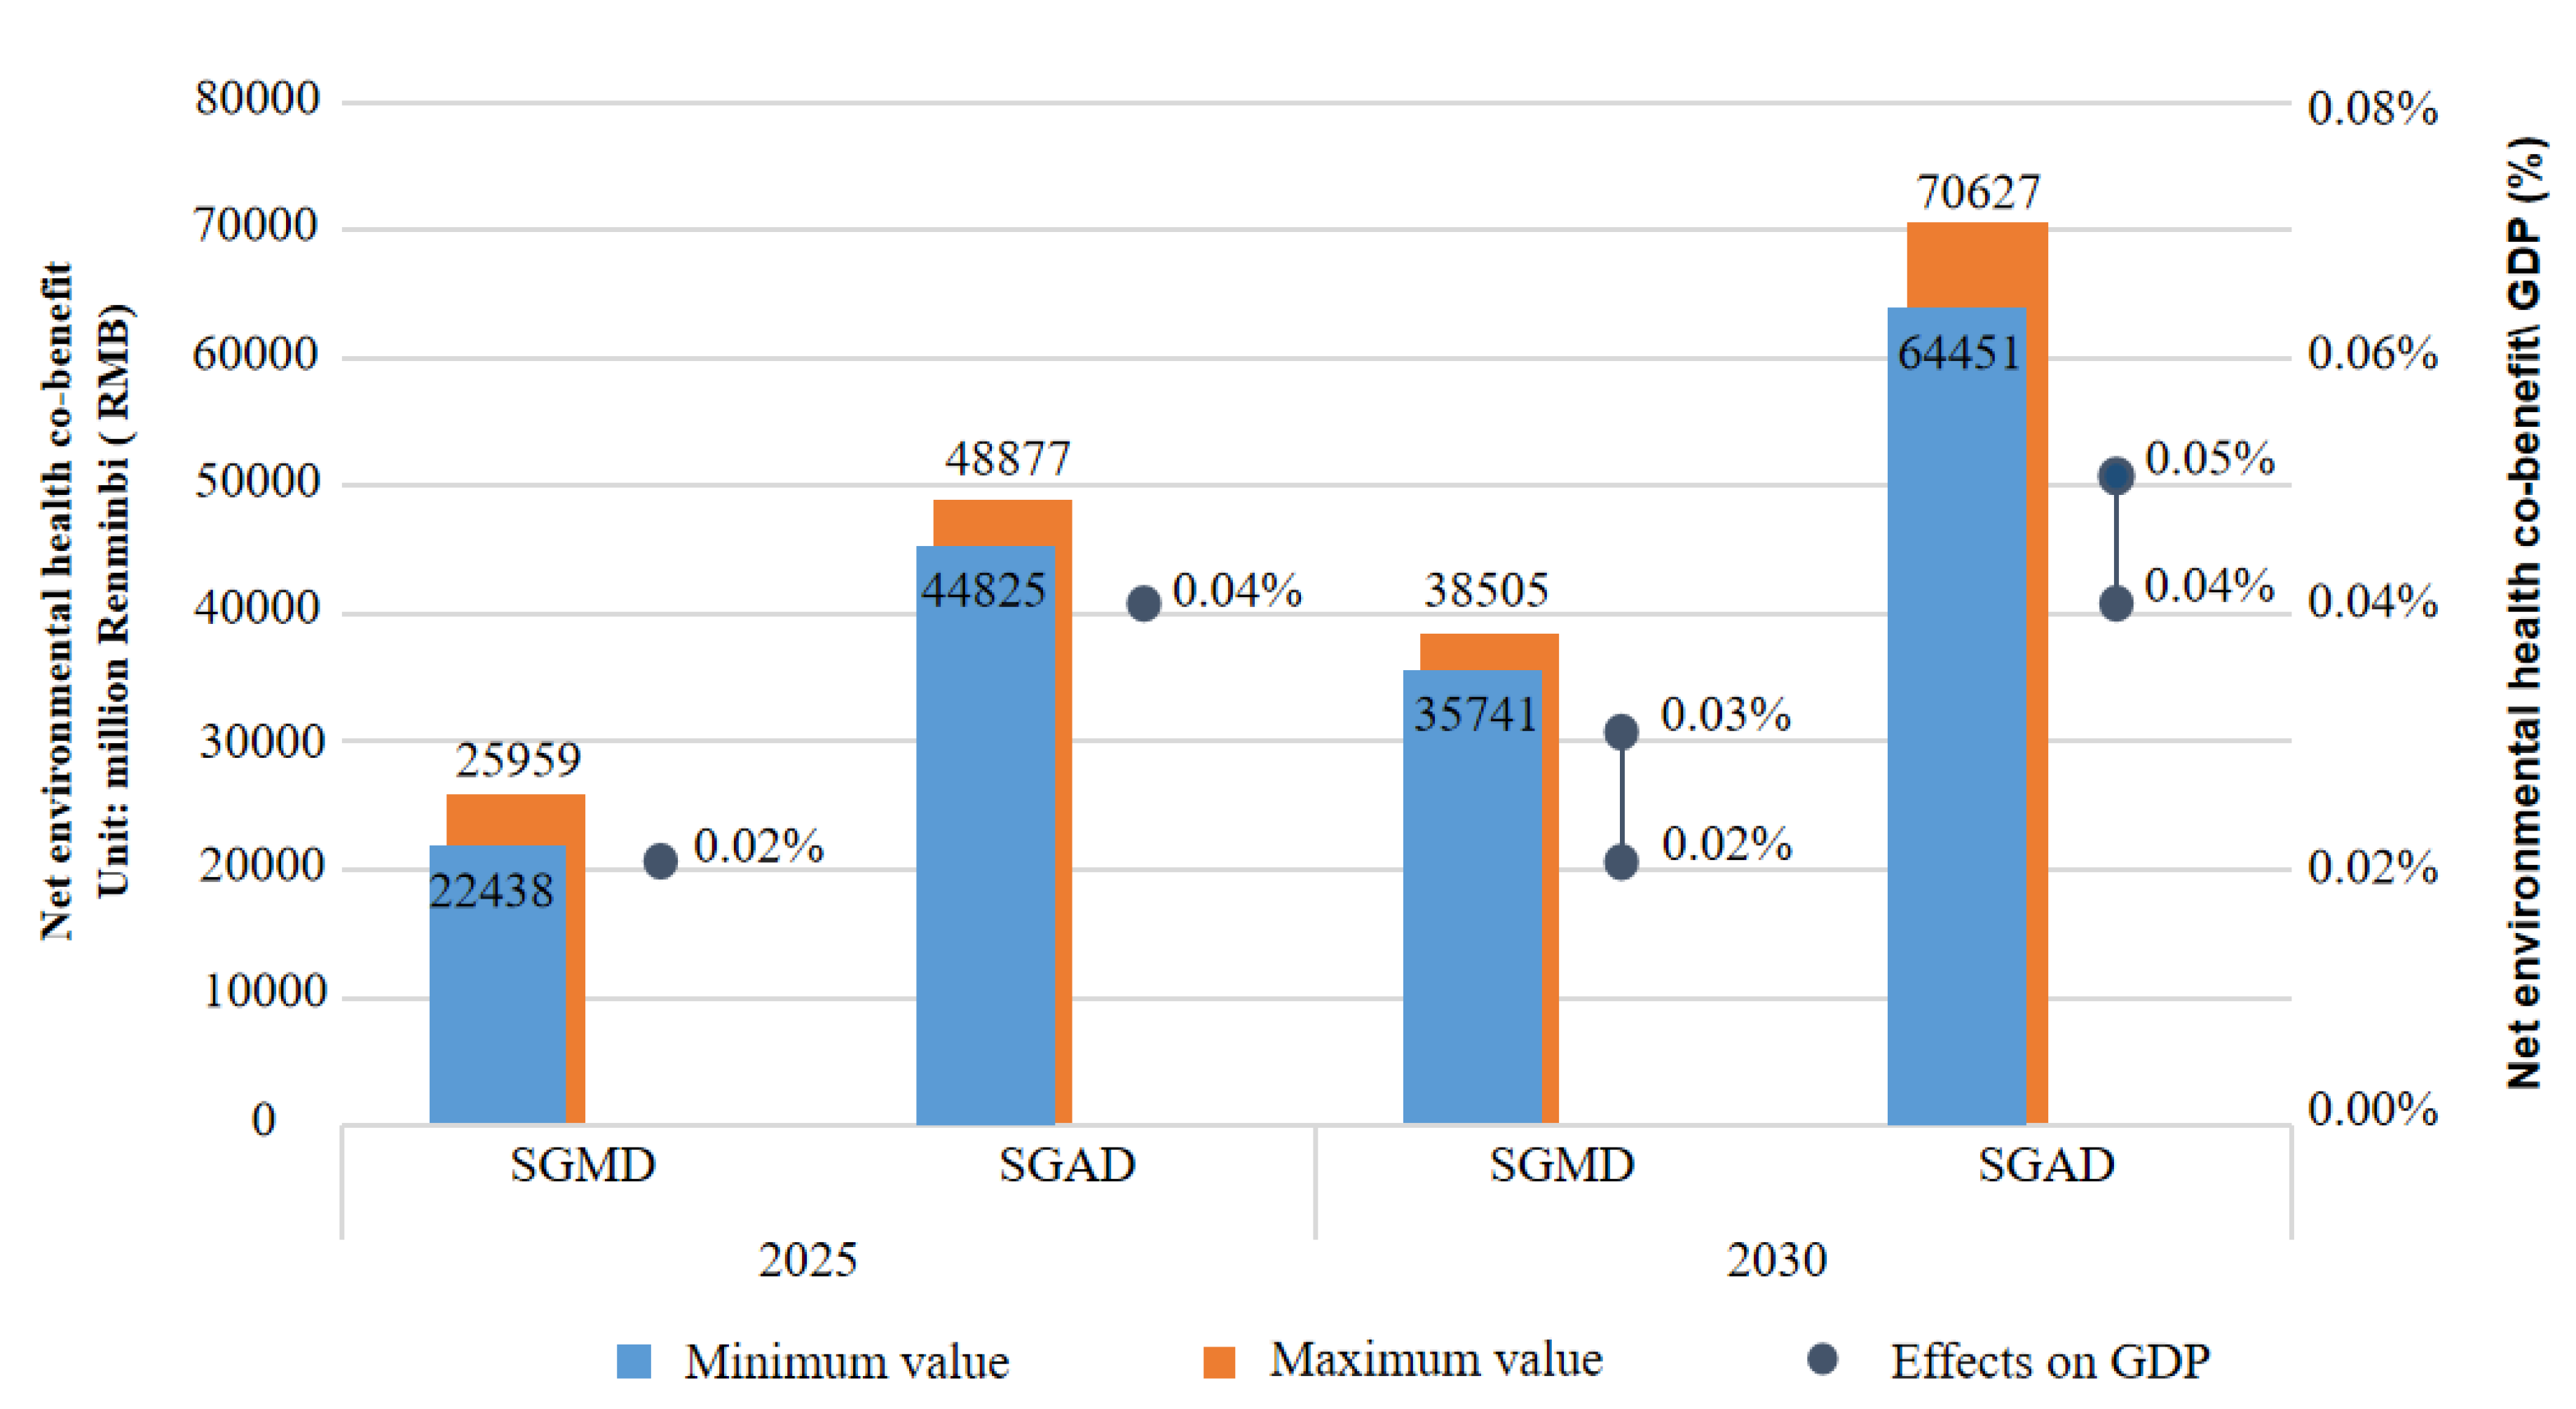
4.5. Economic Loss Avoided

The net environmental health cobenefit of shale gas development under diverse accounting methods in different scenarios is shown in Figure 13, the unit of the vertical axis in the figure is million Renminbi (RMB). The net environmental health cobenefit is composed of the economic losses avoided due to the reduction of SO2 and NOx and the economic losses caused by the increase in methane on average, which shows the overall impact of shale gas development on human health. Regardless of which accounting method it is based on, the net environmental health cobenefit of shale gas development is always positive, which indicates that developing shale gas can help reduce the economic loss caused by air pollutants and has a positive effect on environmental protection and human health. The net environmental health cobenefit is high when the shale gas is developed aggressively and the period of shale gas development is long. The difference in the net environmental health cobenefit of shale gas development under various accounting methods is insignificant. In 2025, the average net environmental health cobenefit in SGAD will be 47.55 billion yuan, accounting for 0.04% of China’s GDP that year, which is 22.73 billion yuan more than that in SGMD. In 2030, the average net environmental health cobenefit in SGAD will reach 68.61 billion yuan, occupying 0.04% of China’s GDP that year, which is 31.79 billion yuan more than that in SGMD.

5. Conclusions and Discussion

China’s domestic shale gas research mainly focuses on four themes: first, the potential of shale gas resources [53,54,55,56,57]; second, shale gas development in consideration of the current technical difficulties and mining costs [46,47,48], focusing on technological innovation; third, the positive influence of shale gas, which focuses on its energy substitution [20,21,22] and carbon reduction [20,22,23,24,25] effects; fourth, the negative impact of shale gas [24,25]. The position of our study in the literature is that we consider all the four aspects and the positive and negative effects, and highlight the atmospheric environmental impact. The main contribution is its comprehensive assessment and further improvement of the methodology for emission reduction evaluation during the consumption process. In addition, the economic loss is evaluated for determining the environmental cobenefit and the climate risk of methane leakage. Water and soil impacts are not in the research scope.
This study provides a clear answer to the question on the net economic cost of shale gas development. It conducts an integrated assessment of shale gas development in China. On the basis of the developed China-MAPLE model, this article explores the impact of shale gas on the improvement of energy structure, the major atmospheric pollutant emission reduction, and its negative climate risk. Shale gas will help reduce the coal proportion to 36.33% in the primary energy consumption in China. This finding is consistent with those of other studies [74]. In consideration of the final energy consumption in residential heating, transport, and industries, coal will be reduced by 36.00% in the total final energy consumption and 36.28% in electricity mix by 2030 in the SGAD scenario. Although shale gas is in a relatively backward position in the proportion of energy consumption, it is still in stable growth and has great potential. Especially in the context of radical development, shale gas will account for 7.01% of the primary energy consumption by 2030.
The utilization of shale gas not only improves the energy structure but also helps promote environmental health. Shale gas development mainly has two types of impacts on environmental health. On the one hand, the coal substitution effect of shale gas development is conducive to reducing the emissions of SO2 and NOx. The total number of deaths in the SGAD scenario decreases by 970,000 persons, and the number of deaths per unit avoided is 0.70 persons/kt of standard coal shale gas. The reduction in deaths due to SO2 and NOx leads to economic loss being avoided, which will be 32.24 billion yuan in SGAD in total less than that in SGMD in 2030. These results provide additional information on economic loss avoided via shale gas development to the current literature.
On the other hand, shale gas development will cause methane leakage and endanger human health. Compared with the SGMD scenario, an increase of 27.07 million tons of methane on average in 2030 is estimated, which would cause 1.20 thousands of deaths (persons) and 457.33 million yuan of economic losses added if shale gas is promoted aggressively. In consideration of the two types of effects of shale gas development on environmental health, the net environmental health cobenefit of pollutants is always positive, demonstrating the positive impact of shale gas utilization on environmental health.
Overall, shale gas development has a positive atmospheric environmental impact in China and will help avoid 0.04% GDP loss in 2030 if promoted aggressively. Combined with China’s abundant shale gas resources, technological innovation, and institutional guarantees, shale gas is expected to have great potential in China and become an important fuel for coal replacement. This article provides the following policy recommendations to promote the development of shale gas in China. On the one hand, a long-term and stable financial subsidy policy should be issued to improve the enthusiasm of shale gas enterprises in exploration and development and increase the national support for the shale gas industry. On the other hand, the management system of shale gas development in China should be improved, and a comprehensive supervision system of shale gas green development should be established. This study is only a rough assessment of the full picture. We should pay close attention to the formulation of relevant emission standards, technical specifications, and other relevant management specifications for the key risk points and regulatory elements of shale gas development.
Furthermore, some developing countries, which have high coal consumption and rich shale gas resources, are trying to use shale gas instead of coal policies for energy transformation. In accordance with the BP Statistical Review of World Energy [75], the coal consumption of India, South Africa, and Poland in 2018 accounted for 55.88%, 70.78%, and 48.00% of total energy consumption, respectively. These countries have formulated a policy for the replacement of coal with shale gas to alleviate the pressure on the environment caused by the energy structure dominated by coal and consider the shale gas resources of their own countries [76,77,78]. As a developing country, China’s shale gas development experience will help these countries improve their encouragement policies for shale gas development and formulate comprehensive and detailed assistance policies for the shale gas industry in terms of tax relief, subsidies, and public calls. This study provides a reference as an integrated assessment in consideration of the positive environmental cobenefits and negative climate risks of the use of shale gas in developing countries. The argument for shale gas is not only based on global arguments on whether the shale gas fuel is clean. Developing countries, especially coal-dominant countries with rich gas resources, should consider the two sides of a coin and focus on the net environmental and economic benefits for their own countries.
To sum up, this research is based on the China-Multi-pollutant Abatement Planning and Long-term benefit Evaluation, a comprehensive evaluation of shale gas resources in terms of energy system optimization, mutual benefit of the atmosphere and methane risk, etc., and it aims to clarify and analyze the challenges and role played by China’s shale gas resources when considering positive cobenefit and negative methane risk. The research gaps and innovations identified in this study are mainly in the following aspects. First, in terms of research ideas, a comprehensive shale gas evaluation study that China currently lacks was carried out. As for the method, we further improved the evaluation method based on the bottom-up model. In terms of conclusions, this study considers all the positive and negative effects of the use of shale gas in China, highlights the atmospheric environmental impact, and finally draws its comprehensive positive impact.
This research filled the gap in shale gas research in China on positive cobenefit and negative methane risk, and answered the three questions raised by the title. First, regarding energy system optimization, in our conclusion, although coal still accounts for the largest share of energy consumption, the use of shale gas can help adjust the energy structure and reduce the future share of coal. Second, in terms of environmental co-benefits, the use of shale gas helps reduce emissions of SO2 and NOX, the number of deaths due to SO2 and NOX, and could help reduce the economic loss by 32.24 billion yuan. Third, we considered the risk of methane; the use of shale gas will increase methane emissions, cause environmental and health concerns, and increase climate risk losses, reaching 457.33 million yuan in 2030. Finally, a comprehensive conclusion can be drawn that the net environmental health cobenefit of shale gas development is positive, estimated to be 0.04% of China’s GDP in 2030. These are the main contributions of our research.
The contribution of our research conclusions can be reflected in many aspects. At present, other related studies in China mainly focus on other air pollutants rather than methane [24,38], a few studies that have evaluated methane indicate that shale gas emits a great amount of greenhouse gases, and the conclusions are still uncertain [25]. In general, there is a lack of comprehensive evaluation of shale gas, and our conclusions are based on a comprehensive analysis of the use of China’s shale gas, which is more reasonable. In China, we have set a goal of carbon neutrality by 2060. Although renewable energy will dominate the entire energy system in 2050, the phasing out of coal in the short term still needs the strong support of natural gas, and then natural gas will be replaced by renewable energy. Therefore, a comprehensive assessment of China’s natural gas, especially shale gas development before 2030, will help clarify China’s energy development path and provide an important reference for the 14th Five-Year Plan. At the same time, it also provides reference for energy transition in other developing countries, as some developing countries are still facing the problem of natural gas development [79,80], and relevant studies in these countries still lack a comprehensive analysis of air quality and methane emissions in addition to CO2. Especially in India [81] and Africa [80,82], there are high carbon emissions, and the use of natural gas will play an important role in the future energy structure and emission reduction. Finally, this comprehensive assessment also helps to provide a method reference for comprehensive analysis of the impact of shale gas. Of course, our research also has some limitations. This study did not discuss in detail the water and soil problems caused by shale gas. Other issues related to shale gas extraction and use in various countries, such as social issues, mining and recycling technologies, and pressure on government subsidies, were only briefly discussed. These questions will be investigated in future research.

Author Contributions

X.Y.: methodology, Formal analysis, Software, data curation and original draft. A.G. and F.J.: Investigation, validation, revision and funding acquisition. Q.W. and W.X.: data curation, validation and draft revision. All authors have read and agreed to the published version of the manuscript.

Funding

This research was funded by the National Natural Science Foundation of China (grant number 71704187 and 41872128), the Beijing Social Science Fund (grant number 7GLC045), and National Science and Technology Major Project of the Ministry of Science and Technology of China (grant number 2016ZX05040-001). The APC was funded by National Natural Science Foundation of China (grant number 71704187).

Acknowledgments

The authors gratefully acknowledge the financial support from the National Natural Science Foundation of China (71704187, 41872128), Beijing Social Science Fund (17GLC045), and National Science and Technology Major Project of the Ministry of Science and Technology of China (2016ZX05040-001). Authors sincerely acknowledge the Ministry of Science and Technology for their comments to improve the quality of this study.

Conflicts of Interest

The authors declare no conflict of interest.

Abbreviations

bcmbillion cubic meters
China-MAPLEChina-Multi-pollutant Abatement Planning and Long-term benefit Evaluation
CNChanging Exploration and Development Zone
CO2Carbon dioxide
CQChongqing
EIAU.S. Energy Information Administration
FLFuling Exploration and Development Zone
GZGuizhou Province
HBHubei Province
HNHunan Province
ktKiloton
MtceMillon tons of coal equivalents
NDRCNational Development and Reform Commission
NOxNitrogen oxide
REFReference
RMBRenminbi
SCSichuan Province
STShaotong Exploration and Development Zone
SGMDShale gas moderate development
SGADShale gas ambitious development
SO2Sulfur dioxide
SXShanxi Province
tceton of standard coal equivalent
TwhTera Watt Hour(s)
UNDPUnited Nations Development Programme
WYWeiyuan Exploration and Development Zone
XJXinjiang Uygur Autonomous Region
YAYan’an Exploration and Development Zone
YNYunnan Province

References

  1. EIA Official Website. Available online: https://www.eia.gov/outlooks/aeo/nems/documentation/ogsm/pdf/m063(2018).pdf (accessed on 18 August 2020).
  2. Chen, S.; Zhu, Y.; Wang, H.; Liu, H.; Wei, W.; Luo, Y.; Li, W.; Fang, J. Research status and trends of shale gas in China. Acta Pet. Sin. 2010, 31, 689–694. (In Chinese) [Google Scholar]
  3. Westaway, R.; Younger, P.L.; Cornelius, C. Comment on ‘Life cycle environmental impacts of UK shale gas’ by L. Stamford and A. Azapagic. Applied Energy, 134, 506–518, 2014. Appl. Energy 2015, 148, 489–495. [Google Scholar] [CrossRef] [Green Version]
  4. Stamford, L.; Azapagic, A. Response to the Comment by Westaway et al. (Applied Energy 148 (2015) 489–495) on the paper “Life cycle environmental impacts of UK shale gas” by Stamford and Azapagic (Applied Energy 134 (2014) 506–518). Appl. Energy 2015, 155, 947–948. [Google Scholar] [CrossRef] [Green Version]
  5. Westaway, R.; Younger, P.L.; Cornelius, C. Corrigendum to “Comment on ‘Life cycle environmental impacts of UK shale gas’ by L. Stamford and A. Azapagic. Applied Energy 134, 506–518, 2014” [Appl. Energy 148 (2015) 489–495]. Appl. Energy 2015, 155, 949. [Google Scholar] [CrossRef]
  6. Absar, S.M.; Boulay, A.; Campa, M.F.; Preston, B.L.; Taylor, A. The tradeoff between water and carbon footprints of Barnett Shale gas. J. Clean. Prod. 2018, 197, 47–56. [Google Scholar] [CrossRef]
  7. Turk, J.K.; Reay, D.S.; Haszeldine, R.S. Gas-fired power in the UK: Bridging supply gaps and implications of domestic shale gas exploitation for UK climate change targets. Sci. Total Environ. 2018, 616–617, 318–325. [Google Scholar] [CrossRef] [Green Version]
  8. BP Official Website. Available online: https://www.bp.com/en/global/corporate/news-and-insights/press-releases/bp-statistical-review-of-world-energy-2020-published.html (accessed on 18 August 2020).
  9. EIA Official Website. Available online: https://www.eia.gov/naturalgas/crudeoilreserves/pdf/usreserves.pdf (accessed on 18 August 2020).
  10. NBSPRC (National Bureau of Statistics of the People’s Republic of China) Official Website. Available online: http://data.stats.gov.cn/easyquery.htm?cn=C01&zb=A070B&sj=2019 (accessed on 18 August 2020).
  11. Cooper, J.; Stamford, L.; Azapagic, A. Social sustainability assessment of shale gas in the UK. Sustain. Prod. Consum. 2018, 14, 1–20. [Google Scholar] [CrossRef] [Green Version]
  12. Cooper, J.; Stamford, L.; Azapagic, A. Sustainability of UK shale gas in comparison with other electricity options: Current situation and future scenarios. Sci. Total Environ. 2018, 619–620, 804–814. [Google Scholar] [CrossRef]
  13. Jenner, S.; Lamadrid, A.J. Shale gas vs. coal: Policy implications from environmental impact comparisons of shale gas, conventional gas, and coal on air, water, and land in the United States. Energy Policy 2013, 53, 442–453. [Google Scholar] [CrossRef] [Green Version]
  14. Bunch, A.G.; Perry, C.S.; Abraham, L.; Wikoff, D.S.; Tachovsky, J.A.; Hixon, J.G.; Urban, J.D.; Harris, M.A.; Haws, L.C. Evaluation of impact of shale gas operations in the Barnett Shale region on volatile organic compounds in air and potential human health risks. Sci. Total Environ. 2014, 468–469, 832–842. [Google Scholar] [CrossRef] [Green Version]
  15. Bilgilih, F.; Koçak, E.; Bulut, U.; Sualp, M.N. How did the US economy react to shale gas production revolution? An advanced time series approach. Energy 2016, 116, 963–977. [Google Scholar] [CrossRef]
  16. Solarin, S.A.; Bello, M.O. The impact of shale gas development on the U.S economy: Evidence from a quantile autoregressive distributed lag model. Energy 2020, 205, 118004. [Google Scholar] [CrossRef]
  17. Grecu, E.; Aceleanu, M.I.; Albulescu, C.T. The economic, social and environmental impact of shale gas exploitation in Romania: A cost-benefit analysis. Renew. Sustain. Energy Rev. 2018, 93, 691–700. [Google Scholar] [CrossRef]
  18. Saussay, A. Can the US shale revolution be duplicated in continental Europe? An economic analysis of European shale gas resources. Energy Econ. 2018, 69, 295–306. [Google Scholar] [CrossRef] [Green Version]
  19. Cooper, J.; Stamford, L.; Azapagic, A. Economic viability of UK shale gas and potential impacts on the energy market up to 2030. Appl. Energy 2018, 215, 577–590. [Google Scholar] [CrossRef] [Green Version]
  20. Chen, Y.; Li, J.; Lu, H.; Xia, J. Tradeoffs in water and carbon footprints of shale gas, natural gas, and coal in China. Fuel 2020, 263, 16778. [Google Scholar] [CrossRef]
  21. Zeng, S.; Gu, J.; Yang, S.; Zhou, H.; Qian, Y. Comparison of techno-economic performance and environmental impacts between shale gas and coal-based synthetic natural gas (SNG) in China. J. Clean. Prod. 2019, 215, 544–556. [Google Scholar] [CrossRef]
  22. Chang, Y.; Huang, R.; Ries, R.J.; Masanet, E. Life-cycle comparison of greenhouse gas emissions and water consumption for coal and shale gas fired power generation in China. Energy 2015, 86, 335–343. [Google Scholar] [CrossRef]
  23. Shen, S. Scenario Simulation and Uncertainty Analysis of Shale Gas Emission Reduction Potential in Power Industry. Master’s Thesis, Tsinghua University, Beijing, China, 2017. (In Chinese). [Google Scholar]
  24. Zhang, Y.; Wang, H.; Han, Y.; Wang, D.; Zhu, G.; Lu, X. Shale gas development in China: Implications for indoor and outdoor air quality and greenhouse gas emissions. Environ. Int. 2020, 141, 105727. [Google Scholar] [CrossRef]
  25. Li, X.; Mao, H.; Ma, Y.; Wang, B.; Liu, W.; Xu, W. Life cycle greenhouse gas emissions of China shale gas. Resour. Conserv. Recycl. 2020, 152, 104518. [Google Scholar] [CrossRef]
  26. Bo, S. Analysis and research on economic benefits of shale gas development. Huabei Nat. Resour. 2014, 4, 123–124. [Google Scholar]
  27. Rivard, C.; Lavoie, D.; Lefebvre, R.; Séjourné, S.; Lamontagne, C.; Duchesne, M. An overview of Canadian shale gas production and environmental concerns. Int. J. Coal Geol. 2014, 126, 64–76. [Google Scholar] [CrossRef]
  28. Sangaramoorthy, T. Maryland is not for Shale: Scientific and public anxieties of predicting health impacts of fracking. Extr. Ind. Soc. 2019, 6, 463–470. [Google Scholar] [CrossRef]
  29. Hill, E.L. Shale gas development and infant health: Evidence from Pennsylvania. J. Health Econ. 2018, 61, 134–150. [Google Scholar] [CrossRef]
  30. Zhang, W.; Yang, J.; Zhang, Z.; Shackman, J.D. Natural gas price effects in China based on the CGE model. J. Clean. Prod. 2017, 147, 497–505. [Google Scholar] [CrossRef]
  31. Zhang, S.; Wang, C.; Cai, W. How Shale Gas will Shape China’s Future? An Evaluation Based on Dynamic Energy-CGE Model. Energy Procedia 2017, 105, 3349–3354. [Google Scholar] [CrossRef]
  32. Shaw, J.T.; Allen, G.; Pitt, J.; Mead, M.I.; Purvis, R.M.; Dunmore, R.; Wilde, S.; Shah, A.; Barker, P.; Bateson, P.; et al. A baseline of atmospheric greenhouse gases for prospective UK shale gas sites. Sci. Total Environ. 2019, 684, 1–13. [Google Scholar] [CrossRef]
  33. Purvis, R.M.; Lewis, A.C.; Hopkins, J.R.; Wilde, S.E.; Dunmore, R.E.; Allen, G.; Pitt, J.; Ward, R.S. Effects of ‘pre-fracking’ operations on ambient air quality at a shale gas exploration site in rural North Yorkshire, England. Sci. Total Environ. 2019, 673, 445–454. [Google Scholar] [CrossRef]
  34. Umeozor, E.C.; Jordaan, S.M.; Gates, I.D. On methane emissions from shale gas development. Energy 2018, 152, 594–600. [Google Scholar] [CrossRef]
  35. Ahmadi, M.; John, K. Statistical evaluation of the impact of shale gas activities on ozone pollution in North Texas. Sci. Total Environ. 2015, 536, 457–467. [Google Scholar] [CrossRef]
  36. Lim, G.Q.; John, K. Impact of energy production in the Barnett Shale gas region on the measured ambient hydrocarbon concentrations in Denton, Texas. Atmos. Pollut. Res. 2020, 11, 409–418. [Google Scholar] [CrossRef]
  37. Xu, B.; Feng, L.; Wang, J.; Wei, W. The Enlightenment from Methane Control Measures in the U.S. Shale Gas Development. Ecol. Econ. 2016, 32, 106–110. [Google Scholar]
  38. Yu, G.; Wu, Q. Assessment on the environmental benefits of shale gas development and utilization in China. China Min. Mag. 2015, 24, 24–28. (In Chinese) [Google Scholar]
  39. Castellani, B.; Rinaldi, S.; Morini, E.; Nastasi, B.; Rossi, F. Flue gas treatment by power-to-gas integration for methane and ammonia synthesis – Energy and environmental analysis. Energy Convers. Manag. 2018, 171, 626–634. [Google Scholar] [CrossRef]
  40. Guilera, J.; Andreu, T.; Basset, N.; Boeltken, T.; Timm, F.; Mallol, I.; Morante, J.R. Synthetic natural gas production from biogas in a waste water treatment plant. Renew. Energy 2020, 146, 1301–1308. [Google Scholar] [CrossRef]
  41. Castellani, B.; Gambelli, A.M.; Morini, E.; Nastasi, B.; Presciutti, A.; Filipponi, M.; Nicolini, A.; Rossi, F. Experimental Investigation on CO2 Methanation Process for Solar Energy Storage Compared to CO2-Based Methanol Synthesis. Energies 2017, 10, 855. [Google Scholar] [CrossRef]
  42. Blythe, K.; Jeffries, R.; Travers, M. Chapter 13—An International Perspective of Challenges and Constraints in Shale Gas Extraction. In Environmental and Health Issues in Unconventional Oil and Gas Development; Elsevier: Amsterdam, The Netherlands, 2016; pp. 225–248. [Google Scholar]
  43. Theodori, G.L. Shale energy development in the Southern United States: A review of perceived and objective social impacts. Extr. Ind. Soc. 2018, 5, 610–618. [Google Scholar] [CrossRef]
  44. Tan, H.; Wong-Parodi, G.; Xu, J. Not under my backyard? Psychological distance, local acceptance, and shale gas development in China. Energy Res. Soc. Sci. 2020, 61, 101336. [Google Scholar] [CrossRef]
  45. Shang, W.; Tiraferri, A.; He, Q.; Li, N.; Chang, H.; Liu, C.; Liu, B. Reuse of shale gas flowback and produced water: Effects of coagulation and adsorption on ultrafiltration, reverse osmosis combined process. Sci. Total Environ. 2019, 689, 47–56. [Google Scholar] [CrossRef]
  46. Liang, X.; Xu, Z.; Zhang, Z.; Wang, W.; Zhang, J.; Lu, H.; Zhang, L.; Zou, C.; Wang, G.; Mei, J.; et al. Breakthrough of shallow shale gas exploration in Taiyang anticline area and its significance for resource development in Zhaotong, Yunnan Province, China. Pet. Explor. Dev. 2020, 47, 12–29. [Google Scholar] [CrossRef]
  47. Han, S.; Bai, S.; Tang, Z.; Rui, Y.; Gong, D.; Zhang, J. Nitrogen-rich gas shale logging evaluation and differential gas-bearing characterization of lower Cambrian formation in northern Guizhou, south China. Mar. Pet. Geol. 2020, 115, 104270. [Google Scholar] [CrossRef]
  48. Zou, C.; Dong, D.; Wang, Y.; Li, X.; Huang, J.; Wang, S.; Guan, Q.; Zhang, C.; Wang, H.; Liu, H.; et al. Shale gas in China: Characteristics, challenges and prospects (II). Pet. Explor. Dev. 2016, 43, 182–196. [Google Scholar] [CrossRef]
  49. Iddphonce, R.; Wang, J.; Zhao, L. Review of CO2 injection techniques for enhanced shale gas recovery: Prospect and challenges. J. Nat. Gas Sci. Eng. 2020, 77, 103240. [Google Scholar] [CrossRef]
  50. Liu, J.; Liang, X.; Xue, Y.; Yao, K.; Fu, Y. Numerical evaluation on multiphase flow and heat transfer during thermal stimulation enhanced shale gas recovery. Appl. Therm. Eng. 2020, 178, 115554. [Google Scholar] [CrossRef]
  51. Liu, J.; Li, Z.; Luo, D.; Duan, X.; Liu, R. Shale gas production in China: A regional analysis of subsidies and suggestions for policy. Util. Policy 2020, 67, 101135. [Google Scholar] [CrossRef]
  52. Bai, Y.; Meng, J.; Meng, F.; Fang, G. Stochastic analysis of a shale gas investment strategy for coping with production uncertainties. Energy Policy 2020, 144, 111639. [Google Scholar] [CrossRef]
  53. Chen, Y.; Xu, J.; Wang, P. Shale gas potential in China: A production forecast of the Wufeng-Longmaxi Formation and implications for future development. Energy Policy 2020, 147, 111868. [Google Scholar] [CrossRef]
  54. Zhang, Q.; Grohmann, S.; Xu, X.; Littke, R. Depositional environment and thermal maturity of the coal-bearing Longtan Shale in southwest Guizhou, China: Implications for shale gas resource potential. Int. J. Coal Geol. 2020, 231, 103607. [Google Scholar] [CrossRef]
  55. Han, H.; Pang, P.; Zhong, N.; Luo, Q.; Ma, Y.; Gao, Y. The pore characteristics and gas potential of the Jurassic continental shales in the middle-small basins, northwest China. J. Pet. Sci. Eng. 2020, 188, 106873. [Google Scholar] [CrossRef]
  56. Fan, C.; Li, H.; Qin, Q.; He, S.; Zhong, C. Geological conditions and exploration potential of shale gas reservoir in Wufeng and Longmaxi Formation of southeastern Sichuan Basin. China. J. Pet. Sci. Eng. 2020, 191, 107138. [Google Scholar] [CrossRef]
  57. Wan, Y.; Tang, S.; Pan, Z. Evaluation of the shale gas potential of the lower Silurian Longmaxi Formation in northwest Hunan Province, China. Mar. Pet. Geol. 2017, 79, 159–175. [Google Scholar] [CrossRef]
  58. Zeng, S. Technology-Economic Analysis and Environmental Impacts Assessment of Shale Oil and Shale Gas Development in China. Master’s Thesis, South China University of Technology, Guangzhou, China, 2019. [Google Scholar]
  59. Wang, Q.; Zhan, L. Assessing the sustainability of the shale gas industry by combining DPSIRM model and RAGA-PP techniques: An empirical analysis of Sichuan and Chongqing, China. Energy 2019, 176, 353–364. [Google Scholar] [CrossRef]
  60. The Center on Global Energy Policy of Columbia Univerisity. Available online: https://energypolicy.columbia.edu/sites/default/files/China%20Shale%20Gas_WORKING%20DRAFT_Sept%2011_Chinese%20langugage%20version.pdf (accessed on 18 December 2020).
  61. The People’s Government of Sichuan Province. Available online: http://www.sc.gov.cn/10462/c103044/2017/3/2/ad8905f6fc674a209bf084e26b82f79f.shtml (accessed on 14 December 2020).
  62. Chongqing Municipal People’s Government. Available online: http://www.cq.gov.cn/zwgk/fdzdgknr/lzyj/qtgw/202001/t20200114_4617664.html (accessed on 14 December 2020).
  63. China Geological Survey. Available online: https://www.cgs.gov.cn/xwl/ddyw/201603/t20160309_303928.html (accessed on 14 December 2020).
  64. Strategic Research Center of Oil and Gas Resources. National Shale Gas. Resource Potential Investigation Evaluation and Advantageous Area Selection; Science Press: Beijing, China, 2016. [Google Scholar]
  65. China Official Website. Available online: http://www.mnr.gov.cn/sj/sjfw/kc_19263/zgkczybg/201910/t20191022_2473040.html (accessed on 18 August 2020).
  66. National Energy Administration Official Website. Available online: http://www.gov.cn/xinwen/2016-09/30/content_5114313.htm (accessed on 18 August 2020).
  67. The 10th China Gas Summit (CSGS). Available online: http://shalegas.zhenweievents.com/cn/news/list_104_1.html (accessed on 14 December 2020).
  68. PetroChina Southwest Oil & GasField Company. Available online: http://xnyqt.cnpc.com.cn/xnyqt/sylmtydt/202004/cf26657ac7f34b6783e10eb41372153f.shtml (accessed on 14 December 2020).
  69. BP Official Website. Available online: https://www.bp.com/content/dam/bp/business-sites/en/global/corporate/pdfs/energy-economics/energy-outlook/bp-energy-outlook-2014.pdf (accessed on 18 August 2020).
  70. Zhu, S. Fugitive Emission of Greenhouse Gas from Oil and Gas System in Canada. Environ. Prot. Oil Gas Fields 2005, 15, 4–6. (In Chinese) [Google Scholar]
  71. NDRC/UNDP. China Prepares for the Third National Communication Capacity Building Project: China’s 2012 National Gree Gas Inventory-Energy Activity List. National Center for Climate Change Strategy and International Cooperation; Energy Research Institute National Development and Reform Commission: Beijing, China, 2017.
  72. IPCC Official Website. Available online: https://www.ipcc.ch/report/2019-refinement-to-the-2006-ipcc-guidelines-for-national-greenhouse-gas-inventories/ (accessed on 18 August 2020).
  73. IPCC Official Website. Available online: https://www.ipcc.ch/report/ar5/wg1/ (accessed on 7 December 2020).
  74. Lü, L.; Zhang, X.; Pang, W.; Wang, J.; Luo, H. Study on the environmental impact of implementing “Shale Gas Development Plan (2016–2020)”. Nat. Gas Ind. 2017, 37, 132–138. (In Chinese) [Google Scholar]
  75. BP Official Website. Available online: https://www.bp.com/en/global/corporate/news-and-insights/press-releases/bp-statistical-review-of-world-energy-2019.html (accessed on 18 August 2020).
  76. Negi, B.S.; Pandey, K.K.; Sehgal, N. Renewables, Shale Gas and Gas Import- Striking a Balance for India. Energy Procedia 2017, 105, 3720–3726. [Google Scholar] [CrossRef]
  77. Andreasson, S. The bubble that got away? Prospects for shale gas development in South Africa. Extr. Ind. Soc. 2018, 5, 453–460. [Google Scholar] [CrossRef] [Green Version]
  78. Lis, A. Co-production of the shale gas publics in Poland and the negotiation of the state citizens relations. Extr. Ind. Soc. 2018, 5, 673–681. [Google Scholar] [CrossRef]
  79. Dong, K.; Sun, R.; Hochman, G. Do natural gas and renewable energy consumption lead to less CO2 emission? Empirical evidence from a panel of BRICS countries. Energy 2017, 141, 1466–1478. [Google Scholar] [CrossRef]
  80. Altieri, K.E.; Stone, A. Prospective air pollutant emissions inventory for the development and production of unconventional natural gas in the Karoo basin, South Africa. Atmos. Environ. 2016, 129, 34–42. [Google Scholar] [CrossRef]
  81. Kumar, V.V.; Shastri, Y.; Hoadley, A. A consequence analysis study of natural gas consumption in a developing country: Case of India. Energy Policy 2020, 145, 111675. [Google Scholar] [CrossRef]
  82. Lin, B.; Agyeman, S. Impact of natural gas consumption on sub-Saharan Africa’s CO2 emissions: Evidence and policy perspective. Sci. Total Environ. 2020, 2, 143321. [Google Scholar] [CrossRef] [PubMed]
Figure 1. Shale gas resource reserves/development goals.
Energies 14 00053 g001
Figure 2. Multi-pollutant Abatement Planning and Long-term benefit Evaluation (MAPLE) integrated assessment framework.
Energies 14 00053 g002
Figure 3. China’s future production of conventional natural gas and shale gas.
Energies 14 00053 g003
Figure 4. Final energy consumption.
Energies 14 00053 g004
Figure 5. Final energy consumption structure.
Energies 14 00053 g005
Figure 6. Primary energy consumption.
Energies 14 00053 g006
Figure 7. Primary energy consumption structure.
Energies 14 00053 g007
Figure 8. Power generation.
Energies 14 00053 g008
Figure 9. Power generation structure.
Energies 14 00053 g009
Figure 10. Emissions of SO2 and NOx from different sectors.
Energies 14 00053 g010
Figure 11. Deaths and economic losses attributed to SO2 and NOx.
Energies 14 00053 g011
Figure 12. Number of deaths and economic loss attributed to methane.
Energies 14 00053 g012
Figure 13. Net environmental health cobenefit of pollutants.
Energies 14 00053 g013
Table 1. Decision variables and descriptions.
Variable codeDescription
OBJ(y0)The total system cost discounted to y0
D ( r , t , d ) Energy service demand d in region r, period t
N C A P ( r , v , p ) Capacity of new technology p in period v, region r
C A P ( r , v , t , p ) Capacity of installed technology p in period t, region r
C A P T ( r , v , t , p , s ) Total capacity of installed technology p in period t, region r
A C T ( r , v , t , p , s ) Activity level of technology p in period t, region r
F L O W ( r , v , t , p , c , s ) Amount of product c produced or consumed by technology p in period t, region r
S I N ( r , v , t , p , c , s ) / S O U T ( r , v , t , p , c , s ) The amount of commodities c stored or released by technology p in period t, stage s, region r
T R A D E ( r , t , p , c , s , i m p )
T R A D E ( r , t , p , c , s , exp )
The amount of commodities c imported and exported by technology p in period t, region r by technology p
Table 2. Shale gas production and proportion in different scenarios; Unit: billion cubic meter.
The SGMD ScenarioThe SGAD Scenario
2025203020252030
Natural gas production249274260300
Shale gas production72.86108.3385130
Shale gas production ratio29%40%33%43%
Table 3. Total methane emissions (kt).
Accounting Method20252030
SGMDSGADSGMDSGAD
Zhu S. [70]243.71284.32362.36434.84
NDRC/UNDP [71]292.97341.79435.6522.74
IPCC 2006 guidelines (small) [72]387.09451.59575.53690.66
IPCC 2006 guidelines (middle) [72]1338.221561.191989.692387.7
IPCC 2006 guidelines (large) [72]2289.342670.793403.854084.74
Table 4. Methane emission in each link (kt).
LinkThe SGMD ScenarioThe SGAD ScenarioAccounting Method
2025203020252030
Natural gas extraction72.60107.9484.69129.53Zhu S. [70]
Natural gas processing36.3053.9742.3564.76
Natural gas transmission46.6769.3954.4483.27
Natural gas consumption88.15131.07102.84157.28
Total243.71362.36284.32434.84
Natural gas extraction75.19111.7987.72134.15NDRC/UNDP [71]
Natural gas processing36.3053.9742.3564.76
Natural gas transmission93.34138.78108.89166.54
Natural gas consumption88.15131.07102.84157.28
Total292.97435.6341.79522.74
Natural gas extraction285.20424.04332.72508.86IPCC 2006 guidelines
(small) [72]
Natural gas processing0000
Natural gas transmission16.3324.2919.0629.14
Natural gas consumption85.56127.2199.81152.66
Total387.09575.53451.59690.66
Natural gas extraction1075.961599.771255.241919.78IPCC 2006 guidelines
(middle) [72]
Natural gas processing42.7863.6149.9176.33
Natural gas transmission79.47118.1592.71141.79
Natural gas consumption140.01208.16163.33249.8
Total1338.221989.691561.192387.70
Natural gas extraction1866.732775.512177.773330.71IPCC 2006 guidelines
(large) [72]
Natural gas processing85.56127.2199.81152.66
Natural gas transmission142.6212.02166.36254.43
Natural gas consumption194.45289.12226.85346.95
Total2289.343403.852670.794084.74
Table 5. The GWP (Global Warming Potential) of methane leakage.
Acronym, Common Name or Chemical NameChemical FormulaLifetime
(Years)
GWP
(20-Year)
GWP
(100-Year)
Carbon dioxideCO2No single lifetime can be given. The impulse response function for CO2 from Joos et al. (2013) has been used.11
MethaneCH412.4
(Perturbation lifetime is used in calculation of metrics, not the lifetime of the atmospheric burden)
8428
Publisher’s Note: MDPI stays neutral with regard to jurisdictional claims in published maps and institutional affiliations.

