Article

Experimental Characterization of Phase Change Materials for Refrigeration Processes

1
Competence Center Thermal Energy Storage (CC TES), School of Engineering and Architecture, Lucerne University of Applied Sciences and Arts, 6048 Horw, Switzerland
2
Sunamp Ltd., 1 Satellite Park, Macmerry East Lothian EH33 1RY, UK
*
Author to whom correspondence should be addressed.
Energies 2021, 14(11), 3033; https://doi.org/10.3390/en14113033
Submission received: 5 April 2021 / Revised: 30 April 2021 / Accepted: 20 May 2021 / Published: 24 May 2021
(This article belongs to the Special Issue Thermal Storage Technologies)

Abstract

:
Latent heat storage units for refrigeration processes are promising as alternatives to water/glycol-based storage due to their significantly higher energy densities, which would lead to more compact and potentially more cost-effective storages. In this study, important thermophysical properties of five phase change material (PCM) candidates are determined in the temperature range between −22 and −35 °C and their compatibility with relevant metals and polymers is investigated. The goal is to complement existing scattered information in literature and to apply a consistent testing methodology to all PCMs, to enable a more reliable comparison between them. More specifically, the enthalpy of fusion, melting point, density, compatibility with aluminum, copper, polyethylene (PE), polypropylene (PP), neoprene and butyl rubber, are experimentally determined for 1-heptanol, n-decane, propionic acid, NaCl/water mixtures, and Al(NO3)3/water mixtures. The results of the investigations reveal individual strengths and weaknesses of the five candidates. Further, 23.3 wt.% NaCl in water stands out for its very high volumetric energy density and n-decane follows with a lower energy density but better compatibility with surrounding materials and supercooling performance. The importance of using consistent methodologies to determine thermophysical properties when the goal is to compare PCM performance is highlighted.

1. Introduction

Approximately 48 Terawatt-hours of the European Union final energy demand are dedicated to process cooling at temperatures below 0 °C [1]. The vast majority of this cooling demand is covered by means of compression cooling using electricity as the energy carrier [2]. This includes the chemical, pharmaceutical, food, and transportation sectors. Thermal storage has been identified as a technology that could decrease the installation cost of refrigeration and cooling systems [3], increase the efficiency and operation cost of refrigeration applications [4], and support the integration of renewables in refrigeration processes [5]. The state of the art, in commercial refrigeration processes, are sensible storage solutions based on water/glycol mixtures [6]. This technology, even though well established, has various disadvantages, such as: low energy density and therefore high storage volumes, high cost, and potential limitations in power input and output if mass flow rate restrictions need to be applied to increase stratification efficiency [7].
Latent heat storage has been proposed as an alternative storage method for refrigeration processes in some studies, mostly in the context of: (i) incorporation of phase change material (PCM) in freezers, (ii) transport of food and temperature-sensitive goods, and (iii) substitution of water/glycol storage in industrial refrigeration processes [8]. In most of these studies, mixtures of NaCl and water were proposed [9] because of their good thermophysical properties and low cost. Different types of salt/water mixtures and paraffins have also been proposed as PCMs for refrigeration processes [9,10,11]. Recently, Suamir et al. [12] proposed corn-oil/water mixtures as PCMs for refrigeration processes with melting temperatures and enthalpies ranging from 0 to −27 °C and 297.4–68.7 J/g for concentrations of corn-oil ester in water ranging from 0–35%, respectively. Several commercial PCMs of unknown compositions also exist in the market at temperatures suitable for refrigeration processes [13]. For most of the investigated PCMs, melting point, enthalpy of fusion, and density have been reported in literature [11,14,15]. However, the values reported are scattered and measured under different conditions and are in many cases incomplete (for example degree of supercooling is rarely reported). At the same time, almost no concise information is presented in literature with respect to the compatibility of these PCMs with metals and plastics even though this information is essential for their implementation in latent heat storage applications.
The goal of this study is to determine the important thermophysical properties of five PCM candidates in the temperature range between −22 and −35 °C and present their compatibility with relevant metals and plastics. This way, existing scattered information in literature will be complemented and the consistent methodology applied for all PCMs will enable a more reliable comparison between them. In this work, we investigate 1-heptanol, n-decane, propionic acid, NaCl/water mixtures, and Al(NO3)3/water mixtures. The enthalpy of fusion, melting point, density, compatibility with aluminum, copper, polyethylene (PE), polypropylene (PP), neoprene and butyl rubber, are experimentally determined and presented in this paper. The research work was performed in the framework of the Eurostars project STOREF with the ultimate goal of developing a novel, high power latent heat storage for refrigeration applications.

2. Materials and Methods

2.1. Materials

Table 1 shows the information of the raw materials used as a basis for PCMs in this study. The organic materials were used for analysis directly without processing and purification. Sodium chloride and aluminum nitrate nonahydrate were mixed with the appropriate amount of deionized water to achieve the final concentration of NaCl 23.3 wt.% and Al(NO3)3 30.5 wt.%, respectively.
The aluminum, copper, polyethylene (PE), polypropylene (PP), neoprene and butyl rubber used for the material compatibility tests were provided by Sunamp Ltd. (East Lothian, UK). and are the same materials that are used in their heat batteries. The PE used is a high temperature grade and the PP is a low-density linear grade.

2.2. Experimental Methods

2.2.1. Determination of Phase Change Temperature and Phase Change Enthalpy

Differential scanning calorimetry (DSC) measurements were performed using a Mettler Toledo DSC823 device with auto-sampler to determine the phase change temperatures and the phase change enthalpies of the five PCM candidates. The device was calibrated and checked prior to the measurements using indium and zinc, following the specifications provided by the device manufacturer. Heating rates (β) of 10 and 2 K/min were chosen for the determination of the phase change enthalpy and the phase change temperature, respectively (see Figure 1).
The lowest temperature was set at −60 °C (which also coincided with the lowest limit of the device) and the highest temperature at 10 °C to guarantee that the entire samples were melted prior to the next cooling cycle. The experiments were conducted using hermetically sealed, 40 μL aluminum crucibles under nitrogen atmosphere with a gas flow of 50 mL/min. Each sample underwent three heating and cooling cycles at 2 K/min and three heating and cooling cycles at 10 K/min. The melting (Tm) and crystallization (Tc) temperatures were calculated by the STARe software through the tangent method, and the enthalpies (ΔH) were obtained by integration of the corresponding peaks. The degree of supercooling, ΔT, was calculated using the difference between the onset melting temperature and the onset crystallization temperature reported by the instrument. Tm, Tc were determined using the cycles conducted at 2 K/min while ΔH was determined based on the cycles conducted at 10 K/min. The method used is based on the one developed in [16]. The methodology for the enthalpy determination was adapted slightly for the Al(NO3)3/water mixtures as the solidification temperature was very close to the lower temperature limits of the DSC device and the dynamic cooling alone was at times not adequate to solidify the entire sample. Therefore, an additional isothermal step at −60 °C was applied for 10 min at the end of the dynamic cooling phase to ensure complete solidification of the sample.

2.2.2. Determination of Density

The densities were determined at room temperature (25.9 °C) while all samples were in a liquid state. Initially, 1 mL of the PCM was measured using a 1 mL GILSON pipette. The sample was subsequently placed in a weighing balance (Mettler Toledo, Columbus, OH, USA, Model MT5, series number L59982) where its mass was measured. The density was calculated by dividing the sample mass by the sample volume. The measurements were repeated three times. The values reported are the mean values obtained from the repetitions.

2.2.3. Determination of Material Compatibility

All PCM candidates were tested with respect to their compatibility with typical materials they could come in contact within a latent heat storage application. In particular, the PCMs were tested in combination with potential metallic heat exchanger materials (aluminum, copper, and their combination) and surrounding plastic and rubber samples (polypropylene (PP), polyethylene (PE), neoprene and butyl rubber).
A limited number of investigations can be found in literature regarding the compatibility of PCMs with various metals and plastics in general [17,18,19] and even less so for PCMs used in cooling applications in particular [8]. There is no standardized methodology for material compatibility tests in the latent heat storage community and most researchers develop their own testing procedure. In this study, it was decided to follow standards that have been developed and established by the American Society for Testing and Materials (ASTM G31 and ASTM D543).
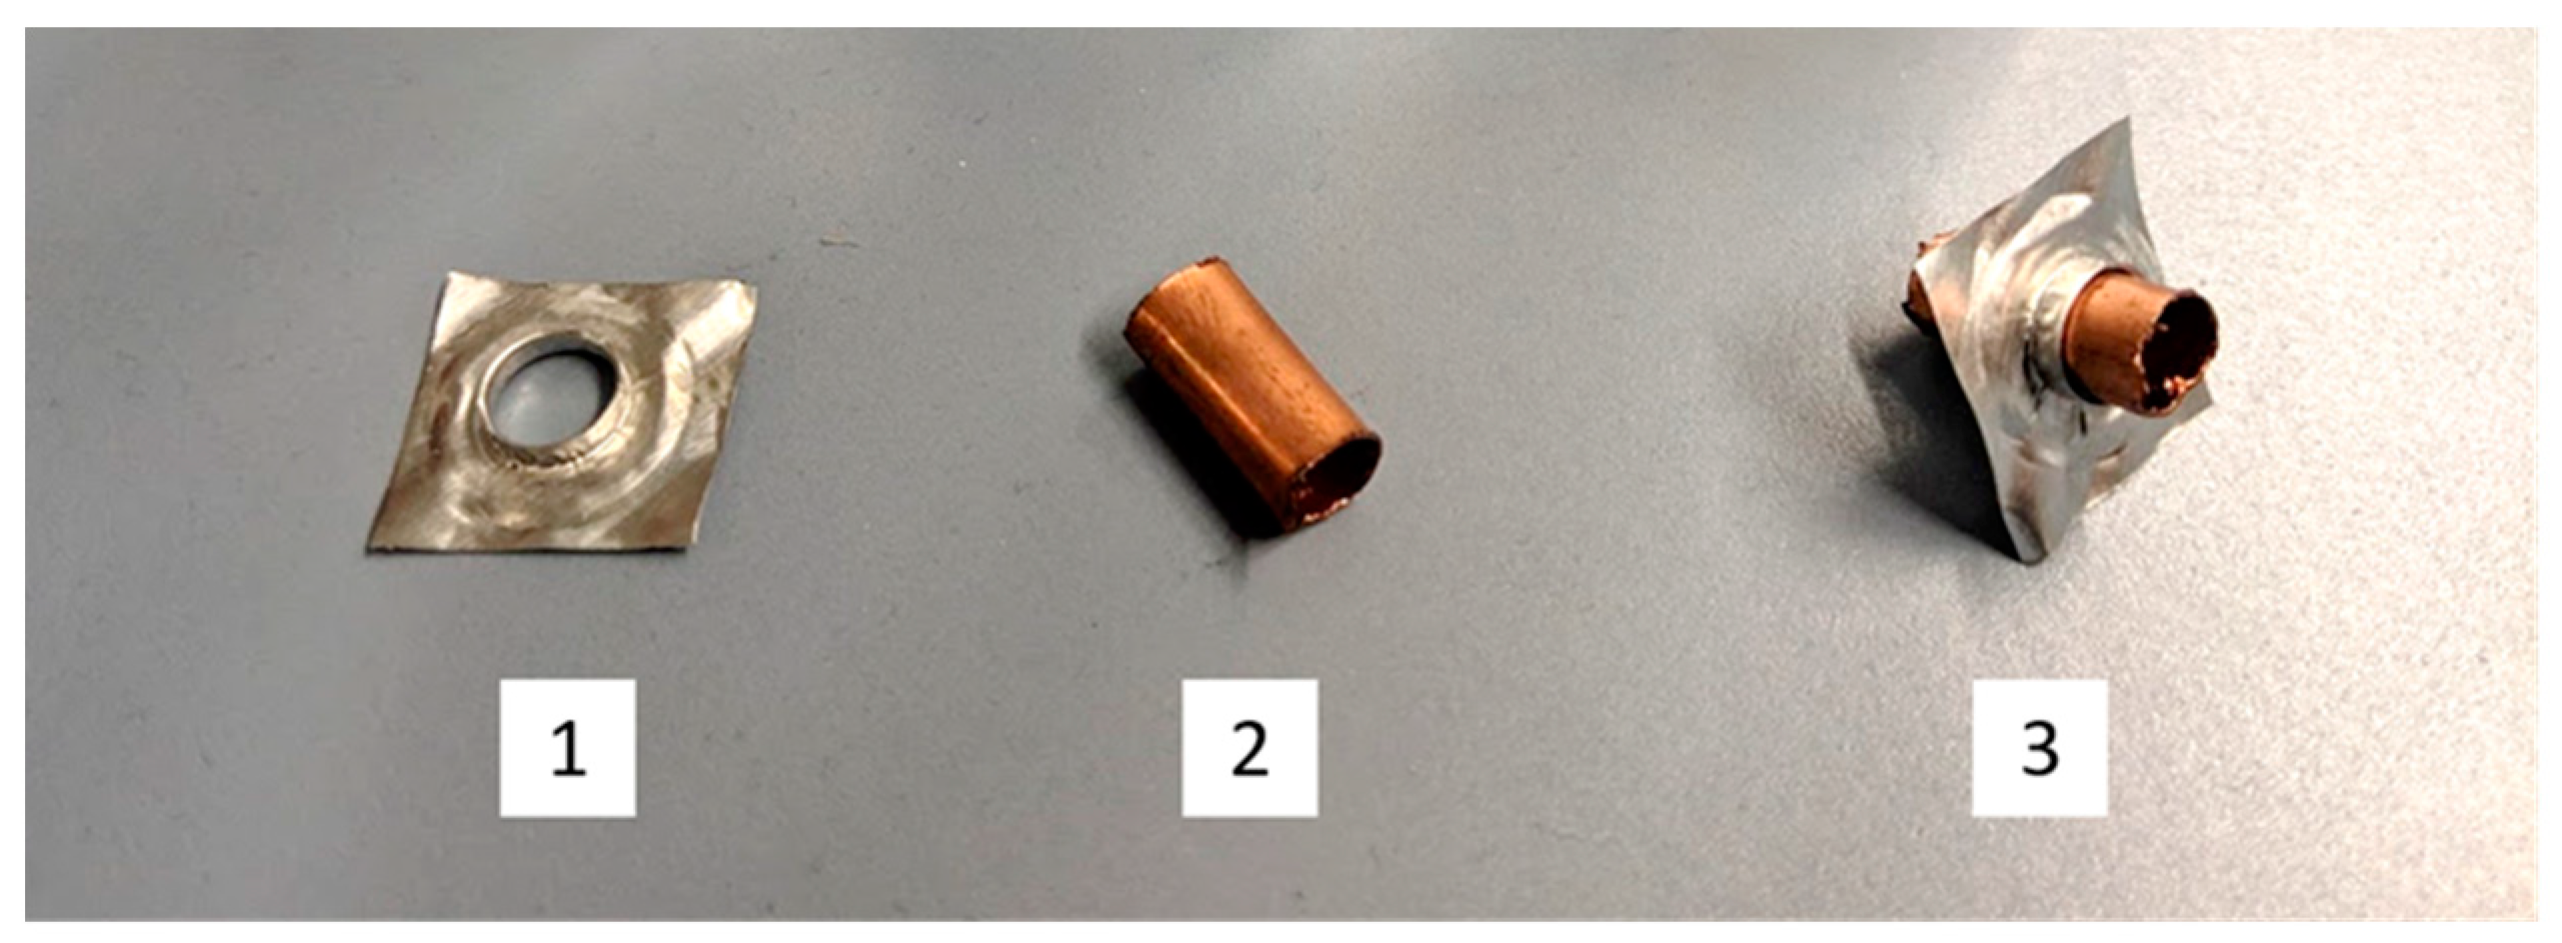
Figure 2 shows an example of the untreated metallic samples. To determine the corrosion rate of the different metals in contact with the chosen PCMs, immersion tests of the metallic samples in the PCMs were performed. For each PCM, three tests were conducted. One with aluminum, one with copper, and one with a combined aluminum/copper sample to account for galvanic effects. The cylindrical copper samples had a fixed wall thickness (H) and a fixed outer diameter (W). The aluminum samples were cut into rectangular shapes with a width (W) of 15 mm and a wall thickness (H) of 0.1 mm. The surface of the extra aluminum surrounding the hole in the center of the samples was considered to be equal to the material that would be needed to cover the hole. Therefore, the aluminum samples were handled as perfect rectangles.
The third dimension of the samples designated here as length (Li) depended on the sample cutting and was calculated based on the sample mass and metal density as follows:
L i = V i H · W = m i H · W · ρ
where Vi was the sample volume, mi was the measured sample mass, and ρ was the density of the corresponding metal (8.96 g/cm3 for copper and 2.7 g/cm3 for aluminum).
To calculate the initial surface area of the samples, Si, the following equation was used for both metals:
S i = 2 · H · W + 2 · L i · H + 2 · L i · W
All metallic samples were cleaned according to ISO 8407:2009 (for about 2–5 min). Subsequently, they were weighed in a balance (Ohaus EP214C) and then placed in a 50 mL falcon tube containing 20–30 mL PCM. The size of the specimens and the amount of PCM were chosen according to standard ASTM G31 [20], which recommends a solution volume to specimen area ratio of 0.20 mL/mm2 for single metallic samples. The immersion test was carried out at room temperature for 42 days. After the immersion tests were completed, the metallic samples were extracted from the PCM, they were mechanically cleaned with a soft toothbrush, to remove any corrosion products in order to measure the weight of the remaining pure metal. After drying, the weight of the samples was recorded. Subsequently, the samples were subjected to chemical cleaning in order to remove any remaining corrosion products, based on standard procedures [21]. For the chemical cleaning, aluminum samples were placed in nitric acid 70 wt.% and the copper samples were placed in HCl 23 wt.%. The samples were left in their corresponding acid for 80 s in total and then removed, dried, and weighed at regular intervals of 10 to 20 s to distinguish between the removal of the corrosion product as opposed to pure metal, as explained in [21]. The average, area-specific corrosion rate was then calculated as follows:
C o r r o s i o n   R a t e   = m e m i S i · t
where me is the final sample mass after removing all corrosion product and t is the time of exposure of the metal to the PCM.
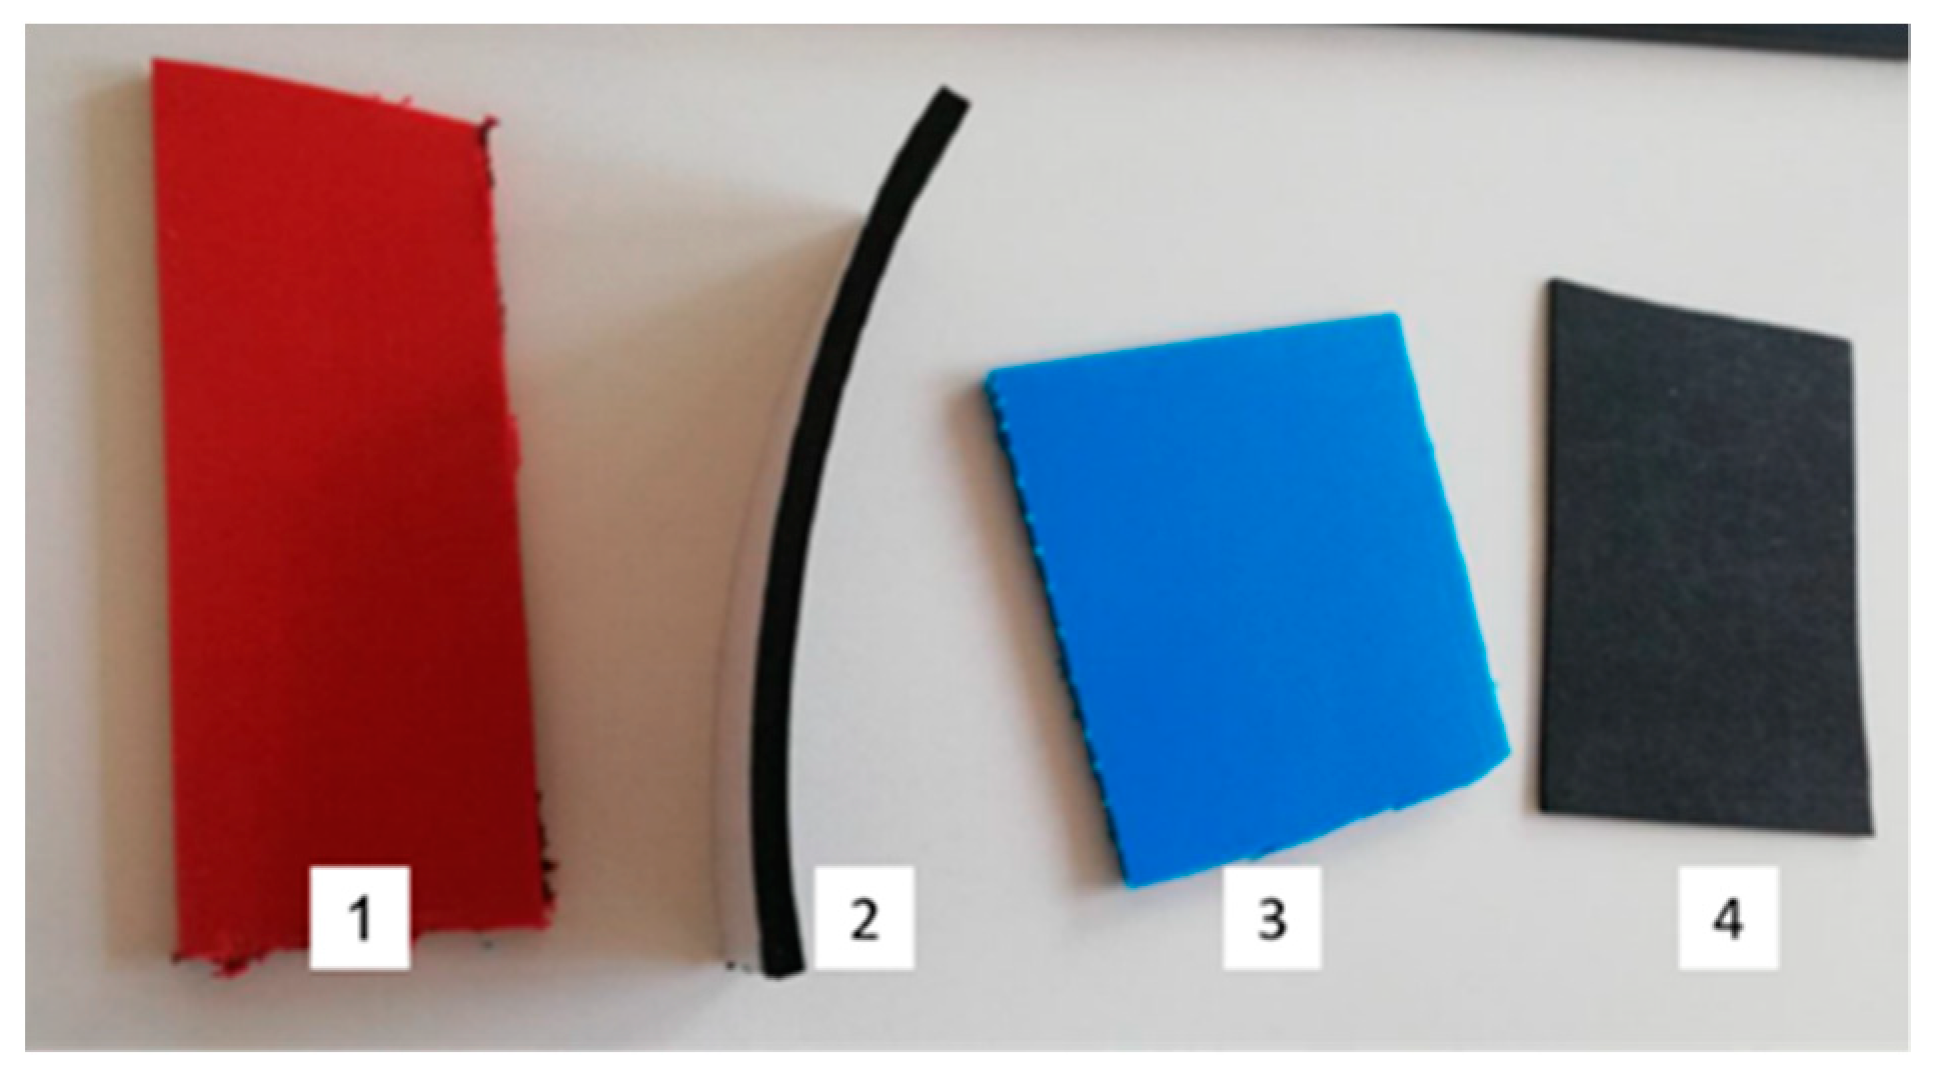
For the different heat and cold batteries, Sunamp utilizes polypropylene, polyethylene, or butyl rubber as encapsulation material and neoprene as a sleeve (see Figure 3).
For the purpose of this compatibility study, samples of about 1 cm2 were taken from each of the four types of plastic/rubber. The specimens were weighed with a balance (Ohaus EP214C) and their initial mass, mi, was recorded. The sample was then placed into a 20 mL glass tube and filled with 10 mL PCM. The guideline ASTM D543 recommend that “the quantity of reagent shall be approximately 40 mL/inch2 of specimen surface area” [22]. Each sample was tested in duplicate. Samples were stored at room temperature for one week, after which the samples were extracted, rinsed with deionized water, dried, and immediately reweighed and the weight, me, was recorded. The samples where then left to dry at room temperature for an additional week and the mass, me,d, was recorded. Based on these measurements, the mass loss or gain after drying was calculated. The loss (or gain) of mass was calculated as follows:
Δ m ( % ) = m e , d m i m i · 100
The mass change could be positive or negative depending on whether the sample gained or lost weight during the experiments.

3. Results

3.1. Measurement of the Thermo-Physical Properties

Table 2 presents the densities of the five PCMs as they were measured in the framework of this study and reported in literature. The experimental results show a very good precision and a very good agreement with the values presented in literature. Therefore, these values can be trusted and utilized for the calculation of the volumetric enthalpies of the PCM. As expected, salt/water mixtures present higher densities than organic substances. Propionic acid also has a rather high density, a bit lower than 1 kg/L.
Table 3 summarizes the phase change temperatures and enthalpies as they were determined in the framework on this study and reported in literature. It is worth mentioning that only melting (no solidification) temperatures could be found in literature. In most cases, it was also not mentioned if they referred to onset or peak melting points. In this investigation, it was considered useful to report both onset and peak temperatures for both the melting and crystallization processes as an indication of the ability of the PCM to undergo phase change in a relatively narrow temperature range. Additionally, the supercooling degree in the DSC is reported as an indication of the tendency of each PCM to supercool, keeping in mind that the supercooling in the actual application will likely differ from the one reported here, as supercooling has been observed to be a volume-dependent phenomenon [26]. Additionally, both the volumetric and the gravimetric phase change enthalpies are reported as both could be crucial, especially when we consider stationary vs. mobile applications.
The PCMs could be separated into two regions, based on their melting point. Propionic acid and NaCl/water would be suitable for higher temperature applications (>−25 °C) and the remaining PCMs for lower temperature applications (<−30 °C). All PCMs present a relatively narrow melting temperature range, which in all cases, remained below 5 °C. Most PCMs present a rather high supercooling tendency (>10 °C) with the exception of n-decane. The rather high standard deviations of both melting and solidification points of NaCl/water should be noted as they could indicate a tendency of the mixture to undergo different crystallization processes (e.g., formation of different crystal structures due to mixing and/or stochastic nucleation effects). This is supported by a closer inspection of the DSC diagram of the crystallization process of the NaCl/water mixture, which as can be seen in Figure 4, presented numerous peaks.
Similar effects were observed in the case of the Al(NO3)3/water PCM in all three repetitions of the cooling curves with Al(NO3)3/water 30.5 wt.% as they were measured by DSC at 2 K/min (see Figure 5). The presence of multiple and shifted peaks during cooling also indicate the formation of various phases during crystallization that could be attributed to supercooling and mixing effects. It can also be observed that crystallization is still ongoing when the device reaches its lower temperature limit (−60 °C) which required the addition of an isothermal step at the end of the process to ensure complete sample solidification. Further studies in larger devices, where less supercooling is present and/or with the presence of nucleation or gelling agents, can be conducted to further investigate these effects. It has to be noted that in contrast to the inorganic PCMs, all organic PCMs exhibited single phase transformations and very good repeatability.
While the measured melting points are in relatively good agreement with the values reported in literature, the same cannot be stated for the melting enthalpies, where 1-heptanol and Al(NO3)3/water deviated from the literature values by −25.7% and 32.5%, respectively. Such deviations are often observed in literature and can be attributed to utilization of different measurement methodologies (e.g., instrumentation, heating rates, inclusion or not of sensible heat, etc.).
Finally, NaCl/water presents the best performance in terms of gravimetric phase change enthalpy, followed by n-decane. The performance of the former is even more impressive in terms of volumetric phase change enthalpy where it presents a 33% higher enthalpy value with respect to the second best substance, Al(NO3)3/water.

3.2. Material Compatibility Tests

3.2.1. Metallic Samples

The main characteristics of the initial metallic samples, their absolute mass loss and mass loss % after mechanical and after mechanical and chemical cleaning, as well as the calculated corrosion rates are shown in Table 4. The most severe corrosion was observed for the Al(NO3)3/water samples in combination with Al both in the pure Al samples and in combination with Cu. In both cases, the Al sample was completely destroyed before the end of the immersion experiments and was no longer visible. Similar, slightly higher absolute mass losses were also observed for the Cu samples in Al(NO3)3/water samples, but since the Cu samples were heavier to begin with, a part of the samples was still present at the end of the tests.
The summary of the resulting corrosion rates can be seen in Figure 6. The suitability of the PCM/metal combinations can be then evaluated using the values reported in Table 5. The combined information shows that the Al(NO3)3/water PCM is not suitable for implementation in a latent heat storage application where it would be in contact with any copper or aluminum parts. Propionic acid is also found to have a critically high corrosion rate with copper. As latent heat storage units should have a life-time of at least 10 years, propionic acid is regarded as an unsuitable PCM for latent TES where the PCM is in contact with copper. It should be noted that in the case of NaCl/water in contact with Al, optical observations revealed the occurrence of pitting corrosion. This was to a degree expected due the presence of dissolved Cl in contact with aluminum metal, a well-known corrosion scenario. Therefore, aluminum is considered unsuitable to be used both in the storage tank and the heat exchanger with this PCM, despite the low corrosion rates. As the utilized standards assume a uniform attack over the entire metallic surface and cannot account for pitting corrosion, the calculated corrosion rates cannot be solely relied upon in the specific material combination. The remaining two PCM candidates presented an acceptable corrosion rate with both Al and Cu and are considered suitable for latent heat storage applications where these metals are present.
It is worth mentioning that the methodology utilized for the corrosion tests enabled the determination of only one average corrosion rate, which accounted for the events occurring during the entire immersion tests. However, in reality, the corrosion rate typically exhibits a transient behavior, and presents a higher value during the first days of immersion, which is reduced over time and reaches a steady, lower corrosion rate after some days/weeks. The authors chose to use this average corrosion rate as an indicator of the material compatibility as it represents the maximum possible value for this specific temperature level (25 °C). This is therefore a conservative, worst-case scenario approach, which gives confidence that the materials determined as compatible will perform even better than expected. This statement is also supported by the fact that the tests were conducted at room temperature even though the storage operation will be performed at temperatures well below 0 °C. The experiments were designed to account for a worst-case scenario, where the storage might not be in operation for longer periods of time and therefore exposed to ambient temperatures.

3.2.2. Polymeric Samples

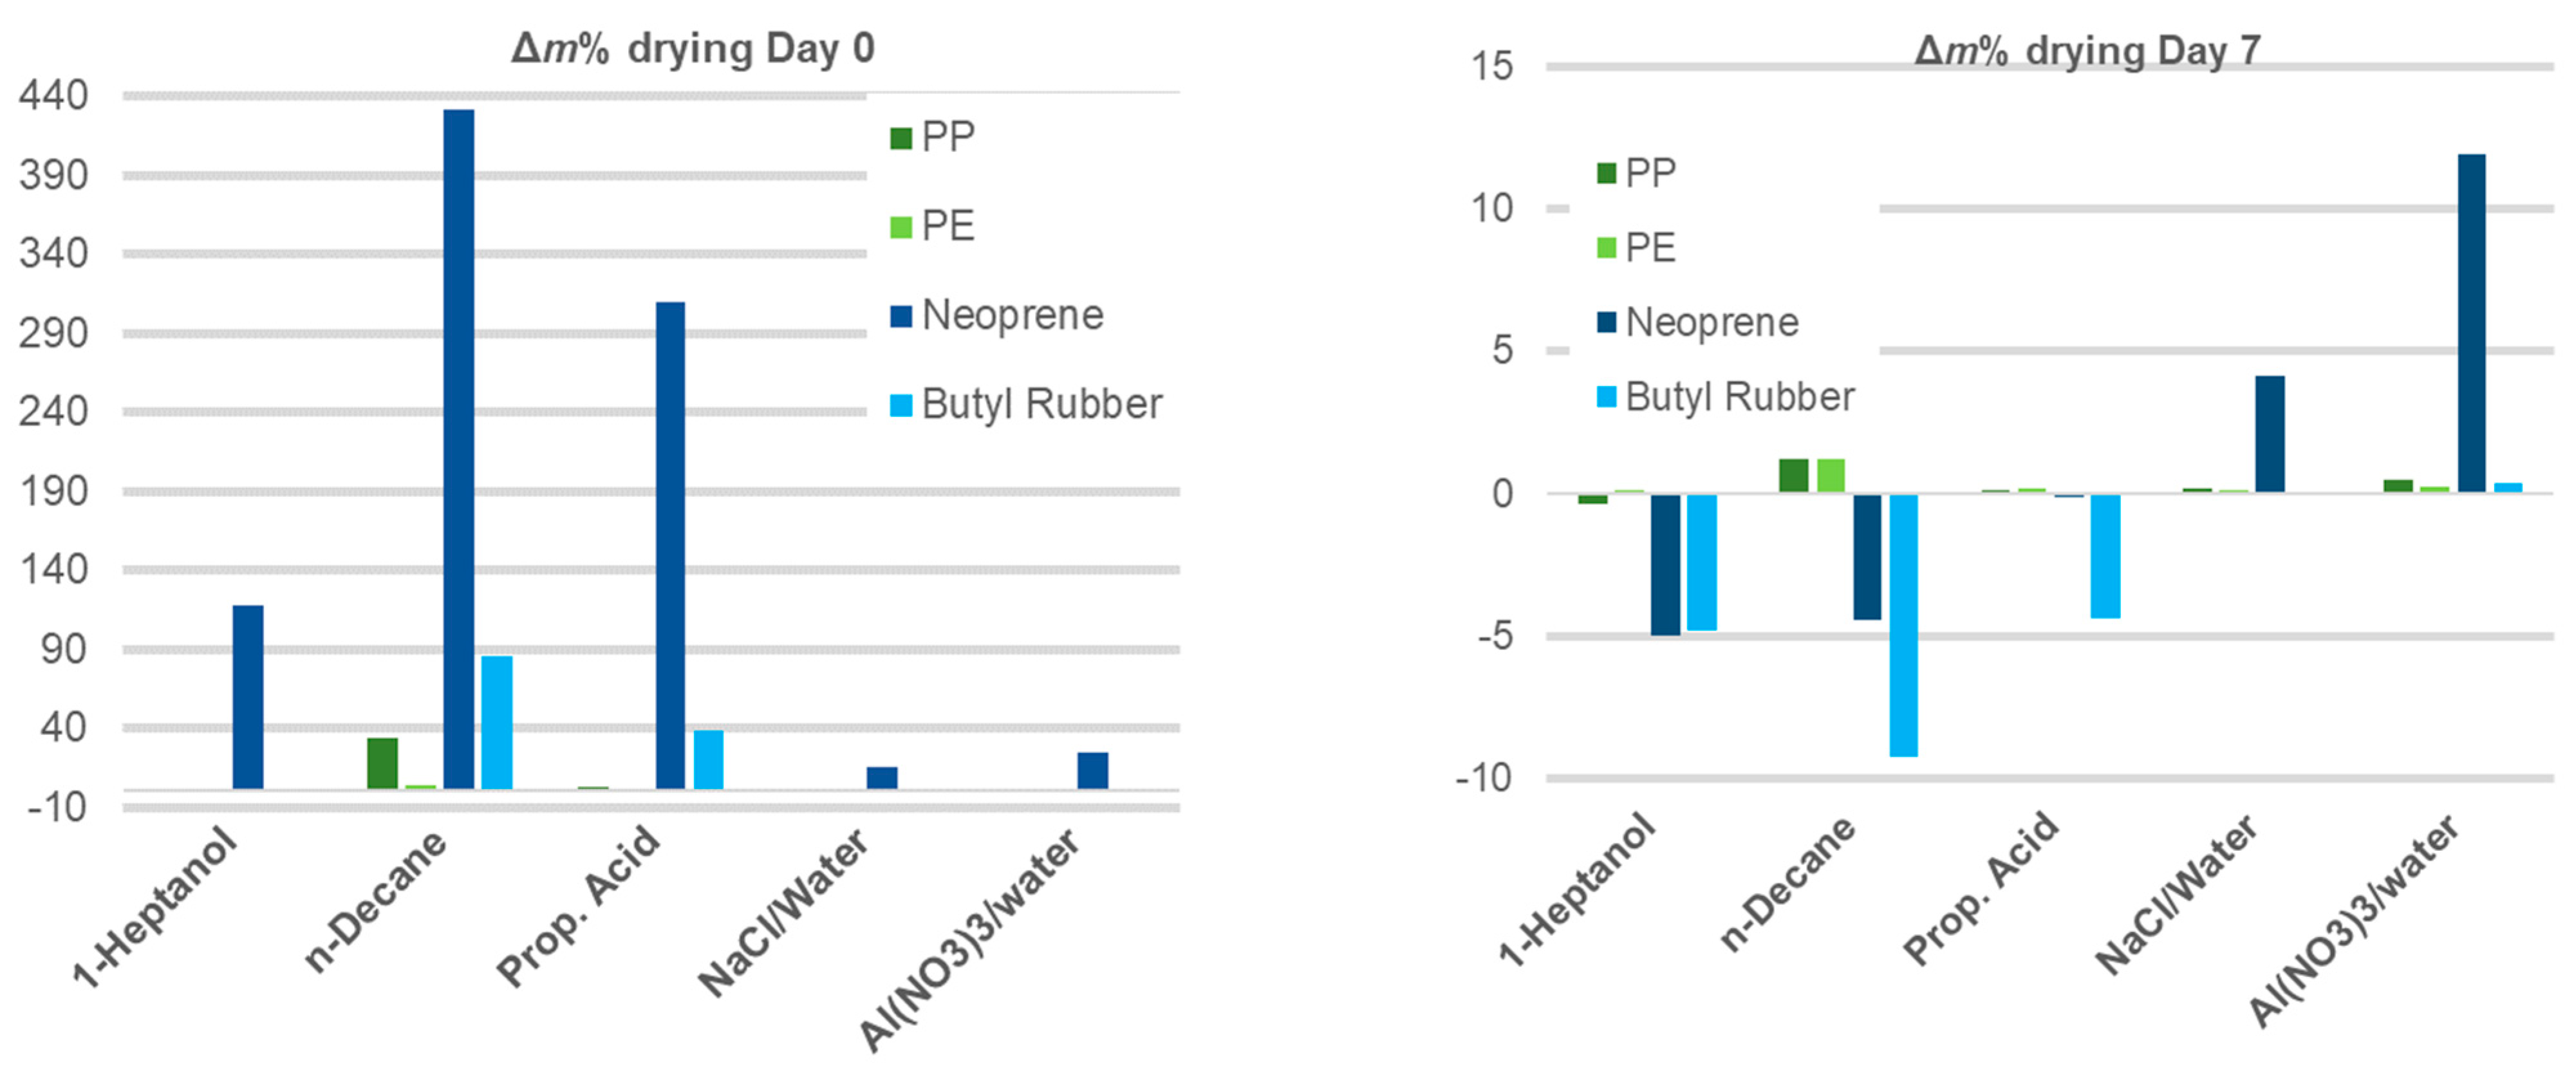
The results of the plastic samples immersed in the five PCMs are summarized in Figure 7 and are shown in more detail in Table 6. Figure 7 (left) shows the mass gain of each plastic sample directly after its extraction, rinsing and drying (day 0 after conclusion of the immersion test), which is directly correlated to the degree of uptake of the PCM by the polymer. Whereas small degrees of swelling can be acceptable, higher degrees can cause alteration of the thermomechanical properties of the polymer, pressure increase and also leakage of the PCM through the polymeric enclosure. Figure 7 (right) shows the sample mass gain/loss with respect to its initial mass after 7 days of drying. These results should indicate whether the swelling was reversible, and also whether extraction of soluble constituents took place.
On day 0 of drying, neoprene showed a very high mass uptake of the organic PCMs (118–431%) and a significant uptake of the inorganic ones (15–24%). It is therefore considered unsuitable for use in storage units especially with organic PCMs, as it would experience very high swelling. Butyl rubber showed a significant uptake of n-decane and propionic acid (38–85.5%) and it is therefore considered unsuitable for utilization with these PCMs. n-Decane also showed high migration in polypropylene, corresponding to a 34% mass gain of the PP sample, and therefore this combination of this polymer and PCM is also not advisable. The rest of the polymer/PCM combinations exhibited a low mass variation and are considered promising combinations for storage applications. Figure 7 (right) presents the mass variations of the same samples, 7 days after they were extracted from the immersion tests. Interestingly, the butyl rubber samples showed significant mass loss with respect to the original value (>4%) for the immersion test with all organic PCMs. This indicates removal of soluble constituents from the butyl rubber which could be observed at day 7, after the uptake of PCM in the polymeric samples has been reversed. This mass loss is considered significant and should be further investigated to determine its effects on the durability of the polymer. This effect highlights the importance of allowing for drying of the samples after immersion tests, to determine whether extraction occurred which was concealed by swelling. Similar effects were also observed for neoprene with n-decane and 1-heptanol where the high mass uptake observed at day 0 was completely reversed to reveal a significant mass loss. The significant mass gain of neoprene with the inorganic PCMs was also partially reversed but the final value remained positive and non-negligible (4–12%).

4. Discussion

Table 7 summarizes the results of the investigations conducted in this project and attempts to evaluate the PCMs with regard to their suitability as storage media in refrigeration-related latent heat storage units. All PCMs have weaker and stronger areas of performance and no ideal candidate exists. However, some candidates do stand out. The NaCl/water mixture presented the highest volumetric energy density, more than 30% higher than the second best candidate (Al(NO3)3/water), justifying its popularity in existing literature. Its biggest drawbacks are the relatively high degree of supercooling and the fact that pitting corrosion was observed in the immersion tests with aluminum. The former is expected to become less prominent when the PCM is utilized at higher, application-relevant volumes and, if necessary, it can be further reduced by addition of nucleating agents. The latter could lead to the exclusion of any aluminum components from the storage unit that could come in contact with the PCM. This is of course particularly relevant to heat exchangers, where aluminum is often the material of choice because of its low price, low weight, and good thermal conductivity. To circumvent this issue, other metals could be used, such as the more expensive and more thermally conducting copper. For lower temperature applications, Al(NO3)3/water 30.5 wt.% showed a high volumetric energy density but also a fairly high degree of supercooling and incompatibility with both aluminum and copper, which makes its implementation in a latent heat storage unit challenging. Further, n-decane presents a more straightforward candidate for this temperature range. With 41.4 kWh/m3, n-decane has a good energy density with a low degree of supercooling and very good compatibility with all materials except neoprene. As neoprene can be easily omitted or substituted in the storage unit, the lack of compatibility is not considered critical. Despite a higher degree of supercooling, propionic acid could also be a good organic alternative for refrigeration processes needing a slightly higher melting point, however the use of copper should be avoided in this case. Additionally, 1-heptanol is the least useful investigated candidate, with a relatively low measured energy density.
It is also of interest to compare the energy density of the proposed PCMs with the energy density of the ethylene glycol/water solutions which are often used as storage media in refrigeration applications. Assuming a refrigeration process at −20 °C with a 10 °C temperature difference and a 52 v/v.% ethylene glycol/water solution as sensible storage medium (assumed properties at −20 °C: spec. heat capacity: 3.11 kJ/kg·K; density: 1100 kg/m3), an energy density of 9.5 kWh/m3 can be calculated [31]. Even when neglecting the sensible heat contribution of the PCMs, the energy density of the three best performing PCMs is still more than four to eight times higher than that of the ethylene glycol/water mixture.

5. Conclusions

Latent heat storage for refrigeration processes is promising as an alternative to water/glycol-based storage due to their much higher energy densities (>4 times) which would lead to more compact and potentially more cost-effective storage. In this study, five PCMs were tested for their suitability in refrigeration applications. The focus was placed on obtaining reliable and comparable data for all important thermophysical properties of the PCMs to enable a fair comparison. Additionally, immersion tests were conducted to determine the compatibility of the PCM with commonly used metals and polymers.
The results of the investigations reveal some strengths and weaknesses of the five candidates. NaCl/water 23.3 wt.% stands out for its very high volumetric energy density and n-decane follows with a lower energy density but better compatibility with surrounding materials and better supercooling performance. Al(NO3)3/water 30.5 wt.% also showed a high energy density but the fairly high degree of supercooling and its incompatibility with the most popular heat exchanger materials make its implementation in a latent heat storage unit challenging.
While the measured densities were consistent with the ones reported in literature, some deviations were observed when comparing the measured enthalpies of fusion to the ones reported in literature. This highlights the importance of using consistent methodologies to determine thermophysical properties when the goal is to compare PCM performance.
In a next step, the thermal cycling and long-term stability of the PCMs should be investigated and a techno-economic analysis should be performed to enable a fair comparison of the PCMs with the state of the art water/glycol storage.

Author Contributions

Conceptualization, M.Z., A.S. and J.W.; methodology, R.Z., L.M., K.F., and D.O.; formal analysis, R.Z., L.M., A.S.; investigation, R.Z., L.M.; data curation, A.S.; writing—original draft preparation, A.S.; writing—review and editing, A.S., L.M., R.Z., J.H., D.O., K.F., M.Z. and J.W.; visualization, A.S.; supervision, M.Z., A.S. and J.W.; project administration, R.Z.; funding acquisition, M.Z., A.S. and J.W. All authors have read and agreed to the published version of the manuscript.

Funding

This work was conducted in the framework of the STOREF Project funded by Eurostars (Number E!12259 STOREF).

Institutional Review Board Statement

Not applicable.

Informed Consent Statement

Not applicable.

Data Availability Statement

Data available on request due to restrictions eg privacy or ethical.

Acknowledgments

The project was supported by Innosuisse and the Swiss Competence Centers for Energy Research- Storage of Electricity and Heat. We would like to thank Oliver Fellmann for contributing to the DSC and density measurements.

Conflicts of Interest

The authors declare no conflict of interest. The funders had no role in the design of the study; in the collection, analyses, or interpretation of data; in the writing of the manuscript, or in the decision to publish the results.

References

  1. Fleiter, T.; Steinbach, J.; Ragwitz, M. Mapping and Analyses of the Current and Future (2020–2030) Heating/Cooling Fuel Deployment (Fossil/Renewables)—Work Package 1: Final Energy Consumption for the Year 2012. 2016. Available online: https://ec.europa.eu/energy/studies/mapping-and-analyses-current-and-future-2020-2030-heatingcooling-fuel-deployment_en (accessed on 15 April 2020).
  2. Fleiter, T.; Steinbach, J.; Ragwitz, M. Mapping and Analyses of the Current and Future (2020–2030) Heating/Cooling Fuel Deployment (Fossil/Renewables)—Work Package 2: Assessment of the Technologies for the Year 2012. 2016. Available online: https://ec.europa.eu/energy/studies/mapping-and-analyses-current-and-future-2020-2030-heatingcooling-fuel-deployment_en (accessed on 15 April 2020).
  3. Vakiloroaya, V.; Samali, B.; Fakhar, A.; Pishghadam, K. A review of different strategies for HVAC energy saving. Energy Convers. Manag. 2014, 77, 738–754. [Google Scholar] [CrossRef]
  4. Zhu, K.; Li, X.; Campana, P.E.; Li, H.; Yan, J. Techno-economic feasibility of integrating energy storage systems in refrigerated warehouses. Appl. Energy 2018, 216, 348–357. [Google Scholar] [CrossRef]
  5. Arteconi, A.; Ciarrocchi, E.; Pan, Q.; Carducci, F.; Comodi, G.; Polonara, F.; Wang, R. Thermal energy storage coupled with PV panels for demand side management of industrial building cooling loads. Appl. Energy 2017, 185, 1984–1993. [Google Scholar] [CrossRef]
  6. Bakan, K.; Dincer, I.; Rosen, M.A. Exergoeconomic analysis of glycol cold thermal energy storage systems. Int. J. Energy Res. 2007, 32, 215–225. [Google Scholar] [CrossRef]
  7. Lavan, Z.; Thompson, J. Experimental study of thermally stratified hot water storage tanks. Sol. Energy 1977, 19, 519–524. [Google Scholar] [CrossRef]
  8. Oró, E.; Miró, L.; Barreneche, C.; Martorell, I.; Farid, M.M.; Cabeza, L.F. Corrosion of metal and polymer containers for use in PCM cold storage. Appl. Energy 2013, 109, 449–453. [Google Scholar] [CrossRef]
  9. Oró, E.; De Gracia, A.; Castell, A.; Farid, M.; Cabeza, L. Review on phase change materials (PCMs) for cold thermal energy storage applications. Appl. Energy 2012, 99, 513–533. [Google Scholar] [CrossRef] [Green Version]
  10. Joybari, M.M.; Haghighat, F.; Moffat, J.; Sra, P. Heat and cold storage using phase change materials in domestic refrigeration systems: The state-of-the-art review. Energy Build. 2015, 106, 111–124. [Google Scholar] [CrossRef]
  11. Li, G.; Hwang, Y.; Radermacher, R.; Chun, H.-H. Review of cold storage materials for subzero applications. Energy 2013, 51, 1–17. [Google Scholar] [CrossRef]
  12. Suamir, I.N.; Rasta, I.M.; Tsamos, K.M. Development of Corn-Oil Ester and Water Mixture Phase Change Materials for Food Refrigeration Applications. Energy Procedia 2019, 161, 198–206. [Google Scholar] [CrossRef]
  13. Konuklu, Y.; Şahan, N.; Paksoy, H. 2.14 Latent Heat Storage Systems. Compr. Energy Syst. 2018, 2, 396–434. [Google Scholar]
  14. Schroder, J.; Gawron, K. Latent heat storage. Int. J. Energy Res. 1981, 5, 103–109. [Google Scholar] [CrossRef]
  15. Kenisarin, M.M. Thermophysical properties of some organic phase change materials for latent heat storage. A review. Sol. Energy 2014, 107, 553–575. [Google Scholar] [CrossRef]
  16. Müller, L.; Rubio-Pérez, G.; Bach, A.; Muñoz-Rujas, N.; Aguilar, F.; Worlitschek, J. Consistent DSC and TGA Methodology as Basis for the Measurement and Comparison of Thermo-Physical Properties of Phase Change Materials. Materials 2020, 13, 4486. [Google Scholar] [CrossRef] [PubMed]
  17. Cabeza, L.F.; Illa, J.; Roca, J.; Badia, F.; Mehling, H.; Hiebler, S.; Ziegler, F. Immersion corrosion tests on metal-salt hydrate pairs used for latent heat storage in the 32 to 36 °C temperature range. Mater. Corros. 2001, 52, 140–146. [Google Scholar] [CrossRef]
  18. Mehling, H.; Cabeza, L.; Hippeli, S.; Hiebler, S. PCM-module to improve hot water heat stores with stratification. Renew. Energy 2003, 28, 699–711. [Google Scholar] [CrossRef]
  19. García-Romero, A.; Delgado, A.; Urresti, A.; Martín, K.; Sala, J. Corrosion behaviour of several aluminium alloys in contact with a thermal storage phase change material based on Glauber’s salt. Corros. Sci. 2009, 51, 1263–1272. [Google Scholar] [CrossRef]
  20. ASTM. ASTM G 31-72—Standard Practise for Laboratory Immersion Corrosion Testing of Metals; ASTM International: West Conshohocken, PA, USA, 2004. [Google Scholar]
  21. International Organization for Standardization. Korrosion von Metallen und Legierungen—Entfernen von Korrosionsprodukten von Korrosionsprobekörpern (ISO 8407: 2009); SNV Schweizerische Normen: Winterthur, Switzerland, 2014. [Google Scholar]
  22. ASTM D543. Standard Practices for Evaluating the Resistance of Plastics to Chemical Reagents; No. Reapproved 2013; ASTM International: West Conshohocken, PA, USA, 2015; Volume i, pp. 3–9. [Google Scholar]
  23. Al-Jimaz, A.S.; Al-Kandary, J.A.; Abdul-Latif, A.-H.M. Densities and viscosities for binary mixtures of phenetole with 1-pentanol, 1-hexanol, 1-heptanol, 1-octanol, 1-nonanol, and 1-decanol at different temperatures. Fluid Phase Equilibria 2004, 218, 247–260. [Google Scholar] [CrossRef]
  24. Singh, S.; Bahadur, I.; Redhi, G.G.; Ebenso, E.E.; Ramjugernath, D. Density and speed of sound of 1-ethyl-3-methylimidazolium ethyl sulphate with acetic or propionic acid at different temperatures. J. Mol. Liq. 2014, 199, 518–523. [Google Scholar] [CrossRef]
  25. Simion, A.I.; Grigoraş, C.G.; Roşu, A.M.; Gavrilă, L. Mathematical modelling of density and viscosity of nacl aqueous solutions. J. Agrolimentary Process. Technol. 2015, 21, 41–52. [Google Scholar]
  26. Rathgeber, C.; Miró, L.; Cabeza, L.F.; Hiebler, S. Measurement of enthalpy curves of phase change materials via DSC and T-History: When are both methods needed to estimate the behaviour of the bulk material in applications? Thermochim. Acta 2014, 596, 79–88. [Google Scholar] [CrossRef]
  27. Kabelac, S.; Kind, M.; Martin, H.; Mewes, D.; Schaber, K.; Stephan, P. VDI-Wärmeatlas, 11th ed.; Springer: Berlin/Heidelberg, Germany, 2013. [Google Scholar]
  28. Acree, W.E. Thermodynamic properties of organic compounds: Enthalpy of fusion and melting point temperature compilation. Thermochim. Acta 1991, 189, 37–56. [Google Scholar] [CrossRef]
  29. Martin, J.; Andon, R. Thermodynamic properties of organic oxygen compounds Part LII. Molar heat capacity of ethanoic, propanoic, and butanoic acids. J. Chem. Thermodyn. 1982, 14, 679–688. [Google Scholar] [CrossRef]
  30. Browne, M.C.; Boyd, E.; McCormack, S.J. Investigation of the corrosive properties of phase change materials in contact with metals and plastic. Renew. Energy 2017, 108, 555–568. [Google Scholar] [CrossRef]
  31. Verein Deutscher Ingenieure. VDI-Wärmeatlas; Verein Deutscher Ingenieure: Düsseldorf, Germany, 1991. [Google Scholar]
Figure 1. Example of DSC melting curves resulting from measurements with (a) 10 K/min to determine the phase change enthalpy and (b) 2 K/min to determine phase change temperature. In both cases, all three repetitions are plotted in the same graph, showing the very consistent melting behavior that n-decane presented.
Energies 14 03033 g001
Figure 2. Photograph of metallic (1: aluminum, 2: copper, 3: copper and aluminum) samples which were used for material compatibility experiments.
Energies 14 03033 g002
Figure 3. Photograph of polymeric samples (1: polypropylene. 2: neoprene. 3: polyethylene. 4: butyl rubber) which were used for the material compatibility experiments.
Energies 14 03033 g003
Figure 4. DSC cooling curves performed with 2 K/min for NaCl/water 23.3 wt.% revealing multiple crystallization peaks.
Energies 14 03033 g004
Figure 5. Three repetitions of heating and cooling curves of Al(NO3)3/water 30.5 wt.% as they were measured by DSC at 2 K/min.
Energies 14 03033 g005
Figure 6. Summary of final corrosion rates calculated after 42 days of immersion tests, shown on a logarithmic scale.
Energies 14 03033 g006
Figure 7. Mass gain% 0 days (left) and 7 days (right) after extraction from the liquid PCM and drying at room temperature. Note that the two figures have significantly different axis scales.
Energies 14 03033 g007
Table 1. Materials used for PCM analysis.
SubstanceFormulaProducerCAS-No°AmountPurity
1-HeptanolCH3(CH2)6OHSigma Aldrich111-70-6250 mL98%
n-Decane C10H22Roth124-18-5500 mL99%
Propionic acidC3H6O2Sigma Aldrich79-09-4500 ml99.5%
Sodium chlorideNaClSigma Aldrich7647-14-5250 g99.5%
Aluminum nitrate nonahydrateAl(NO3)3·9H2OSigma Aldrich7784-27-2100 g98%
Table 2. Densities determined experimentally in the present study (at 25.9 °C) and reported in literature.
1-Heptanoln-DecanePropionic AcidNaCl/Water 23.3 wt.%Al(NO3)3/Water 30.5 wt.%
ρl, exp. kg/L0.8245 ± 0.00180.7351 ± 0.00060.9940 ± 0.00051.1754 ± 0.00051.2963 ± 0.0000
ρl, Lit. Kg/L0.819 (25 °C) [23] 0.73 (20 °C) [14]0.98 (25 °C) [24]1.174 (20 °C) [25]1.283 (liquid) [15]
Table 3. Measured phase change temperatures and enthalpies of fusion.
Tm, Onset
°C
Tm, Peak
°C
Tm, Lit.
°C
Tc, Onset
°C
Tc, Peak
°C
Super-Cooling
°C
ΔHm
kJ/kg
ΔHm, lit.
kJ/kg
ΔHm,vol.
kJ/L
1-Heptanol−35.2 ± 0.43−32.81 ± 0.23−34.1 [27]−45.38 ± 0.37−45.83 ± 0.3410.18 ± 0.57116.26 ± 1.07156.4 [27]95.86 ± 0.912
n-Decane−30.38 ± 0.00−27.91 ± 0.03−29.7 [28]−35.86 ± 0.30−36.03 ± 0.295.78 ± 0.30202.79 ± 0.45202 [28]149.07 ± 0.388
Propionic acid−23.46 ± 0.03−20.88 ± 0.01−20.5 [29]−40.89 ± 0.2−40.99 ± 0.217.43 ± 0.20150.45 ± 0.45143.9 [29]149.55 ± 0.447
NaCl/water−20.94 ± 4.07−16.80 ± 0.05−21.2 [9]−38.36 ± 7.00−39.20 ± 1.9817.42 ± 8.10256.98 ± 0.18233 [9]302.05 ± 0.212
Al(NO3)3/water−30.38 ± 0.45−25.9 ± 0.12−30.6 [9]−53.93 ±0.06−55.76 ±0.8423.55 ± 0.45174.22 ± 0.55131.5 [9]225.84 ± 0.71
Table 4. Summary of experimental results for the material compatibility tests with metals.
Sample TypeWeight Initial (mg)Surface Area, Initial (mm2)Mass Loss (mg), MechanicalMass Loss %, MechanicalMass Loss (mg), ChemicalMass Loss %, Chemical
1-Heptanolonly Al95.4714.10.10.10.12800.134
only Cu809.4741.90.10.00.18480.023
Al mix83.2623.70.10.20.16910.203
Cu mix804.7737.60.20.00.28970.036
n-Decaneonly Al72.9546.50.10.1--
only Cu749.4687.70.10.00.20.023
Al mix72.1540.40.10.1--
Cu mix785.9720.70.10.00.20.023
Propionic acidonly Al81.4610.00.10.20.20.192
only Cu839.6769.124.83.0--
Al mix84.6633.70.20.2--
Cu mix862.6789.917.02.0--
NaCl/ wateronly Al84.1630.40.10.10.20.283
only Cu796.9730.64.60.65.70.721
Al mix66.8501.21.21.82.33.422
Cu mix740.1679.30.60.10.60.083
Al(NO3)3/ wateronly Al82.9620.982.9 *100.0 *--
only Cu856.9784.895.711.2--
Al mix69.4520.369.4 *100.0 *--
Cu mix818.5750.199.712.2--
* In these cases, the metallic samples had been completely destroyed before the end of the experiment. The corrosion rates would therefore be higher than the ones reported here.
Table 5. Guide for interpretation of corrosions rates used in literature (based on [30]).
Corrosion Rate mg/cm2/yrRecommendation
>1000Completely destroyed within days
100–999Not recommended for service greater than one month
50–99Not recommended for service greater than one year
10–49Caution recommended
<9.9Recommended for long term service
Table 6. Mass gain of polypropylene (PP), polyethylene (PE), neoprene and butyl rubber samples after 7 days of immersion in the five different PCMs and after drying in laboratory conditions for 0, 1, and 7 days.
Mass Gain%
PolymerDays of Drying1-Heptanoln-DecaneProp. AcidNaCl/Water Al(NO3)3/Water
PP01.6234.313.320.481.14
10.0310.691.660.501.08
7−0.371.240.120.170.46
PE00.663.460.630.370.36
10.162.781.040.590.61
70.111.200.200.110.27
Neopre-ne0117.74430.95309.2415.2424.04
121.22−1.415.168.0319.94
7−4.96−4.42−0.104.1611.89
Butylrubber0−0.4885.4838.29−0.120.46
1−2.12−2.1817.560.920.94
7−4.81−9.24−4.38−0.020.38
Table 7. Summary of PCM properties determined in the framework of this project. The cell color indicates the suitability of each determined property for an application in a latent heat storage unit. Red: not suitable; orange: possibly not suitable; white: suitable under restrictions; light green: suitable with good performance; dark green: suitable with very good performance. The values reported here are mean values. The standard deviations are reported in previous tables.
Thermophysical PropertiesCorrosion Rate Compatibility with Polymers
(mg/cm2 yr)
Δh (kWh/m3)Tm (°C)ΔT (°C)AlCuAl (mix)Cu (mix)PPPENeoprenButyl Rubber
1-Heptanol26.6−35.210.20.20.20.20.3no swel./ low extr.no swel./ no extr.medium swel./ high extr.no swel./ high extr.
n-Decane41.4−30.45.80.10.20.10.2low swel./ no extr.no swel./ no extr.high swel./ high extr.medium swel./ high extr.
Prop. Acid41.5−23.4617.40.224.50.216.4no swel./ no extr.no swel./ no extr.high swel./ no extr.medium swel./ high extr.
NaCl/ H2O83.9−20.9417.40.3 *6.84 *0.8no swel./ no extr.no swel./ no extr.low swel./ no extr.no swel./ no extr.
Al(NO3)3/ H2O62.73−30.3823.55101.592.7101.4101.1no swel./ no extr.no swel./ no extr.low swel./ no extr.low swel./ no extr.
* In these cases, while the corrosion rate was acceptable, pitting corrosion was observed. Further test would be required to determine compatibility.
Publisher’s Note: MDPI stays neutral with regard to jurisdictional claims in published maps and institutional affiliations.