
Improvement of AEP Predictions with Time for Swedish Wind Farms


Abstract
:1. Introduction
2. Wind Turbine Production Data
3. Methods
3.1. Normalization to Wind Turbine Availability, Wind Turbine Performance Decline and Transformer Efficiency
3.2. Wind Index Correction and Comparison with Predicted AEP
3.3. Data Exclusion
4. Results and Discussion
5. Conclusions
Author Contributions
Funding
Institutional Review Board Statement
Informed Consent Statement
Data Availability Statement
Acknowledgments
Conflicts of Interest
References
- Enevoldsen, P. Onshore wind energy in Northern European forests: Reviewing the risks. Renew. Sustain. Energy Rev. 2016, 60, 1251–1262. [Google Scholar] [CrossRef]
- Möllerström, E. Wind Turbines from the Swedish Wind Energy Program and the Subsequent Commercialization Attempts—A Historical Review. Energies 2019, 12, 690. [Google Scholar] [CrossRef] [Green Version]
- Energimyndigheten, Energiläget i Siffror 2021. 2021. Available online: http://www.energimyndigheten.se/statistik/energilaget/ (accessed on 30 March 2021).
- IEC 61400-12-1: Wind Turbines Part 12-1: Power Performance Measurements of Electricity Producing Wind Turbines, 1st ed.; The International Electrotechnical Commission (IEC): Geneva, Switzerland, 2005; Volume 12.
- Lackner, M.A.; Rogers, A.L.; Manwell, J.F. Uncertainty analysis in MCP-based wind resource assessment and energy production estimation. J. Sol. Energy Eng. 2008, 130. [Google Scholar] [CrossRef]
- Wacker, B.; Seebaß, J.V.; Schlüter, J.C. A modular framework for estimating annual averaged power output generation of wind turbines. Energy Convers. Manag. 2020, 221, 113149. [Google Scholar] [CrossRef]
- Nielson, J.; Bhaganagar, K.; Meka, R.; Alaeddini, A. Using atmospheric inputs for Artificial Neural Networks to improve wind turbine power prediction. Energy 2020, 190, 116273. [Google Scholar] [CrossRef]
- Neshat, M.; Nezhad, M.M.; Abbasnejad, E.; Mirjalili, S.; Groppi, D.; Heydari, A.; Tjernberg, L.B.; Garcia, D.A.; Alexander, B.; Shi, Q. Wind turbine power output prediction using a new hybrid neuro-evolutionary method. Energy 2021, 229, 120617. [Google Scholar] [CrossRef]
- DNV GL Energy Production Assessment Validation; DNV GL—Energy: Bristol, UK, 2019.
- Bleeg, J.; Purcell, M.; Ruisi, R.; Traiger, E. Wind farm blockage and the consequences of neglecting its impact on energy production. Energies 2018, 11, 1609. [Google Scholar] [CrossRef] [Green Version]
- Ju, B.; Jeong, J.; Ko, K. Assessment of Wind Atlas Analysis and Application Program and computational fluid dynamics estimates for power production on a Jeju Island wind farm. Wind Eng. 2016, 40, 59–68. [Google Scholar] [CrossRef] [Green Version]
- Han, S.; Gao, L.; Liu, Y.; Yang, W. Post evaluation of wind resource assessment and micro-siting. J. Power Energy Eng. 2014, 2, 288–296. [Google Scholar] [CrossRef]
- Mortensen, N.G.; Nielsen, M.; Jørgensen, H.E. Comparison of Resource and Energy Yield Assessment Procedures 2011–2015: What Have we Learned and What Needs to be Done? EWEA Annual Conference and Exhibition 2015; European Wind Energy Association (EWEA): Brussels, Belgium, 2015. [Google Scholar]
- Murcia, J.P.; Réthoré, P.-E.; Hansen, K.S.; Natarajan, A.; Sørensen, J.D. A New Method to Estimate the Uncertainty of AEP of Offshore Wind Power Plants Applied to Horns Rev 1; EWEA Annual Conference and Exhibition 2015; European Wind Energy Association (EWEA): Brussels, Belgium, 2015; pp. 161–165. [Google Scholar]
- Jung, S.; Vanli, O.A.; Kwon, S.-D. Wind energy potential assessment considering the uncertainties due to limited data. Appl. Energy 2013, 102, 1492–1503. [Google Scholar] [CrossRef]
- Rodríguez, O.; del Rio, J.A.; Jaramillo, O.A.; Martínez, M. Wind power error estimation in resource assessments. PLoS ONE 2015, 10, e0124830. [Google Scholar] [CrossRef] [Green Version]
- Möllerström, E.; Lindholm, D. Evaluation of AEP Predictions for Commercial Wind Farms in Sweden. Appl. Sci. 2020, 10, 7995. [Google Scholar] [CrossRef]
- Vindstat Database. Available online: http://www.vindstat.nu/ (accessed on 9 June 2021).
- Olauson, J.; Edström, P.; Rydén, J. Wind turbine performance decline in Sweden. Wind Energy 2017, 20, 2049–2053. [Google Scholar] [CrossRef]
- Staffell, I.; Green, R. How does wind farm performance decline with age? Renew. Energy 2014, 66, 775–786. [Google Scholar] [CrossRef] [Green Version]
- Germer, S.; Kleidon, A. Have wind turbines in Germany generated electricity as would be expected from the prevailing wind conditions in 2000-2014? PLoS ONE 2019, 14, e0211028. [Google Scholar] [CrossRef]
- Hamilton, S.D.; Millstein, D.; Bolinger, M.; Wiser, R.; Jeong, S. How does wind project performance change with age in the United States? Joule 2020, 4, 1004–1020. [Google Scholar] [CrossRef]
- Byrne, R.; Astolfi, D.; Castellani, F.; Hewitt, N.J. A Study of Wind Turbine Performance Decline with Age through Operation Data Analysis. Energies 2020, 13, 2086. [Google Scholar] [CrossRef] [Green Version]
- Astolfi, D.; Byrne, R.; Castellani, F. Analysis of Wind Turbine Aging through Operation Curves. Energies 2020, 13, 5623. [Google Scholar] [CrossRef]
- Astolfi, D.; Byrne, R.; Castellani, F. Estimation of the Performance Aging of the Vestas V52 Wind Turbine through Comparative Test Case Analysis. Energies 2021, 14, 915. [Google Scholar] [CrossRef]
- Kim, H.-G.; Kim, J.-Y. Analysis of Wind Turbine Aging through Operation Data Calibrated by LiDAR Measurement. Energies 2021, 14, 2319. [Google Scholar] [CrossRef]
- Carta, J.A.; Velázquez, S.; Cabrera, P. A review of measure-correlate-predict (MCP) methods used to estimate long-term wind characteristics at a target site. Renew. Sustain. Energy Rev. 2013, 27, 362–400. [Google Scholar] [CrossRef]
- Zhang, M.H. Wind Resource Assessment and Micro-Siting: Science and Engineering; John Wiley & Sons: Singapore, 2015. [Google Scholar]
- Olauson, J. ERA5: The new champion of wind power modelling? Renew. Energy 2018, 126, 322–331. [Google Scholar] [CrossRef] [Green Version]


| No Data Exclusion | with Data Exclusion | |
|---|---|---|
| Wind turbines | 2083 | 1723 |
| Total capacity (GW) | 3.28 | 2.52 |
| Observations (months) | 235,903 | 132,568 |
| Result | Data | ||||
|---|---|---|---|---|---|
| Error (%) | Turbines | Power (MW) | Observations | ||
| All data | 13.0 | 1723 | 2524 | 132,568 | |
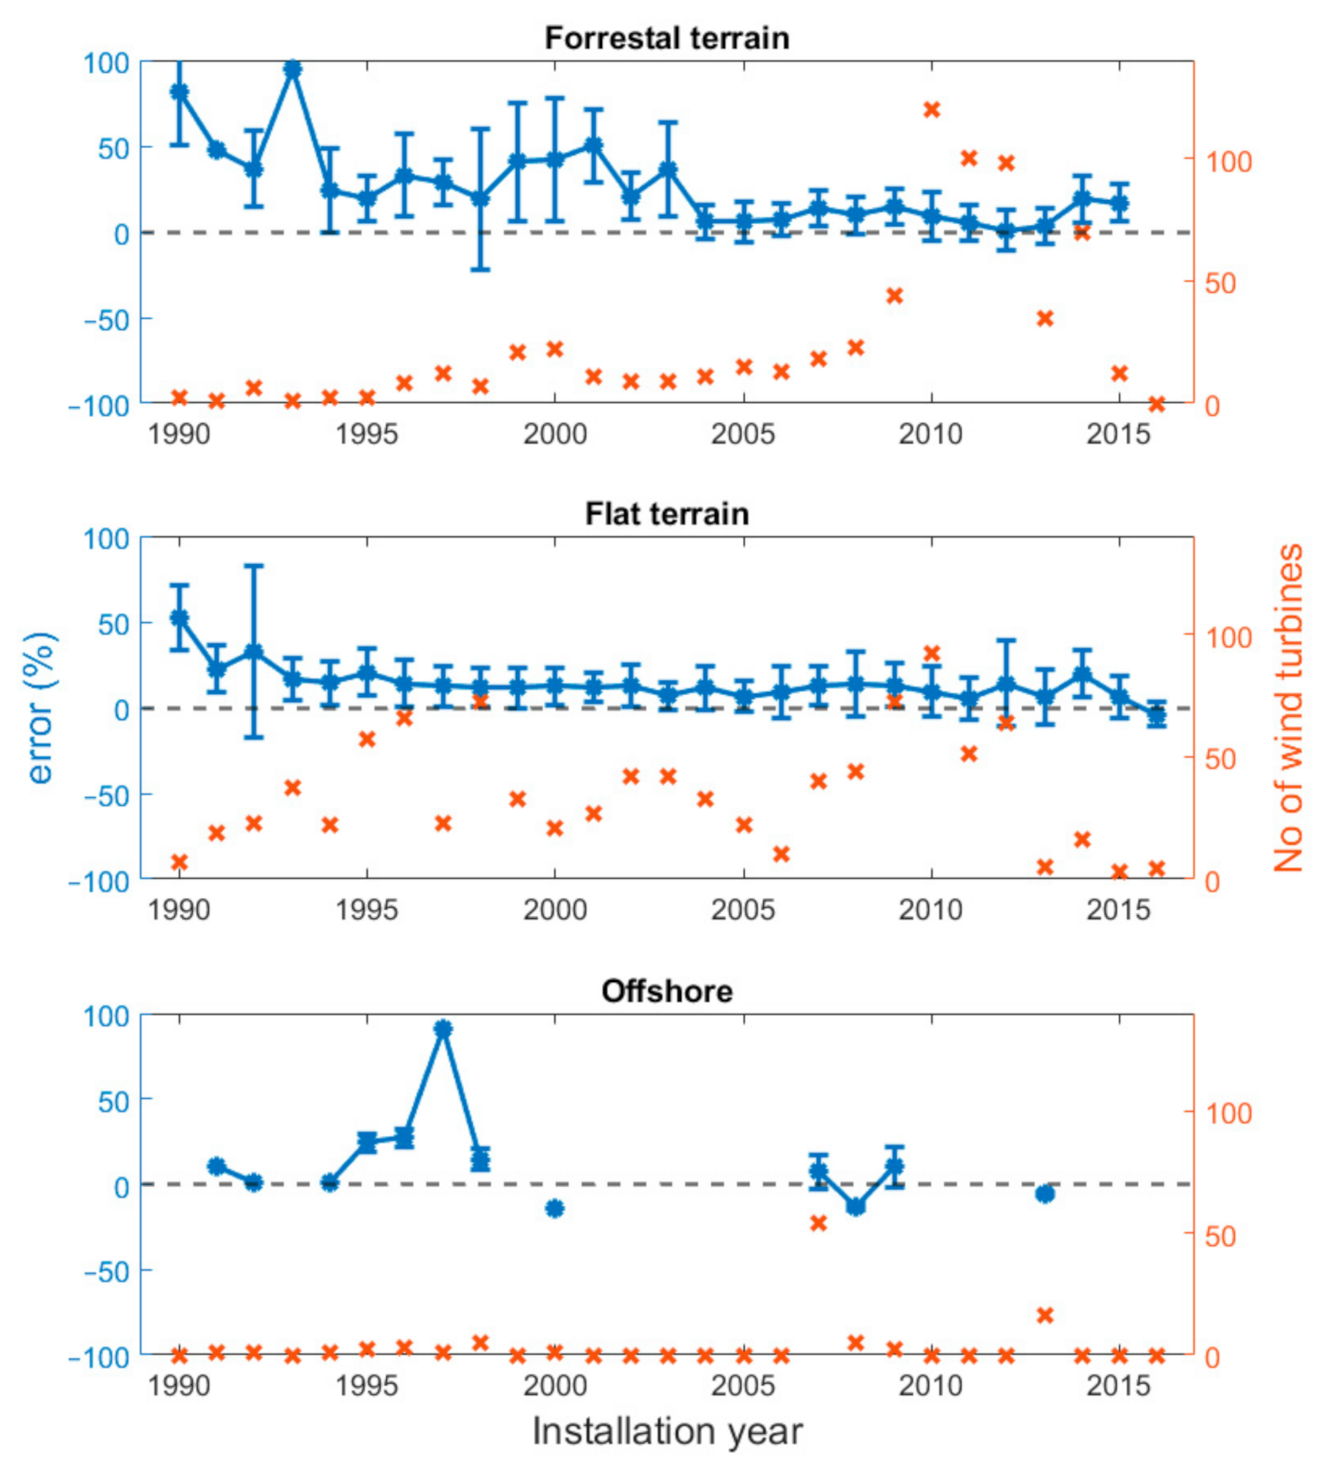
| Terrain | Flat | 13.4 | 954 | 1065 | 84,388 |
| Forestall | 13.2 | 677 | 1263 | 41,473 | |
| Offshore | 6.1 | 92 | 196 | 6707 | |
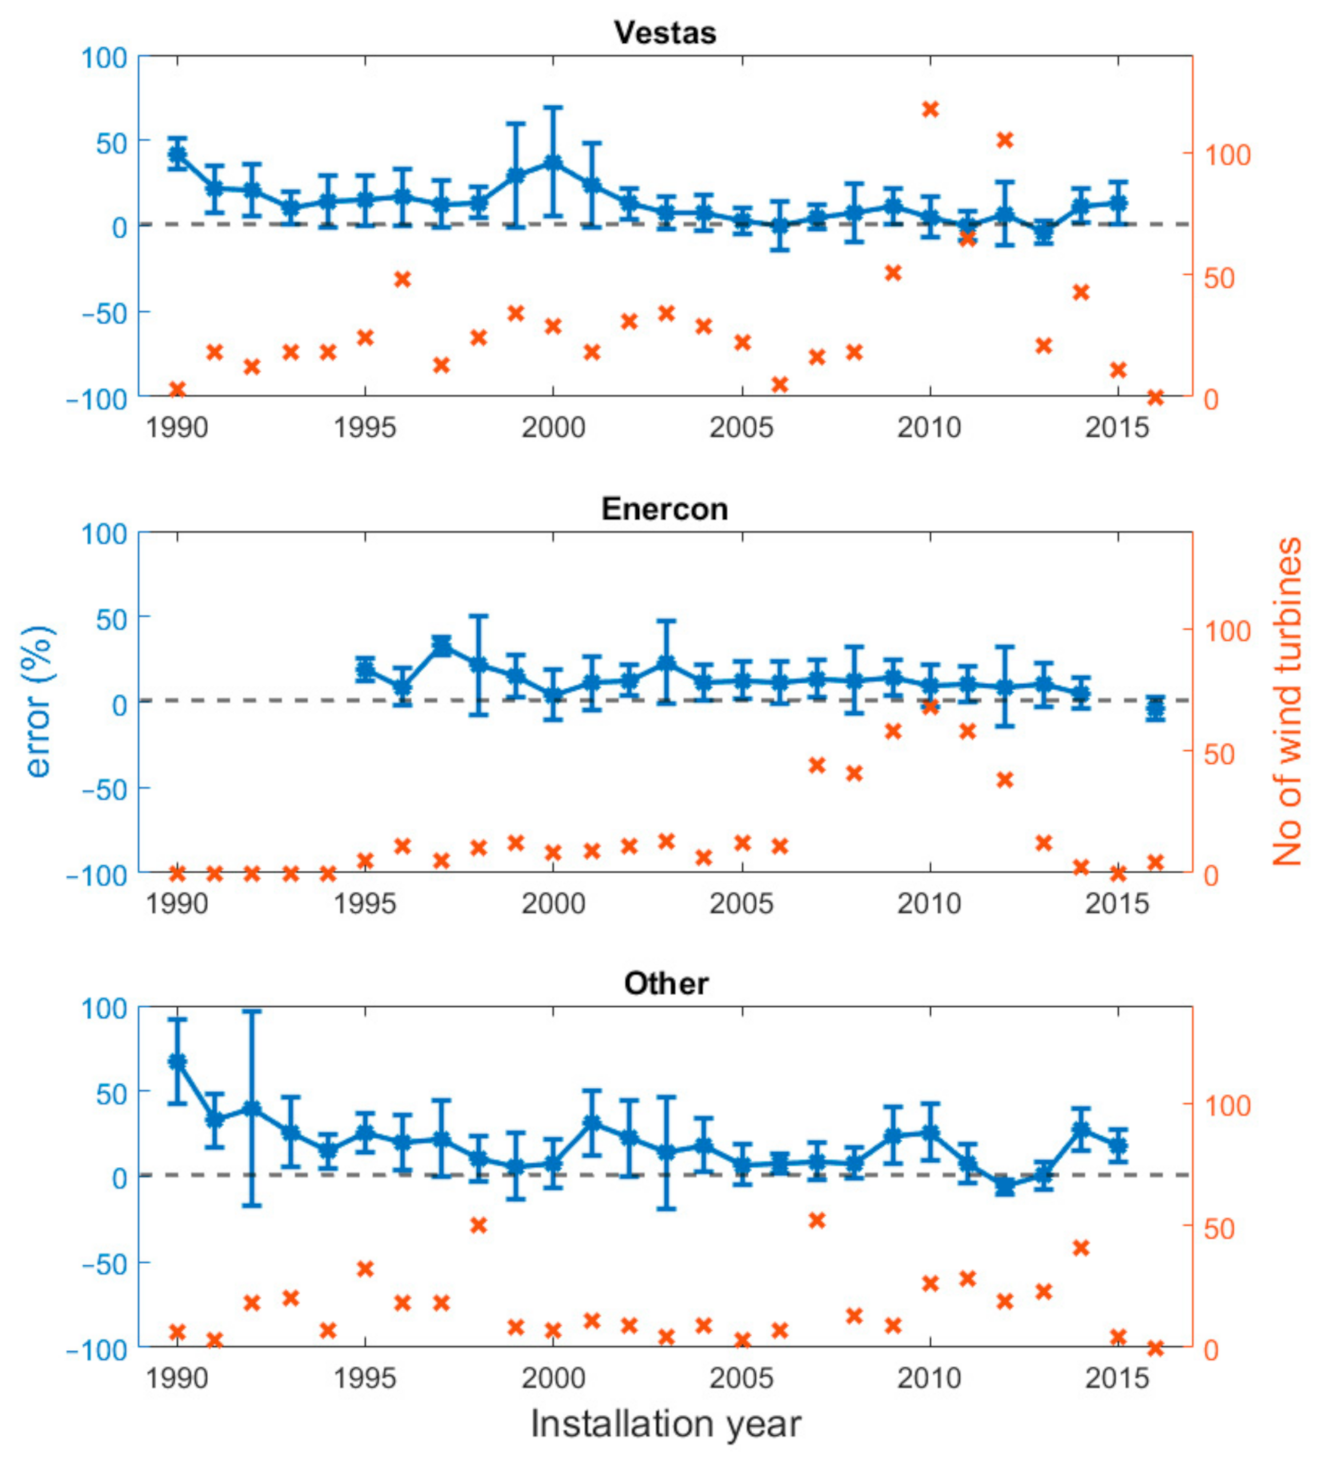
| Manuf. | Vestas | 11.1 | 834 | 1221 | 67,643 |
| Enercon | 12.1 | 441 | 652 | 37,544 | |
| Other | 17.3 | 448 | 651 | 37,544 | |
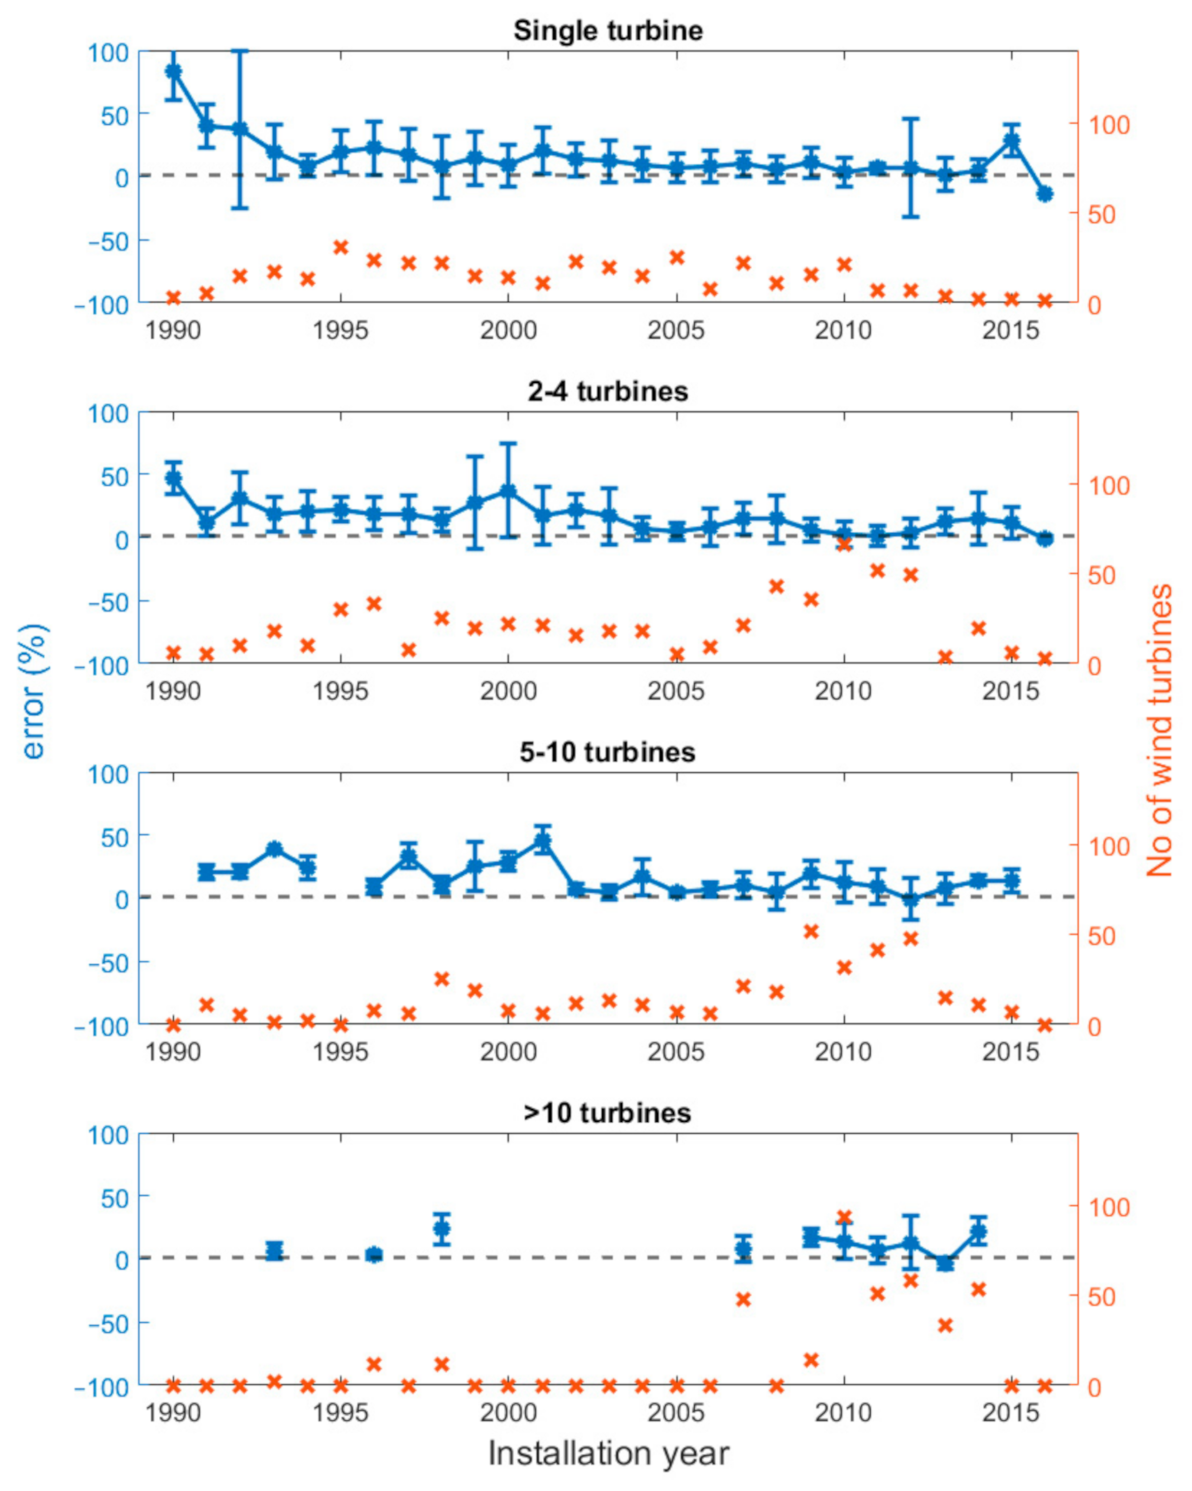
| Farm size | Single | 14.3 | 380 | 297 | 34,035 |
| 2–4 | 13.2 | 579 | 728 | 49,248 | |
| 5–10 | 12.5 | 388 | 648 | 29,577 | |
| >10 | 11.8 | 376 | 850 | 19,708 | |
| Install. Decade | 1990s | 19.8 | 435 | 199 | 43,865 |
| 2000s | 13.2 | 590 | 794 | 52,876 | |
| 2010s | 8.2 | 689 | 1529 | 35,583 | |
Publisher’s Note: MDPI stays neutral with regard to jurisdictional claims in published maps and institutional affiliations. |
© 2021 by the authors. Licensee MDPI, Basel, Switzerland. This article is an open access article distributed under the terms and conditions of the Creative Commons Attribution (CC BY) license (https://creativecommons.org/licenses/by/4.0/).
Share and Cite
Möllerström, E.; Gregory, S.; Sugathan, A. Improvement of AEP Predictions with Time for Swedish Wind Farms. Energies 2021, 14, 3475. https://doi.org/10.3390/en14123475
Möllerström E, Gregory S, Sugathan A. Improvement of AEP Predictions with Time for Swedish Wind Farms. Energies. 2021; 14(12):3475. https://doi.org/10.3390/en14123475
Chicago/Turabian StyleMöllerström, Erik, Sean Gregory, and Aromal Sugathan. 2021. "Improvement of AEP Predictions with Time for Swedish Wind Farms" Energies 14, no. 12: 3475. https://doi.org/10.3390/en14123475