1. Introduction
For many decades, both industry and population growth have led to an increase in global energy consumption [
1,
2]. Access to energy, especially cheaper sources, is one of the most important factors that influences the economic development of countries and social welfare as well as mitigates the effects of energy poverty [
3]. The consequences of this global dynamic economic development, in most countries based on energy obtained from conventional sources, are negative changes in the natural environment [
4].
A chance to improve this situation is the implementation of the idea of sustainable economic development in the whole world. This also applies to energy, as one of the pillars of this development [
5]. Many countries have noticed that a modern energy system means a transition to non-carbon, renewable energy sources (RES) that enable further economic development without such a negative impact on the environment. Both RES and biofuels also contribute to energy security through independence from fossil fuel markets and savings [
6]. It is a key element of economic policy. The variety of RES means that almost every country has the possibility of either partial or complete dependence on conventional energy resources. Therefore, also from the geopolitical point of view, the development of renewable energy is considered to have numerous advantages.
The unquestionable leader in the energy transition process is the European Union (EU). Here, the contribution of RES to savings related to the import of fossil fuels in 2015 amounted to approximately EUR 15 billion. It is estimated that in 2030, it should be as much as EUR 58 billion [
7]. This is due to the energy policy pursued by the EU. As early as in 2001, the EU adopted Directive 2001/77/EC [
8], which requires each Member State to take appropriate measures to achieve a specific indicative target of RES-generated electricity. At that time, the target was to achieve renewable energy consumption at the level of 12% with an indicative 22% share of electricity produced from RES by 2010. The next measure was Directive 2003/30/EC [
9], aimed at promoting the use of biofuels in transport and other renewable fuels (5.75% share of biofuels in transport fuel consumption). Pursuant to the next Directive 2009/28/EC [
10], the EU countries were supposed to increase the share of energy obtained from RES in their total energy consumption. The European climate and energy package contained objectives that were to be achieved by 2020. These targets included a 20% reduction in EU greenhouse gas emissions below levels reported in 1990, increasing the share of energy produced from RES to 20% and improving energy efficiency by 20%. In addition, by the end of 2020, at least 10% of final energy consumption in transport was to come from renewable energy sources. At the end of 2014, the European Council adopted and then, in December 2018, revised targets under which it undertook to achieve by 2030 a reduction of at least 40% in greenhouse gas emissions versus 1990 levels and an increase to 32% of the share of renewable energy in all sources of energy consumed throughout the European community [
11]. Other breakthrough solutions were proposed by the European Commission and presented at the UN COP25 climate summit in Madrid (Spain) [
12]. They include a new, pioneering European climate strategy called the European Green Deal [
13]. According to this strategy, the EU’s economy is to become a "zero-emission", i.e., climate-neutral economy by 2050. In turn, by 2030, carbon dioxide (CO2) emissions are to be reduced by 50% (plans assume even a 55% decrease) versus its emissions in 1990 [
13]. These assumptions are more ambitious than those adopted at the UN climate summit COP24, which took place in 2018 in Katowice (Poland) [
14]. Currently, the European Commission has announced that it will push for a higher target of reducing CO2 emissions by 2030 versus 1990. When compared to the previously adopted target, it will be raised from 40% to 55%. This target will enable an increase in the production and consumption of energy from RES. The latest main objectives of the EU’s energy policy until 2050 (the European Green Deal) are aimed at achieving a situation in which the EU economy becomes environmentally neutral. It will result in the elimination of fossil fuels as energy sources.
The introduction of regulations to promote RES and biofuels made most Member States put significant effort into achieving the set targets. As a consequence, both the production and consumption of renewable energy and biofuels have been increasing in recent years. According to the Eurostat data, the share of RES in gross final energy consumption in the EU countries increased from 12.6% in 2008 to 18.9% in 2018 [
15]. However, this is an average result for all EU countries. In addition, large disproportions are reported in this respect in individual countries. This applies to absolute values, and also in relation to the number of inhabitants and the GDP values. In terms of the production and consumption of energy and its structure, the geographical factor related to the location and area of a given country is also important. This is because it determines the possibility of developing renewable energy, for example, wind or solar.
Therefore, it is reasonable to conduct research that will allow for the assessment of the state of RES in the EU countries. It is particularly important to determine changes that occurred in the last decade in the field of RES development. The 10-year perspective seems to be a sufficient period to assess the results of energy policy. For this assessment to be credible, it is necessary to take into account objective factors that describe the specificity of individual countries.
With regard to the studied countries, it seems appropriate to consider the economic (GDP value), demographic (number of inhabitants), and geographic (area size) potential. The economic factor reflects the level of economic development of a country, with prosperity being one of the goals pursued by all governments and societies. Thus, it is crucial to compare the amount of energy produced and consumed from RES to the GDP value. It seems that the more developed and prosperous a country is, the greater the RES-to-GDP ratio should be. Both demographic and geographic factors indicate the social and geographical (territorial) potential of RES development.
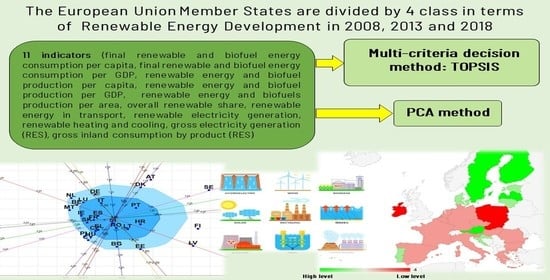
Based on the literature review and the authors’ own experiences and thoughts, the research looked at selected indicators describing the state of RES in individual EU countries. This set included 11 indicators: final renewable and biofuel energy consumption per capita, final renewable and biofuel energy consumption per GDP, renewable energy and biofuel production per capita, renewable energy and biofuel production per GDP, renewable energy and biofuel production per area, overall renewable share (with aviation cap), renewable energy in transport, renewable electricity generation, renewable heating and cooling, gross electricity generation (RES), and gross inland consumption by product (RES).
The study was divided into two basic stages. The aim of the first stage was to analyze the structure and general regularities in relationships between the indicators characterizing the state of RES and biofuels in 27 European Union countries (EU-27) selected for the analysis. It allowed the identification of similar countries in terms of the adopted indicators to later define the role of these indicators in the assessment. At this stage, the Principal Component analysis (PCA) method was utilized. The analysis covered the values of indicators determined for three years (2008, 2013, and 2018). On this basis, relationships between these indicators were determined together with their changes over the studied period. The countries in question were also assessed in terms of the obtained indicator values and compared with the EU average value and with other countries.
The aim of the second stage was to evaluate the EU countries in terms of the development of RES and biofuels in 2008, 2013, and 2018. This, in turn, allowed the authors to identify the countries that made the most progress in RES development between 2008 and 2018, as well as between intermediate periods (2008–2013; 2013–2018). At the same time, the results allowed for the identification of similar countries in terms of RES development and their classification into one of the four adopted classes. The TOPSIS method was used for this analysis. The indicators adopted for the study, determined for individual years (2008, 2013, and 2018), were additionally subjected to preliminary statistical analysis, the purpose of which was to determine the basic parameters and percentage changes in their values in individual countries. Changes in the values of these indicators for the studied countries between 2008–2013 and 2013–2018 were also identified. This made it possible to track the trends and changes in their values over the studied period. Both the research and the findings constitute a new and original approach to the analysis of the state of RES in the EU countries in several aspects. First, changes in the development of RES and biofuels should only be assessed in a certain time horizon. This is due to the fact that the current state of their development is the result of activities undertaken years ago. Therefore, it is worth checking how the share of RES has changed in individual EU countries in the last 10 years. The second factor proving the originality of this paper is the inclusion of variables, related only to renewable energy and biofuels. Additionally, some of these variables were compared to the economic (GDP value), demographic (population size), and geographic (area) potential of individual countries. The authors believe that the GDP value is still the most important indicator for assessing the level of socio-economic development of a given country. In turn, the population factor is significant when determining the development of countries. It is important to note that energy is produced and consumed by citizens. The area size is essential for using installations to produce energy from RES, for example, wind or solar energy. Therefore, this factor is also worth considering.
In addition, two methods of multivariate data analysis were used for the study: the PCA method and the TOPSIS method. So far, these methods have not been used for such an assessment. Moreover, the EU countries remain an invariably important and interesting research object, because their integrity and political conditions, despite the existing differences, are similar. The objectives, especially in the field of environmental protection, are also similar, as evidenced by the above-mentioned legal acts and long-term plans in this area. It is also obvious that these countries are very differentiated both economically and socially. The large fragmentation of the EU-27 causes the Member States to differ in terms of energy traditions, technical culture, geographical location, and many other factors. It seems, however, that the EU is taking the most sensible measures to protect the climate versus other regions of the world. Therefore, it is worth referring to this region and analyzing the state of these changes also in the context of the diversity of these countries. The findings constitute a new and interesting source of information on RES development and should support the decision-making process at the level of individual countries and the entire EU. At the same time, they should be an example of the comprehensive implementation of the "zero-emission" idea in the global economy.
The remainder of the paper is organized as follows.
Section 2 contains the review of literature on the development of renewable energy in the EU countries.
Section 3 briefly presents the determinants used in the study (
Section 3.1) related to the development of the renewable energy market in the EU countries and the empirical methodology used in the study (
Section 3.2.1 describes the PCA method, and
Section 3.2.2—the TOPSIS method).
Section 5 reports and comments on the empirical results of the analyses conducted. In
Section 6, an extensive discussion was conducted, and the last section presents the main conclusions and policy implications of the results.
2. Literature Review
In recent years, more and more attention has been devoted to the renewable energy issue among scientists concerned with the subject of energy policy. The thematic scope of these publications covers the subject of renewable energy development, linking renewable energy with energy security [
16,
17,
18,
19], energy access [
20], economic growth [
21,
22,
23], development of renewable energy production technologies [
24,
25,
26], and the reduction of gases from the energy sector [
27,
28,
29] (
Table 1). This subject is widely discussed in the studies by scientists from all over the world, including Asia, Europe, North America, South America, Australia, and Africa.
Research on RES sustainable development in the EU is focused, among others, on the assessment of the sustainable development of the energy system, economy, society, environment, and technology.
Wang and Zhan in [
30] presented the results of the assessment of renewable energy sustainability in 18 EU countries. The results show that renewable energy sustainability in Germany, Great Britain, France, and Italy is at a higher level than in other studied countries. Cséfalvay and Horváth [
31] assessed the changes and factors influencing the sustainable development of biomass energy in the EU, the United States, Canada, China, and Russia between 2008–2014. Čeryová et al. [
32] looked at the impact of selected renewable energy indicators on the renewable energy sector in the EU countries. The results allowed for the identification of 5 groups of similar countries in terms of the renewable energy sector. One of the few papers devoted to the subject of RES in the EU countries and the role of the impact of expenditure on research and development (R&D) on the increase in energy consumption is a study by Adedoyin et al. [
33]. The authors examined how, in 16 EU countries, the R&D spending drives the growth of both renewable and non-renewable energy consumption. The results show that the expenditure on R&D shows a two-way relationship with the consumption of renewable energy and one-way relationship with non-renewable energy. In turn, Armeanu et al. in [
34] found that RES drives sustainable economic growth. The authors demonstrated a positive effect of RES both in total and by type. They studied the impact of energy obtained from biomass and hydropower, geothermal energy, wind energy and solar energy on the GDP per capita. Additionally, Busu [
35] examined the impact of RES on economic growth in the EU countries. The applied random effects regression model showed that at the EU level, between 2004–2017, primary RES production had a statistically significant and positive impact on economic growth. Collins et al. [
36] presented a renewable energy sustainability index that was calculated for 15 EU countries with different levels of final energy consumption and economic development. In turn, Gökgöz and Güvercin in [
37] described the problem of ensuring energy security and efficiency of RES in the EU countries. By contrast, Cansino et al. [
38] proposed the use of RES for heating and cooling in the EU countries. As a result of the conducted analyses, they found that in the EU the most popular means of promoting RES for heating and cooling is the provision of targeted subsidies. Shivakumar et al. [
39] and Marques et al. [
40] examined what factors and motivations drive the development of RES in the EU. Additionally, Papież et al. [
41] examined the determinants of RES development in the EU countries between 1995 and 2014. Chudy-Laskowska et al. in [
42] presented the results of research on the diversification of the level of wind energy development in the EU countries. Another study [
43] presents the results of the research on the similarity of the EU countries in terms of the volume and structure of energy production from RES in total, and in relation to the GDP, population size and country area. Simionescu et al. [
44] looked at the share of RES and their use in final energy consumption in the EU countries, taking into account the number of inhabitants. In turn, in [
45], Simionescu et al. examined the potential relationship between the share of RES in electricity and real GDP per capita. Cucchiella et al. [
46] presented the results of comparative research on the share of energy from RES in gross final consumption in the EU countries using various mathematical models. In turn, Butnaru et al. [
47] analyzed energy consumption per capita and renewable energy consumption per capita in the EU countries. The results of their research show a tendency of poor convergence in energy consumption and renewable energy consumption in the EU countries. Akadiri et al. [
48] examined the use of RES in the EU countries as part of policies to mitigate environmental pollution and economic sustainability. The paper presents and proves the hypothesis that the use of RES in the EU countries is a reliable way to reduce environmental pollution. In another work [
49], the authors presented the relationship between economic growth, renewable energy, tourist arrivals, trade openness, and carbon dioxide emissions in the EU. The results of their research indicate that both trade openness and renewable energy have reduced climate change and environmental degradation, as well as show the positive impact of economic growth on carbon emissions. On the other hand, Caruso et al. [
50] explored the relationship between renewable energy consumption, social factors, and health. Busu [
51], in turn, presented the role of RES in a low-carbon society in the EU. His research findings show that RES have a direct and positive impact on CO2 emissions, unlike population growth or urbanization. Vasylieva et al. [
52] studied the impact of renewable energy consumption, GDP and corruption in terms of sustainable economic development and greenhouse gas emissions. They found that a 1% increase in renewable energy led to a decrease in greenhouse gas (GHG) emissions, and also that an increase in the Corruption Index by 1% caused a decrease in GHG by 0.88%.
This brief literature review shows that the topic discussed in this article is up-to-date and concerns important issues. Many researchers attempt to analyze and assess the state of renewable energy and its impact on the environment, society, and politics. These publications show that sustainable energy development is currently the most desirable direction of economic development. Power engineering is an integral part of this idea and may decide about the success of these assumptions. In the case of the EU, this is of particular significance due to the political, cultural, economic, and social diversity of the countries in question. It is also clear that attempts are being made to identify various parameters and assess the impact of various factors on renewable energy. In this context, the approach proposed in this paper is new and should enrich knowledge in the field of evaluating the state of RES in the EU. The study of economic, demographic, and geographical aspects together with the use of modern methods of analysis make the findings a new approach to this subject. The set of 11 indicators adopted in the analysis (compared only to renewable energy) makes this paper a comprehensive approach to the assessment of the state of RES in the EU countries and enables an objective assessment of observed changes.
4. Results
4.1. Preliminary Analysis
The renewable energy indicators used in this study were initially statistically analyzed and their basic statistical parameters were determined, which are summarized in
Table 2,
Table 3 and
Table 4.
The sets of indicators presented in
Table 1,
Table 2 and
Table 3 are characterized by a large range of the coefficient of variation. The coefficient of variation for RES indicators is greater than 10%, and thus these indicators meet the condition of diagnostic features, which must show significant differentiation within the studied group. The skewness coefficient for all analyzed RES indicators in 2008, 2013, and 2018 was found to have positive values, which means the right-hand asymmetry of the distribution. In most EU countries, the values of these indicators are lower than the EU-27 average. In the case of the kurtosis coefficient, a positive value was reported for all renewable energy indicators only in 2008. This means that the renewable energy indicators for most EU-27 countries are slightly lower than the average values of these indicators. In turn, in 2013 and 2018, for indicators such as renewable electricity generation, renewable heating and cooling, gross electricity generation, gross inland consumption by product, the kurtosis coefficient shows negative values, which means that a significant number of the EU countries reach the values significantly different from the EU average. With regard to 2013, this is also the case for renewable energy and biofuel production per area.
In the next stage, the percentage changes in the values of renewable energy indicators in individual EU countries between 2008–2013 (
Figure 1) and 2013–2018 (
Figure 2) were determined.
The results indicate that the largest increase in the value of renewable energy indicators between 2008 and 2013 was reported in Malta and Cyprus, and the smallest increase in Austria and Portugal. Belgium, Denmark, and Estonia also performed well in terms of RES development. A more detailed analysis showed that Malta had the highest values in terms of the following indicators: final renewable and biofuel energy consumption per capita, final renewable and biofuel energy consumption per GDP, renewable energy and biofuel production per capita, renewable energy and biofuel production per GDP, renewable energy and biofuel production per area, overall renewable share, renewable heating and cooling, as well as gross inland consumption by product. Cyprus achieved the best results for the renewable electricity generation and gross electricity generation indicators. The smallest increase in final renewable and biofuel energy consumption per capita, overall renewable share (with aviation cap) and renewable heating and cooling was found in Portugal. In Estonia, among all EU-27 countries, the smallest increase was noted in both final renewable and biofuel energy consumption per GDP and gross inland consumption by product. Romania, on the other hand, was reported to show the smallest increase in renewable energy and biofuel production per area.
Both between 2008–2013 and 2013–2018, the greatest increase in the renewable energy indicators was reported for Cyprus, but it was not as intense as in the previous period (2008–2013). The smallest increases were recorded in Hungary.
Malta, from among all EU-27 countries, showed the largest increase in final renewable and biofuel energy consumption per capita, final renewable and biofuel energy consumption per GDP, renewable energy and biofuel production per capita, renewable energy and biofuel production per GDP, renewable energy and biofuel production per area, renewable electricity generation, gross electricity generation, and gross inland consumption by product. In the case of the overall renewable share index (with aviation cap), the largest increase between 2013 and 2018 was reported for Luxembourg (by nearly 257%), and in the case of renewable energy in transport for Portugal (an increase of nearly 977%). In Cyprus, the largest increase was observed for renewable heating and cooling.
Hungary was reported to show the smallest increases in final renewable and biofuel energy consumption per capita, final renewable and biofuel energy consumption per GDP, renewable energy and biofuel production per capita, renewable energy and biofuel production per GDP, renewable energy and biofuel production per area, renewable heating and cooling, and gross inland consumption by product. Spain, among all EU-27 countries, was found to have the smallest increase in renewable electricity generation (by 95.7%), and in Poland, it was renewable energy in transport (by 85.5%). In Portugal, the smallest increase was reported for gross electricity generation (by 86.6%). Percentage changes in the average values of renewable energy indicators for studied countries between 2008–2013 are shown in
Figure 3a, and between 2013–2018 in
Figure 3b.
When analyzing the findings presented in
Figure 3, it can be concluded that the average change in the value of renewable energy indicators was greater between 2008–2013 versus 2013–2018. It can also be noticed that the increase in these indicators between individual EU countries in the years 2013–2018 was less diversified than between 2008–2013. This shows that RES development in the EU-27 countries was more intense between 2008–2013 than 2013–2018.
4.2. Results of the PCA Method
In the first stage of the analysis, it was checked whether and how the selected RES indicators correlated (
Table 5,
Table 6 and
Table 7). The correlation coefficient analysis was aimed at examining whether the correlation matrices for individual years (2008, 2013, and 2018) are unit matrices. The correlation matrix is usually subjected to further analysis if average correlation coefficients are greater than the value of 0.3.
The conducted analysis showed the lack of unit matrices of correlation for studied variables. Therefore, the application of the PCA method was justified. A statistically significant correlation was found between most of the adopted indicators.
In the next stage of the PCA, the eigenvalues of the correlation matrix were determined (
Table 8).
The determined eigenvalues of the correlation matrix (
Table 8) reflect the significance of the principal components in describing the information resources of the input variables (percentage share in the variability of the data set). The Kaiser criterion was used to determine the optimal number of the principal components. Based on this criterion, such number of principal components was adopted to explain as much variation as at least one original diagnostic variable. Thus, for the indicators from 2008, these are two principal components accounting for 83.12% of the variability of the original data, and for 2013 and 2018, these are three principal components accounting for, respectively, 87.91% and 84.83% of the variability of the original data.
Table 9 presents the values of the principal component coefficients for individual years.
For 2008, the first two principal components are sufficient to explain 83.13% of the cumulative variance. The first principal component carries 65.38% of the information contained in negatively correlated variables for final renewable and biofuel energy consumption per capita, final renewable and biofuel energy consumption per GDP, renewable energy and biofuel production per capita, renewable energy and biofuel production per GDP, overall renewable share (with aviation cap), renewable electricity generation, renewable heating and cooling, gross electricity generation, and gross inland consumption by product. The second component explains 17.75% of the data variability through renewable energy and biofuel production per area and renewable energy in transport. For 2013, the first two principal components explain 78.00% of the cumulative variance, and the other three—87.91%. The first principal component carries 60.97% of the information contained in negatively correlated variables, such as final renewable and biofuel energy consumption per capita, final renewable and biofuel energy consumption per GDP, renewable energy and biofuel production per capita, renewable energy and biofuel production per GDP, overall renewable share (with aviation cap), renewable electricity generation, renewable heating and cooling, gross electricity generation, and gross inland consumption by product. The second component explains 17.04% of the data variability through renewable energy and biofuel production per area, and the third—9.9% through renewable energy in transport. For 2018 data, in turn, the first principal component explains 58.5% of the variability through negatively correlated variables like final renewable and biofuel energy consumption per capita, final renewable and biofuel energy consumption per GDP, renewable energy and biofuel production per capita, renewable energy and biofuel production per GDP, overall renewable share, renewable electricity generation, renewable heating and cooling, gross electricity generation, and gross inland consumption by product. The second principal component explains 16.34% of the variability through renewable energy and biofuel production per area and the third—9.99% through the negatively correlated variable renewable energy in transport. Together, the first three principal components explain as much as 84.83% of the variability. It can be noticed that in the subsequent years, the first principal component explained less and less information contained in the studied variables, and each time they were negatively correlated with it.
Figure 4 shows the graphical form of factor loadings, i.e., correlations between original and principal component variables for 2008, 2013, and 2018. Correlation coefficients show values in the range [−1; 1]. They are located within the so-called circle [
57]. The farther a given point is from the center of the circle, the higher the correlation of a given variable with a given ordinance axis (i.e., the principal component). The angles between the vectors illustrating the analyzed indicators show the correlation of these variables, where acute angles (vectors located close to each other) indicate the presence of a positive correlation, right angles (perpendicular vectors) indicate no correlation, and obtuse angles (vectors on opposite sides of the center of the circle) indicate a negative correlation.
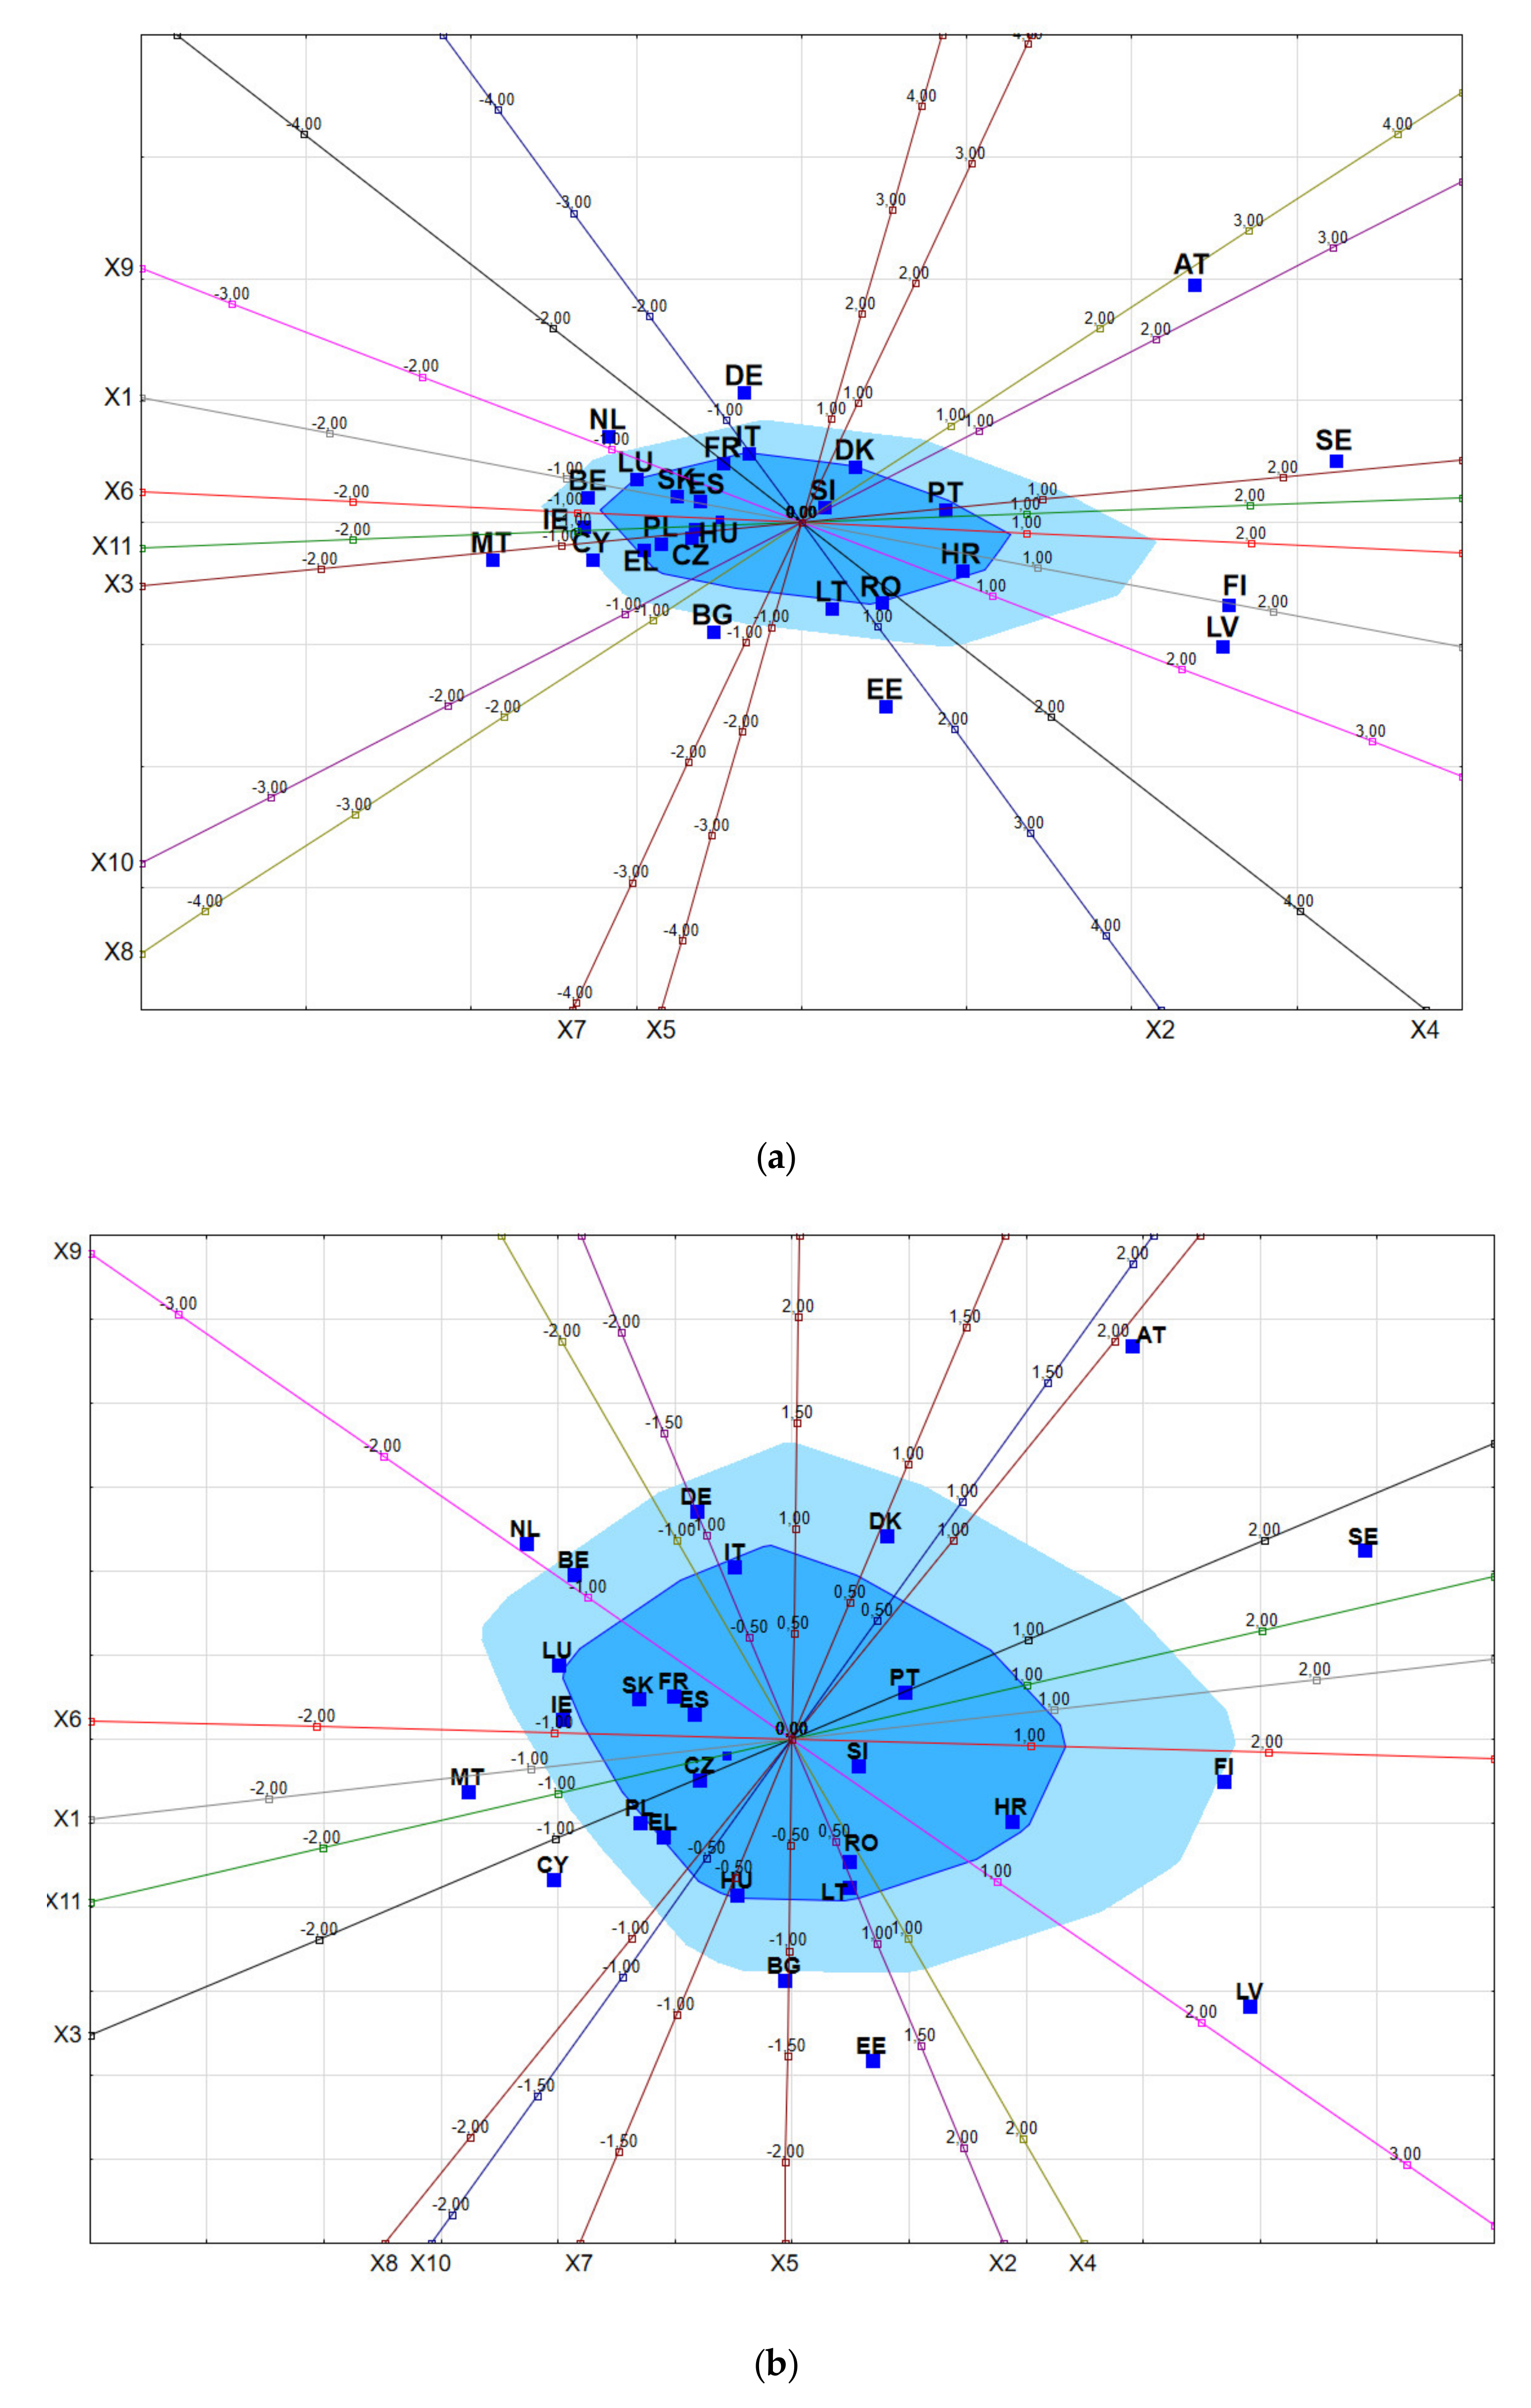
With the use of a biplot with calibrated axes [
58] (
Figure 5), the relationships between renewable energy indicators and the EU countries were assessed. In this biplot form, 11 energy indicators are represented by 11 biplot axes, intersecting at one coordinate point (0, 0) (centroid determined on the basis of the values of the variables describing the objects). The closer a given EU country is to the center of the biplot (point 0), the closer the values of renewable energy indicators for that country are to the EU average, and the farther it is, the more significantly the values differ from the EU average.
When analyzing the results, it can be noted that in 2008, the EU-27 countries had a much greater concentration of countries with values similar to the average of all variables than in 2013 and 2018. Additionally, the results clearly show that in 2008, 2013, and 2018, five countries were found to clearly stand out in terms of the level of sustainable energy indicators versus the average value (they exceed it). These countries include Sweden, Finland, Austria, Latvia, and Estonia. Thus, in the subsequent years, the increasing energy diversification of the EU countries could be observed in terms of RES. The results, obtained with the use of the PCA, clearly confirm this process.
4.3. Ranking of the EU-27 Countries Using the TOPSIS Linear Ordering Method
The TOPSIS linear ordering method, with the synthetic measure of the degree of similarity to the pattern, was utilized to create a ranking of the EU countries in terms of the potential level of RES and biofuel development. All diagnostic variables adopted for the study were stimulants. Within the ranking, all indicators characterizing the potential of renewable energy and biofuels were assigned the same value of weights.
Table 10 presents the results of the calculations of the distance measure of the EU-27 countries from the pattern and anti-pattern, the value of the synthetic TOPSIS
Pi measure for the studied years, and the classification of these countries in terms of the level of RES and biofuel development.
Figure 6 presents the division of these countries into four classes similar in terms of the level of RES and biofuel development in 2008, 2013, and 2018.
The conducted analyses enabled the classification of the EU-27 countries into one of four classes in terms of the level of RES, based on the adopted indicators (
Figure 6). For the studied years, class 1 comprised Sweden, Austria, Finland, and Latvia, characterized by a high level of RES development.
For 2008, class 2, characterized by an average high level of RES development, included Croatia, Portugal, Estonia, Romania, Denmark. For 2013, this class consisted of Portugal, Denmark, Estonia, Slovenia, Romania, Lithuania, and Bulgaria. In turn, for 2018, it included Estonia, Denmark, Croatia, Portugal, and Lithuania. It can be seen that the composition of this group, despite some changes, is quite stable. Class 3, characterized by an average low level of RES development, for 2008, comprised Lithuania, Slovenia, Germany, Italy, France, Belgium, Hungary, Czech Republic, Slovakia, Spain, Netherlands, Poland, and Luxemburg. For 2013, however, this class included Germany, Italy, Hungary, Czech Republic, Spain, France, Belgium, Netherlands, Slovakia, and Poland. For 2018, it was Bulgaria, Romania, Germany, Slovenia, Italy, Luxemburg, Netherlands, Czech Republic, Spain, Belgium, Malta, Greece, France, and Hungary. The composition of this group is also quite stable, despite certain changes. Class 4 was characterized by a low level of RES development, and for 2008, it included Greece, Belgium, Cyprus, Ireland, and Malta. In turn, for 2013, it consisted of Greece, Luxemburg, Ireland, Cyprus, Malta, and for 2018, Slovakia, Cyprus, Poland, and Ireland. It is clearly visible that this group shows the greatest changes in the analyzed years.
It can be noticed that many EU countries, apart from their class affiliation in terms of RES development, also changed their place in the overall ranking (
Table 9). Countries which between 2008–2018 advanced in the ranking presented in the
Table 9 include: Belgium (by 5 positions), Bulgaria (by 5 positions), Denmark (by 3 positions), Estonia (by 2 positions), Greece (by 2 positions), Spain (by 1 position), Latvia (by 1 position), Lithuania (by 1 position), Luxembourg (by 7 positions), Malta (by 7 positions), Netherlands (by 4 positions), and Finland (by 1 position).
Countries that dropped in the overall ranking between 2008 and 2018 include: Ireland (by 1 position), France (by 8 positions), Croatia (by 2 positions), Italy (by 1 position), Hungary (by 7 positions), Austria (by 2 positions), Poland (by 5 positions), Portugal (by 2 positions), Romania (by 3 positions), Slovenia (by 2 positions), and Slovakia (by 6 positions).
There is also a group of EU countries that maintained their position in the ranking between 2008 and 2018, including Sweden (1), Germany (12), Czech Republic (17), and Cyprus (25).
5. Discussion
The aim of this paper was to assess the state of RES development in the EU countries between 2008–2018. In order to analyze the structure of this energy sector and the degree of changes observed at that time, 11 indicators were used, which were subjected to multi-criteria analysis using the PCA and TOPSIS methods. The research covered all EU countries, additionally taking into account economic (GDP), demographic (number of inhabitants), and geographic (area of a given country) factors. Based on the research and the findings, it can be concluded that the level of RES development in the EU-27 is diversified. In the studied period, all the EU countries were found to have increased the share of RES in their energy mix, which is reflected in higher production and consumption versus the number of inhabitants, the GDP value as well as gross electricity production and gross consumption. An increase was also reported in the share of energy from RES in transport, heating, and cooling. However, this increase was found to vary widely across the EU.
The results of the PCA indicate (
Figure 5) a certain concentration of countries close to the average values of all RES indicators. However, certain clear exceptions were noted for Sweden, Finland, Austria, and Latvia, where these figures were found to be far above these values. Undoubtedly, they are the leaders in RES development. Nevertheless, there is also a group of countries that are definitely not even close to the average EU values, which proves poor RES development there. The analysis of distributions in the studied years also shows an increase in differences between individual countries over the years.
In the second stage of the study, the EU-27 countries were divided into 4 classes in terms of the level of RES and biofuel development in each of the studied years (2008, 2013, 2018). As in the PCA, also in this case the basis for the division was the values of indicators quantifying the level of RES in these countries. At the same time, this stage made it possible to rank the EU countries depending on RES development. Using the results of both analyses, it was possible to assess the state of the energy sector in individual countries, taking into account the changes that occurred in them within one decade. The class of the EU-27 countries, characterized by a high level of RES and biofuel development, comprised 4 countries: Sweden, Finland, Latvia, and Austria (
Table 10,
Figure 6). All these countries are marked with a high level of RES development in the EU-27 in the studied years, although their position in the ranking changed. Sweden is the undisputed leader of the ranking (for 2008, 2013, and 2018). Finland was promoted to the runner-up position in 2018 from the 3rd place in 2008 and 2013. Austria, which in 2008 was the runner-up among the EU-27 countries in terms of RES, was only on the 4th place in the subsequent years (
Table 10). Lithuania, in turn, ranked 4th in 2008, 2nd in 2013, and 3rd in 2018 (
Table 10). Sweden’s high position is due to the fact that it is a country that started the energy transition many years ago, and its effects have been visible for many years [
59]. Austria, Finland, and Latvia have also been developing RES for many years. Sweden is the leader in the EU in terms of the share of RES in the national consumption of electricity, heat, and transport. It managed to achieve the target of 50% of RES already in 2012. In 2018, Finland came second in terms of the level of RES and biofuels among the EU-27 countries, which shows advancement by two positions when compared to 2008 and 2013 (
Table 10). It is important to note that there is another Scandinavian country with the level of RES considered favorable in relation to the adopted criteria. After Sweden, Finland shows the second largest share of RES in Europe. Biomass and hydropower are the most important energy sources in Finland. Since Finland has the most forested areas in Europe (more than 85% of its territory is covered by forest [
60]), biomass plays a crucial role there and is widely used for electricity production and heating purposes. The high development of RES in Finland results from the policy of the Finnish government concerning taxation and subsidies for RES. Both taxes and subsidies stimulate investments in the energy, heating, and cooling sector. The so-called feed-in tariffs for energy produced from RES are applied. Heat produced from RES is promoted through the “heat premium” mechanism adopted in CHP plants using biogas and wood fuel [
61]. The use of RES in the transport sector is supported by a system of subsidies and tax regulations.
The third place in this ranking (
Table 10), in 2018, was taken by Latvia, which, compared to 2008, advanced from the 4th place (however, in 2013, Latvia was the runner-up). Latvia set itself the target of achieving 40% of energy generated from RES in gross final energy consumption by 2020. In 2018, it was reported to have the third highest share of RES (40.3%) in energy consumption in the EU after Sweden (54.6%) and Finland (41.2%), while the average rate for the EU was 18.0%. The structure of RES in this country is comprised of hydro, wind, biogas, and biomass power plants as well as RES-based CHP plants. The use of solar energy to generate electricity is not yet fully developed in this country [
62]. In 2018, Latvia was the leader among the EU countries in terms of final energy consumption per GDP and energy production per GDP. An important role in the development of RES in Latvia is played by the fact that the country is striving for energy independence [
63]. The promotion of RES in Latvia is associated with the use of a combination of different instruments to promote renewable energy. These include a feed-in tariff for renewable electricity generation, tax credits for heating and cooling, and a tax regulation mechanism in the transport system for renewable electricity generation, tax credits for heating and cooling, and a tax regulation mechanism in the transport system.
The last country with the high level of RES development in the EU-27 (
Figure 6) is Austria, which ranked 4th in the EU-27 ranking for 2018 (
Table 10). This means a decrease by two positions (from the 2nd place) when compared to 2008 and 2013. It can be said that Austria is a country that has experienced one energy transition and is now moving toward another. The country’s authorities have decided that by 2030, it will have obtained energy in 100% from RES. Austria was the leader in 2008, 2013, and 2018 in terms of the share of RES in electricity generation (ahead of Sweden, among other countries). In Austria, the share of RES used for heating is also relatively high versus other European countries, but lower than in Sweden, Finland, Latvia, Portugal, or Estonia [
15]. Despite the fact that in 2008 Austria was the runner-up in the development of the RES market among the EU-27 countries (
Table 10), in 2018, it dropped to the 4th place in the ranking. In 2008, Austria was the leader in RES and biofuel production per area, the share of renewable energy in transport, and the share of renewable energy and biofuels in renewable electricity generation and gross electricity generation. However, in 2018 it remained only the leader in terms of the share of renewable energy sources and biofuels in renewable electricity generation. Moreover, Austria also uses renewable energy per capita—it ranks 4th among the EU countries (after Finland, Sweden, and Latvia), but with regard to energy consumption per GDP, the result is not so favorable, as it is roughly in the middle of the ranking of all countries.
The second group of countries consists of those classified into the group characterized by an average high level of RES and biofuel development (
Figure 6). In 2018, these countries included Estonia, Denmark, Croatia, Portugal, and Lithuania, respectively. Interestingly, a decade earlier—in 2008, these were slightly different countries, namely Croatia, Portugal, Estonia, Romania, and Denmark (
Table 10). It can be noticed that over a decade, significant changes in the group of these countries occurred. Some countries from class 2 (average high level of development) advanced in the overall ranking to higher positions in relation to the base year 2008. They included Estonia, which moved up from the 7th place in 2008 to the 5th place in 2018 (in the meantime, it dropped to the 8th place in 2013) and Denmark, which from the 9th place in 2008 (through the 7th in 2013) finally moved up to the 6th in 2018. Lithuania was promoted to the group of countries with an average high level of RES and biofuel development, and Romania left it (to class 3 with an average low level of development). Estonia is steadily shifting its energy system toward renewable energy [
64]. Estonia’s renewable energy potential is manifested primarily in bioenergy based on the cogeneration of electricity and heat, wind energy, and the production of green gas (biomethane), which is utilized wherever natural gas is currently used. Estonia has already achieved its 2020 target for the share of energy from RES, yet the challenge will be to achieve the target of RES in transport. In the case of Denmark, the high position in relation to the adopted evaluation criteria results from the fact that this country started developing renewable energy production technologies in the 1970s and today is the European leader in wind energy [
62]. In the ranking of the EU countries, Denmark systematically advanced from the 9th place in 2008 to the 6th place in 2018. Therefore, it is a country where the production and consumption of renewable energy are successively increasing in relation to the adopted criteria. Denmark has already achieved its targets for the share of RES in total energy consumption in 2018, including heating and transport, reaching the level of 35.7%, while its 2020 target was 30%. The Danish renewable energy system is mainly based on wind energy and is the leader in terms of installed wind energy capacity per capita [
65]. Sources such as biomass, solar energy, hydropower, geothermal energy, and biofuels also contribute significantly to electricity generation [
65]. In order to increase the share of RES in total electricity consumption, the Danish government has introduced a premium tariff and net metering tariff. Loan guarantees and subsidies have also been introduced to develop the construction of wind power plants and the installation of small renewable energy systems. The heating and cooling sector using RES is supported through tax exemptions, the obligation to use renewable heating and cooling systems in new buildings or renovated living spaces, and a direct premium tariff for the use of biogas technology. The use of biofuels or other renewable fuels in transport is promoted through a subsidy system [
61].
Croatia is also developing the potential for RES development, which is visible in the ranking of the level of RES and biofuels among the EU countries [
66]. In 2018, Croatia took the high 7th place in terms of the level of RES. However, in the previous years (2008 and 2013), this position was slightly more favorable (5th place). In 2018, the country covered 28.02% of gross final energy consumption from RES. Additionally, Croatia has enormous potential for renewable energy since it has both the technical and economic potential to rapidly achieve 100% of RES [
67]. In the case of Portugal, its strategic drive to replace fossil fuels with RES makes it one of the leading European countries in this regard. Currently, the inland production of primary energy in Portugal relies almost exclusively on RES, such as wind, hydro, solar, geothermal, and biomass energy [
68]. Further development of this sector will mainly involve an increase in the installed capacity for wind energy, and shortly thereafter for solar and hydropower. When it comes to electricity production, in Portugal, RES accounted for 51.37% of total electricity production in 2018, while in 2008, it was 32.93%. On the other hand, transport is one of the sectors where the share of RES in Portugal is low [
69]. In 2018, it was only less than 9%, and in 2008 it was 2.5%. In Portugal, the policy to promote energy produced from RES includes a feed-in tariff for the electricity sector, a biofuels subsidy scheme, and a tax exemption for small producers in the transport sector. Additionally, in the building sector, Portugal places a strong emphasis on RES, as there is an obligation to install solar thermal systems for sanitary water heating. In addition, the government has launched campaigns to raise public awareness on the problems affecting the development of RES and has created a fund to finance research and innovation programs related to RES development [
61].
Lithuania was ranked 9th in the ranking of the EU countries in terms of RES and biofuel development in 2018, and, versus 2008, advanced by two positions. This is because promoting the development of RES is a priority for the Lithuanian government in order to achieve the energy independence lost in 2009 due to the closure of the nuclear power plant [
61,
63]. At the same time, it is the last EU country with an average high level of development in this area (the second group). The share of RES in Lithuanian primary energy supplies is the lowest among the three Baltic countries (Estonia, Latvia, and Lithuania), although the development trends are favorable in this respect. Lithuania is developing its energy generation system from biomass, water, and wind, i.e., sources available in the country. A feed-in tariff is the main support mechanism used by the government to promote renewable energy generation. The use of RES in transport is supported by excise tax exemption and pollution-related tax credits [
61].
The ranking of countries which, in 2018, comprised the class with an average low level (class 3) of RES development included a total of 14 countries (
Figure 6). They consist of (according to the position in the overall ranking—
Table 10): Bulgaria, Romania, Germany, Slovenia, Italy, Luxembourg, Netherlands, Czech Republic, Spain, Belgium, Malta, Greece, France, and Hungary. It is worth noting that in relation to the adopted criteria, the situation looks unfavorable in highly developed countries with significant economic potential, namely in Germany, France, Italy, Spain, the Netherlands, and at the same time in countries with a significant number of citizens (Germany, France, Italy, Spain). Statistically, the more energy from RES per citizen, the greater the chance that the citizen will actually use it. In prosperous countries, it should be one of the measures of the actual RES development. It is important to note that, in 2013 and 2008, Germany, France, Italy, Spain, and the Netherlands were also classified among the countries characterized by the average low level of development (
Table 10). It seems that these countries should have much more favorable values of indicators in relation to the adopted criteria, because their economic position indicates huge investment potential in the implementation of new solutions necessary for RES development. At the same time, Malta was placed in the ranking in class 3, and in 2008, it ranked last—in class 4. Attention should be paid to the high position of Bulgaria in the overall ranking for 2018—the 10th place and advancement by 5 positions versus 2008 (
Table 10). Between 2008–2018, Bulgaria doubled the share of RES in its energy mix from 10% to over 20%. It is one of the 11 EU Member States that has already achieved its 2020 RES target, which has not yet been achieved by countries that started promoting RES much earlier, such as Germany, being considered the forerunner in switching to RES in Europe [
30,
70].
The current state of RES development in Germany needs to be looked at a bit more critically. In general, when considering the volume of energy production from RES in total (as Mtoe of production), Germany is the undisputed leader in this respect among all the EU countries. Germany is responsible for nearly 20% of this production in the entire EU (in 2008, it was about 19%, and in 2018—nearly 20%). However, in the presented research, the authors used, among others, indicators that are related to the implementation of the EU climate and energy package until 2020 in terms of RES, as well as indicators showing the growth of RES production capacity or the volume of energy production from RES in relation to the wealth of a given country. This approach to the analysis showed that the situation in Germany in terms of RES is not as good as compared to the leading countries.
Over the last 10 years, Germany has not changed its position in the RES development ranking (
Table 10) and still ranks 12th. The level of its development is described as average low (
Figure 6). Within 10 years, between 2008 and 2010, the share of RES in total energy consumption increased from 10.01% to 16.5%, but Germany has not yet achieved its 2020 target. In fact, many less prosperous countries have already achieved this goal (e.g., Bulgaria, Estonia, Cyprus, Czech Republic). In order to switch to RES, Germany must pay at least €160 billion over five years [
71], which Kay Scheller says is extremely disproportionate to the outcomes. Additionally, Germany has introduced a number of incentive mechanisms to promote RES: a tariff and low-interest loans for investments in new power plants, as well as several programs for the development of the heating and cooling sector. In transport, subsidy systems and fiscal regulation are used [
61].
It should be appreciated that the German energy transition process, or Energiewende, is an effort involving the government, private industry, and civil society [
72]. In the case of Germany, much better results could be expected. Romania is considered to have large energy potential in terms of RES development [
73]. Nevertheless, it recorded a visible decline in the overall ranking of the EU-27 in terms of the level of RES and biofuel development. In 2008, this country ranked 8th and was included in the class characterized by the average high level of development, and in 2018 it ranked 11th (in the class characterized by an average low level). Between 2008–2013, however, electricity production from RES showed a steady increase from 28% to 41.7%. Romania’s high position in 2008 is due to the fact that activities related to the use of RES have become an important element of Romania’s energy policy, mainly in connection with joining the EU [
74]. Hydropower has the greatest significance in this respect. In recent years, wind energy has also begun to play an increasingly important role. Biomass energy also has a great potential, due to the large number of forests, which represent about 30% of Romania’s area. In order to promote the production of energy from RES, the Romanian government has adopted a mandatory subsidy system based on green certificates. The heating and electricity sector receives subsidies for using energy from RES. It is also recommended to use energy-saving technologies in all new investments and constructions with a total area over 1000 m
2. The modernization of the district heating system and investments to increase energy efficiency are also subsidized [
61].
Another country that recorded a drop (by two positions) in the ranking of the EU-27 countries in terms of the level of RES development for 2018 is Slovenia. When compared to 2013, this decline was even greater—by 3 positions. Slovenia has not yet reached its 2020 target for the share of RES in final energy consumption. Although between 2008–2013, there was an increase in final RES consumption from 15% to 22.41%, an unfavorable phenomenon occurred between 2013–2018—the share decreased by 1.26%. Decreasing this share also reduces the volume of consumption and production of energy from RES per citizen and per EUR 1 million of GDP. Between 2013–2018, the consumption of RES in transport increased from 3.77% to 5.5%. In Slovenia, the most important RES are biofuels and hydropower. Renewable energy production is promoted through a two-stage tendering process that determines the recipient and the level of support. The system is also based on public calls for grant applications and loans for renewable energy projects. The main incentives for renewable energy use in transport are tax exemptions and credit opportunities [
61].
Italy, like the vast majority of the EU-27 countries, is gradually increasing the production and consumption of RES, both in total and per capita or GDP. The final energy consumption target to be covered from RES in 2020 was to be 17%, which according to the National Renewable Energy Action Plan (NREAP) will mean an average consumption of around 26% for electricity production, 17% for heating and cooling, and 10% for transport [
75]. The target in terms of RES-based energy consumption, including the use of this energy in heating and cooling and electricity production for 2020, has already been accomplished. Although it is one of the richest EU-27 countries, as in the case of Germany, the level of RES development has not changed and is assessed as an average low. Additionally, this country ranked 4th in 2018 and 2013, which means a decrease by 1 position when compared to 2008 (
Table 10). Additionally, between 2008 and 2013, a decrease was reported in energy consumption from RES per capita and 1 million GDP. Luxembourg is a country that more than doubled its final RES consumption between 2013–2018. At that time, in the overall ranking, it moved up from the 22nd to the 15th place (
Table 10) and is close to achieving the overall target of final energy consumption from RES set for 2020. This is due to the cooperation established by Lithuania and Luxembourg in 2017. These countries, in line with the EU Renewable Energy Directive (the so-called RED Directive), have signed an agreement under which a certain amount of renewable energy can be "transferred" from one country’s register to another. Luxembourg plans to use such agreements to achieve the EU target and thus help the whole EU to meet its 20% target in 2020. A similar solution was adopted by the government of the Netherlands, which concluded an agreement with Denmark. As a result, it will buy the surplus of green energy owned by the Danes. Luxembourg promotes renewable energy through feed-in and premium tariffs, as well as through subsidies. It is worth noting that access to the RES-based electricity grid is subject to the general provisions of the energy law. Electricity from these sources is not prioritized there, and grid access is granted according to the principle of non-discrimination. However, electricity generated from RES is granted various privileges, such as cost reduction or preferential use in the case of loss of capacity [
61].
In 2018, the Netherlands were reported to be the worst EU country in terms of the implementation of the RES target, because the final consumption of green energy from RES was only at the level of 7.38% (and the target for 2020 is 14%). Despite the fact that, compared to 2008, the share of RES in final energy consumption has almost doubled, between 2008–2018, the Netherlands made significant progress in the field of RES development. In 2008 and 2013, it ranked 20th, and in 2018 it was already 16th (
Table 10). In the Netherlands, the main support instrument for renewable energy is the Stimulering Duurzame Energieproductie+(SDE+) premium guarantee scheme. This support scheme promotes RES used for electricity, renewable gas, and heating purposes [
61].
The next studied country was the Czech Republic, which belongs to the group of countries that have already achieved their target for final renewable energy consumption for 2020. In the overall ranking, for 2008 and 2018, it ranked 17th, while in 2013 it was 16th. Between 2008 and 2018, the share of RES in final energy consumption increased from 8.7% to 15.15%. The statistical amount of energy produced and consumed per citizen or GDP is also gradually increasing. Between 2008 and 2018, the consumption of renewable energy in transport in the Czech Republic more than doubled, as well as the use of RES for electricity production. In the Czech Republic, the most important sources of renewable energy are wind energy and hydropower. Despite investments, solar energy still represents a small part of renewable energy. The development of wind energy is hindered by insufficient installed capacity. Renewable energies are promoted through a feed-in tariff and a green premium and subsidies. Regulations introduced allow biofuels to be exempted from consumption tax and impose a subsidy system for the integration of renewable fuels into transport [
61].
Spain is the third largest country and one of the richest countries in the EU-27, after Germany and Italy, whose level of RES development is assessed as average low for all the years included in the study. When compared to 2008, Spain in 2013 advanced by 2 positions in the overall ranking of the EU countries (
Table 10). Ultimately, in the 10-year period, it moved up to the 18th place in 2018. During this period, the share of RES in final energy consumption increased by over 60%. Spain still needs 2.5% to reach the national target for 2020. It is worth paying attention to the Gross Electricity Generation index, which in 2013 amounted to 40.5%, while in 2018 it amounted to 38.8%. The main sources of RES in Spain are biofuels, wind energy, hydropower, thermal energy, and photovoltaic energy. The production of thermal energy alone has increased by more than 800% during the 10-year period, which is also associated with an increase in installed capacity for this energy source [
76]. In Spain, in order to promote RES, the government first introduced a system of price regulation for electricity generation (now abolished), tariffs or guaranteed premiums for power plant operators (suspended), and tax regulation mechanisms for biofuels. With regard to the use of RES in heating, Spanish regulations require the installation of solar panels as part of new energy systems [
77]. The Royal Decrees 359/2017 and 650/2017 introduced a premium tariff ("Régimen Retributivo Específico"), the purpose of which is to support new photovoltaic and wind power plants located in the fixed electricity system.
Belgium may be one of the EU-27 countries that may struggle to meet its 2020 RES target. Between 2008 and 2018, the share of RES in final energy consumption increased from 3.6% to 9.4%. There was a significant increase in the share of RES in transport. In 2008, this share was less than 1%, and in 2018 it was 6.5%. Gross electricity production from RES in the national mix increased from 6.8% to 24.3%. The development of renewable energy in Belgium is also visible in the overall ranking of the EU countries. It moved up from 24th place in 2008 to 19th place in 2018. Malta, on the other hand, is a country that has made great progress in the field of RES development [
78]. Between 2008 and 2013, it was the last country among all the EU-27 countries in the overall ranking in terms of RES development, and its level was assessed as low. In 2018, Malta moved up to the 20th place, and its level was assessed as average low. Final energy consumption from RES increased from 0.20% in 2008 to 7.98%, in transport from 0% to 7.98%, and in electricity from 0% to 7.69%. Malta is close to meeting the EU’s 2020 target. With regard to heating and cooling, the share of energy consumption from RES increased from 1.7% to 23.37%. The volume of gross electricity production from RES in the national mix increased from 0% to 10.12% over the decade. In terms of the amount of energy produced from RES, Malta is the weakest country in the whole EU. In 2018, only 0.03 Mtoe of this energy was produced there (in 2008—0 Mtoe). In order to develop RES, the production of electricity generated by photovoltaic installations is supported through a feed-in tariff. Malta is promoting solar water sub-heating systems and aerothermal heat pumps for domestic use through a subsidy scheme. The use of RES in the transport sector is supported through a substitution obligation imposed on importers and wholesalers of fossil fuels.
Another country in the ranking is Greece (21st place in 2018, which means advancement by 2 positions versus 2008 and 2013). It was supposed to increase the share of RES in domestic consumption to 18%. This means that Greece achieved this goal in 2018. Over the decade, the highest increase in the use of energy from RES in Greece was reported in the heating and cooling sector—from 9.64% to 26.01%, the lowest, as in most EU countries, in the transport sector—from 1.06% to 3.8%. Gross electricity production from RES in the national mix increased from 10.3% to 30.35%. The amount of energy produced and consumed per citizen is also gradually increasing, as well as per 1 million EUR of GDP. France, like the Netherlands, is furthest from its 2020 RES target. In 2018, RES in final consumption in France amounted to only 16.6%, while the target for 2020 is as high as 23%. Although between 2008–2013 and 2013–2018 there was an increase in the use of energy from RES per capita and GDP, between 2013–2018, a decrease in relation to the GDP is noticeable. The conducted assessment showed that France, between 2008–2018, showed an average low level of RES development. However, when compared to the base year, it dropped by as many as 8 positions in the overall ranking of the EU countries, from the 14th place in 2008 to the 22nd place in 2018. Hungary, on the other hand, is close to the 2020 RES target, with 2018 final green energy consumption of 12.5% and the target of 13%. Despite this, the conducted assessment showed that Hungary lags behind most of the EU-27 countries in terms of RES development. In 2008, it ranked 16th in the overall ranking of the EU-27 (
Table 10), and in 2018 it dropped to the far 23rd place. Between 2013 and 2018, Hungary experienced a significant decrease in RES consumption per capita and EUR million of GDP, as well as energy per capita, EUR million of GDP, and its surface area.
Slovakia, Cyprus, Poland, and Ireland are at the other end of the list of RES development in the EU-27 countries for 2018. These countries were assigned to the class with a low level of RES development. A decade earlier, class 4 was composed of Greece, Belgium, Cyprus, Ireland, and Malta, and half a decade earlier, it included Greece, Luxemburg, Ireland, Cyprus, and Malta. This shows that in the studied years, little changed for the better in countries such as Cyprus or Ireland. The situation improved in Greece, Luxembourg, and Malta, and deteriorated in Slovakia and Poland. During the 10-year period, Cyprus did not change its position in the overall ranking in terms of the level of RES development—it ranks 25th and is characterized by a low level of development. However, despite this, the country has already achieved its 2020 target for the use of RES at the level of 13%. This is an impressive result, because Cyprus has been producing energy from renewable energy since 2009 [
79].
Both Slovakia and Poland are countries that in 2008 were rated as average low in terms of RES development, and a decade later, in 2018, this level was assessed as low. Slovakia dropped from the 18th place in 2008 to the 24th place in 2018 in the overall ranking of the EU countries (
Table 10), and Poland—from the 21st place to the 26th place. Both countries may have problems in achieving the 2020 target of 15% [
80,
81]. In 2018, this share was only slightly over 11% (it was slightly higher in Slovakia). Gross electricity production from RES in the national mix in Slovakia increased over the decade from 16.5% to 39.4%, and in Poland from 4.6% to 13%. On the other hand, gross inland consumption by product in Slovakia increased from 5.15% to 9.45%, and in Poland—from 5.7% to 8.5%. Both countries slightly increased the amount of energy produced and consumed per capita and GDP. However, these increases are very low when compared to other EU countries, which affects the final assessment of the level of RES development in these countries (low level). Slovakia has a number of mechanisms to support the development of RES. These include mainly feed-in tariffs, excise tax exemptions and subsidy programs. In addition, there are also mandatory requirements for the integration of renewable heating technologies into residential spaces. They are of fundamental importance for stimulating heating from RES.
Ireland, in turn, is the last country in the overall ranking of the EU-27 countries in terms of RES development. A decade earlier, in 2008, Ireland ranked 26th (
Table 10). Like Poland and Slovakia, Ireland is unlikely to achieve its 2020 target. In 2018, final green energy consumption was just over 11%, and the target was 16%.
Ireland is the second country after Malta which statistically shows the least energy consumption from RES per capita (similar to 2008). Additionally, in terms of energy consumption per GDP, Ireland is in the last place among the EU countries. On the other hand, gross electricity production from RES in the national mix increased from 12.96% to 33.51%.
When analyzing the level of RES development in the EU, it is worth noting the problems associated with it in some countries of Central and Eastern Europe, which belong to the group of new EU members. In general, while in 2008 these countries had high positions in the RES compared to the "old" EU countries, already in 2018, the situation changed. Hungary, Slovakia, and Poland are clearly lagging behind in this respect. This is largely due to the fact that these countries changed their energy mixes to a little extent in the period under review. This is because their economies are still based on conventional energy sources. The rate of change in the old member states over this period was much faster, due to their greater economic and technological potential. Thus, the basic reason for the observed stratification is the lower prosperity of some new EU members (in relation to Germany, Austria, Sweden, Finland, and Denmark) and thus smaller investment opportunities in the area of RES implementation. The old EU countries, as much more affluent, are more involved in environmental protection, including RES development. In these countries, there is also a greater social awareness of the need for such changes. However, in some countries of the new EU (e.g., Poland), the development of RES is also hindered by high support for energy based on conventional energy sources [
82]. In this case, only about half of the population is strongly in favor of RES development. Undoubtedly, the countries’ capabilities and, consequently, the number of investments in environmental protection should translate into an improvement of the environmental quality.
Lower economic and technical development of the new EU countries is also of significant importance. Therefore, the process of energy transition in these countries requires a well thought out and reasonable energy policy of the EU. When developing and implementing this policy, social and political factors should also be taken into account, which in this region may be of key importance.
The presented discussion, based on the conducted analysis, should constitute an important source of knowledge in the scope of assessing the current state and the possibilities of developing RES in the EU countries. It can be assumed that both the methods utilized in the study and the findings made it possible to reliably evaluate the state of this energy sector, and the effects of changes that individual countries have introduced in this sector.
6. Conclusions and Policy Implications
The introduction of a sustainable development economy is a great opportunity for further dynamic and relatively environmentally neutral economic development worldwide. This concept, perceived as a utopian a few years ago, is becoming the basic idea of economic growth in many countries and regions. The development of technology has made it possible to obtain renewable energy in a cost-effective manner. Due to the wide spectrum of these sources, virtually every country has a chance to achieve energy independence to a greater or lesser extent. This state of affairs, with conventional energy sources, was impossible to achieve for many countries. RES development is observed to be particularly dynamic in the EU. This can be done through appropriate legislation and a very decisive approach to achieving a zero-carbon economy.
Nevertheless, in order to achieve this state of affairs, it is necessary to put a lot of effort, undertake certain activities and make huge investments. For this reason, it is important to constantly monitor and research the energy market in terms of its condition and the results of introduced changes.
The material presented in this article serves this purpose. This extensive research shows that the state of RES in the EU countries is satisfactory, despite the fact that it varies in individual countries.
The study on the assessment of the level of EU-27 development between 2008–2018 indicate that the European energy transition is proceeding at a fast pace. However, the dynamics of changes differs from country to country. In the years 2008–2013, the average volume of gross electricity production from RES in the EU mix increased from 21.18% to 32.11%, and between 2013–2018 to 38.16%. The current leader in this respect is Sweden (58.61%), and a decade ago, it was Latvia (60.91%). Cyprus is currently on the opposite side (9.43%), and a decade ago, it was Malta (0.0%). The average share in energy consumption from RES in 2018 amounted to 21.46%, in 2013 to 19.03%, and in 2008 to 14.21%. Sweden remains the leader among European countries in this regard, while the Netherlands are currently (2018) on the opposite side (7.38%), and in 2013 and 2008, it was Malta (0.195% and 3.76%). In 2018 in the EU, there was on average 0.61 TOE of energy produced from RES per citizen, and 0.29 TOE finally consumed. A decade earlier, it was 0.41 TOE and 0.22 TOE, respectively. Finland is the unquestionable leader in terms of energy production and consumption per citizen. In turn, when taking into account the economic potential, Latvia was the leader in the production and consumption of RES both in 2008 and 2018.
It should be emphasized that EU countries have very good access to virtually all sources of renewable energy. In individual countries, however, there are considerable differences in this respect. Undoubtedly, natural conditions (geographical, geological, ecological) are of great importance in this regard. The availability of geothermal water will have a significant impact on the development of geothermal energy, while the size of watercourses and the potential of falling water within a country will have a significant influence on the development of hydropower. In the case of biomass energy, the size of the country’s area and its degree of afforestation play a crucial role. In turn, for wind energy production, the size of the country’s area (the size of areas excluded from the possibility to locate RES installations—related to the protection of nature, landscape, cultural heritage, spatial order, or quality of human life) and wind conditions are essential, and in the case of photovoltaics—the number of sunny days per year and the degree of insolation.
In the context of the idea of the European Green Deal and the development of RES, it is necessary to undertake a broader debate on the diversity of possibilities to generate energy from RES in individual countries. It seems reasonable to integrate the EU in terms of energy and to promote and support the development of RES in countries with possibilities. In particular, this should concern the new EU members that show the biggest problems with the implementation of the energy transition process.
The results include 4 groups of countries with different levels of RES development. It is justified that countries with a low level of RES development should benefit from the experience of countries with a high level of RES development. It is necessary to support, promote, and subsidize investments in RES. The promotion and support of new innovative technologies is also connected with this process. Only such specific actions that involve all EU members can guarantee that the whole Union will have achieved zero emissions by 2050.
The entire transition process should also bear in mind the social costs and the need to educate and support local communities. Some countries, or regions of countries, show strong social resistance to RES, for example, Poland, and are precisely the areas where hard coal is still being exploited as an energy raw material.
The conducted research and the results clearly indicate the need for this type of analysis. The applied methods made it possible to assess the state of this energy to a very wide extent. The extensive discussion of the results shows the diversity of actions taken by individual countries and their achievements. However, it does not exhaust the subject, yet points to its importance and topicality.
It should be noted that the EU countries were the first to introduce such stringent emission standards and pro-ecological measures. It goes without saying that the success of the adopted policy will have a huge impact also on other parts of the world. It will show that a pro-ecological energy transition is possible, which will not cause an economic collapse yet, on the contrary, it may become an impulse for the dynamic development of the countries introducing it.
The material presented in this paper together with the results constitute a new approach to the problem of evaluation and development of RES in the EU countries. This publication should also be treated as a voice in the discussion on the creation of a modern and dynamically developing innovative zero-emission economy. Undoubtedly, the research carried out on the basis of the adopted indicators, taking into account the economic, demographic, and geographic potential of individual countries, fits in with this discussion.
The authors hope that this publication will encourage other researchers to take up this issue. Its promotion and thorough analysis should contribute to the global improvement of our environment.


