Article

Microwave Spectroscopy as a Potential Tool for Color Grading Diamonds †

1
Department of Electrical & Electronic Engineering, Ariel University, Ariel 40700, Israel
2
Department of Chemical Sciences, Ariel University, Ariel 40700, Israel
3
Department of Chemistry, Faculty of Natural Sciences, Ben-Gurion University of the Negev, Beer Sheva 84105, Israel
*
Author to whom correspondence should be addressed.
This paper is an extended version of our paper in IEEE International Conference on Microwaves, Antennas, Communications and Electronic Systems (COMCAS), Tel Aviv, Israel, 2019, pp. 1–5.
Energies 2021, 14(12), 3507; https://doi.org/10.3390/en14123507
Submission received: 5 May 2021 / Revised: 4 June 2021 / Accepted: 9 June 2021 / Published: 12 June 2021
(This article belongs to the Special Issue RF/Microwave Circuit Design and Characterization Techniques)

Abstract

:
A diamond’s color grading is a dominant property that determines its market value. Its color quality is dependent on the light transmittance through the diamond and is largely influenced by nitrogen contamination, which induces a yellow/brown tint within the diamond, as well as by structural defects in the crystal (in rare cases boron contamination results in a blue tint). Generally, spectroscopic instrumentation (in the infrared or UV–visible spectral range) is used in industry to measure polished and rough diamonds, but the results are not accurate enough for precise determination of color grade. Thus, new methods should be developed to determine the color grade of diamonds at longer wavelengths, such as microwave (MV). No difference exists between rough and polished diamonds regarding stray light when the MW frequency is used. Thus, several waveguides that cover a frequency range of 3.95–26.5 GHz, as well as suitable resonator mirrors, have been developed using transmission/reflection and resonator methods. A good correlation between the S12 parameter and the nitrogen contamination content was found using the transmission/reflection method. It was concluded that electromagnetic property measurements of diamonds in the MW frequency range can be used to determine their nitrogen content and color grading. The MW technique results were in good agreement with those obtained from the infrared spectra of diamonds.

Graphical Abstract

1. Introduction

The criteria used for pricing diamonds in the jewelry trade are the 4 C’s [1] (Carat, Color, Cut, and Clarity). The color grade and the size are the most significant properties for evaluating a diamond’s price. Gemological laboratories determine a diamond’s color grading using human eyes and by comparing the diamonds with a set of predefined color grade master diamonds [2]. Furthermore, in the last 50 years, some optical equipment in the infrared range and in the UV–visible spectrum have been frequently used for ranking a diamond’s color [3,4,5,6,7,8,9,10].
The yellow to brownish color which occurs in a diamond is the main indicator of color degradation. Nitrogen (N) atom contamination is responsible (in at least 95% cases) for a diamond’s color degradation, inducing a yellow-brown tint [6,11,12,13]. The nitrogen atom is smaller, at ~56 pm, compared to the carbon atoms, 67 pm [14]; thus, it can contaminate the diamond crystal when carbon atoms are replaced. A brown color occurs (~1–3%) due to plastic deformation: slight deviations from an ideal structure can exist in the crystal as a result of the carbon atoms’ position [15,16]. In addition, rarely, boron (B) atoms (which are small compared to carbon atoms) may replace carbon in the diamond, producing a bluish-gray color (e.g., the well-known Hope diamond [4,7,17,18]). The nitrogen content in the diamonds is due to an impurity, which is spread homogenously in the diamond crystal during the formation of the natural diamond in the Earth’s crust magma.
The letters D-M represent the color grading system [3]; an earlier letter alphabetically indicates a better quality, and a higher price. Diamonds that have no nitrogen concentration at all (defined as type 2a) and no plastic deformation are denoted as D type in the gemological certificate of the diamond.
As previously mentioned, to evaluate the color grade for rough stones, two main methods are used: UV–visible or infrared spectroscopy [3,19].
For the UV–visible range, a commercial unit is used, but the accuracy is poor. For the infrared spectral range, the nitrogen content can be identified by analyzing the absorption peaks and distinguishing them from the absorption peaks of the diamond’s crystal structure. Errors occur in determining the color grading in rough stones because the scattered light is proportional to 1/λ4. Explicitly, shorter wavelengths will cause the scattered light to increase, causing perturbations and imprecise measurements. Thus, infrared spectroscopy in the micrometer wavelength range (larger λ, 4–25 μm) is superior to the shorter wavelength UV–visible range (larger λ, 250–700 nm). For uncut and rough diamonds, the effect of the surface shape can also be detrimental, causing inaccuracy in determining the color grade. MW spectroscopy has advantages because its range, used here, has a much longer λ and thus more potential to measure a diamond’s electromagnetic/optical properties [20].
Another advantage is the price of a MW color grading system. A MW detector, if developed, is expected to be much less expensive in a commercial unit than in a FTIR unit (with an estimated price of 25,000 USD per unit). The electromagnetic wave source and the detectors in the MW spectral region are also much cheaper.
To the best of our knowledge, the only reports that have investigated and analyzed nitrogen concentration (or color grading) using MW techniques is [21] which handled frequencies in the range of 100–110 GHz. However, some work in CVD diamonds [22] and in nanodiamonds [23,24] determined their permittivity in the MW range.
ε r ( f )   , which is the dielectric permittivity, is a frequency dependent quantity, affected by the type of atoms in the diamond crystal, i.e., nitrogen and carbon. Each atom has a different number of electrons. Thus, different binding forces take place between the nucleus and the surrounding electrons, resulting in a corresponding electronic susceptibility [25].
The electronic susceptibility of the carbon atoms is given by:
χ C ( f ) = e 2 ε 0 m   i   ζ i C   ( f i C 2 f 2 j f γ i C ) 1
while the contribution of the nitrogen atoms is:
χ N ( f ) = e 2 ε 0 m   i   ζ i N   ( f i N 2 f 2 j f γ i N ) 1
where f is the frequency, m and e represent the electron mass and charge, respectively,   ζ i is the number of electrons per each atom ( C for carbon, and N for nitrogen) with respective binding frequency f i and damping constant γ i , and N N and N C are the nitrogen and carbon molecules per unit volume, respectively.
ε r ( f ) = 1 + N C χ C ( f ) + N N χ N ( f ) = 1 + N C [ χ C ( f ) + N N N C χ N ( f ) ]
In the last equation, we identify N N N C   as the nitrogen concentration in the diamond. The dielectric permittivity is revealed to be dependent both on frequency and on the concentration of nitrogen atoms.
In this paper, spectroscopic characterization of the diamond is done using a microwave cavity (waveguide or resonator) described in Section 2.2.2 and Section 2.2.3. A comparison is made with the color grading done with infrared spectroscopy (Section 2.2.1). The characterization is done via transmission or reflection S parameters measurements as described in Section 2.2.2. The frequency range for both methods is 3.95–26.5 GHz.

2. Materials and Methods

2.1. The Diamonds

In order to find a correlation between the MW parameters and the nitrogen concentration, several diamonds (master diamonds) with different nitrogen concentrations were bought from the Israeli Diamond Exchange. To determine the nitrogen effect, similar master diamonds were selected: all had a brilliant cut (round stones) of the same size: 0.30 ± 0.02 carat, a length and width around 2.65 mm × 4.35 mm, and a height of 1.99–2.15 mm. In addition, all the master diamonds had no fluorescence and no strained diamond crystals (i.e., no diamonds with plastic deformation were tested). The measurements took place at a constant temperature of 24 °C. Figure 1 displays a picture of the master diamonds with different nitrogen concentrations. As mentioned in the introduction, the first master diamond, termed 2a, has no nitrogen contamination; the nitrogen concentration increases in alphabetical order: 2a (D color grade), D (D color grade), H (H color grade), and L1 (L color grade).
The master diamonds were graded by the GIA (Gemological Institute of America). Figure 2 displays an example of the certificate for the H diamond.

2.2. Methods

2.2.1. Infrared Spectroscopy

In order to (1) validate that no plastic deformation exists, (2) estimate the nitrogen contamination content in the master diamonds, and (3) compare the novel evaluated method to an established method in the trade, the infrared spectra of the master diamonds were measured using a Bruker ALPHA II Fourier-transform infrared (FT-IR) spectrometer. Figure 3, Figure 4, Figure 5 and Figure 6 show the obtained spectroscopic results.
The absorption peaks observed at 1700–4000 cm−1 are due to stretching vibrational frequencies of the diamond crystal itself; those found at 800–1600 cm−1 are attributed to N-C vibrations in the diamond crystal. Consequently, the absorption peak at 1370 cm−1 stems from platelet moiety [26] in the diamonds, whereas 1Aa nitrogen types cause absorption at 1010 cm−1.
As shown, diamond 2a (Figure 3) contains no nitrogen contamination (no peaks were found in the nitrogen range). The peaks found in the nitrogen range (the absorption peaks are that of N2 (1282 cm−1) or N4 aggregates (1175 cm−1) and platelets (1370 cm−1), and the peak at 1095 cm−1 stems from nitrogen vibrations in the diamond crystal) increased appreciably in the D (Figure 4), H (Figure 5), and L1 (Figure 6) diamonds. This can be clearly seen in the Figure 3, Figure 4, Figure 5 and Figure 6 as the absorption of nitrogen impurities in the 800–1400 cm−1 is zero for the 2a diamond and increases appreciably from the D diamond to the H, and again in the L1 diamond. Thus, the absorption at the 1095 cm−1 peak for 4 master diamonds (i.e., 2a, D, H, and L1), corresponds to 0, 40, 1790, and 2960 ppm of nitrogen (the absorbance values at 1095 cm−1 are linear to the relative concentration of nitrogen, respectively).
Nitrogen concentration in the diamond has been calculated from this measurement. The absorption values at 1095 cm−1 are IIa- 0 (Figure 3), D- 0.09 (Figure 4), H- 1.14 (Figure 5), and L1- 1.84 (Figure 6), and used as a quantitative measure for estimation of the N contamination content using the following protocol [21]:
(1) baseline correction following (2) normalized the spectrum (there is an absorption coefficient of 12.3 cm−1 at 2000 cm−1). (3) Extraction of μ (absorption coefficient in [cm−1]) and K (Proportionality Constant ppm/cm−1) according to the diamond type [K(1130 cm−1) = 25 ± 2 ppm/cm−1, K(1282 cm−1 {IaA}) = 16.2 ± 1 ppm/cm−1, K (1282 cm−1 {IaB}) = 79.4 ± 8 ppm/cm−1. (4) calculate by using the following equation:
N N N C     [ ppm ] = K μ .

2.2.2. Transmission/Reflection Method

The transmission/reflection method is a well-established method to measure materials in the MW region [27,28]. In this method the sample is placed in a waveguide, and by measuring the 2 ports of complex scattering parameters with a vector network analyzer (VNA) connected to it, a complex reflection (S11) and transmission (S12) can be obtained.
In order to determine how the nitrogen levels in the master diamonds affected the S12 parameter, we tested them using the following waveguides: WR187, WR90, WR62, and WR42, covering a frequency range of 3.95–26.5 GHz. The first waveguide was WR187, which was adequate for the frequency range of 3.95–5.85 GHz; it has a cutoff frequency at 3.153 GHz (beneath this frequency level no signal can propagate in the waveguide). The dimensions of WR187 were 22.1488 mm × 47.5488 mm. The second waveguide we used was a WR90 waveguide of dimensions 10.16 mm × 22.86 mm, designed for a frequency range of 8.2–12.4 GHz with a cut off frequency at 6.557 GHz. The third waveguide used was WR62, with a frequency range of 12.4–18 GHz, a cutoff frequency of 9.488 GHz, and dimensions of 7.8994 mm × 5.7988 mm. The fourth waveguide with which we experimented was the WR42 waveguide (10.668 mm × 4.318 mm), with a frequency range of 18–26.5 GHz. Table 1 summarizes the waveguide parameters.
Above a frequency of 26.5 GHz, the single mode waveguide dimension becomes too small to place a diamond in it; thus, it was not suitable for measuring.
To accurately place the master diamonds, we designed and fabricated a polyethylene container to fix the diamonds’ position in the waveguides. Polyethylene was chosen to decrease the effect of the container on the reflection and transmission, because polyethylene has permittivity values of around 2.2 at this frequency range, and the diamond’s permittivity is between 5.5 and 10; thus, it allowed considerable contrast. Figure 7 displays the WR90 waveguide and its container. For replicating the measurements, all waveguides and their containers were marked so that the same diamond’s position and direction in the waveguide were repeated in each experiment. The WR42 waveguide, the spectrum analyzer, and the measurement procedure are presented in Figure 8. Figure 9 displays the WR187 waveguide.

2.2.3. Resonant Method

The resonant method is also used for measuring the nitrogen content of a diamond [29]. In this method, in which the set-up is similar to the previous method, two mirrors are located at both edges of the waveguide, resulting in a resonator. Since the mirrors cause multiple reflections, the effect of the diamond’s electromagnetic properties is stronger using this approach.
Both the transmission/reflection and resonator methods are based on measuring the S-parameters. These parameters are components of a complex matrix that displays the reflection/transmission characteristics in the frequency domain. For a two-port device, four S-parameters can be measured. According to the S-parameters enumeration rule, the first digit denotes the port from which the signal is measured, whereas the second digit is the port where the signal is inserted. Thus, S12 measures the signal transferred from port 2 into port 1, whereas S21 measures the signal at port 2, resulting from the transmission from port 1. When the numbers are the same (e.g., S11, S22), it signifies a reflection, since the output and input ports are the same [30].
For rectangular waveguide of length d and width a, the transmission of the TE10 mode is given by [31]:
S 12 ( f ) = e j k z ( f ) · 2 d · ( 1 Γ 2 ) · e j k z d 1 Γ 2 · e j 2 k z d
where the longitudinal wavenumber is:
k z ( f ) = ( 2 π f c ) 2 ε r   e f f   ( f ) ( π a ) 2
Here, ε r   e f f   ( f ) is the effective permittivity inside the waveguide in the presence of the diamond and c is the speed of light. The reflectivity Г is defined by:
Г = Z Z 0   Z + Z 0  
where the impedance of the loaded waveguide is:
Z = 2 π f μ 0   k z  
μ 0 is the permeability of the vacuum, and
Z 0 = 2 π f μ 0   k z 0  
is the impedance of the empty waveguide, for which the longitudinal wavenumber is:
k z 0 ( f ) = ( 2 π f c ) 2 ( π a ) 2
All measurements were done using network Analyzer model N5230 from Keysight (formerly Agilent). The VNA was calibrated with the RPC 3.50 calibration kit model 03CK10A–150 (Rosenberger).

3. Results and Discussion

The 4 master diamonds were measured 20 times using the transmission/reflection method. The frequency used in all measurements was the waveguide’s full range.
Examining the results of transition S12 magnitude revealed a correlation between the measured signal level in dB (attenuation from the original signal) and the nitrogen concentration.
Figure 10 presents the value of S12 when the master diamonds are inserted into the WR62 waveguide. Each diamond’s average S12 value is presented vs. the frequency. This implies that reducing the nitrogen concentration in a diamond also reduces the S12 transition parameter.
Inspection of Figure 10 revealed that the nitrogen concentration (and therefore the resultant color grade) can be determined via the transmission S12 measurements. The level in dB of the measurements decreases for lower nitrogen concentrations. The trend of this correlation is within the frequency range of 17.6 GHz. To achieve better discrimination of color grading, we present in Figure 11 a correlation graph of S12 parameters in dB vs. the nitrogen concentration in ppm (calculated from the absorption values of the 1095 cm−1 peaks in the infrared spectrum). A linear regression line is also illustrated to show the correlation of the measured S12 with the nitrogen concentration.
The trend of the correlation between S12 and nitrogen concentrations can be seen again in Figure 11. Noting the linearity of the trend, a direct a mapping from S12 measurements to nitrogen concentration can be employed.
In order to verify a reliable S12 value, we carried out additional measurements. Each diamond type was inserted into the cavity and the parameter S12 was measured by the VNA. Figure 12 shows the resulting normal statistical distributions of the measured S12 for each diamond type. Each distribution center represents the average value of the S12 measurements for each of the master diamonds, revealing some overlaps.
Figure 12 demonstrates the statistical distribution of the S12 measurements. There is a clear difference between master diamond types 2a and L1, consisting of the lowest and highest nitrogen concentrations, respectively, with a high level of reliability.
Table 2 summarizes the average value and the standard deviation (STD) of S12 at a frequency of 17.72 GHz for the characterized master diamonds. The S12 parameter increases with the nitrogen concentration (Figure 3, Figure 4, Figure 5 and Figure 6). The same correlation is revealed for the color grade.
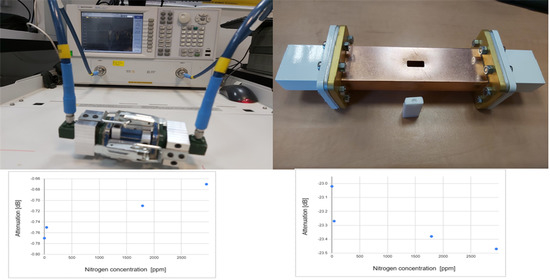
Experiments were also carried out at 26 GHz using the waveguide WR42. Figure 13 displays the S12 parameter (in dB) vs. the nitrogen concentration (in ppm).
The regression line drawn in the Figure 13, denoted by a dashed line, implies that a decrease in S12 corresponds to an increase in the nitrogen concentration. The strict trend demonstrates that spectroscopic diamond characterization at a frequency near 26.025 GHz can estimate the diamond nitrogen concentration and color. As in Figure 11, in Figure 13 a linear trend is demonstrated.
The measurement statistics are displayed for each diamond type as normal distribution graphs in Figure 14.
As demonstrated, at low nitrogen concentrations almost no overlapping exists between the master diamond 2a (zero nitrogen) and the L master diamond (with the highest concentration level of nitrogen). At this frequency, the evaluation is shown to be robust. The overlapping indicates the probability of incorrect color evaluation.
Table 3 summarizes the mean value and the STD of S12 at a frequency of 26.025 GHz for the master diamonds examined. The S12 parameter decreases as the nitrogen concentration increases (see Figure 3, Figure 4, Figure 5 and Figure 6). The same trend is observed for the color grade.
With WR90, no correlations in the frequencies were found; however, when measurement of the diamonds using this waveguide at lower frequencies towards its cutoff was attempted, an interesting result was found at around 7 GHz. Figure 15 and Figure 16 display normal distributions graphs which present the average and the STD of some frequencies near the cutoff of the WR90 waveguide. Since the cutoff frequency was 6.557 GHz, it was measured from 6–8 GHz.
As before, a correlation is successfully found between the nitrogen concentration and the transmission S12 parameter near 7.0375 GHz and 7.175 GHz. The average values of S12 measurements presented in Figure 15 and Figure 16 increase as the nitrogen concentration falls. A higher level of S12 implies a better color grading. Despite the overlap between the distributions in the master diamonds D and H, the average value can be a good indicator for the color grade, since 2a and L1 master diamonds present almost no overlapping between their corresponding transmission and only a small overlap to master diamonds D and H. Table 4 summarizes the mean values and the STD of S12 measured at a frequency of 7.175 GHz for the master diamonds. The S12 parameter decreases as the nitrogen concentration increases (Figure 3, Figure 4, Figure 5 and Figure 6).
Table 5 summarizes the mean value and the STD of S12 at a frequency of 7.0375 GHz for the master diamonds. The S12 parameter decreases when the nitrogen increases (Figure 3, Figure 4, Figure 5 and Figure 6).
As in the WR42 waveguide experiments, almost no overlaps existed between the highest concentration (L1) and the lowest concentration (2a). A small overlap was found between the 2a and L1 master diamonds and the other two D and H diamonds, which have nitrogen concentrations.
In the resonator method, a nitrogen concentration correlated frequency was found using the WR187 waveguide. As expected in such a multi-reflection cavity, the unique periodic spectral signature of such a structure is significant. Figure 17 displays the resulting S12 for the full frequency range available at this waveguide.
Closer inspection reveals that the S12 peak locations are correlated with the nitrogen concentration, and therefore with the color grade as well.
Figure 18, Figure 19, Figure 20 and Figure 21 display peak shifts at 3.27 GHz, 3.7 GHz, 4.29 GHz, and 5.01 GHz, respectively, obtained for the different diamond types. Figure 22 displays the statistics of the location of the peaks, revealing that no overlap exists between the 2a and L1 master diamonds.
Figure 18, Figure 19, Figure 20 and Figure 21 show that there is a clear correlation between the nitrogen concentration and the location of the peak which resulted due to resonances. Higher peak frequency is correlated with lower nitrogen concentration. The correlation is similar for all the peaks in the frequency range of 3.15–5.85 GHz. As such, it is reliable indicator for the estimation of the color grade.
Figure 22 implies that the overlapping between the 2a master diamond and the L1 master diamond is negligible, so no false color grade identification is expected using resonator-based spectroscopy for the above color gradings. It indicates that this approach presents more reliable characterizations compared to transmission/reflection measurements. A clear discrimination between H and D master diamonds is revealed.
Table 6 summarizes the average and STD of the spectral peak locations for different master diamonds. The peak frequency decreases as the nitrogen concentration increases.
The results indicate that a strong correlation exists between the nitrogen concentration and the electromagnetic parameters using several methods and a wide range of frequencies. Since the wavelength of the above frequencies is longer, the results show promise for finding a technique for evaluating the color grade of rough and polished diamonds. Further research will elaborate whether and how the size of the diamonds affects the measurements. In addition, a master series of rough diamonds should also be tested using the above methods.

4. Conclusions

A wide frequency range from 3.95 GHz to 26.5 GHz is used for microwave spectroscopy of diamonds. Experimental results of both transmission and resonance peak locations led to a clear correlation with the nitrogen concentration. The color grade is shown to be indicated via transmission (characterized by the S12 parameter) or via cavity resonance. Correlation with the nitrogen concentration is found in various frequency regimes. In transmission measurements, the correlation was identified around 17.6 GHz, 26.025 GHz, 7.175 GHz, and 7.0375 GHz. Using a resonator, correlation was revealed between resonance peak and diamond color grade in the frequency range of 3.95–5.85 GHz. Table 7 summarizes the results that imply reliable color estimations when using microwave spectroscopy in different frequency regimes.
(i)
A novel technique for measuring the dielectric properties of diamonds was discussed. The transmission/reflection and resonator methods in the MW frequency range were used, especially at 26.025 GHz (using WR42), 7.0375 GHz, and 7.175 GHz (using WR90) for the transmission method (by measuring the average transmission S12), and for the resonator method (by measuring the location peaks with WR187) at 3.27 GHz, 3.7 GHz, 4.29 GHz, and 5.01 GHz.
(ii)
The concentration of nitrogen contamination in diamonds can also be determined using these methods.
(iii)
Based on this conclusion, the color grade of diamonds can be determined by their dielectric properties; to the best of our knowledge, this has never been reported before.
(iv)
Thus, microwave spectroscopy can be used for the color grading of polished stones, or for determination of the color grading of polished stone from the microwave spectroscopy measurement in the rough stone prior to the polishing process.

5. Patents

A patent application was submitted under the name of “Method and Device for Grading Diamonds”, WO2019180718A1.

Author Contributions

Conceptualization, A.Y., H.C. and Y.P.; methodology, A.Y., H.C. and Y.P.; formal analysis, Y.R. and A.E.; investigation, Y.R. and A.E.; resources, A.Y., H.C. and Y.P.; data curation, Y.R.; writing—original draft preparation, Y.R.; writing—review and editing, A.Y., H.C. and Y.P.; visualization, Y.R.; supervision, A.Y., H.C. and Y.P.; project administration, A.Y., H.C. and Y.P.; funding acquisition, A.Y., H.C. and Y.P. All authors have read and agreed to the published version of the manuscript.

Funding

This research was funded by the Israeli Ministry of Economics through the KAMIN program, and the authors wish to acknowledge this assistance.

Acknowledgments

The authors thank the Israeli Ministry of Economics for their support.

Conflicts of Interest

The authors declare no conflict of interest.

References

  1. Available online: https://www.americangemsociety.org/page/ (accessed on 9 June 2021).
  2. Available online: https://www.gia.edu/gia-about-4Cs-Color (accessed on 9 June 2021).
  3. Eaton-Magaña, S.; Ardon, T.; Breeding, C.M.; Shigley, J.E. Natural-color D-to-Z Diamonds: A Crystal-clear perspective. Gems Gemol. 2020, 56, 318–335. [Google Scholar] [CrossRef]
  4. Bouman, M.; Anthonis, A.; Chapman, J.; Smans, S.; De Corte, K. The effect of blue fluorescence on the colour appearance of round-brilliant-cut diamonds. J. Gemmol. 2018, 36, 298–315. [Google Scholar] [CrossRef]
  5. Breeding, C.M.; Eaton-Magaña, S.C. Fluorescence of Natural and Synthetic Gem Diamond: Mechanism and Applications; Encyclopedia of Analytical Chemistry; John Wiley & Sons, Ltd.: Hoboken, NJ, USA, 2019. [Google Scholar]
  6. Breeding, C.M.; Eaton-Magaña, S.C.; Shigley, J.E. Naturally colored yellow and orange gem diamonds: The nitrogen factor. Gems Gemol. 2020, 56, 194–219. [Google Scholar] [CrossRef]
  7. Eaton-Magaña, S.C.; Breeding, C.M.; Shigley, J.E. Natural-color blue, gray, and violet diamonds: Allure of the deep. Gems Gemol. 2018, 54, 112–131. [Google Scholar] [CrossRef]
  8. Eaton-Magaña, S.C.; Ardon, T.; Smit, K.V.; Breeding, C.M.; Shigley, J.E. Natural-color pink, purple, red, and brown diamonds: Band of many colors. Gems Gemol. 2018, 54, 352–377. [Google Scholar]
  9. Eaton-Magaña, S.C.; Ardon, T.; Breeding, C.M.; Shigley, J.E. Natural-color fancy white and fancy black diamonds: Where color and clarity converge. Gems Gemol. 2019, 55, 320–327. [Google Scholar] [CrossRef]
  10. King, J.M.; Shigley, J.E.; Gelb, T.H.; Guhin, S.S.; Hall, M.; Wang, W. Unusually large novelty cut. Gems Gemol. 2005, 41, 88–111. [Google Scholar] [CrossRef]
  11. Breeding, C.M.; Shigley, J.E. The ‘type’ classification system of diamonds and its importance in gemology. Gems Gemol. 2009, 45, 96–111. [Google Scholar] [CrossRef]
  12. Fridichova, J.; Bacik, P.; Skoda, R.; Antol, P. Use of spectroscopic methods for determination of diamond origin and treatment. Acta Geol. Slovaka 2015, 1, 11–18. [Google Scholar]
  13. Hainschwong, T.; Natori, F.; Fritsch, E.; Massi, L. Natural, untreated diamonds showing the A, B and C infrared absorptions (“ABC diamonds”), and the H2 absorption. Diam. Relat. Mater. 2006, 15, 1555–1564. [Google Scholar] [CrossRef]
  14. Available online: http://periodictable.com (accessed on 9 June 2021).
  15. Schoor, M.; Boulliard, J.C.; Gaillon, E.; Dupack, O.; Esteve, I.; Baptiste, B.; Rondesn, B.; Fritsch, E. Plastic deformation in natural diamonds: Rose channels associated to mechanical twinning. Diam. Relat. Mater. 2010, 66, 102–106. [Google Scholar] [CrossRef]
  16. Howell, D.; Piazolo, S.; Dobson, D.P.; Wood, I.G.; Jones, A.P.; Walte, N.; Forst, D.J.; Fisher, D.; Griffin, W.L. Quantitative characterization of plastic deformation of single diamond crystals: A high pressure high temperature (HPHT) experimental deformation study combined with electron backscatter diffraction (EBSD). Diam. Relat. Mater. 2012, 30, 20–30. [Google Scholar] [CrossRef] [Green Version]
  17. Available online: https://www.si.edu/spotlight/hope-diamond (accessed on 9 June 2021).
  18. Gaillou, E.; Post, J.E.; Rost, D.; Butler, J.E. Boron in natural type IIb blue diamonds: Chemical and spectroscopic measurements. Am. Mineral. 2012, 97, 1–18. [Google Scholar] [CrossRef]
  19. Shigley, J.E.; Breeding, M.C. Visible Absorption Spectra of Colored Diamonds. Gems Gemol. 2015, 51, 41–43. [Google Scholar] [CrossRef]
  20. Rabinowitz, Y.; Etinger, A.; Yahalom, A.; Cohen, H.; Pinhasi, Y. Characterization of Diamond Colors via Microwave Spectroscopy. In Proceedings of the 2019 IEEE International Conference on Microwaves, Antennas, Communications and Electronic Systems (COMCAS), Tel-Aviv, Israel, 4–6 November 2019; pp. 1–5. [Google Scholar]
  21. Rabinowitz, Y.; Etinger, A.; Litvak, B.; Litvak, I.; Yahalom, A.; Cohen, H.; Pinhasi, Y. Millimeter wave spectroscopy for evaluating diamond color grades. Diam. Relat. Mater. 2021, 116, 108386. [Google Scholar] [CrossRef]
  22. Choi, J.J. Dielectric Measurements of CVD Diamonds at Millimeter Wavelength Using a Fabry-Perot Open Resonator. Int. J. Infrared Millim. Waves 2005, 26, 1427–1436. [Google Scholar] [CrossRef]
  23. Cuenca, J.; Thomas, E.; Mandal, S.; Williams, O.; Porch, A. Microwave determination of sp2 carbon fraction in nanodiamond powders. Carbon 2015, 81, 174–178. [Google Scholar] [CrossRef]
  24. Cuenca, J.A.; Thomas, E.; Mandal, S.; Williams, O.; Porch, A. Investigating the Broadband Microwave Absorption of Nanodiamond Impurities. IEEE Trans. Microw. Theory Tech. 2015, 63, 4110–4118. [Google Scholar] [CrossRef]
  25. Jackson, J.D.; Levitt, L.C. Classical Electrodynamics. Phys. Today 1962, 15, 62. [Google Scholar] [CrossRef] [Green Version]
  26. Woods, G.S. Platelets and the Infrared Absorption of Type Ia Diamonds. Proc. R. Soc. Lond. Ser. A 1986, 407, 219–238. [Google Scholar]
  27. Baker-Jarvis, J. Transmission/Reflection and Short Circuit Line Permittivity Measurements. NASA STI/Recon Tech. Rep. N 1990, 91, 28482. [Google Scholar]
  28. Sundaram, M.; Kang, Y.; Hasan, S.M.S.; Howlader, M.K. Measurement of Complex Material Properties Using Transmission/Reflection Method; Deptartment of Electrical and Computer Engineering, University of Tennessee: Knoxville, TN, USA, 2004. [Google Scholar]
  29. Afsar, M.N.; Birch, J.R.; Clarke, R.N. The measurement of theproperties of materials. IEEE Trans. Microwave Theory Tech. 1977, 74, 183–199. [Google Scholar]
  30. Available online: http://literature.cdn.keysight.com/litweb/pdf/5991-3736EN.pdf (accessed on 9 June 2021).
  31. Rothwell, E.J.; Frasch, J.L.; Ellison, S.M.; Chahal, P.; Ouedraogo, R.O. Analysis of the nicolson-ross-weir method for characterizing the electromagnetic properties of engineered materials. Prog. Electromagn. Res. 2016, 157, 31–47. [Google Scholar] [CrossRef] [Green Version]
Figure 1. Four master diamonds with different nitrogen concentrations. From left to right: 2a (D color grade), D (D color grade), H (H color grade), and L1 (L color grade).
Energies 14 03507 g001
Figure 2. The GIA certificate of the H diamond.
Energies 14 03507 g002
Figure 3. The infrared absorption spectra of the 2a master diamond. The absorption values at 1095 cm−1 is 0.
Energies 14 03507 g003
Figure 4. The infrared absorption spectra of the D master diamond. The absorption values at 1095 cm−1 is 0.09.
Energies 14 03507 g004
Figure 5. The infrared absorption spectra of the H master diamond. The absorption values at 1095 cm−1 is 1.14.
Energies 14 03507 g005
Figure 6. The infrared absorption spectra of the L1 master diamond. The absorption values at 1095 cm−1 is 1.84.
Energies 14 03507 g006
Figure 7. The container and waveguide for the 8–12 GHz frequency range.
Energies 14 03507 g007
Figure 8. Container and waveguide for the 12–18 GHz frequency range. The spectrum analyzer and the measurement set-up are shown.
Energies 14 03507 g008
Figure 9. Resonator (WR187 waveguide with mirrors at the edges) for the 3.95–5.85 GHz frequency range.
Energies 14 03507 g009
Figure 10. S12 magnitude of master diamonds in a frequency range between 17.6 and 17.8 GHz. The signal level (S12) measured is correlated with the nitrogen levels.
Energies 14 03507 g010
Figure 11. Master diamonds S12 magnitude vs. the estimated nitrogen concentration at a frequency of 17.72 GHz.
Energies 14 03507 g011
Figure 12. Master diamonds S12 magnitude in a bell-shaped graph at a frequency of 17.72 GHz.
Energies 14 03507 g012
Figure 13. S12 magnitude vs. the nitrogen concentration at 26.025 GHz.
Energies 14 03507 g013
Figure 14. The S12 magnitude of the master diamonds in a bell-shaped graph at a frequency of 26.025 GHz.
Energies 14 03507 g014
Figure 15. The S12 magnitude of diamonds in a bell-shaped graph at a frequency of 7.175 GHz.
Energies 14 03507 g015
Figure 16. The S12 magnitude of master diamonds in a bell-shaped graph at a frequency of 7.0375 GHz.
Energies 14 03507 g016
Figure 17. Spectral signature for the master diamonds at the 3.15–5.85 GHz frequency range measured with a WR187 waveguide.
Energies 14 03507 g017
Figure 18. Location of the peaks of the master diamonds at 3.27 GHz.
Energies 14 03507 g018
Figure 19. Location of the peaks of the master diamonds at 3.7 GHz.
Energies 14 03507 g019
Figure 20. Location of the peaks of the master diamonds at 4.29 GHz.
Energies 14 03507 g020
Figure 21. Location of the peaks of the master diamonds at 5.01 GHz.
Energies 14 03507 g021
Figure 22. Spectral location of S12 peaks for different color graded diamonds (obtained after 20 repeated measurements).
Energies 14 03507 g022
Table 1. The waveguide parameters used in our experiments.
WaveguideFrequency Range [GHz]Cutoff Frequency [GHz]A [mm]B [mm]
WR1873.95–5.853.15347.54 22.14
WR908.2–12.49.48822.86 10.16
WR6212.4–186.557 15.797.89
WR4218–26.514.05110.664.31
Table 2. Average and STD of S12 at a frequency of 17.72 GHz for the master diamonds.
DiamondColorS12 Average [dB]S12 STD [dB]
2aD−0.750.04
DD−0.730.03
HH−0.710.04
L1L−0.650.04
Table 3. Average and STD of S12 at a frequency of 26.025 GHz for the master diamonds.
DiamondColorS12 Average [dB]S12 STD [dB]
2aD−23.010.09
DD−23.260.07
HH−23.380.06
L1L−23.460.07
Table 4. Average and STD of S12 at a frequency of 7.175 GHz for the master diamonds.
DiamondColorS12 Average [dB]S12 STD [dB]
2aD−14.760.03
DD−14.810.01
HH−14.810.01
L1L−14.870.02
Table 5. Average and STD of S12 at a frequency of 7.0375 GHz for the master diamonds.
DiamondColorS12 Average [dB]S12 STD [dB]
2aD−2.770.06
DD−2.880.04
HH−2.890.02
L1L−2.980.03
Table 6. Average and STD of the spectral peaks at frequencies range 3.15–5.95 GHz for different master diamonds.
DiamondColorSpectral Position of Peak Average [GHz]Spectral Position of Peak STD [dB]
2aD3.272740.0001
DD3.272500.0003
HH3.272090.0002
L1L3.271790.0001
Table 7. Summary of the correlation between nitrogen concentration and electromagnetic parameters.
MethodFrequency [GHz]Correlated Parameter
Transmission17.6S12
Transmission26.025S12
Transmission7.0375S12
Transmission7.175S12
Resonator3.27Location peak
Resonator3. 7Location peak
Resonator4.29Location peak
Resonator5.01Location peak
Publisher’s Note: MDPI stays neutral with regard to jurisdictional claims in published maps and institutional affiliations.

