Abstract
High temperature and overheating of photovoltaic panels lead to efficiency losses and eventual degradation. For solar PV systems, this is a significant impediment for achieving economic viability. In this study, a novel Window-Integrated Concentrated Photovoltaic (WICPV) system is proposed for window integration. This offers high (50%) transparency and is fabricated and characterised indoors at an irradiance of 1000 Wm−2. Its electrical performance is tested (a) without applied cooling (i.e., under natural ventilation) and (b) with a heat sink to accommodate passive cooling media. The results are compared to study the effects of reduction in operating temperature on system performances. The effectiveness of a sensible cooling medium (water) and two latent heat removal media, phase change materials (or PCMs, RT50 and RT28HC), is investigated. This paper reports the passive temperature regulation of this WICPV at ambient testing conditions. The results demonstrate an increase in electrical power output by (i) 17% (RT28HC), (ii) 19% (RT50), and (iii) 25 % (circulating water) compared with the naturally ventilated system. This shows that PCMs are considerably useful for thermal regulation of the WICPV. Any improvement in efficiencies will be beneficial for increasing electrical energy generation and reducing peak energy demands.
1. Introduction
A Window-Integrated Concentrated Photovoltaic (WICPV) can be classified as a sub-category of Building-Integrated Concentrated Photovoltaic (BICPV) systems. The concentration of solar irradiance is achieved with the help of refractive concentrators. This technique increases the magnitude of the effective solar radiation available to a photovoltaic (PV) cell for electricity generation. With the concentrating elements, a saving of more than 60% of the solar cells can be achieved against that used for a conventional PV for the same output electricity [1]. Being fixed or stationary in nature, these concentrators can be used without all-day tracking systems, thereby saving operational costs. The factors affecting the electrical power output of a CPV system are material, type, and quality of the solar cells used; the concentration level achieved by the concentrator; the incident solar radiation; and the operating temperature [2]. For this reason, for a given WICPV system working under constant irradiance, any increase in the operating temperature beyond an ideal value of 25 °C limits the system efficiency remarkably [3,4,5].
The two key approaches for PV temperature control can be (a) active [6,7,8] and (b) passive [9,10,11] mechanisms. Active cooling mechanism necessitates an external electrical power source causing parasitic losses and has moving mechanical parts. In comparison, passive cooling mechanism does not need external power, thereby making it a more cost-effective option. In order to control the operating temperature of a WICPV system using passive cooling, there are the options of: (a) free air convection on the front and back, (b) modifying the back-plate architecture by using fins/microfins [12], or (c) using devices/materials to absorb excess heat. Within this selection of passive cooling mechanism, either a latent or a sensible heat-absorbing medium could be used. The latter includes the use of phase change materials, or PCMs, in a containment at the rear side of the WICPV.
The use of PCMs, with desirable thermophysical properties, including high latent heat and high thermal conductivity, is a useful technique to passively regulate the solar cell temperatures used within PV or CPV systems [2,13,14,15,16,17]. This limits electrical power losses associated with temperature rise. However, easily available and widely used organic PCMs have shortcomings in the form of volume expansion during phase change, resulting in leakage during the melting phase and low thermal conductivity, which causes delays in heat transfer. Inorganic PCM, on the other hand, shows supercooling and so forth [2], factors that impede the development of PCM to its full potential. Low thermal conductivity slows down the thermal response of PCM, but this issue can be addressed with the use of thermal conductivity enhancers, usually composed of high-thermal-conductivity metallic elements, such as aluminium [18] and copper [19] powder additives, metal wool, brush, powdered or expanded graphite [20,21,22], and copper tubes [23].
The WICPV system under investigation in this research is based on the Square Elliptical Hyperboloid (SEH) design of the concentrators that focusses sunlight onto a smaller area of 10 mm × 10 mm square silicon solar cells. This distinctive SEH optical concentrator design aids the high efficiency of the system and delivers hassle-free power from the window [1]. This WICPV can be integrated into glazing building façades and contributes to (i) daylight penetration through windows due to its transparent nature; (ii) low-cost electricity production at the site of use, thus reducing the energy dependency of buildings; and (iii) extremely low solar heat gain [24].
Originally developed by Sellami et al. [25] using a glass top cover and glass back plate, the WICPV design for this research work is renovated using an intermittent aluminium stripped back plate fitted within an acrylic frame and without the top or bottom glass cover. The WICPV is characterised indoors using a solar simulator under a constant irradiance of 1000 Wm−2. A comparative analysis is performed using results from electrical and temperature characterisation achieved for the three cases of (i) a higher melting PCM, (ii) a lower melting PCM, and (iii) circulating (but not recycling) water cooling. Passive cooling is estimated to contribute to the WICPV temperature control, consequently increasing the electrical efficiency.
2. System Description
2.1. Design of the WICPV–PCM System
The WICPV design is centred around the dielectric-material-based SEH solar concentrator design [1]. In this, the profile is designed using the continuous union between an elliptic entry aperture and a square exit aperture, where the solar cells are placed [1]. The WICPV system is designed (Figure 1) to study the effectiveness of passive cooling offered to control the system temperature rise and improve electrical efficiency. This is further tested with PCM and water cooling to compare the quantitative difference between the two media. The cooling media are contained within highly conductive copper tubes fitted at the rear side of the WICPV under the aluminium back plate with recesses. This is done to ensure that the low thermal conductivity of PCM would be compensated by the higher thermal conductivity of both aluminium and copper materials, leading to higher heat transfer.
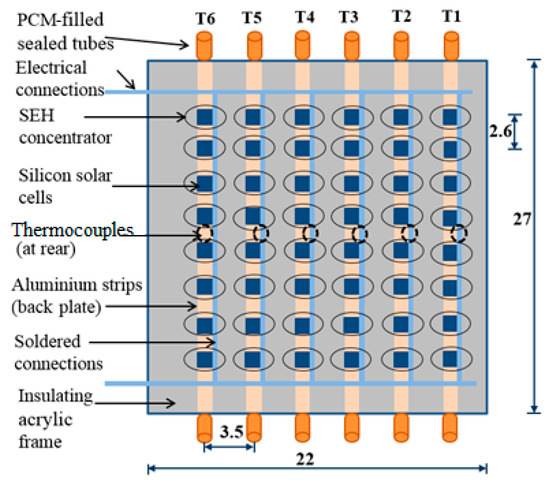
Figure 1.
Schematic of the WICPV system with PCM-filled copper tubes (all dimensions in mm); adapted from [26].
Compared with the original design, only narrow strips of opaque metallic back plates are used to mount the skeleton of the soldered solar cell assembly. This is done to ensure that the semitransparency effect of the concentrators in the systems is not compromised. The remaining structure is made of a clear acrylic-based plastic frame to ascertain the daylight penetration within the building. The cross-sectional view in Figure 2a shows the design of the overall system, and the design of the SEH concentrator with the dimensions is shown in Figure 2b.
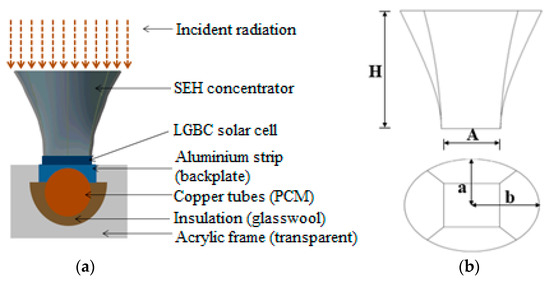
Figure 2.
(a) Cross-sectional view of the designed system and (b) design of the SEH concentrator with specific dimensions of H = 30 mm, A = 10 mm, a = 24 mm, b = 33 mm; adapted from [26].
A total of six (K-type exposed welded tip) thermocouples are placed between the aluminium strips and the copper tubes using a highly conducting thermal paste (thermal conductivity of 3.4 Wm−1·K−1) to measure the temperature under the aluminium back plate. These tubes, primarily used as PCM containment, also act as thermal conductivity enhancers. They are insulated using a 3 mm thick glass wool strips in between in the transparent acrylic frame foundation (Figure 1 and Figure 2a). The transparency provided by the acrylic frame allows the use of this setup as a building window or fenestration.
Heat transfer from the solar cells takes place via conduction in the aluminium back plate and copper tubes, while it initially starts with conduction in the solid PCM. This gradually gives way to convection within the PCM layers during melting. The temperature regulation of this in-house fabricated WICPV with solid–liquid PCM is experimentally evaluated using the paraffin-wax-based organic PCMs Rubitherm® RT28HC [27] and RT50 [28] and with circulating water cooling. It is worth noting that freshly circulated water is used for the experiment without any water recovery or recycling. This way, a quantitative comparative assessment of the four conditions is performed. They are: (i) no applied WICPV cooling, (ii) latent cooling with a higher melting PCM, (iii) latent cooling with a lower melting PCM, and (iv) sensible cooling with water.
2.2. Material and Methods
This section details the materials used for fabricating the parts of the WICPV–PCM system, which includes optical elements (concentrators), PV assembly with soldered solar cells, PCM containment, and the PCM material. The processes involved in manufacturing and assembling the system are also highlighted.
- (i)
- SEH concentrator
The SEH solar concentrator design has an elliptical entry aperture, a hyperbolic profile section, and a square exit aperture, hence the name Square Elliptical Hyperboloid concentrator. Classified as a nonimaging stationary 3-D solar concentrator, it works on the principle of total internal reflection. The concentrator height (H) is 30 mm; side of the square (A), 10 mm; major axis (b), 32 mm; minor axis (a), 24 mm; and geometrical concentration ratio, ×6. The EAR, or elliptical aperture ratio, is 1.34, defined as:
EAR = (major axis)/(minor axis) = b/a = 1.34
The concentrators are manufactured with polyurethane material by means of casting using stainless steel moulds. The approximate time taken from mixing the two constituent parts to demoulding the output design is about 48 h. Details of the manufacturing process are found in [13,25]. Each concentrator assembly measures 102 mm × 101 mm (considering manufacturing and shrinkage allowance) with a 3 × 4 matrix of an individual SEH concentrating element. It is assembled on intermittent aluminium metal strips (1.2 cm wide) on top of the silicon solar cells with the help of an optically clear gluing agent, Sylgard® 184 Silicone Elastomer from Dow Corning. A total of four concentrator assemblies with 12 SEH concentrators are required to cover 48 solar cells used within the designed system.
- (ii)
- Solar cells
Eight silicon solar cells (10 mm × 10 mm) are soldered in series, and six similar strings of these cells are soldered in parallel. The cells are wiped with a very light, even coating of Dow Corning® 92-023 Primer. This strengthens the bonding between the cells and the concentrator and improves the inhibition resistance of the cured silicones.
- (iii)
- PCM containment (copper tubes)
Six copper tubes, 320 mm long with a 7 mm internal diameter and 8 mm outer diameter, are used for PCM containment. They are fitted at the rear side of the aluminium strip (back plate), which have the solar cells and concentrator assembly on the front side. Copper metal is selected for making the tube containment due to its high thermal conductivity (between 301 and 383 Wm−1·K−1) [28]. The tubes are sealed on both sides using detachable soft plastic stoppers, each with a 25 mm length so as to leave at least a 20 mm gap on each side, to account for the volumetric expansion of the PCM in the molten state. This design of PCM containment avoids PCM leakage in liquid state, reported [29] to be a challenge for organic PCM applications.
- (iv)
- PCM
Commercially available PCMs, Rubitherm® RT 50 (melting range: 45–51 °C) and RT28HC (melting range: 27–29 °C), are selected for the experiment to test the effect of the melting range of a PCM on its thermal regulation capability for a CPV system. Technical data for both PCMs are given in Table 1. The PCMs in both the phases; solid and liquid, have a high latent heat of fusion, low supercooling, chemical nonreactiveness, low vapour pressure, self-nucleating properties, nontoxicity, environmentally friendly attributes, and relatively low costs (USD 6.5/kg and USD 10.5/kg, respectively). The constituents are normally C5-C20 paraffin wax, and additional details are not available publicly. The mass of the PCM within each tube weighs approximately 10.5 g.

Table 1.
Technical data for PCM (source: Rubitherm®® data sheet).
2.3. Experimental Setup
To test the WICPV system indoors, a Wacom® solar simulator (is used to provide an irradiance of 1000 Wm−2, horizontal to the flat surface. An Eko®® I-V curve tracer MP-160) is used to measure the instantaneous output short circuit current (Isc), open circuit voltage (Voc), and maximum power (Pm). The overall system electrical efficiency ηelec is calculated from the obtained Pm data and is based on the active cell area. Temperature measurements are recorded every 30 s for a duration of 90 min using a Keithley Model 2700 Multimeter Data Acquisition System. This limited time period is selected to focus only on the heat absorption and melting phase of the PCM melting–solidification cycle. Ambient temperature and relative humidity are recorded using a Hygrometer Testo 608-H1. The experimental setup and the semitransparent nature of the WICPV allowing sunlight are pictorially depicted in Figure 3.
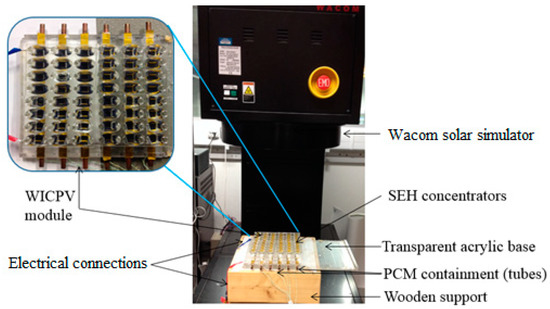
Figure 3.
Experimental setup under the solar simulator and (in inset), the semitransparency effect of the SEH system.
All six K-type thermocouples calibrated using ice and steam are used to record temperatures at the centre of each solar cell strip under the aluminium strip (Figure 1 and Figure 4). All experiments are carried out indoors under ambient temperature conditions between 27 and 29 °C with a relative humidity between 37% and 46%. For the experimental run with water, an arbitrary flow rate of 5 mL·s−1 is selected, a rate at which the flow is visibly streamlined. Below this rate, the pipe flow remains constricted, and higher rates produce more turbulence due to a high Reynolds number. The water circuit for circulating water is illustrated in Figure 4. Five clear soft plastic tubes on either side of the copper tubes are used as conduits for interchannel flow. For these experiments, the difference in heads of water supply and the WICPV system acted as the driving force for the water flow, doing away with the need for an electrical motor or pump and saving active power losses. Hence, it may be argued that although water continuously circulates (without recycling) in this experimental setup, it still passes as a passive cooling mechanism.
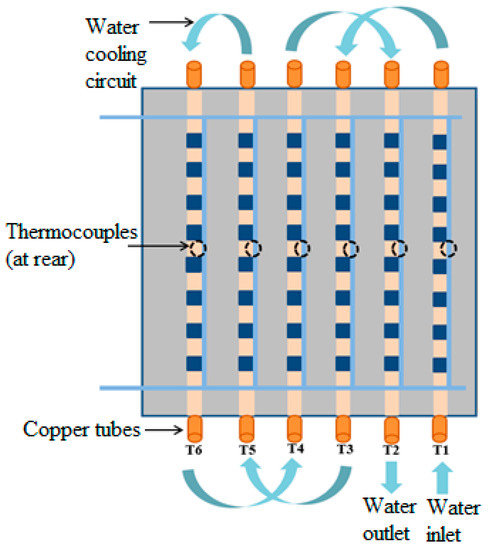
Figure 4.
Water flow circuit for cooling the tubes behind the WICPV system.
3. Results
3.1. Electrical Characterisation
Electrical characterisation of the WICPV for three conditions, without applied cooling media (only natural air convection) and with the use of PCM and of circulated water cooling, are presented here. During this time period of the experimental run (i.e., 90 min), both PCMs are observed to undergo a complete phase change from solid to liquid state. The electrical characterisation is expressed in terms of the output photoelectric short circuit current, voltage, and power as Isc, Voc, and Pm, respectively. These values are then used to calculate the absolute electrical efficiency (ηelec) and, consequently, the relative electrical efficiency improvement in the WICPV. The relative percentage increase in the output electrical parameters (Isc, Voc, Pm, ηelec) of the WICPV with different applied cooling is demonstrated in Table 2.
Table 2.
Comparison of the relative percentage increase (% Δ) in the output electrical parameters of the WICPV system with PCM and water cooling compared with a naturally ventilated system.
As observed, the maximum output power is generated with circulated (but not re-used) water cooling (7.8% increase in Isc, 5.4% in Voc), followed by using RT50 (12.4% increase in Isc, 2.7% in Voc) and RT28HC (12% increase in Isc, 1.8% in Voc), against the naturally ventilated system. The curves obtained from the I-V tracer and the measured data show a 16.9% output electrical power improvement with the use of RT28HC, 18.7% with RT50, and 25.5% with circulating water at 1000 Wm−2, as compared with the naturally ventilated setup. A relative percent increase in electrical efficiency of 15.9% is achieved with PCM RT28HC, 17.6% with RT50, and 24.2% with circulated water. The average Pm for the WICPV with the three implemented cooling options and the natural convection cooled system is given in Figure 5a. The average electrical power output with no applied cooling is 1.70 W with PCM RT28HC, 1.97 W with RT50, and 2.00 W, while with the circulating water cooling, it reaches 2.11 W. The absolute electrical efficiency of the WICPV without additional cooling and with latent and sensible cooling is illustrated in Figure 5b.
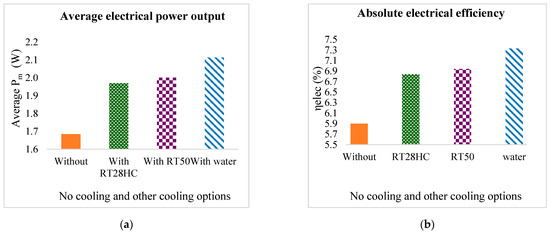
Figure 5.
Comparison of the (a) average Pm and (b) absolute electrical efficiency with natural ventilation and with the use of sensible (water) and latent (PCM) cooling.
3.2. Temperature Characterisation
The effectiveness of each of the cooling media, namely, the two PCM types and water, is expressed in terms of the temperature reduction achieved by them individually. This can be seen as an individual channel temperature reduction and the overall average temperature reduction in the system. A comparison of the obtained channel temperature profile for individual channels (channel 1 to 6), without any cooling, with PCM (RT28HC, RT50), and with water cooling is shown in Figure 6a–f.
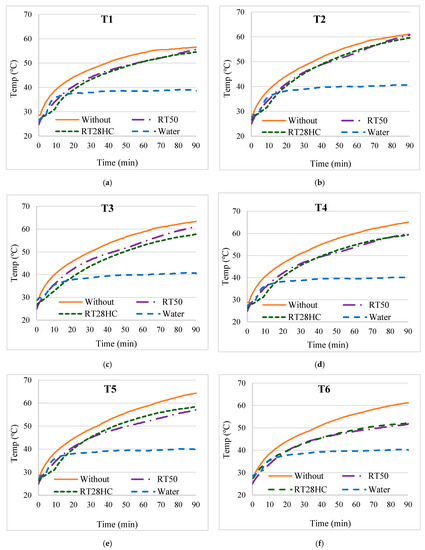
Figure 6.
Comparison of individual channel temperature profiles (a) T1 (channel on the edge of the panel experiencing maximum natural convection), (b) T2, (c) T3 (one of the centrally located channels), (d) T4 (another central channel), (e) T5, and (f) T6 (location of channels can be referred to from Figure 1).
The average channel temperatures with different cooling options are shown in Figure 7. As can be seen for all channels, application of any sensible or latent cooling is beneficial. For some channels, one PCM is more effective than another, the reasons for which are unexplored at this stage. Table 3 highlights these values in terms of the average temperature reduction achieved across channels 1 to 6 using different media for the experimental duration. As expected, circulating water achieves the highest temperature reduction across all channels, followed by RT28HC and RT50, respectively; but the difference is not massive. This analysis gives an indication of the comparative effectiveness of the three cooling media with respect to the case without any cooling applied.
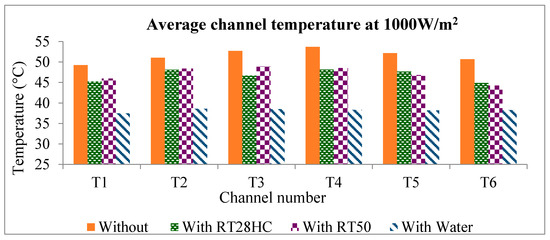
Figure 7.
Comparison of average channel temperature, Ti (where i is the channel number) without and with cooling.
Table 3.
Average temperature reduction in channels with different passive cooling compared with natural ventilation.
As the water is continuously circulated freshly without recycling, despite lower heat capacity, it is still able to achieve higher benefits. The highest temperature attained within the WICPV system without PCM is 53.7 °C, while it is 48.2 °C with RT28HC, 48.9 °C with RT50, and 38.6 °C with water. Similarly, the lowest average temperatures are recorded as 49.2, 44.9, 44.2, and 37.5 °C for the respective cases (more details in Table 4). There is an insignificant (less than a degree) variation between the highest and lowest average temperatures when using both the PCMs. It can also be seen that average temperatures across all channels with water as a cooling medium is almost constant with a variation of ±0.4 °C. Exceptionally, T1 (inlet water channel) experiences the lowest average temperature (37.5 °C) compared with the highest (38.6 °C) within T2 (outlet channel) due to the water circuit configuration. For the two cases of PCM cooling, the temperature at the central channels (T3 and T4) are comparatively higher. This is due to their central location achieving lesser cooling via natural convection otherwise available to the channels on the sides or edges, such as T1.
Table 4.
Maximum, minimum, and average temperatures across the channels during the end of the experiment.
The temperatures at the end of the run, after 90 min, attained by channels T1 to T6 with PCMs RT28HC and RT50 and water are tabulated in Table 5. As deduced from these data, both the low-melting PCM RT28HC and the high-melting PCM RT50 would reach the molten state. Having undergone complete phase transformations, the end temperatures are well above the melting peak for the PCMs, 28 and 49 °C, respectively.
Table 5.
Comparison of absolute temperature in channels during the end of the experimental duration; location of channels given in Figure 1.
Circulated water (sensible cooling) proved to be more effective with 6.4% and 8.0% higher electrical efficiencies than RT28HC and RT50, respectively. This is due to higher maximum average temperature reductions (9.6 and 10.3 °C) and maximum temperature reductions (19.4 and 21 °C), respectively, because of circulation effect. Stagnant water similar to PCM within sealed tubes may not be able to create a similar cooling effect. Water has a specific capacity of 4.187 kJ·kg−1·K−1, whereas both PCMs have reported specific heat values of 2 kJ·kg−1·K−1 in addition to the latent heat capacities of 245 and 168 kJ·kg−1 for RT28 and RT50, respectively. This indicates that PCM circulation could give better results, though it may incur additional pumping and transportation costs and other technical and logistics-related challenges. It is worth highlighting that for these experiments, the head or datum of the water supply tank is utilised as the driving force for water circulation instead of using electrical means, thereby saving electrical expenses. However, in a real-world scenario, the power losses in running an electric motor or pump for water circulation have to be considered. This may entail active power losses and, as a result, higher capital and operational costs.
The use of PCM also increases the temperature distribution uniformity throughout the module. The temperature distribution within the module is quantified, and it is found that the average temperature differences between the channels T3 and T4 (located in the centre of the module) and T1 (on the edge) are higher by 3.5 and 4.5 °C (without PCM), 1.4 and 2.9 °C (with RT28HC), and 3.0 and 2.6 °C (with RT50). In terms of percentage change, the setup with no external cooling shows a 6.6–8.4% higher temperature at the centre compared with the edges, while with PCM RT28HC, it is 3.1–6.1%, and PCM RT50 shows a 5.3–6.1% variation in the temperature within the module.
This implies that the PCM cooling almost halves the temperature variance within the module as compared with the natural ventilation case. This uniform spreading of the heat evenly across the solar panel can reduce local overheating, preventing the formation of hot spots. Permanent destructive effects are produced in the long run on the PV panels due to the occurrence of such hot spots, leading to PV cell degradation, cracking of cells or glass, and melting of solder [29].
The experimental data from this study could provide insight into designing heat sinks or PCM containments with variable dimensions within the same module. For instance, tubes with a smaller diameter containing less material could be put to use for the sides of the panels, while thicker tubes with more PCM could prove to be more effective for the central part of the panel. This would save on material costs required to provide a uniform cooling effect throughout. The study may further help in maintaining uniform temperatures across the CPV panel. The given copper tube configuration, which could have been practically close-fitted within the system under narrow aluminium strips, has limited cooling contribution using lesser material and, hence, for a reduced time period. Designs with bigger tube diameters, especially towards the centre, could produce better results in terms of cooling and electrical efficiency of the WICPV.
4. Discussion and Conclusions
A WICPV system with up to 50% transparency and six times theoretical geometrical concentration ratio is fabricated using Square Elliptical Hyperboloid (SEH) concentrators. These concentrating elements are used on top of silicon solar cells (10 mm × 10 mm) glued on narrow aluminium strips, allowing effective heat transfer. Copper tubes with two paraffin-wax-based PCMs (RT28HC and RT50) and circulating water (at a rate of 5 mL·s−1) are tested. The thermal management effects on the system performance improvement in terms of both the maximum electrical power output and the reduction in operating temperatures are studied. The experiments are conducted indoors under a solar simulator, providing continuous irradiance of 1000 Wm−2. The results obtained from the experimental runs and the conclusive arguments are outlined as:
- The output power and electrical efficiencies of the WICPV increased with the incorporation of both sensible and latent cooling media. The case of natural ventilation of the WICPV is the baseline for all relative comparisons.
- For the three cases, (i) with RT28HC, (ii) with RT50, and (iii) with circulating water, respective increases of 17%, 19%, and 25% in average Pm and increases of 15.9%, 17.6%, and 24.2% in relative percent ηelec are observed.
- The maximum average temperature decrease within the WICPV observed for the three cases are: (i) 6.0 °C, (ii) 6.4 °C, and (iii) 15.4 °C, respectively.
- Circulated water, without reusing it (sensible cooling), proves to be effective with 6.4% and 8.0% higher electrical efficiencies than RT28HC and RT50, respectively, due to higher maximum average temperature reductions by 9.6 and 10.3 °C and maximum temperature reductions by 19.4 and 21 °C, respectively, because of circulation effect.
- The use of PCM increases the uniformity in temperature distribution within the WICPV module, almost halving the variance. For the three different cases, the differentials between the centre and edges are: 3.5–4.5 °C (without PCM), 1.4–2.9 °C (with RT28HC), and 3.0–2.6 °C (with RT50). A lesser value is desirable; therefore, PCM RT28HC performs best at this.
- The setup with no cooling shows a 6.6–8.4% higher temperature at the centre compared with the edges, while with PCM RT28HC, it is 3.1–6.1%, and with PCM RT50, a 5.3–6.1% temperature variation within the module.
- A more uniform spread of heat or less differential temperature across the WICPV panel can reduce local overheating. This could prevent hot spot and other permanent destructive effects, such as PV cell degradation, cracking of cells or glass, and melting of solder.
- Experimental data on variations in channel temperatures could be used to design variable-sized channels as heat sinks. Designs with a larger tube diameter would produce better results in terms of cooling and electrical efficiency of the WICPV.
Author Contributions
The project conceptualisation and methodology were developed by S.S., N.S., and T.K.M., with the experimental work, formal analysis, and investigation carried out solely by the first author, S.S. The original draft was prepared by S.S., while review was undertaken by all the authors, viz., S.S., N.S., A.A.T., and T.K.M., and final editing by R.B. The graphics and visualization were developed by S.S. under the supervision of A.A.T. and T.K.M. All authors have read and agreed to the published version of the manuscript.
Funding
This research was supported by the EPSRC-DST funded project: Reliable and Efficient System for Community Energy Solutions (RESCUES), grant number EP/K03619X/1.
Institutional Review Board Statement
Not applicable.
Informed Consent Statement
Not applicable.
Data Availability Statement
Not applicable.
Acknowledgments
The authors gratefully acknowledge the financial support from EPSRC-DST.
Conflicts of Interest
The authors declare no conflict of interest. The funders had no role in the design of the study; in the collection, analyses, or interpretation of data; in the writing of the manuscript, or in the decision to publish the results.
References
- Sellami, N.; Mallick, T.K. Optical characterisation and optimisation of a static Window Integrated Concentrating Photovoltaic system. Sol. Energy 2013, 91, 273–282. [Google Scholar] [CrossRef]
- Ma, T.; Yang, H.; Zhang, Y.; Lu, L.; Wang, X. Using phase change materials in photovoltaic systems for thermal regulation and electrical efficiency improvement: A review and outlook. Renew. Sustain. Energy Rev. 2015, 43, 1273–1284. [Google Scholar] [CrossRef]
- Skoplaki, E.; Palyvos, J.A. On the temperature dependence of photovoltaic module electrical performance: A review of efficiency/power correlations. Sol. Energy 2009, 83, 614–624. [Google Scholar] [CrossRef]
- Alonso García, M.C.; Balenzategui, J.L. Estimation of photovoltaic module yearly temperature and performance based on Nominal Operation Cell Temperature calculations. Renew. Energy 2004, 29, 1997–2010. [Google Scholar] [CrossRef]
- Al-Sabounchi, A.M. Effect of ambient temperature on the demanded energy of solar cells at different inclinations. Renew. Energy 1998, 14, 149–155. [Google Scholar] [CrossRef]
- Teo, H.G.; Lee, P.S.; Hawlader, M.N.A. An active cooling system for photovoltaic modules. Appl. Energy 2012, 90, 309–315. [Google Scholar] [CrossRef]
- Lu, W.; Tassou, S.a. Experimental study of the thermal characteristics of phase change slurries for active cooling. Appl. Energy 2012, 91, 366–374. [Google Scholar] [CrossRef]
- Du, B.; Hu, E.; Kolhe, M. Performance analysis of water cooled concentrated photovoltaic (CPV) system. Renew. Sustain. Energy Rev. 2012, 16, 6732–6736. [Google Scholar] [CrossRef]
- Ezan, M.A.; Yuksel, C.; Kalkan, C.; Aydin, M.; Nergiz, G. Chapter 2.7–Passive Thermal Management of a Photovoltaic Panel: Influence of Fin Arrangements. In Exergetic, Energetic and Environmental Dimensions; Dincer, I., Colpan, C.O., Kizilkan, O., Eds.; Academic Press: Cambridge, MA, USA, 2018; pp. 341–352. [Google Scholar] [CrossRef]
- Du, D.; Darkwa, J.; Kokogiannakis, G. Thermal management systems for Photovoltaics (PV) installations: A critical review. Sol. Energy 2013, 97, 238–254. [Google Scholar] [CrossRef]
- Hassabou, A.M.; Klemm, T.; Abdallah, A.; Andersen, O. Theoretical and Experimental Investigations on Passive Thermal Management of Solar Photovoltaic Systems using PCM-Metallic Cellular Absorbers. In Qatar Foundation Annual Research Conference Proceedings Volume 2016 Issue 1; Hamad bin Khalifa University Press (HBKU Press): Ar Rayyan, Qatar, 2016; Volume 2016. [Google Scholar] [CrossRef]
- Sharma, S.; Micheli, L.; Chang, W.; Tahir, A.A.; Reddy, K.S.; Mallick, T.K. Nano-enhanced Phase Change Material for thermal management of BICPV. Appl. Energy 2017, 208, 719–733. [Google Scholar] [CrossRef]
- Sharma, S.; Tahir, A.; Reddy, K.S.; Mallick, T.K. Performance enhancement of a Building-Integrated Concentrating Photovoltaic system using phase change material. Sol. Energy Mater. Sol. Cells 2016, 149, 29–39. [Google Scholar] [CrossRef]
- Indartono, Y.S.; Suwono, A.; Pratama, F.Y. Improving photovoltaics performance by using yellow petroleum jelly as phase change material. Int. J. Low-Carbon Technol. 2016, 11, 333–337. [Google Scholar] [CrossRef]
- Islam, M.M.; Pandey, A.K.; Hasanuzzaman, M.; Rahim, N.A. Recent progresses and achievements in photovoltaic-phase change material technology: A review with special treatment on photovoltaic thermal-phase change material systems. Energy Convers. Manag. 2016, 126, 177–204. [Google Scholar] [CrossRef]
- Sargunanathan, S.; Elango, A.; Mohideen, S.T. Performance enhancement of solar photovoltaic cells using effective cooling methods: A review. Renew. Sustain. Energy Rev. 2016, 64, 382–393. [Google Scholar] [CrossRef]
- Rosenthal, A.H.; Gonçalves, B.P.; Beckwith, J.A.; Gulati, R.; Compere, M.D.; Boetcher, S.K.S. Phase-change material to thermally regulate photovoltaic panels to improve solar to electric efficiency. In Proceedings of the ASME 2015 International Mechanical Engineering Congress and Exposition, IMECE 2015, Houston, TX, USA, 13–19 November 2015. [Google Scholar]
- Buonomo, B.; Ercole, D.; Manca, O.; Celik, H.; Mobedi, M. Numerical investigation on the effect of aluminum foam in a latent thermal energy storage. In Proceedings of the ASME 2015 International Mechanical Engineering Congress and Exposition, IMECE 2015, Houston, TX, USA, 13–19 November 2015. [Google Scholar]
- Liu, M.; Lin, M.C.; Wang, C. Enhancements of thermal conductivities with Cu, CuO, and carbon nanotube nanofluids and application of MWNT/water nanofluid on a water chiller system. Nanoscale Res. Lett 2011, 6, 297. [Google Scholar] [CrossRef] [PubMed]
- Karkri, M.; Lachheb, M.; Gossard, D.; Ben Nasrallah, S.; Almaadeed, M.A. Improvement of thermal conductivity of paraffin by adding expanded graphite. J. Compos. Mater. 2016, 50, 2589–2601. [Google Scholar] [CrossRef]
- Shin, H.K.; Rhee, K.Y.; Park, S.J. Effects of exfoliated graphite on the thermal properties of erythritol-based composites used as phase-change materials. Compos. Part B Eng. 2016, 96, 350–353. [Google Scholar] [CrossRef]
- Raza, G.; Shi, Y.; Deng, Y. Expanded graphite as thermal conductivity enhancer for paraffin wax being used in thermal energy storage systems. In Proceedings of the 13th International Bhurban Conference on Applied Sciences and Technology, IBCAST 2016, Islamabad, Pakistan, 12–16 January 2016; pp. 1–12. [Google Scholar]
- Rabienataj Darzi, A.A.; Jourabian, M.; Farhadi, M. Melting and solidification of PCM enhanced by radial conductive fins and nanoparticles in cylindrical annulus. Energy Convers. Manag. 2016, 118, 253–263. [Google Scholar] [CrossRef]
- Sellami, N. Design and Characterisation of a Novel Translucent Solar Concentrator. Ph.D. Thesis, Heriot-Watt University, Edinburgh, UK, 2013. [Google Scholar]
- Sellami, N.; Mallick, T.K. Design of nonimaging static solar concentrator for window integrated photovoltaic. In Proceedings of the 8th International Conference On Concentrating Photovoltaic Systems: CPV-8, Toledo, Spain, 16–18 April 2012; pp. 106–109. [Google Scholar]
- Sharma, S.; Tahir, A.; Mallick, T.K. An Experimental Investigation into Passive Temperature Regulation of a Novel WICPV System with Phase Change Material. In Proceedings of the 32nd European Photovoltaic Solar Energy Conference and Exhibition, Munich, Germany, 20–24 June 2016; pp. 200–204. [Google Scholar]
- Rubitherm Technologies GmbH. Technical Data Sheet RT28HC; Rubitherm Technologies GmbH: Berlin, Germany, 2016; p. 1. Available online: https://www.rubitherm.eu/media/products/datasheets/Techdata_-RT28HC_EN_31052016.PDF (accessed on 1 October 2017).
- Rubitherm Technologies GmbH. Technical Data Sheet RT50; Rubitherm Technologies GmbH: Berlin, Germany, 2016; p. 1. Available online: https://www.rubitherm.eu/media/products/datasheets/Techdata_-RT50_EN_31052016.PDF (accessed on 1 October 2017).
- Solheim, H.J.; Fjær, H.G.; Sørheim, E.A.; Foss, S.E. Measurement and Simulation of Hot Spots in Solar Cells. Energy Procedia 2013, 38, 183–189. [Google Scholar] [CrossRef][Green Version]
Publisher’s Note: MDPI stays neutral with regard to jurisdictional claims in published maps and institutional affiliations. |
© 2021 by the authors. Licensee MDPI, Basel, Switzerland. This article is an open access article distributed under the terms and conditions of the Creative Commons Attribution (CC BY) license (https://creativecommons.org/licenses/by/4.0/).