Abstract
Pedestrians are participants and, most likely, fatalities in every third road traffic accident in Poland. Over 30% of all fatalities on Polish roads are pedestrians. Accidents with pedestrians are very often the result of various factors related to the infrastructure and behaviour of pedestrians and drivers. The objective of the work was to assess driver and pedestrian behaviour in pedestrian crossing areas. The research also served as a pilot study for similar work to be conducted across Poland, and constituted the basis for monitoring the behaviour of road users in the area of pedestrian crossings. Parameters which must be analysed were identified on the basis of field studies. Principles of selecting test sites were adopted, and measurement methods for pedestrian crossing areas are presented. The influence of the location of the selected test cross-section infrastructure parameters on the behaviour of road users in pedestrian crossing areas is demonstrated. The results of the study will be used as a basis for new solutions involving pedestrian crossing infrastructure designed to improve pedestrian safety. The results were also used in formulating new regulations for the design and maintenance of pedestrian crossings and recommendations for road safety auditors.
1. Introduction
Pedestrians are among the groups of traffic participants who are very often deprecated by motorised participants, albeit a very important one in road traffic. Practically, every person able to move about within the road network is a pedestrian, with the length and aim of the trip taken on foot being the key. The distance to be covered by a traffic participant is the primary criterion which influences the choice of the type of trip [1]. Studies on transport behaviour carried out in Poland [2] make it possible to conclude that pedestrian trips constitute about 20% of the total trips in cities. In comparison, this share is ca. 35% in Barcelona and 31% in London [3].
Accidents involving pedestrians are very often the result of various factors related to the infrastructure and behaviour of pedestrians and drivers [4], and to the road infrastructure [5,6,7]. The factors which involve the behaviour of road infrastructure users include vehicle speeds and the degree to which they are exceeded, pedestrian speed, crossing the road illegally and how drivers behave towards pedestrians (giving way at pedestrian crossings) [8,9,10]. These factors will vary depending on traffic and pedestrian volumes and the pedestrian crossing location (built-up area, non-built-up area, road class and cross-section, intersections and midblock) [11,12,13,14]. Road infrastructure-related factors that have an effect on pedestrian safety include the cross-section [15] but also the width and length of pedestrian crossing, how far it is from an intersection, road section geometry (vertical and horizontal alignment), type and condition of road surface, presence of refuge islands and their geometric parameters, type of vertical and horizontal marking and its condition, signalised and not signalised crossing [16,17,18,19], distance to designated and illegal parking, presence of public transport stops, adequacy of drainage, facilities for the blind and visually impaired, pedestrian ramps, condition of pavements and lighting [20,21,22,23] and distances between pedestrian crossings [24]. Research on pedestrian crossings focuses on the interaction of drivers and pedestrians [5,25,26] using conflict analysis [27,28].
Pedestrian safety is among the most important challenges in implementing measures to improve road safety [29,30]. More than 1/5 of all fatalities in road accidents worldwide are pedestrians [31]. In several countries, these values are even higher and exceed 1/3 [32,33].
In 2008, in an effort to raise road safety levels across the EU to those of the best performing countries, the European Commission wrote and implemented Directive 2008/96/EC on road infrastructure safety management [34]. The European Commission’s intention was to implement adequate tools to improve the safety of road infrastructure across the trans-European road network. Several years into the process, it was clear that the road safety actions were ineffective [35]. In 2019, Directive 2019/1936 of the European Parliament and of the Council was developed amending Directive 2008/96/EC on road infrastructure safety management [36], which extends its remit to roads co-financed from EU funds. In countries such as Poland, where pedestrians represent about 30% of all road deaths, implementing control measures to protect vulnerable road users should be of particular importance. These include road safety inspections (RSI) [37] and road safety audits (RSA). Through these measures, it is possible to significantly reduce the number of people killed or seriously injured in road accidents, including pedestrians [38]. Such work should be supported by scientific research on road user behaviour, which is a main subject in this paper. Pedestrian safety in Poland is at a very low level compared to the best European countries in this regard [39]. Every third fatality in a traffic accident in Poland is a pedestrian. In the years 2009–2018, approximately 94.5 thousand pedestrian accidents were registered in Poland, in which approximately 89.0 thousand pedestrians were injured, and 11.0 thousand pedestrians were killed (Figure 1). It should be emphasized that at that time, the number of pedestrian accidents and their victims decreased by over 40%. However, this is still too high a number. About 10% of all deaths in accidents in Poland were registered at pedestrian crossings (based on SEWIK, a police database).
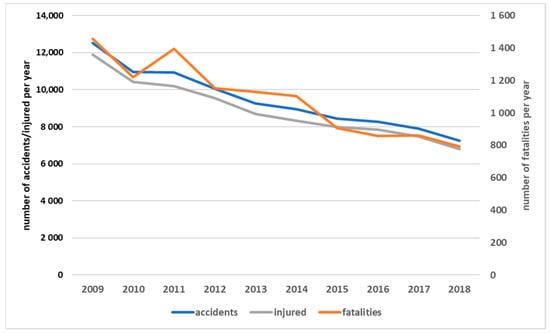
Figure 1.
Pedestrian accident and victims in Poland in the years 2009–2018 (based on police’s SEWIK data).
Ensuring pedestrian safety in the area of pedestrian crossings should be a priority for actions taken by road authorities. For this purpose, it is necessary to conduct systematic studies of pedestrian and driver behaviour. The lack of clear rules on when to give way to pedestrians gives rise to drivers’ dangerous behaviour towards pedestrians, for example, driving the wrong way through pedestrian crossings and, on the other hand, dangerous behaviour of pedestrians themselves in traffic—careless running onto the roadway, crossing the road where it is illegal, etc. [40,41,42]. This problem also includes the lack of appropriate infrastructure for pedestrians moving across the roadway (refuge islands or appropriate marking) and along the roadway (sidewalks)—mainly on the outskirts of cities, segments of roads through built-up areas and segments of roads in non-built-up areas where pedestrian traffic may occur with significant intensity. Additionally, several existing pedestrian facilities do not meet traffic or safety standards (for example, their technical condition, location of pedestrian crossings in terms of visibility, public transport stops and gaps in footpaths). Dependencies between pedestrians and vehicles require relevant studies to ensure the safe movement of pedestrians.
Polish experience. Research in Poland analyses pedestrian behaviour by analysing digital footage from cameras, an approach also used in the MOBIS project. The objective of the project was to develop and test a method for assessing pedestrian crossing safety using an automatic analysis of video footage. The assessment was designed to identify conflicting movements of vehicles and pedestrians. The project helped us to test and optimise the method at different types of pedestrian crossings in urban areas: on single carriageways with and without a refuge island, dual carriageways and at traffic lights [43]. Studies of Poland’s pedestrian crossings also analyse night-time luminance depending on road lighting [44,45]. A safety assessment of non-signalised pedestrian crossings showed that many drivers exceed the applicable speed limits [46]. Other studies indicate that there is a high risk to pedestrians on sections of transit roads in small towns [47] and cities [48].
International experience. A study was conducted in Australia designed primarily to test road user knowledge of regulations determining right-of-way in different situations [49]. Another research method implemented in Australia analysed child behaviour on major and local roads. The study paid special attention to where children stop, where they look around, how they analyse vehicle movement and how they cross the road [50]. In France, study was focused on analysing the behaviour and interrelations between pedestrians and drivers. The analysis of the results showed that when a pedestrian looks at an oncoming vehicle, the car is more than 10% more likely to stop [51].
Surveys conducted in the United Kingdom identified three main hazards to pedestrian safety: dual carriageway crossing, red light entry for drivers and reduced visibility by parked vehicles [52]. In Spain, cameras were deployed for automatic pedestrian detection at pedestrian crossings. In addition, a manual check was conducted of the gender, age, size of group or pedestrian baggage [53]. In Germany, road traffic behaviour was studied at signalised intersections [54]. Research in the Netherlands proved that pedestrians mostly struggle with excessive vehicle speeds, especially as regards people aged >65 [55]. A study in Sweden recorded road user behaviour using cameras [56,57]. The results of research in Belgium show that approximately 21% of the pedestrians violate traffic lights [58]. Research conducted in Finland concerned the speed of drivers and pedestrians, road traffic and the behaviour of road users in the area of pedestrian crossings [59]. Studies conducted in urban areas in Israel analysed the effects of pedestrian distraction at pedestrian crossings on pedestrian safety [60]. In Malaysia, driver behaviour was assessed at pedestrian crossings (accelerating and slowing) and pedestrian time lost [61]. A study in Estonia assessed the share of drivers running red lights, vehicle speed and estimated pedestrian and vehicle time lost [62]. Work conducted in China [63,64,65] studied pedestrian and driver behaviour at signalised pedestrian crossings. The country also conducted other research to measure vehicle speed and the distance between a stopped vehicle and a pedestrian [66]. Research [67,68] has shown that the greater the number of lanes in one direction, the greater the number of conflicts between drivers and pedestrians. Research in India [69,70] has indicated the problems that pedestrians have with the assessment of the possibility of crossing the road at crossings outside intersections. Research conducted in Slovakia concerned the use of mobile devices and headphones on pedestrian crossings [71].
The field research was also supported by simulation studies, during which the impact of different scenarios on the behaviour of drivers and pedestrians in the area of pedestrian crossings outside intersections was analysed [72,73,74].
Review of Polish and international research shows that field work must be conducted to observe pedestrian and driver behaviour at pedestrian crossings (as demonstrated further in the article). Real pedestrian crossing situations should be studied analysing crossing location, equipment, pedestrian traffic volume and pedestrian characteristics. In the case of drivers, observation is required to understand driver reaction on approaches to pedestrian crossings in relation to pedestrian behaviour. As a result, it will be possible to assess the effectiveness of existing solutions and improve pedestrian safety where it is most at risk, i.e., at pedestrian crossings [75]. In the majority of countries which study pedestrian behaviour and pedestrian–driver relations, this is not carried out systematically. Instead, the work analyses selected aspects only. It is critical for Poland to carry out such work due to the high levels of risk to pedestrians.
Taking into account the literature review, parameters were verified and selected, which helped to build a database that is the basis for analysing the behaviour of pedestrians and drivers and the pedestrian–driver relationship in pedestrian crossing areas:
- Pedestrian traffic parameters under research—field tests: pedestrian age, traffic volume, distance between the pedestrian and the edge of the roadway, how the pedestrian approaches the crossing, average speed of the pedestrian on the crossing, pedestrian delay before the crossing, pedestrian behaviour before entering the roadway (making sure that it is safe to enter), sudden entry onto the roadway (entry at red light) and pedestrians crossing in illegal locations in the vicinity of a designated crossing (±100 m).
- Vehicle parameters under research: speed of a vehicle approaching the crossing, speeding, entry at red light and traffic volume.
2. Materials and Methods
The main aim of this research was to assess the behaviour of pedestrians and drivers and the pedestrian–driver relationship at and in the area of pedestrian crossings. Such systematic studies are necessary due to the level of risk of pedestrian accidents. The objective was to make walking more attractive and improve pedestrian safety. To this end, field tests and survey studies were carried out in 70 test points in Poland’s Pomorskie and Małopolskie regions, across an area that is diversified in terms of its development. The road cross-section and location of pedestrian crossings were also taken into consideration. The results of these studies make it possible to assess pedestrian safety at various types of crossings, associated with the street’s cross-section.
2.1. Measurement Technique
The following instruments were used to record traffic parameters alongside pedestrian and driver behaviour:
- MioVision—a mobile camera which records and collects traffic data using a database platform. The camera was situated on a mast with a variable height, up to 7 m.
- MetroCount—a device which counts the traffic volume, including the structure and speed of vehicles, making it possible to collect data in the long term.
Depending on the test site, one or two video cameras were used to record images. The cameras were situated on a tripod at a distance of 10 m to 15 m behind a pedestrian crossing and located on the shoulder, lamppost or pavement along the road. The measuring equipment was located in a way which would not capture the attention of drivers or pedestrians. Driver behaviour was studied as cars approached the pedestrian crossing. The maximum range of image recording depended on road geometry and was between 40 m and 100 m. During the measurement, test cross-sections were designated in the field, every 10 m or 20 m, as a test basis for the assessment of average speed (Figure 2). The speed was calculated on the basis of the length of the measured segment and time travelled to the test cross-sections. Image analysis covered recording the time of consecutive events, i.e., the appearance of vehicles in the subsequent test cross-sections. Speed measurement included only the vehicles moving in free traffic, i.e., those which were not influenced by other vehicles in their vicinity. The following scenarios were selected in the analysis of vehicle speed on a pedestrian crossing:
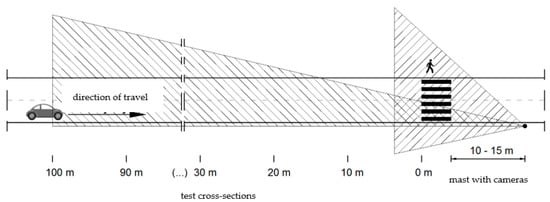
Figure 2.
Diagram of field tests using video recording instruments.
- No pedestrian;
- With a pedestrian waiting before the crossing;
- With a pedestrian on the crossing.
For pedestrian traffic parameters, the camera’s field of observation covered the entire pedestrian crossing under analysis and its access path. The analysis included the following:
- Average speed of the pedestrian crossing the street (counted between the edges of the carriageway);
- Pedestrian delay (waiting time for the road crossing);
- Distance to the vehicle when the pedestrian decides to enter the crossing and cross it.
Each test included pedestrians going across the crossing in both directions, with a division into age groups also included (<20 years—11.1%; 20–60 years—80.4%; >60 years—8.5%). In the case of drivers, age was not taken into account.
2.2. Selection of Test Sites
When selecting the test points, limitations were taken into account, making it possible to obtain a random sample of test points with a high uniformity of traffic conditions. This allowed a wide range of comparisons between test results. At each pedestrian crossing, the measurements were carried out for 6 h (10:00 a.m.–3:00 p.m.), in good weather conditions and in daylight. The research was conducted only on working days (Monday–Friday), in the months of April–June. In order to obtain such a set, test points were located as follows:
- Outside of horizontal and vertical curves with reduced visibility, which make it necessary to reduce speed compared to previous sections;
- In segments with a gradient of less than 4%;
- Outside of built-up areas in segments with comparable features in terms of both their function and the volume of pedestrian and vehicle traffic;
- In built-up areas in sections with comparable features in terms of the buildings and functions and the volume of pedestrian and vehicle traffic;
- In segments without local speed limits;
- In segments without speed cameras.
In order to compare vehicle speeds and pedestrian behaviour, selection criteria were designated for the test points. The following criteria were chosen:
- Type of area;
- Type of cross-section;
- Presence of traffic lights;
- Type of segment;
- Speed limit.
Field tests with pedestrians were carried out in three types of areas:
- Large and medium-sized cities (powiat/county level);
- Small towns;
- Rural areas.
In each of these areas, tests were performed in the following locations:
- In between intersections (midblock);
- At intersections that are not signalised;
- At signalised intersections.
For the locations selected above, detailed locations were specified, taking into account various cross-sections of the road segment:
- 1 × 2 (single carriageway, 1 lane in each direction);
- 1 × 4 (single carriageway, 2 lanes in each direction);
- 2 × 2 (dual carriageway, 2 lanes in each direction);
- 2 × 3 (dual carriageway, 3 lanes in each direction).
The current speed limit was identified for each of these test point’s selection criteria and, for further analysis, 50 km/h (for built-up areas) and 70 km/h (for built-up areas with dual carriageways and for rural areas) were selected. Figure 3 presents a cumulative diagram of the test site.
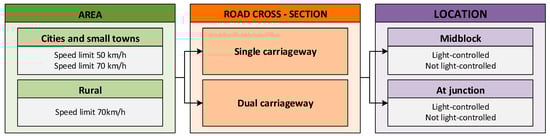
Figure 3.
Diagram of test point selection.
2.3. Statistical Methods
Statistical methods were reduced to calculation descriptive statistics according to pedestrian and vehicle speed. Average speed, standard deviation and the max and min speed were calculated. Average speed and differences in speed for various locations of pedestrian crossings and the presence of pedestrians could be factors to assess the interaction between drivers and pedestrians. Therefore, in Section 3, results of the average speed comparison are presented. Additionally, to assess the statistical significance of speeds, a two-sample t-test for the difference of means was carried out. To assess speed distribution, the Shapiro–Wilk test was used to assess normal distribution.
3. Results
In order to compare vehicle speeds and pedestrian behaviour, cumulative analyses were produced for the test points. The following categories were chosen:
- Type of area;
- Type of cross-section;
- Presence of traffic lights;
- Type of segment.
In each of these categories, a speed limit was identified, currently in place at each given location. A division into 50 km/h and 70 km/h speed limits was adopted for cumulative comparisons. Based on the analysis of the collected data, conclusions were formulated on the behaviour of drivers in pedestrian crossing areas as per the criteria for locating test points. Descriptive statistics for each measurement sites as well as test cross-sections were calculated.
3.1. Test Points with 50 km/h Speed Limit
3.1.1. Type of Area
- Urban areas feature lower vehicle speeds on approach to the crossing than small towns, with no pedestrian by 5 km/h at a distance of 10 m from the crossing and 10 km/h at a distance of 50 m from the crossing.
- In both types of areas, similar vehicle speeds were recorded at a distance of 10 m from the crossing with a pedestrian waiting to cross.
- Urban areas feature higher vehicle speeds on approach to the crossing than small towns, with a pedestrian crossing the road by 5 km/h at a distance of 10 m from the crossing and 5 km/h at a distance of 50 m from the crossing.
- In both areas, a minor decrease in vehicle speed was recorded at a distance of 10 m from the crossing with a pedestrian waiting to cross compared to a situation with no pedestrian, and a considerable decrease in the case of pedestrians crossing the roadway (Figure 4).
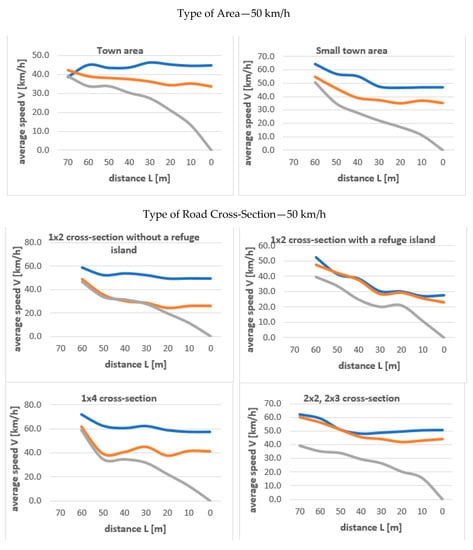
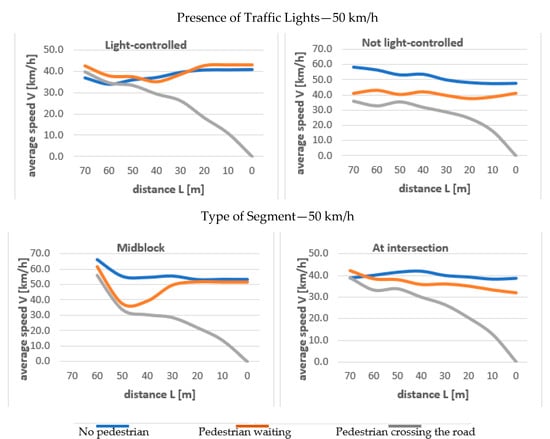 Figure 4. Vehicle speeds in pedestrian crossing areas—speed limit: 50 km/h.
3.1.2. Type of Road Cross-Section
- The lowest speed on approach to the crossing with no pedestrian, at a distance of 10 m from the crossing, was recorded for the 1 × 2 cross-section with a refuge island (30 km/h less than for the 1 × 4 cross-section; 23.5 km/h less than for dual carriageways).
- The lowest speed on approach to the crossing with a pedestrian waiting to cross was recorded for the 1 × 2 cross-section without a refuge island (16 km/h less than for the 1 × 4 and 1 × 2 cross-sections with a refuge island; 22 km/h less than for dual carriageways).
- The lowest speed on approach with a pedestrian crossing the roadway was recorded for the 1 × 2 cross-section with a refuge island, but the differences between the cross-sections were minor in this case (Figure 4).
For all types of cross-sections, vehicle speed with pedestrians waiting to cross was lower compared to situations when there was no pedestrian (by 16 km/h for 1 × 2, by 16 km/h for 1 × 4 and by 2 km/h for 2 × 2 and 2 × 3—Figure 4).
3.1.3. Presence of Traffic Lights
- With traffic lights, vehicle speeds on approach to the crossing were higher: by 7 km/h with no pedestrian, by 4 km/h when a pedestrian is waiting to cross and by 5.5 km/h when a pedestrian is crossing the roadway (at a distance of 10 m from the pedestrian crossing).
- With traffic lights, the speed with a pedestrian waiting to cross was higher by 1 km/h than when there was no pedestrian.
- Without traffic lights, vehicle speed on approach to the crossing with a pedestrian waiting to cross was 2 km/h lower than when there was no pedestrian.
It is noteworthy that the presence of traffic lights changes the speed on approach to the crossing to a minor degree, but light-controlled pedestrian crossings significantly increase pedestrian safety.
3.1.4. Type of Segment
- When there was an intersection, vehicle speeds at a distance of 10 m from the crossing were lower than in between intersections, by 0.5 km/h with no pedestrian, by 14 km/h with a pedestrian waiting and by 1 km/h with a pedestrian crossing the roadway, respectively.
- When a crossing was located in between intersections, the speed with a pedestrian waiting was 2 km/h lower than when there was no pedestrian, and when a crossing was at an intersection, the difference was 1 km/h (lower with a pedestrian waiting) (Figure 4).
A two-sample t-test for the difference of means to assess the statistical significance of differences in the average values of the observed speeds (Figure 5) was carried out. The impact of pedestrian presence, as well as the type of area, cross-section, segment and presence of traffic lights, was considered. Statistically insignificant results (p value > 0.05), which suggest no impact on driver behaviour, were obtained for the following:
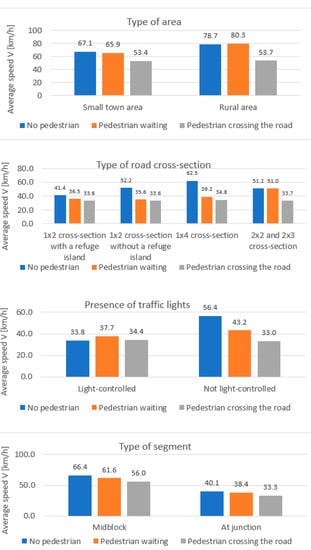
Figure 5.
Comparison of speeds at pedestrian crossings in selected locations—speed limit of 50 km/h (measured at 50 m from the crossing).
- Light-controlled pedestrian crossings (all cases of pedestrian presence);
- No pedestrian vs. pedestrian waiting (dual carriageway roads and at an intersection);
- Pedestrian waiting vs. pedestrian crossing (the roads at small town area and two-lane roads);
- Pedestrian waiting—type of area and two-lane roads;
- Pedestrian crossing the road—type of area, cross-section and presence of traffic lights.
3.2. Test Points with 70 km/h Speed Limit
3.2.1. Type of Area
- A small town area had a lower vehicle speed on approach to the crossing than a rural area, with no pedestrian by 35 km/h at a distance of 10 m from the crossing and 18 km/h at a distance of 50 m from the crossing.
- A small town area had lower vehicle speeds on approach to the crossing than a rural area, with a pedestrian waiting by 25 km/h at a distance of 10 m from the crossing and 20 km/h at a distance of 50 m from the crossing.
- In a small town area, a higher speed was recorded with pedestrians waiting than when there was no pedestrian by 5 km/h; in a rural area with a pedestrian waiting, a lower speed was recorded with pedestrians waiting compared to a situation with no pedestrian by 1 km/h (this pertains to a distance of 10 m from the crossing) (Figure 6).
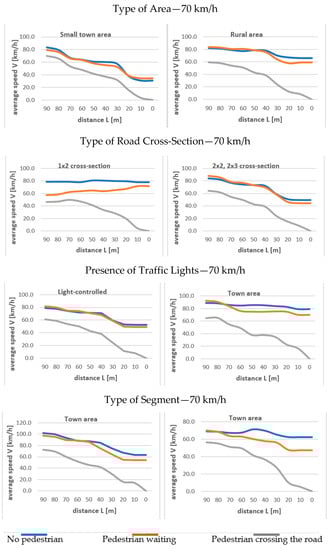 Figure 6. Vehicle speeds in pedestrian crossing areas—speed limit: 70 km/h.
3.2.2. Type of Road Cross-Section
- The lowest speed on approach to the crossing with no pedestrian, at a distance of 10 m from the crossing, was recorded for cross-sections 2 × 2 and 2 × 3 (29 km/h less than for cross-section 1 × 2).
- The lowest speed on approach to the crossing with a pedestrian waiting to cross was recorded for cross-sections 2 × 2 and 2 × 3 (27 km/h less than for cross-section 1 × 2).
- The lowest speed on approach to the crossing with a pedestrian crossing the roadway was recorded for cross-section 1 × 2, 4 km/h less than for cross-sections 2 × 2 and 2 × 3.
- For both types of cross-sections, a lower speed was recorded with a pedestrian waiting to cross compared to situations with no pedestrian (5–6 km/h) (Figure 6).
3.2.3. Presence of Traffic Lights
- With traffic lights, vehicle speeds on approach to the crossing were considerably lower, by 26 km/h with no pedestrian, by 20 km/h with a pedestrian waiting to cross and by 9 km/h with a pedestrian crossing the roadway (at a distance of 10 m from the pedestrian crossing).
- With traffic lights, the speed with a pedestrian waiting was 3 km/h lower than with no pedestrian.
- With no traffic lights, vehicle speed on approach to the crossing with a pedestrian waiting was 9 km/h lower than with no pedestrian (Figure 6).
It is noteworthy that the presence of traffic lights significantly changes the speed on approach to the crossing, and at the same time, light-controlled pedestrian crossings significantly improve pedestrian safety.
3.2.4. Type of Segment
- When there was an intersection, vehicle speeds at a distance of 10 m from the crossing were lower than in between intersections (with no pedestrian by 1 km/h and with a pedestrian waiting by 7 km/h), with a pedestrian crossing the roadway, lower speeds were recorded when there was an intersection—by 9 km/h.
- When a crossing was located in between intersections, the speed with a pedestrian waiting was 0.5 km/h lower than with no pedestrian and, in the case of a crossing at an intersection, this difference was 7 km/h (lower with a pedestrian waiting) (Figure 6).
A two-sample t-test for the difference of means to assess the statistical significance of differences in average values of the observed speeds (Figure 7) was carried out. The impact of pedestrian presence, as well as the type of area, cross-section, segment, and presence of traffic lights, were considered. Statistically insignificant results (p value > 0.05) were obtained for the following:
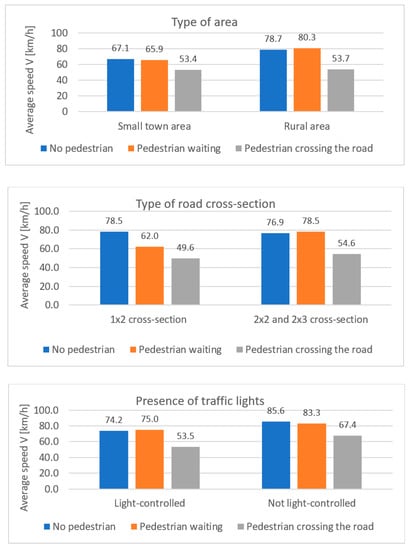
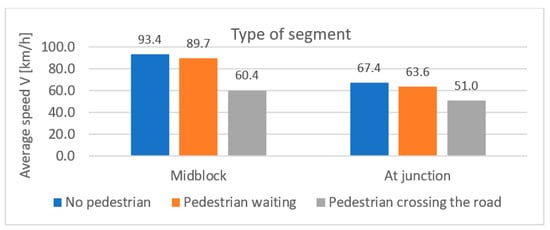
Figure 7.
Comparison of speeds at pedestrian crossings in selected locations—speed limit of 70 km/h (measured at 70 m from the crossing).
- No pedestrian vs. pedestrian waiting (type of area, dual carriageway roads, presence of traffic signals and type of segments)—drivers on roads with high speeds (70 km/h speed limit) were less willing to give priority to pedestrians.
- No pedestrian—type of cross-section had no impact on speed.
- Pedestrian crossing the road—behaviour of drivers was the same for both locations (type of area).
3.3. Pedestrian Behaviour Studies
During the field tests, selected parameters and pedestrian behaviours were analysed—pedestrian speed on the crossing; time lost on crossings; the distance of the waiting pedestrian from the roadway; how the pedestrian approaches the crossing; making sure that it is safe before entering the roadway; dangerous behaviour—crossing at a red light and crossing the roadway outside of a pedestrian crossing. Based on the research, the following results were obtained (Table 1):

Table 1.
Features of pedestrian traffic.
- Average speeds on crossings with a refuge island are lower than in cross-sections without a refuge island.
- There are no large differences in crossing speeds for various types of cross-section or area; the values are from 1.0 m/s to 1.6 m/s.
- There are big differences in time lost depending on the area—in a city area, a pedestrian requires on average 17 s to cross the roadway; in small town areas, it is 25 s; and in rural areas, 48 s.
- Out of the recorded dangerous pedestrian behaviours, the vast majority concern not making sure that it is safe to enter the roadway—84% (ca. 10% of all recorded pedestrians); crossing at a red light—8% (ca. 1% of all recorded pedestrians); and crossing in an unpermitted location—8% (ca. 1% of all recorded pedestrians).
- Depending on the type of area, the way a pedestrian approaches the crossing is mainly “normal” (without running up to the crossing, speeding up or slowing down)—97% in a city area, 89% in a small town area and 94% in a rural area.
3.4. Additional Research
Additional field tests were carried out in a highly urbanized city area, in three Polish cities: Gdynia, Gdansk and Warsaw. The tests were carried out in a reference period of very good weather conditions, including pedestrian crossings which are not light controlled. The study covered nine pedestrian crossings with diversified street cross-sections. Based on the analysis, it can be stated that there is a significant decrease in speed when a pedestrian is crossing the road, while no decrease in speed was recorded with a pedestrian waiting to cross. In certain cases, the value was higher than average (Table 2):
Table 2.
Average vehicle speed V [km/h] depending on the distance from the pedestrian crossing L [m].
- The average speed at a distance of 70 m from the crossing was 39.6 km/h for all vehicles, 38.8 km/h with no pedestrians in the crossing area, 42.1 km/h with a pedestrian waiting to cross and 39.7 km/h with a pedestrian crossing the roadway.
- The average speed at a distance of 30 m from the crossing was 41.7 km/h for all vehicles, 45.9 km/h with no pedestrians in the crossing area, 41.2 km/h with a pedestrian waiting to cross and 27.7 km/h with a pedestrian crossing the roadway.
- The average speed at a distance of 0 m from the crossing was 36.5 km/h for all vehicles, 45.6 km/h with no pedestrians in the crossing area, 40.0 km/h with a pedestrian waiting to cross and 0 km/h with a pedestrian crossing the roadway.
The lowest average speed of vehicles approaching a pedestrian crossing with pedestrians crossing the roadway was recorded at roundabout-type intersections, and the highest when the crossing was located between intersections. This confirms that the location of a pedestrian crossing influences vehicle speed.
At the same time, observations were carried out on pedestrian crossings in selected test points, focused on assessing the behaviour of drivers with regard to pedestrians, on approach to the crossing. The results are presented in Figure 8. The tests were carried out for the 1 × 2 cross-section, a speed limit of 50 km/h, non-signalised crossing and no traffic calming features (islands separating traffic directions). The observations were carried out for vehicles moving in the lane adjacent to the sidewalk where the pedestrian was situated. The observations were assigned to four situations:
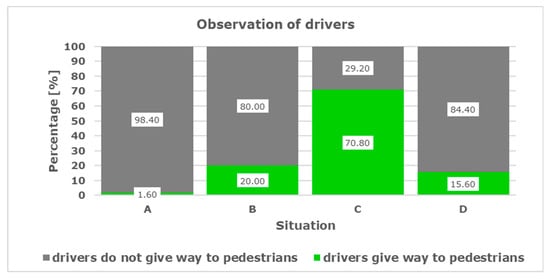
Figure 8.
Results of observations of driver behaviour with regard to pedestrians in the crossing area.
- A—the pedestrian is approaching the crossing (at a distance of ca. 34 m).
- B—the pedestrian is waiting to cross at the roadway edge.
- C—the pedestrian is entering the roadway (taking the first step onto the roadway).
- D—the pedestrian is in the lane opposite to that in which the vehicles being observed are moving.
The results indicate that only 1.6% of drivers stopped in order to give way to pedestrians approaching a crossing. The value of 20% of drivers giving way to pedestrians who were waiting to cross was not very large either, but it must be considered that, according to the regulations in place in Poland, the driver is not under an obligation to give way to pedestrians who are waiting to cross the roadway. Giving way to pedestrians in such situations is promoted as a positive way to behave in traffic. The result recorded in situation C is reason for serious concern: as many as 30% of drivers drive through a crossing, despite the fact that a pedestrian is already on the roadway. Such a behaviour of drivers leads to the negative statistics indicated in the first part of the article.
4. Conclusions
It follows from the review of Polish and international research performed to date that it is necessary to carry out studies on the behaviour of pedestrians and drivers in pedestrian crossing areas in order to plan, design and implement solutions to improve pedestrian safety.
In Poland, about 30% of all road fatalities are pedestrians. Records show that about 35% of all pedestrian fatalities occurred at a pedestrian crossing.
This study of driver and pedestrian behaviour in pedestrian crossing areas showed that vehicle speeds vary depending on the location—type of area, type of cross-section, section characteristics and pedestrian crossing control—and on the presence or absence of traffic lights. The study showed that speed limits are frequently exceeded near pedestrian crossings. This is why measures are necessary to improve pedestrian safety. They include pedestrian refuge islands and signalised crossings, especially for cross-sections such as 1 × 4, 2 × 2 or 2 × 3. Visibility at pedestrian crossings must be improved (vehicles parked, bus stops and road section geometry). Additional analyses of driver behaviour towards pedestrians waiting to cross, the level of conflicts and number of victims showed that the regulations must be revised. It is important to give priority to pedestrians waiting to cross the road, which has been implemented in many countries. This must be accompanied by educational campaigns, increased enforcement as regards driver behaviour in the initial period and ensuring that pedestrian crossing areas meet safety standards. The standards would include no designated pedestrian crossings if there are no traffic lights, a speed limit of more than 50 km/h and pedestrians having to cross the road at a second level (tunnel or footbridge), or with traffic lights, if there is more than one lane of traffic in the same direction.
More research on pedestrian safety is required and should be specifically aimed at identifying pedestrian crossing hazards, assessing the effectiveness of treatments and assessing pedestrian and driver behaviour on a regular basis by covering more parameters (e.g., different weather conditions or time of day).
Author Contributions
Conceptualization, M.B.; methodology, M.B., M.K. and P.T.; formal analysis, A.G., L.G. and L.J.; resources, A.G. and L.J.; data curation, A.G., L.J. and L.G.; writing—original draft preparation, M.B., L.J., A.G. and L.G.; writing—review and editing, M.B., M.K. and P.T.; project administration, M.B. All authors have read and agreed to the published version of the manuscript.
Funding
This research received no external funding.
Institutional Review Board Statement
Not applicable.
Informed Consent Statement
Not applicable.
Data Availability Statement
Not applicable.
Conflicts of Interest
The authors declare no conflict of interest.
References
- Okraszewska, R.; Jamroz, K.; Michalski, L.; Zukowska, J.; Grzelec, K.; Birr, K. Analysing Ways to Achieve a New Urban Agenda-Based Sustainable Metropolitan Transport. Sustainability 2019, 11, 813. [Google Scholar] [CrossRef]
- VIA VISTULA. Gdańsk Traffic Research; VIA VISTULA: Kraków, Poland, 2016. [Google Scholar]
- Transport for London. Making London a walkable city. In Mayor of London; Transport for London: London, UK, 2004. [Google Scholar]
- Martin, A. Factors Influencing Pedestrian Safety: A Literature Review; TRL Limited: Berk, UK, 2006. [Google Scholar]
- Zhao, J.; Malenje, J.O.; Wu, J.; Ma, R. Modeling the interaction between vehicle yielding and pedestrian crossing behavior at unsignalized midblock crosswalks. Transp. Res. Part F Traffic Psychol. Behav. 2020, 73, 222–235. [Google Scholar] [CrossRef]
- Fricker, J.D.; Zhang, Y. Modeling Pedestrian and Motorist Interaction at Semi-Controlled Crosswalks: The Effects of a Change from One-Way to Two-Way Street Operation. Transp. Res. Rec. J. Transp. Res. Board 2019, 2673, 433–446. [Google Scholar] [CrossRef]
- Sheykhfard, A.; Haghighi, F. Assessment pedestrian crossing safety using vehicle-pedestrian interaction data through two different approaches: Fixed videography (FV) vs. In-Motion Videography (IMV). Accid. Anal. Prev. 2020, 144, 105661. [Google Scholar] [CrossRef]
- Kadali, B.R.; Vedagiri, P. Evaluation of pedestrian crossing speed change patterns at unprotected mid-block crosswalks in India. J. Traffic Transp. Eng. (Engl. Ed.) 2020, 7, 832–842. [Google Scholar] [CrossRef]
- Malin, F.; Luoma, J. Effects of speed display signs on driving speed at pedestrian crossings on collector streets. Transp. Res. Part F Traffic Psychol. Behav. 2020, 74, 433–438. [Google Scholar] [CrossRef]
- Koh, P.; Wong, Y. Gap acceptance of violators at signalised pedestrian crossings. Accid. Anal. Prev. 2014, 62, 178–185. [Google Scholar] [CrossRef]
- Stapleton, S.; Kirsch, T.; Gates, T.J.; Savolainen, P.T. Factors Affecting Driver Yielding Compliance at Uncontrolled Midblock Crosswalks on Low-Speed Roadways. Transp. Res. Rec. J. Transp. Res. Board 2017, 2661, 95–102. [Google Scholar] [CrossRef]
- Stoker, P.; Garfinkel-Castro, A.; Khayesi, M.; Odero, W.; Mwangi, M.N.; Peden, M.; Ewing, R. Pedestrian Safety and the Built Environment. J. Plan. Lit. 2015, 30, 377–392. [Google Scholar] [CrossRef]
- Quistberg, D.A.; Howard, E.J.; Ebel, B.E.; Moudon, A.V.; Saelens, B.; Hurvitz, P.M.; Curtin, J.E.; Rivara, F.P. Multilevel models for evaluating the risk of pedestrian–motor vehicle collisions at intersections and mid-blocks. Accid. Anal. Prev. 2015, 84, 99–111. [Google Scholar] [CrossRef]
- Wang, W.; Guo, H.; Gao, Z.; Bubb, H. Individual differences of pedestrian behaviour in midblock crosswalk and intersection. Int. J. Crashworthiness 2011, 16, 1–9. [Google Scholar] [CrossRef]
- Budzynski, M.; Guminska, L.; Jamroz, K.; Mackun, T.; Tomczuk, P. Effects of Road Infrastructure on Pedestrian Safety. IOP Conf. Ser. Mater. Sci. Eng. 2019, 603, 042052. [Google Scholar] [CrossRef]
- Forde, A.; Daniel, J. Pedestrian walking speed at un-signalized midblock crosswalk and its impact on urban street segment performance. J. Traffic Transp. Eng. (Engl. Ed.) 2021, 8, 57–69. [Google Scholar] [CrossRef]
- Sisiopiku, V.; Akin, D. Pedestrian behaviors at and perceptions towards various pedestrian facilities: An examination based on observation and survey data. Transp. Res. Part F Traffic Psychol. Behav. 2003, 6, 249–274. [Google Scholar] [CrossRef]
- Shaaban, K.; Muley, D.; Mohammed, A. Analysis of illegal pedestrian crossing behavior on a major divided arterial road. Transp. Res. Part F Traffic Psychol. Behav. 2018, 54, 124–137. [Google Scholar] [CrossRef]
- Bendak, S.; Alnaqbi, A.M.; Alzarooni, M.Y.; Aljanaahi, S.M.; Alsuwaidi, S.J. Factors affecting pedestrian behaviors at signalized crosswalks: An empirical study. J. Saf. Res. 2021, 76, 269–275. [Google Scholar] [CrossRef] [PubMed]
- Jamroz, K.; Michalski, L.; Gaca, S. Pedestrian Safety. In Handbook for Organizers Pedestrian Traffic; National Council of Road Safety: Geneva, Switzerland, 2014. [Google Scholar]
- Balasubramanian, V.; Bhardwaj, R. Pedestrians’ perception and response towards vehicles during road-crossing at nighttime. Accid. Anal. Prev. 2018, 110, 128–135. [Google Scholar] [CrossRef]
- Johansson, M.; Laureshyn, A.; Nilsson, M. Video Analysis of Pedestrian Movement (VAPM) under Different Lighting Conditions—Method Exploration. Energies 2020, 13, 4141. [Google Scholar] [CrossRef]
- Jägerbrand, A.K. LED (Light-Emitting Diode) Road Lighting in Practice: An Evaluation of Compliance with Regulations and Improvements for Further Energy Savings. Energies 2016, 9, 357. [Google Scholar] [CrossRef]
- Kruszyna, M. Evaluation of Distance Between Pedestrian Crossings by Students in One of the Polish Cities. Arch. Civ. Eng. 2013, 59, 547–559. [Google Scholar] [CrossRef][Green Version]
- Chen, C.; Zhang, G.; Yang, J.; Milton, J.C.; Alcántara, A. “Dely” An explanatory analysis of driver injury severity in rear-end crashes using a decision table/Naïve Bayes (DTNB) hybrid classifier. Accid. Anal. Prev. 2016, 90, 95–107. [Google Scholar] [CrossRef]
- Hakkert, A.; Gitelman, V.; Ben-Shabat, E. An evaluation of crosswalk warning systems: Effects on pedestrian and vehicle behaviour. Transp. Res. Part F Traffic Psychol. Behav. 2002, 5, 275–292. [Google Scholar] [CrossRef]
- Chaudhari, A.R.; Gore, N.; Arkatkar, S.; Joshi, G.; Pulugurtha, S.S. Deriving Pedestrian Risk Index by Vehicle Type and Road Geometry at Midblock Crosswalks under Heterogeneous Traffic Conditions. J. Transp. Eng. Part A Syst. 2020, 146, 04020123. [Google Scholar] [CrossRef]
- Kadali, B.R.; Vedagiri, P. Proactive pedestrian safety evaluation at unprotected mid-block crosswalk locations under mixed traffic conditions. Saf. Sci. 2016, 89, 94–105. [Google Scholar] [CrossRef]
- Campbell, B.; Zegeer, C.; Huang, H.; Cynecki, M. A Review of Pedestrian Safety Research in the United States and Abroad; Federal Highway Administration, U.S. Department of Transportation: Washington, DC, USA, 2004.
- Rosén, E.; Stigson, H.; Sander, U. Literature review of pedestrian fatality risk as a function of car impact speed. Accid. Anal. Prev. 2011, 43, 25–33. [Google Scholar] [CrossRef] [PubMed]
- WHO. Pedestrian Safety; World Health Organization: Geneva, Switzerland, 2013. [Google Scholar]
- WHO. Global Status Report on Road Safety; World Health Organization: Geneva, Switzerland, 2018; Volume 151. [Google Scholar]
- Jamroz, K.; Budzyński, M.; Romanowska, A.; Zukowska, J.; Oskarbski, J.; Kustra, W. Experiences and Challenges in Fatality Reduction on Polish Roads. Sustainability 2019, 11, 959. [Google Scholar] [CrossRef]
- European Parliament and Council of the European Union. Directive 2008/96/EC of the European Parliament and of the Council of 19 November 2008 on Road Infrastructure Safety Managemen 2008; Publications Office of the European Union: Luxembourg, 2008. [Google Scholar]
- Sitran, A.; Delhaye, E.; Uccelli, I. Directive 2008/96/EC On Road Infrastructure Safety Management: An Ex-post Assessment 5 years After its Adoption. Transp. Res. Procedia 2016, 14, 3312–3321. [Google Scholar] [CrossRef][Green Version]
- European Parliament and Council of the European Union. Directive 2019/1936 of the European Parliament and of the Council of 23 October 2019 Amending Directive 2008/96/EC on Road Infrastructure Safety Management. 2019; Publications Office of the European Union: Luxembourg, 2008. [Google Scholar]
- Cafiso, S.; La Cava, G.; Montella, A. Safety Inspections as Supporting Tool for Safety Management of Low-Volume Roads. Transp. Res. Rec. J. Transp. Res. Board 2011, 2203, 116–125. [Google Scholar] [CrossRef]
- Vaiana, R.; Perri, G.; Iuele, T.; Gallelli, V. A Comprehensive Approach Combining Regulatory Procedures and Accident Data Analysis for Road Safety Management Based on the European Directive 2019/1936/EC. Safety 2021, 7, 6. [Google Scholar] [CrossRef]
- European Commission. Traffic Safety Basic Facts on Pedestrians; European Commission: Luxembourg, 2018. [Google Scholar]
- Olszewski, P.; Szagała, P.; Wolański, M.; Zielińska, A. Pedestrian fatality risk in accidents at unsignalized zebra crosswalks in Poland. Accid. Anal. Prev. 2015, 84, 83–91. [Google Scholar] [CrossRef] [PubMed]
- Olszewski, P.; Osińska, B.; Szagała, P.; Skoczyński, P.; Zielińska, A. Problems with Assessing Safety of Vulnerable Road Users Based on Traffic Accident Data. Arch. Civ. Eng. 2016, 62, 149–168. [Google Scholar] [CrossRef]
- Jamroz, K.; Kustra, W.; Budzynski, M.; Zukowska, J. Pedestrian Protection, Speed Enforcement and Road Network Structure the key Action for Implementing Poland’s Vision Zero. Transp. Res. Procedia 2016, 14, 3905–3914. [Google Scholar] [CrossRef]
- Olszewski, P.; Czajewski, W.; Dąbkowski, P.; Kraśkiewicz, C.; Szagała, P. Assessment Of The Effectiveness Of Active Signage At Pedestrian Crossings. Arch. Civ. Eng. 2015, 61, 125–140. [Google Scholar] [CrossRef]
- Tomczuk, P.; Chrzanowicz, M.; Mackun, T. Methodology for assessing the lighting of pedestrian crossings based on light intensity parameters. MATEC Web Conf. 2017, 122, 01008. [Google Scholar] [CrossRef]
- Tomczuk, P.; Jamroz, K.; Mackun, T.; Chrzanowicz, M. Lighting requirements for pedestrian crossings–positive contrast. MATEC Web Conf. 2019, 262, 05015. [Google Scholar] [CrossRef]
- Budzyński, M.; Jamroz, K.; Mackun, T. Pedestrian Safety in Road Traffic in Poland. IOP Conf. Ser. Mater. Sci. Eng. 2017, 245, 42064. [Google Scholar] [CrossRef]
- Gaca, S.; Pogodzińska, S. Speed management as a measure to improve road safety on Polish regional roads. Arch. Transp. 2017, 43, 29–42. [Google Scholar] [CrossRef]
- Bak, R.; Kiec, M. Influence of Midblock Pedestrian Crossings on Urban Street Capacity. Transp. Res. Rec. J. Transp. Res. Board 2012, 2316, 76–83. [Google Scholar] [CrossRef]
- Hatfield, J.; Fernandes, R.; Job, R.S.; Smith, K. Misunderstanding of right-of-way rules at various pedestrian crossing types: Observational study and survey. Accid. Anal. Prev. 2007, 39, 833–842. [Google Scholar] [CrossRef] [PubMed]
- Fildes, N.B.; Lee, J.S.; Kenny, D.; Foddy, W. Survey of Older Road Users: Behavioural and Travel; Monash University Accident Research Centre: Clayton, Australia, 1994. [Google Scholar]
- Guéguen, N.; Meineri, S.; Eyssartier, C. A pedestrian’s stare and drivers’ stopping behavior: A field experiment at the pedestrian crossing. Saf. Sci. 2015, 75, 87–89. [Google Scholar] [CrossRef]
- Evans, D.; Norman, P. Understanding pedestrians’ road crossing decisions: An application of the theory of planned behaviour. Health Educ. Res. 1998, 13, 481–489. [Google Scholar] [CrossRef]
- Alonso, I.P.; Fernández-Llorca, D.; Sotelo, M.A.; Bergasa, L.M.; De Toro, P.A.; Nuevo, J.; Ocana, M.; Garrido, M.A.G. Combination of Feature Extraction Methods for SVM Pedestrian Detection. IEEE Trans. Intell. Transp. Syst. 2007, 8, 292–307. [Google Scholar] [CrossRef]
- Ni, Y. Pedestrian Safety at Urban Signalised Intersections. Ph.D. Thesis, Technische Universität Darmstadt, Darmstadt, Germany, 2010. [Google Scholar]
- Hummel, T. Dutch Pedestrian Safety Research Review. SWOV Inst. Road Saf. Res. 1999, 38. [Google Scholar]
- Várhelyi, A. Dynamic Speed Adaptation Based on Information Technology: A Theoretical Background; Lund University: Lund, Sweden, 1996; Volume 166. [Google Scholar]
- Johansson, C. Towards a Method to Improve Road Safety for Pedestrians and Cyclists, Especially in Child Pedestrian Environments. a Case Study in Boras, Sweden. Licentiate Thesis, University of Technology, Luleå, Sweden, 2001. [Google Scholar]
- Diependaele, K. Non-compliance with pedestrian traffic lights in Belgian cities. Transp. Res. Part F Traffic Psychol. Behav. 2019, 67, 230–241. [Google Scholar] [CrossRef]
- Pasanen, E. Traffic Safety at Pedestrian Zebra Crossings Reports 7B/2007; LINTU research programme: Helsinki, Finland, 2007. [Google Scholar]
- Gitelman, V. National observational survey of pedestrian behaviour at crosswalks. In Proceedings of the International Conference on Safety and Mobility of Vulnerable Road Users: Pedestrians, Motorcyclists, and Bicyclists, Jerusalem, Israel, 30 May–2 June 2010. [Google Scholar]
- Ibrahim, N.I.; Karim, M.R.; Kidwai, F.A. Motorists and pedestrian interaction at unsignalised pedestrian crossing. East. Asia Soc. Transp. Stud. 2005, 5, 120–125. [Google Scholar]
- Nordh, U. Pedestrians ’ safety and accessibility—A study of the situation at Pärnu mnt in central Tallinn. Master’s Thesis, Lund University, Lund, Sweden, 2007. [Google Scholar]
- Park, H.J.; Li, S.; Yu, W.; Yang, W.; Alhajyaseen, W.; Iryo-Asano, M. Pedestrian crossing behavior and compliance at signalized intersections. In Proceedings of the Road Safety on Five Continents (RS5C) 17th International Conference, Rio de Janeiro, Brazil, 17–18 May 2016. [Google Scholar]
- Guo, H.; Gao, Z.; Yang, X.; Jiang, X. Modeling Pedestrian Violation Behavior at Signalized Crosswalks in China: A Hazards-Based Duration Approach. Traffic Inj. Prev. 2011, 12, 96–103. [Google Scholar] [CrossRef] [PubMed]
- Ren, G.; Zhou, Z.; Wang, W.; Zhang, Y.; Wang, W. Crossing Behaviors of Pedestrians at Signalized Intersections: Observational Study and Survey in China. Transp. Res. Rec. J. Transp. Res. Board 2011, 2264, 65–73. [Google Scholar] [CrossRef]
- Sun, R.; Zhuang, X.; Wu, C.; Zhao, G.; Zhang, K. The estimation of vehicle speed and stopping distance by pedestrians crossing streets in a naturalistic traffic environment. Transp. Res. Part F Traffic Psychol. Behav. 2015, 30, 97–106. [Google Scholar] [CrossRef]
- Zhang, C.; Chen, F.; Wei, Y. Evaluation of pedestrian crossing behavior and safety at uncontrolled mid-block crosswalks with different numbers of lanes in China. Accid. Anal. Prev. 2019, 123, 263–273. [Google Scholar] [CrossRef] [PubMed]
- Zhang, C.; Zhou, B.; Chen, G.; Chen, F. Quantitative analysis of pedestrian safety at uncontrolled multi-lane mid-block crosswalks in China. Accid. Anal. Prev. 2017, 108, 19–26. [Google Scholar] [CrossRef]
- Pawar, D.S.; Patil, G.R. Critical gap estimation for pedestrians at uncontrolled mid-block crossings on high-speed arterials. Saf. Sci. 2016, 86, 295–303. [Google Scholar] [CrossRef]
- Pawar, D.S.; Kumar, V.; Singh, N.; Patil, G.R. Analysis of dilemma zone for pedestrians at high-speed uncontrolled midblock crossing. Transp. Res. Part C Emerg. Technol. 2016, 70, 42–52. [Google Scholar] [CrossRef]
- Mikusova, M.; Wachnicka, J.; Zukowska, J. Research on the Use of Mobile Devices and Headphones on Pedestrian Crossings—Pilot Case Study from Slovakia. Safety 2021, 7, 17. [Google Scholar] [CrossRef]
- Wu, J.; Radwan, E.; Abou-Senna, H. Pedestrian-vehicle conflict analysis at signalized intersections using micro-simulation. In Proceedings of the Road Safety on Five Continents (RS5C) 17th International Conference, Rio de Janeiro, Brazil, 17–18 May 2016. [Google Scholar]
- Lu, L.; Ren, G.; Wang, W.; Chan, C.-Y.; Wang, J. A cellular automaton simulation model for pedestrian and vehicle interaction behaviors at unsignalized mid-block crosswalks. Accid. Anal. Prev. 2016, 95, 425–437. [Google Scholar] [CrossRef] [PubMed]
- Calvi, A.; D’Amico, F.; Ferrante, C.; Ciampoli, L.B. Effectiveness of augmented reality warnings on driving behaviour whilst approaching pedestrian crossings: A driving simulator study. Accid. Anal. Prev. 2020, 147, 105760. [Google Scholar] [CrossRef]
- Soathong, A.; Wilson, D.; Ranjitkar, P.; Chowdhury, S. A Critical Review of Policies on Pedestrian Safety and a Case Study of New Zealand. Sustainability 2019, 11, 5274. [Google Scholar] [CrossRef]


Publisher’s Note: MDPI stays neutral with regard to jurisdictional claims in published maps and institutional affiliations. |
© 2021 by the authors. Licensee MDPI, Basel, Switzerland. This article is an open access article distributed under the terms and conditions of the Creative Commons Attribution (CC BY) license (https://creativecommons.org/licenses/by/4.0/).