Abstract
The pressure swing adsorption (PSA) process was used to capture carbon dioxide (CO2) from the flue gas of a coal-fired power plant to reduce CO2 emissions. Herein, CO2 was captured from flue gas using the PSA process for at least 85 vol% CO2 purity and with the other exit stream from the process of more than 90 vol% N2 purity. The extended Langmuir–Freundlich isotherm was used for calculating the equilibrium adsorption capacity, and the linear driving force model was used to describe the gas adsorption kinetics. We compared the results of breakthrough curves obtained through experiments and simulations to verify the accuracy of the mass transfer coefficient. The flue gas obtained after desulphurization and water removal (13.5 vol% CO2 and 86.5 vol% N2) from a subcritical 1-kW coal-fired power plant served as the feed for the designed three-bed, nine-step PSA process. To determine optimal operating conditions for the process, the central composite design (CCD) was used. After CCD analysis, optimal operating conditions with a feed pressure of 3.66 atm and a vacuum pressure of 0.05 atm were obtained to produce a bottom product with a CO2 purity of 89.20 vol% and a recovery of 88.20%, and a top product with a N2 purity of 98.49 vol% and a recovery of 93.56%. The mechanical energy consumption was estimated to be 1.17 GJ/t-CO2.
1. Introduction
This study is an improved version of the previously published work [1].
Driven by higher energy demand in 2018, global energy-related CO2 emissions rose 1.7% to a historic high of 33.1 Gt CO2 [2]. The World Meteorological Organization published the “Greenhouse Gas Bulletin”, which indicates that the average CO2 concentration in the atmosphere was 405 ppm in 2017, which is considerably higher than the value of 277 ppm before the industrial revolution [3]. These facts indicate the urgent need to reduce CO2. To maintain a global temperature rise below 2 °C above the pre-industrial level by the end of this century, the European Union has set a target of reducing at least 40% CO2 emissions by 2030 compared with the emissions reported in 1990. The goal is to move toward a climate-neutral economy (i.e., an economy with zero net greenhouse gas emissions) by 2050 [4]. The Government of the United Kingdom intends to reduce 80% CO2 emissions by 2050, compared to 1990 levels [5].
CO2 can be captured from flue gas after combustion or syngas before combustion using carbon capture methods. The CO2 concentration in the flue gas from coal-fired and gas-fired power plants is approximately 10–18 vol% and 3–8 vol%, respectively. Because the CO2 concentration in the flue gas emitted after combustion is not high, CO2 separation becomes difficult [6]. Three typical approaches for capturing CO2 from power plants include postcombustion, precombustion, and oxyfuel combustion [7]. The postcombustion capture technology does not affect the existing combustion process. Therefore, currently, it is the main CO2 capture technology. Adsorbents and the PSA process for postcombustion capture have advanced considerably, and zeolite is a commonly used adsorbent [8]. In the precombustion capture method, CO2 is captured before combustion, which separates CO2 from the synthesis gas produced from coal gasification in an integrated gasification combined cycle (IGCC) power plant. [9]. In oxyfuel combustion, fossil fuels are burned in an oxygen-enriched gas, which mainly produces CO2 and steam, thereby making the CO2 capture process easier. However, a significant amount of energy is required for separating O2 from air. Among the aforementioned three methods, in terms of maturity, both postcombustion and precombustion capture technologies are economically feasible under certain conditions [10].
The four main gas separation processes used in industrial CO2 capture are absorption, cryogenic separation, membrane separation, and adsorption. In chemical absorption, the monoethanolamine (MEA) solvent is the commercialized mature technology for postcombustion capture and is widely used in the industry. However, the absorption process has drawbacks such as the generation of chemical solvent waste, the requirement of significant amounts of energy for solvent regeneration, and the need for amine stability improvements [10,11,12]. For membrane separation, large-scale membrane processes are superior to other processes because lower operation costs are required [13]. However, at this moment, a sufficiently high selectivity membrane combined with a large flux is not realistic [14] and compared with other technologies, this technology requires a higher manufacturing cost [15]. Further, cryogenic separation requires more energy than PSA, although PSA even has a larger plant capacity [16,17]. The disadvantages of this technology are high energy consumption and low efficiency. Furthermore, solidified CO2 may accumulate on the heat exchanger surface [18,19]. In addition to the absorption method, adsorption is considered a viable method for capturing CO2 on an industrial scale [20]. Adsorption exhibits many advantages over absorption, including lower energy requirements, lower waste generation, and faster regeneration [8,11]. It consumed less power than the post combustion MEA absorption method [21]. However, Riboldi et al. stated that the power required for CO2 compression increases in the case of PSA process compared with an absorption plant [22]. For adsorption, some commonly used adsorbents, such as zeolite and metal–organic frameworks (MOFs), show a high adsorption CO2 capacity. Therefore, PSA is expected to play an important role in CO2 capture in the future. In our study, zeolite 13X was used as an adsorbent, which provides operational flexibility and cost-effectiveness [23]. The main limitation of zeolites is their sensitivity to moisture, resulting in a significant reduction in CO2 uptake. Thus, the flue gas must be dewatered before the PSA process [24].
Wang et al. [25] compared different carbon capture procedures, showing that the energy consumption of the adsorption method is better than that of the absorption method. Patil et al. [26] used an 2-amino-2-methyl-1-propanol (AMP)/piperazine (PZ)/water mixture in a closed-loop adsorber–desorber system to separate CO2 from the postcombustion gas (CO2–N2 mixture, CO2 12 vol%), achieving a removability of 85 vol% and an energy consumption of 3.78 MJ/kg-CO2. Shen et al. [27] used activated carbon in a two-stage vacuum PSA (VPSA) process to separate a flue gas of 15 vol% CO2. For the second-stage VPSA experiments, optimal experimental results of a CO2 purity of 94.14 vol% with a recovery of 85.08% and a productivity of 1.139 × 10⁻³ mol/kg s were achieved. Alternatively, for the integrated two-stage VPSA experiments, optimal simulation results involved a CO2 purity of 96.34 vol% with a recovery of 80.72%, productivity of 2.58 × 10⁻⁴ mol/kg s, and energy consumption of 829.28 kJ/kg-CO2. Wang et al. [28] simulated a modified two-stage VPSA process to capture CO2 in a flue gas with 15 vol% CO2. The first stage involved a three-bed five-step process, and the second-stage involved a two-bed six-step process. Both stages used zeolite 13X-APG as the adsorbent, and the results indicated that a CO2 purity of 96.54 vol% was obtained, with a recovery of 93.35%, energy consumption of 528.39 kJ/kg-CO2, and productivity of 8.61 × 10⁻⁶ kg CO2/kg s. Xiao et al. [29] conducted three-bed nine-step and three-bed twelve-step PSA processes (both used zeolite 13X as the adsorbent and 12 vol% CO2 balanced by dry air as the feed), obtaining a CO2 purity of 95 vol% with 70% recovery. Additionally, this study indicated that the vacuum pressure is the most important factor affecting the purity, recovery, and energy consumption. Alibolandi et al. [30] used zeolite 13X and carbon molecular sieve as adsorbents in a four-bed eight-step PSA process to separate 80 vol% nitrogen and 20 vol% CO2, showing that the performance of zeolite 13X was better than that of the carbon molecular sieve. They achieved optimal results involving a CO2 purity of 97.6 vol% in a cycle time of 560 s and an adsorption pressure of 3.66 atm. Zhang et al. [31] compared six-step and nine-step processes and used zeolite 13X as the adsorbent, indicating that the nine-step cycle can produce high purity gas and obtain a CO2 purity of more than 90 vol% with recovery exceeding 60% from a feed stream of 12 vol% CO2.
In this study, we used EIKME zeolite 13X as the adsorbent and 13.5 vol% CO2 balanced by N2 as the feed. The feed flow rate of flue gas entering PSA from a subcritical 1-kW coal-fired power plant was adopted according to the National Energy Technology Laboratory (NETL) report [32]. To determine optimal operating conditions, the central composite design (CCD) was used for analysis. Before this study, there was no PSA process used for carbon capture in Taiwan’s power plants. Herein, a PSA process was developed to capture CO2 from a subcritical 1-kW coal-fired power plant in the Taiwan Power Company and the developed PSA process is now operating at the Taichung Power Plant.
2. Materials and Methods
2.1. Mathematical Model
A PSA dynamic model is established using several partial differential equations, and the following assumptions are made:
- The mass transfer resistance between the gas and solid phases is considered, and a linear driving force (LDF) model is used.
- The extended Langmuir–Freundlich equation is used to calculate the equilibrium adsorption capacity.
- Only axial concentration and temperature gradient are considered.
- The ideal gas law is employed.
- The non-isothermal system is assumed.
- The pressure drop along the bed can be neglected owing to the large size of the particle.
The above assumptions are used in the following equations [33].
Overall mass balance:
Mass balance for component i:
Energy balance:
The corresponding boundary conditions are provided in the literature [34]. The LDF model and extended Langmuir–Freundlich isotherm are used in the simulation.
Extended Langmuir–Freundlich isotherm equation:
where
In Equation (4), represents the equilibrium adsorption capacity of component i per unit adsorbent mass, represents the equilibrium adsorption capacity of component i per unit adsorbent volume, is the density of the adsorbent, is the pressure, is the mole fraction of component i, and is the temperature. The parameters , ,, , , and used in Equation (5) are all adsorption isotherm parameters.
LDF model:
In Equation (6), represents the adsorption capacity of component i per unit adsorbent volume.
The parameters of the adsorption bed used in the simulation are described in Section 2.3. The simulation program accuracy is verified by performing a comparative analysis between simulation and experimental data and discussed in Section 3.2 and Section 3.3.
2.2. Gases and Adsorbent
The flue gas after desulphurization and water removal (13.5 vol% CO2 and 86.5 vol% N2) from the subcritical 1-kW coal-fired power plant was provided as the feed for the designed three-bed nine-step PSA process. Moreover, the heat capacities of CO2 and N2 were estimated from the book by Smith and Ness [35].
In this study, we used the zeolite 13X as the adsorbent, which is often used for carbon capture [28,29,30]. Zeolite 13X shows good adsorption capacity and selectivity. Therefore, it has an excellent effect on CO2 separation. The parameters of the adsorbent are presented in Table 1.

Table 1.
Characteristic properties of EIKME zeolite 13X.
2.3. PSA Process
In this study, a three-bed, nine-step PSA process (Figure 1) is used to capture CO2 via a simulation study. The process involved adsorption (AD), pressure equalization (PE), cocurrent depressurization (CD), vacuum (VA), and idle (ID), and EIKME 13X was used as the adsorbent. The feed composition of the process is adopted from the study by Wawrzyńczak et al. [36]. The flue gas emitted by the power plant is first desulfurized. Then, the water is removed, resulting in 13.5 vol% CO2 and 86.5 vol% N2. The goal is to obtain CO2 and N2 purities of 85 and 90 vol% in two streams, respectively.
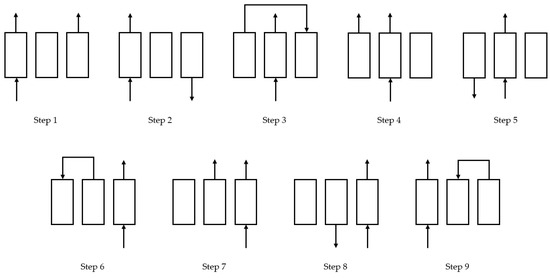
Figure 1.
Procedure of the three-bed nine-step PSA process.
The sequence of the cycle steps for the three-bed nine-step PSA process is shown in Figure 1. Steps 1, 2, and 9 are adsorption steps: feed gas is fed to the bottom of the bed at a high pressure, adsorption occurs in the bed, and a N2-rich product is obtained from the top of the bed. Steps 3 and 6 are PE steps: the high- and low-pressure beds are connected to increase the pressure of the low-pressure bed, thus preparing the low-pressure bed for the next adsorption step. Step 4 involves CD: the exhaust end of the top of the bed is opened to decrease the pressure, thus reducing the weak adsorption adsorbate concentration and increasing the strong adsorption adsorbate concentration in the gas phase for recovery in Step 5. Step 5 involves VA: the exhaust end of the bottom of the bed is opened, thus decreasing the bed pressure and allowing the strongly adsorbed gas component to be desorbed and the CO2-rich product to be obtained from the bottom of the bed. Steps 7 and 8 are idle steps with both ends of the bed closed.
To confirm the accuracy of the parameters used in the simulation, 100-h experimental data from the three-bed nine-step PSA process for the subcritical 1-kW coal-fired power plant were used. The step time of the process and parameters of the bed are presented in Table 2 and Table 3.
Table 2.
Step time of three-bed nine-step PSA process.
Table 3.
Parameters of the adsorption bed.
2.4. Experimental Setup
In this study, we conducted three experiments: equilibrium adsorption experiment, breakthrough curve experiment, and 100-h three-bed nine-step PSA process experiment.
Herein, the adsorption isotherm experiment was conducted using microbalance Thermo D-200 (Figure 2) and the weight of the adsorbent was measured at different pressures and at a specified temperature for each experimental run. The weight change of the adsorbent was recorded at different pressures, and its isotherm curve was plotted. Additionally, the schematic of the breakthrough curve experimental device is shown in Figure 3. The breakthrough curve experiment was conducted at a certain operating pressure and temperature, and the mixed gas at a fixed flow rate was fed into the adsorption bed. Moreover, we observed the adsorbate concentration at the outlet end. The adsorption bed reached a breakthrough state when the outlet end concentration was the same as the feed concentration. The last experiment was the three-bed, nine-step PSA process, and the schematic of the experimental device is shown in Figure 4.
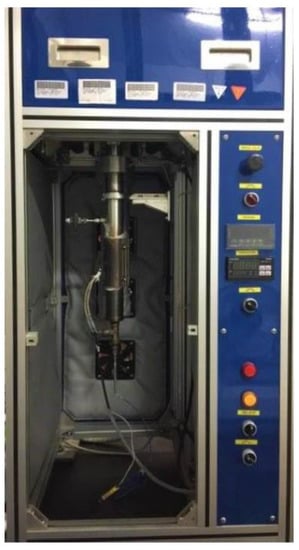
Figure 2.
Microbalance Thermo D-200.
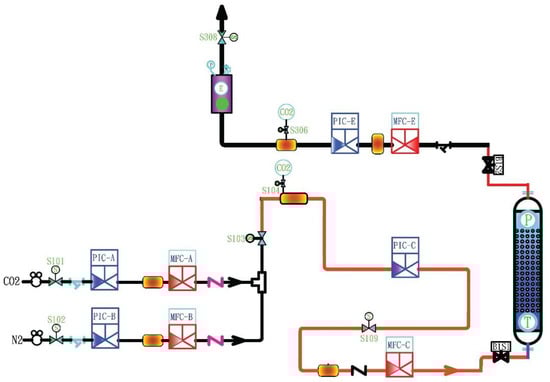
Figure 3.
Schematic of breakthrough curve experimental device.
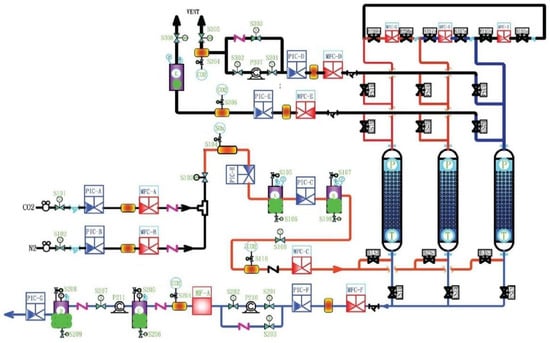
Figure 4.
Schematic of three-bed nine-step PSA process experimental device.
3. Results and Discussion
3.1. Adsorption Isotherms
The CO2 and N2 adsorption capacities on EIKME 13X zeolite were measured using the microbalance Thermo D-200. The results show that the CO2 adsorption capacity on the adsorbent was considerably greater than the N2 adsorption capacity on the adsorbent, implying that zeolite 13X can separate these two gas components. The extended Langmuir–Freundlich isotherm (Equation (4)) was used as the equilibrium adsorption model, and the parameters were fitted using MATLAB Curve Fitting Toolbox. All the parameters are presented in Table 4. We can use the isotherm equation to calculate and predict the adsorption capacity of each component under different temperatures and pressures. The isotherm curves and the error bars of 95% confidence intervals are shown in Figure 5.
Table 4.
Extended Langmuir–Freundlich isotherm parameters of CO2 and N2 on zeolite 13X.
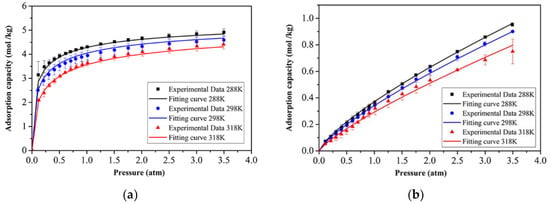
Figure 5.
Adsorption isotherm of (a) CO2 and (b) N2 on EIKME 13X zeolite.
3.2. Breakthrough and Desorption Curve Verification
To verify the reliability of the LDF coefficient, kLDF, and simulation program, the breakthrough curve and desorption curve experiments were performed. The operating conditions are presented in Table 5, and the results are shown in Figure 6. These results show that our simulation data are close to the experimental data. Therefore, the accuracy of the mass transfer coefficient was verified.
Table 5.
Operating parameters of the breakthrough and desorption curves.
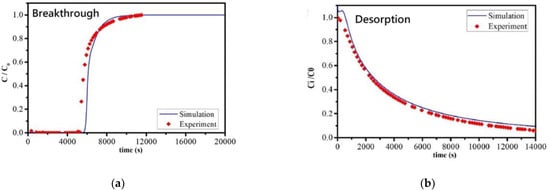
Figure 6.
Simulation of (a) breakthrough curve and (b) desorption curve.
3.3. Three-Bed Nine-Step PSA Process Verification
In this section, the average experimental data of the last 40 cycles of the onsite 100-h three-bed nine-step PSA process experiment at a power plant are used for the simulation verification. The cyclic-steady-state feed concentration of CO2 is 15.36 vol% and the concentration of N2 is 84.64 vol%, the feed flow rate, feed pressure, vacuum pressure, vent pressure, surrounding temperature, and feed temperature are 9.703 × 10⁻⁴ m3/s, 3 atm, 0.07 atm, 0.25 atm, 303.14 K, and 303.14 K, respectively. The experimental and simulation results are presented in Table 6, and the simulation results are close to the experimental results. Based on Figure 7, the temperature and pressure profiles of both the simulation and experiment follow the same trend, confirming the accuracy of the simulation program.
Table 6.
Results of the three-bed nine-step PSA process.
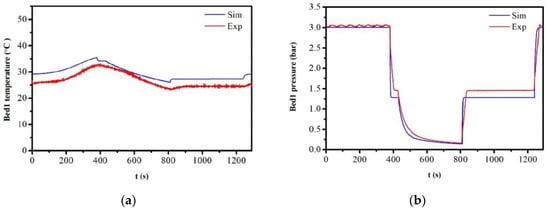
Figure 7.
Comparison of experimental and simulation data for bed 1 (a) temperature and (b) pressure at z = 0.2 m.
3.4. Basic Case of the Three-Bed Nine-Step PSA Process
In this section and the next section, the flue gas from a subcritical 1-kW coal-fired power plant is considered as the feed and its composition comprises 13.5 vol% CO2 and 86.5 vol% N2. The operating conditions of the basic case are presented in Table 2 and Table 3. The feed flow rate in Table 2 for the subcritical 1-kW coal-fired power plant is estimated from the NETL report [33]. The simulation results for the basic case are presented in Table 7.
Table 7.
Results of the basic case process.
3.5. Three-Bed Nine-Step PSA Process Optimization
The CCD was used to determine the optimal operating conditions for the process. This design can be used to explore the interaction between the factors, obtain the most suitable conditions, and reduce the time and cost of the simulation or experiments. The variables include the feed pressure, vacuum pressure, CD pressure, ambient temperature, time of CD step, time of vacuum step, and tower length. The high-, basic-, and low-level setting values of each factor are presented in Table 8. We set seven factors and perform corner-point experiments, 14 axial-point experiments, and 10 center-point experiments in the simulation, achieving 152 sets of data. The data were provided as inputs to Minitab software to conduct a CCD experiment [38]. The effects of the seven variables on the purity and recovery of CO2 in the bottom product and energy consumption were discussed, and the importance of these three responses was set to 1 in Minitab software. Finally, regression analysis was used to determine the optimal response and operating conditions. The optimal results are based on the settings of the maximum CO2 purity, maximum CO2 recovery, and minimum energy consumption.
Table 8.
Operating parameters.
Equations (7)–(9) present the regression equations for the bottom product CO2 purity, bottom product CO2 recovery, and energy consumption, respectively, which can be used for optimization. The coefficient multiplied by each factor is the regression coefficient, and the factor multiplication term indicates the interaction between the two factors. When the coefficient is large, the effect of this term on the response value is significant. In Figure 8, the red line represents the optimal values of the seven variables. Moreover, these optimal values are provided as inputs to the simulation program to compare the results. The optimization results using the setting value from Figure 8 are presented in Table 9 and Table 10.
Purity (%) = 208.683 + 8.44694 (1/atm) A − 136.4 (1/atm) B − 10.6067 (1/atm) C
− 1.03797 (1/K) D + 0.254009 (1/s) E + 0.0168206 (1/s) F
+ 0.753353 (1/cm) G − 1.11434 (1/atm2) A · A + 303.611 (1/atm2) B · B
− 14.7843 (1/atm3) C · C + 0.00176753 (1/K²) D · D − 0.00158675 (1/s2) E · E
+ 0.0001 (1/s2) F · F + 0.000643 (1/cm2) G · G − 0.31307 (1/atm2) A · B
+ 12.9433 (1/atm2) A · C + 0.000388 (1/atm⋅K) A · D + 0.015792 (1/atm · s) A · E
+ 0.00384 (1/atm · s) A · F − 0.08853 (1/atm · cm) A · G − 45.2696 (1/atm2) B · C
+ 0.436755 (1/atm · K) B · D + 0.499657 (1/atm · s) B · E − 0.239613 (1/atm · s) B · F
− 0.862748 (1/atm · cm) B · G − 0.0234598 (1/atm · K) C · D − 0.323612 (1/atm · s) C · E
− 0.0206273 (1/atm · s) C · F + 0.103386 (1/atm · cm) C · G + 0.0004568 (1/K · s) D · E
− 4.61 · 10−5 (1/K · s) D · F − 0.00292673 (1/K · cm) D · G − 1.59 · 10−4 (1/s2) E · F
+ 0.00148013 (1/s · cm) E · G − 2.7 · 10−4 (1/s⋅cm) F · G
Recovery (%) = −54.8248 + 5.70294 (1/atm) A − 290.665 (1/atm) B − 1.79674 (1/atm) C + 0.949833 (1/K) D − 0.100019 (1/s) E − 0.0570018 (1/s) F − 1.02886 (1/cm) G − 1.816 (1/atm²) A · A − 1406.76 (1/atm²) B · B − 29.2673 (1/atm²) C · C − 0.0016378 (1/K²) D · D − 1.65144 · 10−5 (1/s²) E · E − 2.19 · 10−4 (1/s²) F · F − 0.0115602 (1/cm2) G · G + 95.1987 (1/atm2) A · B − 4.91901 (1/atm²) A · C − 0.001048 (1/atm⋅K) A · D − 0.0285889 (1/atm · s) A · E − 0.00544839 (1/atm · s) A · F + 0.186206 (1/atm · cm) A · G + 163.14 (1/atm2) B · C − 0.403525 (1/atm · K) B · D − 0.9026 (1/atm · s) B · E − 0.269244 (1/atm · s) B · F + 3.48384 (1/atm · cm) B · G − 0.0252969 (1/atm · K) C · D + 0.240571 (1/atm · s) C · E + 0.0666479 (1/atm · s) C · F + 0.135799 (1/atm · cm) C · G + 7.99 · 10−5 (1/K · s) D · E + 1.60842 · 10−4 (1/K · s) D · F + 0.00265063 (1/K · cm) D · G − 1.21 · 10−4 (1/s2) E · F + 0.0029009 (1/s · cm) E · G + 0.0012076 (1/s · cm) F · G
Energy consumption (GJ/tonne − CO2) = 1.1382 + 0.714472 (1/atm) A + 1.09506 (1/atm) B + 0.448582 (1/atm) C − 0.0099 (1/K) D + 0.00436957 (1/s) E − 0.00259758 (1/s) F + 0.0097060 (1/cm) G − 0.038474 (1/atm²) A · A + 36.4096 (1/atm²) B · B + 0.0355262 (1/atm²) C · C + 1.85 · 10−5 (1/K²) D · D + 6.29 · 10−6 (1/s²) E · E + 6.12 · 10−6 (1/s²) F · F + 1.85442 · 10−4 (1/cm²) G · G − 0.0859038 (1/atm²) A · B − 0.00750255 (1/atm²) A · C − 2.83 · 10−4 (1/atm · K) A · D + 0.00132517 (1/atm · s) A · E − 2.33 · 10−4 (1/atm · s) A · F − 0.00373936 (1/atm · cm) A · G − 4.36119 (1/atm²) B · C − 0.00479232 (1/atm · K) B · D + 0.032285 (1/atm · s) B · E + 0.0011352 (1/atm · s) B · F − 0.08924 (1/atm · cm) B · G + 7.96313 · 10−4 (1/atm · K) C · D − 0.005784 (1/atm · s) C · E − 1.21 · 10−4 (1/atm · s) C · F + 0.00448796 (1/atm · cm) C · G − 5.44 · 10−6 (1/K · s) D · E − 1.27 · 10−6 (1/K · s) D · F− 1.23 · 10−5 (1/K · cm) D · G − 7.19 · 10−6 (1/s²) E · F − 6.56 · 10−5 (1/s · cm) E · G − 1.20 · 10−5 (1/s · cm) F · G
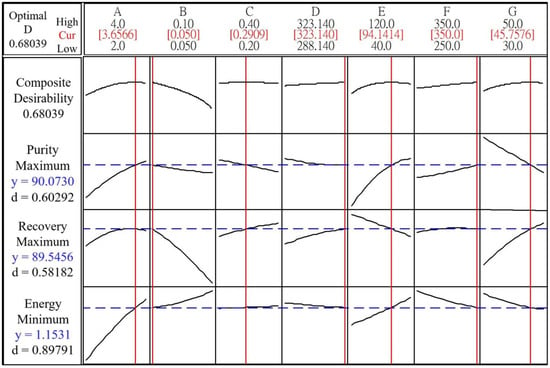
Figure 8.
Optimal response of regression from purity, recovery, and energy consumption.
Table 9.
Optimal operating conditions for capturing CO2 from flue gas using the three-bed nine-step PSA process.
Table 10.
Simulation results before and after the CCD analysis for purity, recovery, and energy consumption.
4. Conclusions
In this study, the isotherm parameters were obtained by fitting the CO2 and N2 adsorption data from the experiment. The breakthrough curve and desorption curve experiments performed at the laboratory scale were used to verify the simulation accuracy, and the agreement between the experimental data and the simulation results is good. The three-bed, nine-step PSA process experiment was used to capture the flue gas from the power plant for the 100-h three-bed nine-step PSA process experiment. The comparison between the experimental and simulation data shows that the simulation results were reliable. Finally, this study used the CCD and regression analysis to determine the optimal purity, recovery, and minimum energy consumption with a feed composition involving 13.5 vol% CO2 and 86.5 vol% N2. The simulation results showed that the purity of the CO2 in the bottom product could reach 89.20 vol% with a recovery of 88.20%, while the purity of the N2 in the top product could reach 98.49% with a recovery of 93.56%. When using the flue gas from a subcritical 1-kW coal-fired power plant as the feed, the power consumption was 1.17 GJ/t-CO2 under optimal conditions: feed pressure = 3.66 atm, vacuum pressure = 0.05 atm, CD pressure = 0.3 atm, surrounding temperature = 323.14 K, step 1/4/7 time = 94 s, step 2/5/8 time = 350 s, and bed length = 0.46 m.
Author Contributions
Investigation, C.-Y.C. and C.-C.K.; Resources, Z.-Y.Z.; Software, H.-S.Y.; Supervision, M.-W.Y. and C.-T.C.; Writing—original draft, P.-W.L. and Y.-F.C. All authors have read and agreed to the published version of the manuscript.
Funding
This research was funded by the Taiwan Power Company.
Institutional Review Board Statement
Not applicable.
Informed Consent Statement
Not applicable.
Data Availability Statement
The data presented in this study are available in [1].
Acknowledgments
The authors wish to thank the Taiwan Power Company for financial support.
Conflicts of Interest
The authors declare no conflict of interest.
Nomenclature
| ɛ | bed porosity | (-) |
| density of adsorbent | (kg/) | |
| bi | isotherm parameter of component i in Equation (4) | (-) |
| average heat capacity in gas phase | (J/molK) | |
| average heat capacity in solid phase | (J/molK) | |
| bed inner diameter | (m) | |
| axial dispersion coefficient of component i | () | |
| heat of adsorption for component i | (J/mol) | |
| h | heat transfer coefficient | (J/Ks) |
| average thermal conductivity | (J/Kms) | |
| linear driving force mass transfer coefficient | (1/s) | |
| isotherm parameter of component i in Equation (4) | (-) | |
| adsorbed capacity of component i | (mol/ | |
| equilibrium adsorbed capacity of component i | (mol/ | |
| p | pressure | (atm) |
| q | molar flow rate | (mol/s) |
| adsorbed capacity of component i | (mol/kg | |
| saturated adsorbed capacity of component i | (mol/kg | |
| R | gas constant | (Pa/molK) |
| S | cross-sectional area | () |
| T | temperature | (K) |
| surrounding temperature | (K) | |
| t | time | (s) |
| molar fraction of component i in gas phase | (-) | |
| z | axial position | (m) |
| AMP | 2-amino-2-methyl-1-propanol | |
| AD | adsorption | |
| CD | cocurrent depressurization | |
| CCD | central composite design | |
| LDF | linear driving force | |
| MEA | monoethanolamine | |
| MOFs | metal-organic frameworks | |
| NETL | national energy technology laboratory | |
| PE | pressure equalization | |
| PSA | pressure swing adsorption | |
| PZ | piperazine | |
| ID | idle | |
| IGCC | integrated gasification combined cycle | |
| VA | vacuum | |
| VPSA | vacuum pressure swing adsorption |
References
- Cheng, C.Y.; Kuo, C.C.; Yang, M.W.; Zhuang, Z.Y.; Lin, P.W.; Yang, H.S.; Chou, C.T. Simulation of carbon capture from flue gas of a coal-fired power plant by a three-bed pressure swing adsorption process. Chem. Eng. Trans. 2020, 81, 415–420. [Google Scholar]
- International Energy Agency. Global Energy & CO2 Status Report 2019. Available online: https://www.iea.org/reports/global-energy-CO2-status-report-2019 (accessed on 15 May 2021).
- Quéré, C.L.; Andrew, R.M.; Friedlingstein, P.; Sitch, S.; Pongratz, J.; Manning, A.C.; Korsbakken, J.I.; Peters, G.P.; Canadell, J.G.; Jackson, R.B.; et al. Global Carbon Budget 2017. Earth Syst. Sci. Data 2018, 10, 405–448. Available online: https://essd.copernicus.org/articles/10/405/2018/ (accessed on 15 May 2021). [CrossRef]
- Chao, C.; Deng, Y.; Dewil, R.; Baeyens, J.; Fan, X. Post-combustion carbon capture. Renew. Sustain. Energy Rev. 2020, 138, 110490. [Google Scholar] [CrossRef]
- The Climate Change Act 2008 (2050 Target Amendment). Available online: www.legislation.gov.uk/uksi/2019/1056/contents/made (accessed on 15 May 2021).
- Subraveti, S.G.; Pai, K.N.; Rajagopalan, A.K.; Wilkins, N.S.; Rajendran, A.; Jayaraman, A.; Alptekin, G. Cycle design and optimization of pressure swing adsorption cycles for pre-combustion CO2 capture. Appl. Energy 2019, 254, 113624. [Google Scholar] [CrossRef]
- Rubin, E.S.; Chen, C.; Rao, A.B. Cost and performance of fossil fuel power plants with CO2 capture and storage. Energy Policy 2007, 35, 4444–4454. [Google Scholar] [CrossRef]
- Riboldi, L.; Bolland, O. Overview on pressure swing adsorption (PSA) as CO2 capture technology: State-of-the-art, limits and potentials. Energy Procedia 2017, 114, 2390–2400. [Google Scholar] [CrossRef]
- Haines, M.; Kemper, J.; Davison, J.; Gale, J.; Singh, P.; Santos, S. Assessment of Emerging CO2 Capture Technologies and Their Potential to Reduce Costs; IEA: Paris, France, 2014. [Google Scholar]
- Kenarsari, S.D.; Yang, D.; Jiang, G.; Zhang, S.; Wang, J.; Russell, A.G.; Wei, Q.; Fan, M. Review of recent advances in carbon dioxide separation and capture. RSC Adv. 2013, 3, 22739–22773. [Google Scholar] [CrossRef]
- Zaman, M.; Lee, J.H. Carbon capture from stationary power generation sources: A review of the current status of the technologies. Korean J. Chem. Eng. 2013, 30, 1497–1526. [Google Scholar] [CrossRef]
- Yang, H.; Xu, Z.; Fan, M.; Gupta, R.; Slimane, R.B.; Bland, A.E.; Wright, I. Progress in carbon dioxide separation and capture: A review. J. Environ. Sci. 2008, 20, 14–27. [Google Scholar] [CrossRef]
- Wang, X.; Song, C. Carbon capture from flue gas and the atmosphere: A perspective. Front. Energy Res. 2020, 8, 560849. [Google Scholar] [CrossRef]
- Yamasaki, A. An overview of CO2 mitigation options for global warming- emphasizing CO2 sequestration options. J. Chem. Eng. Jpn. 2003, 36, 361–375. [Google Scholar] [CrossRef]
- Scholes, C.A.; Kentish, S.E.; Stevens, G.W. The effect of condensable minor components on the gas separation performance of polymeric membranes for carbon dioxide capture. Energy Procedia 2009, 1, 311–317. [Google Scholar] [CrossRef]
- Burdyny, T.; Struchtrup, H. Hybrid membrane/cryogenic separation of oxygen from air for use in the oxy-fuel process. Energy 2010, 35, 1884–1897. [Google Scholar] [CrossRef]
- Helwani, Z.; Wiheeb, A.D.; Kim, J.; Othman, M.R. In-situ mineralization of carbon dioxide in a coal-fired power plant. Energy Sour. Part A 2016, 38, 606–611. [Google Scholar] [CrossRef]
- Tuinier, M.J.; van Sint Annaland, M.; Kramer, G.J.; Kuipers, J.A.M. Cryogenic CO2 capture using dynamically operated packed beds. Chem. Eng. Sci. 2010, 65, 114–119. [Google Scholar] [CrossRef]
- Lam, M.K.; Lee, K.T.; Mohamed, A.R. Current status and challenges on microalgae-based carbon capture. Int. J. Greenh. Gas Control 2012, 10, 456–469. [Google Scholar] [CrossRef]
- Pires, J.C.M.; Martins, F.G.; Alvim-Ferraz, M.C.M.; Simões, M. Recent developments on carbon capture and storage: An overview. Chem. Eng. Res. Des. 2011, 89, 1446–1460. [Google Scholar] [CrossRef]
- Wiheeb, A.D.; Helwani, Z.; Kim, J.; Othman, M.R. Pressure swing adsorption technologies for carbon dioxide capture. Sep. Purif. Rev. 2016, 45, 108–121. [Google Scholar] [CrossRef]
- Riboldi, L.; Bolland, O.; Ngoy, J.M.; Wagner, N. Full-plant analysis of a PSA CO2 capture unit integrated in coal-fired power plants: Post-and pre-combustion scenarios. Energy Procedia 2014, 63, 2289–2304. [Google Scholar] [CrossRef]
- Stewart, C.; Hessami, M.A. A study of methods of carbon dioxide capture and sequestration– the sustainability of a photosynthetic bioreactor approach. Energy Convers. Manag. 2005, 46, 403–420. [Google Scholar] [CrossRef]
- Bui, M.; Adjiman, C.S.; Bardow, A.; Anthony, E.J.; Boston, A.; Brown, S.; Paul, S.F.; Sabine, F.; Amparo, G.; Leigh, A.H.; et al. Carbon capture and storage (CCS): The way forward. Energy Environ. Sci. 2018, 11, 1062–1176. [Google Scholar] [CrossRef]
- Wang, L.; Yang, Y.; Shen, W.; Kong, X.; Li, P.; Yu, J.; Rodrigues, A.E. CO2 capture from flue gas in an existing coal-fired power plant by two successive pilot-scale VPSA units. Ind. Eng. Chem. Res. 2013, 52, 7947–7955. [Google Scholar] [CrossRef]
- Patil, M.; Vaidya, P.; Kenig, E. Bench-scale study for CO2 Capture using AMP/PZ/Water. Chem. Eng. Trans. 2018, 69, 163–168. [Google Scholar]
- Shen, C.; Liu, Z.; Li, P.; Yu, J. Two-stage VPSA process for CO2 capture from flue gas using activated carbon beads. Ind. Eng. Chem. Res. 2012, 51, 5011–5021. [Google Scholar] [CrossRef]
- Wang, L.; Liu, Z.; Li, P.; Wang, J.; Yu, J. CO2 capture from flue gas by two successive VPSA units using 13XAPG. Adsorption 2012, 18, 445–459. [Google Scholar] [CrossRef]
- Xiao, P.; Zhang, J.; Webley, P.; Li, G.; Singh, R.; Todd, R. Capture of CO2 from flue gas streams with zeolite 13X by vacuum-pressure swing adsorption. Adsorption 2008, 14, 575–582. [Google Scholar] [CrossRef]
- Alibolandi, M.; Sadrameli, S.M.; Rezaee, F.; Darian, J.T. Separation of CO2/N2 mixture by vacuum pressure swing adsorption (VPSA) using zeolite 13X type and carbon molecular sieve adsorbents. Heat Mass Transf. 2020, 56, 1985–1994. [Google Scholar] [CrossRef]
- Zhang, J.; Webley, P.A.; Xiao, P. Effect of process parameters on power requirements of vacuum swing adsorption technology for CO2 capture from flue gas. Energy Conv. Manag. 2008, 49, 346–356. [Google Scholar] [CrossRef]
- Zoelle, A.; Keairns, D.; Pinkerton, L.L.; Turner, M.J.; Woods, M.; Kuehn, N.; Shah, V.; Chou, V. Cost and Performance Baseline for Fossil Energy Plants Volume 1a: Bituminous Coal (PC) and Natural Gas to Electricity Revision; National Energy Technology Laboratory: Pittsburgh, PA, USA, 2015. [Google Scholar]
- Park, J.H.; Beum, B.T.; Kim, J.N.; Cho, S.H. Numerical analysis on the power consumption of the PSA process. Ind. Eng. Chem. Res. 2002, 41, 4122–4131. [Google Scholar] [CrossRef]
- Chou, C.T.; Chen, F.H.; Huang, Y.J.; Yang, H.S. Carbon dioxide capture and hydrogen purification from synthesis gas by pressure swing adsorption. Chem. Eng. Trans. 2013, 32, 1855–1860. [Google Scholar]
- Smith, J.M.; Ness, H.C. Introduction to Chemical Engineering Thermodynamics, 4th ed.; McGraw-Hill: Singapore, 1987. [Google Scholar]
- Wawrzyńczaka, D.; Majchrzak-Kucębaa, I.; Srokosza, K.; Kozaka, M. The pilot dual-reflux vacuum pressure swing adsorption unit for CO2 capture from flue gas. Sep. Pur. Technol. 2019, 209, 560–570. [Google Scholar] [CrossRef]
- McCabe, W.L.; Smith, J.C.; Harriott, P. Unit Operations of Chemical Engineering, 7th ed.; McGraw-Hill: New York, NY, USA, 2005. [Google Scholar]
- Montgomery, D.C. Design and Analysis of Experiments, 7th ed.; John Wiley & Sons Ltd.: Hoboken, NJ, USA, 2009. [Google Scholar]


Publisher’s Note: MDPI stays neutral with regard to jurisdictional claims in published maps and institutional affiliations. |
© 2021 by the authors. Licensee MDPI, Basel, Switzerland. This article is an open access article distributed under the terms and conditions of the Creative Commons Attribution (CC BY) license (https://creativecommons.org/licenses/by/4.0/).