1. Introduction
The recovery of biogas from agricultural residues, like manure and straw, is an acknowledged cost-effective greenhouse gases (GHG) mitigation technology for the agricultural sector, as reflected by several policies that exist throughout Europe [
1]. It is often emphasized that biogas plants constitute the most stable and environmentally friendly source of renewable energy [
2], enhancing economic development by constructing local supply chains [
3]. Moreover, unlike technology-intensive wind and solar energy, bioenergy deployment stimulates development, mobilizing national sectors with high employment per unit of output [
4]. Methane fermentation in biogas facilities can use various organic substrates originating from livestock and agri-food sector waste as well as energy crops and agricultural production waste. Since the majority of substrates for agricultural biogas production come from agricultural activities, the establishment of agricultural biogas plants (ABPs) provides an opportunity for multifunctional agriculture development [
5].
At the end of 2018, while 9.444 biogas plants were operating in Germany and over 400 in Czech Republic [
1,
2], only 96 plants were operational in Poland [
6]. Despite the high potential for biomass, Poland sees very few agricultural biogas plants constructed on its soil compared to neighboring countries. It is classified as a steadily dynamic EU country with regard to biogas growth [
7], even though the share of ABP in established electric power from renewable sources amounts approximately to a modest 1.2% [
8]. The installed power per biogas plant ranges from 0.08 to 2.4 MWel, on average 1.05 MWel per plant. The potential remains largely untapped and, as estimated by recent studies [
9], the number of plants to be commissioned by 2020 would not exceed 200. In addition, the reality reached at the end of 2020 was much lower amounted to 117 agricultural biogas plants only. The main reasons include legal barriers (unclear regulations on digestate, long and complex process of construction permit and connection to the grid), lack of technical information and consulting, organizational issues (weak downstream networks and social acceptance issues) and, last but not least, economic ones (low and unstable certificate values and feed-in prices). A recent report provided by Ecofys [
10] underlines that Poland would not accomplish its 2020 renewable energy target even under the most favorable scenario; thus, immediate action is necessary to provide further incentives for renewable energy. The draft document “Poland’s energy policy until 2040—strategy for the development of the fuel and energy sector” emphasizes the role of biogas not only in the field of energy generation but also in solving problems with waste and energy storage. The document underscores the growing importance of biogas obtained from bio-waste in the context of growing consumption, as well as stricter regulations concerning waste management, which gradually make it impossible to store bio-waste. Subsequent government planning documents recommend removing the major barriers to biogas energy development, including simplifying administrative procedures for investment in this sector and the condition of electricity transmission and distribution infrastructure.
The COVID-19 pandemic, due to its significant impact on production processes, may be a turning point in the discussion of necessary transformation towards reducing CO
2 emissions [
11]. Most countries affected by the COVID-19 pandemic experienced sharp declines in GDP in 2020 [
12]. The response at the EU level to the economic collapse caused by the COVID shock is the Recovery and Resilience Facility [
13]. According to the current findings, Poland, as the fourth largest beneficiary of this program, envisaging 672.5 billion euro in aid for the Member States, will have around 58.1 billion euro at its disposal by the end of 2026. The money will be distributed based on the National recovery and resilience plan [
14], which is expected to contribute to the four dimensions outlined in the 2021 Annual Sustainable Growth Strategy, that is, environmental sustainability, productivity, fairness and macroeconomic stability. The development of biogas plants is in the first dimension to the greatest extent, but it also meets the conditions allowing for classification into other dimensions. In the National Recovery and Resilience Plan project prepared by the Polish government as part of its component B “Green energy and reduction of energy intensity”, an increase in the use of renewable energy sources was indicated as a specific objective [
14]. The document assumes that by 2030 about 500 installations with a biomethane production volume of 2 million m
3 should be built. Due to the still limited possibilities of storing energy from renewable sources and the dependence of its production on weather conditions, biogas has a significant stabilizing function for the entire system and is a factor reducing the risk of blackout [
15]. Biogas, being a dispersed source of renewable energy, is also in line with the concept of shaping the new green industrial policy adjusted to regional economic circumstances [
16].
Numerous publications on biogas in Poland have tackled technological, environmental and market issues. At the national level, research published by Zubrzycka et al. [
9] and Piwowar et al. [
17] assess the state of play and perspectives of the sector, whereas special focus is given to the role of energy policy and the institutional dimension in its deployment [
5,
18] as well as to the contribution of the biogas to the abatement of GHG emissions [
19]. A recent overview [
8] pointed out the territorial diversity of agricultural biogas production in Poland, and the uneven distribution of facilities observed also in the Czech Republic where the sector is more developed, a fact related to natural and socio-economic factors [
20]. For this reason, attempts to study biogas progress and to estimate more precisely not only the theoretical and technical but also the economic/business potential require refining an analysis coming down at the regional scale. To our knowledge, two studies appear in the literature aiming at assessing biogas at the regional level in Poland. The first implements a techno-economic assessment supported by GIS of biogas production in the Kujawsko-Pomorskie voivodeship [
21]. The authors estimate that 41 biogas plants with a capacity between 180 to 2850 kW would fulfill the economic viability for expansion after legal regulations promoting biogas since 2010 under the conditions of financial stability. In 2018, there were still only six plants with a total electric power of 8 MWel in this voivodeship [
8]. The second study [
22] focuses on the Lubelskie province, one of the most rural regions in the country; after detailing the potential sources of substrates, it built scenarios by taking into consideration stakeholder adoption steps stretching from readily available feedstock to the gradual engagement of farms and full concerted actions of promotion. The projected number of plants was estimated to be seven in the year the paper was written (2014) to 40 at the horizon 2020 and to 440 after full deployment measures at the horizon 2035, moving from 25 towards 140 MWel of installed capacity. At the end of 2020, eight biogas plants were still operating in the Lubelskie province [
23]. The mode of biogas plants’ size was 1 MWel and the substrates they use comprise food industry by-products and waste, manure and silage maize.
As a matter of fact, the geographical distribution of substrates in Lubelskie observes a high dispersion [
24], and since the daily supply of the biogas plant has to be secured, this is an important element for location decisions. Although a large number of livestock farms in the region as well as manure disposal obligations avail abundant substrate, we include a dedicated crop and/or crop residues in the analysis as co-digestion with plant biomass improves the biogas production efficiency, especially in the case of pretreatment of biomass input [
25,
26]. On the other hand, plant biomass substrate even in small and medium ABPs concern numerous farmers in the vicinity, thus increasing the operation complexity and subsequent expenses. Manure provision offsets investment of the plant, whereas plant biomass of up to 30% in the feedstock composition increases sensitivity to the biomass price. However, it facilitates public acceptance, often a compelling reason for delay or even postponement of the development of ABP projects. The use of substrate from the food industry and retail chains can provide an additional cheap source and ensure a steady flow that presents an enormous potential in Poland. However, the use of diverse and sometimes controversial products, for example, fresh fruits and vegetables, as a substrate should be considered with caution [
27]. Moreover, consideration of food and food industry chain waste at the regional level for modeling purposes requires additional detailed information in a large spectrum that is beyond the scope of this study.
In addition to the geographical precision and the availability of detailed statistical farm data, the sound estimation of economic potential requires a recourse in the concept of profit under conditions of resource competition which is the ultimate motivating factor of the different actors of the chain, namely farmers and industrial partners. For this reason, to improve the predictive capacity of foresight studies, we opted for modeling decentralized decisions taking simultaneously into account the agricultural sector structure, the processing technology state-of-the-art and the institutional context. This is made possible through the use of optimization models that simulate market clearing to determine the equilibrium, derived by the intersection of supply and demand forces. The focus is the Lubelskie voivodeship, a Polish NUTS 2 (Nomenclature of Territorial Units for Statistics) region [
28], but the sector expansion is investigated at a finer level (LAU 2, which corresponds to administrative municipalities—gminas in Poland). The objective is to determine the optimal configuration of the biogas industry for alternative incentive scenarios (different set of parameters), to test the impact of different policy options on the sector at the municipal level.
The paper is organized into five sections. The next section presents the methodology describing the components of the modeling framework. Then, the case study is detailed with regard to manure availability, the selected dedicated crop, namely silage sorghum, the institutional context and the technological parameters assumptions. Results that refer to the biomass supply and the number, size, technology and geographical distribution of the biogas plants are illustrated numerically and graphically for different scenarios followed by a discussion and concluding remarks.
3. Case Study: Current Situation in the Lubelskie Province
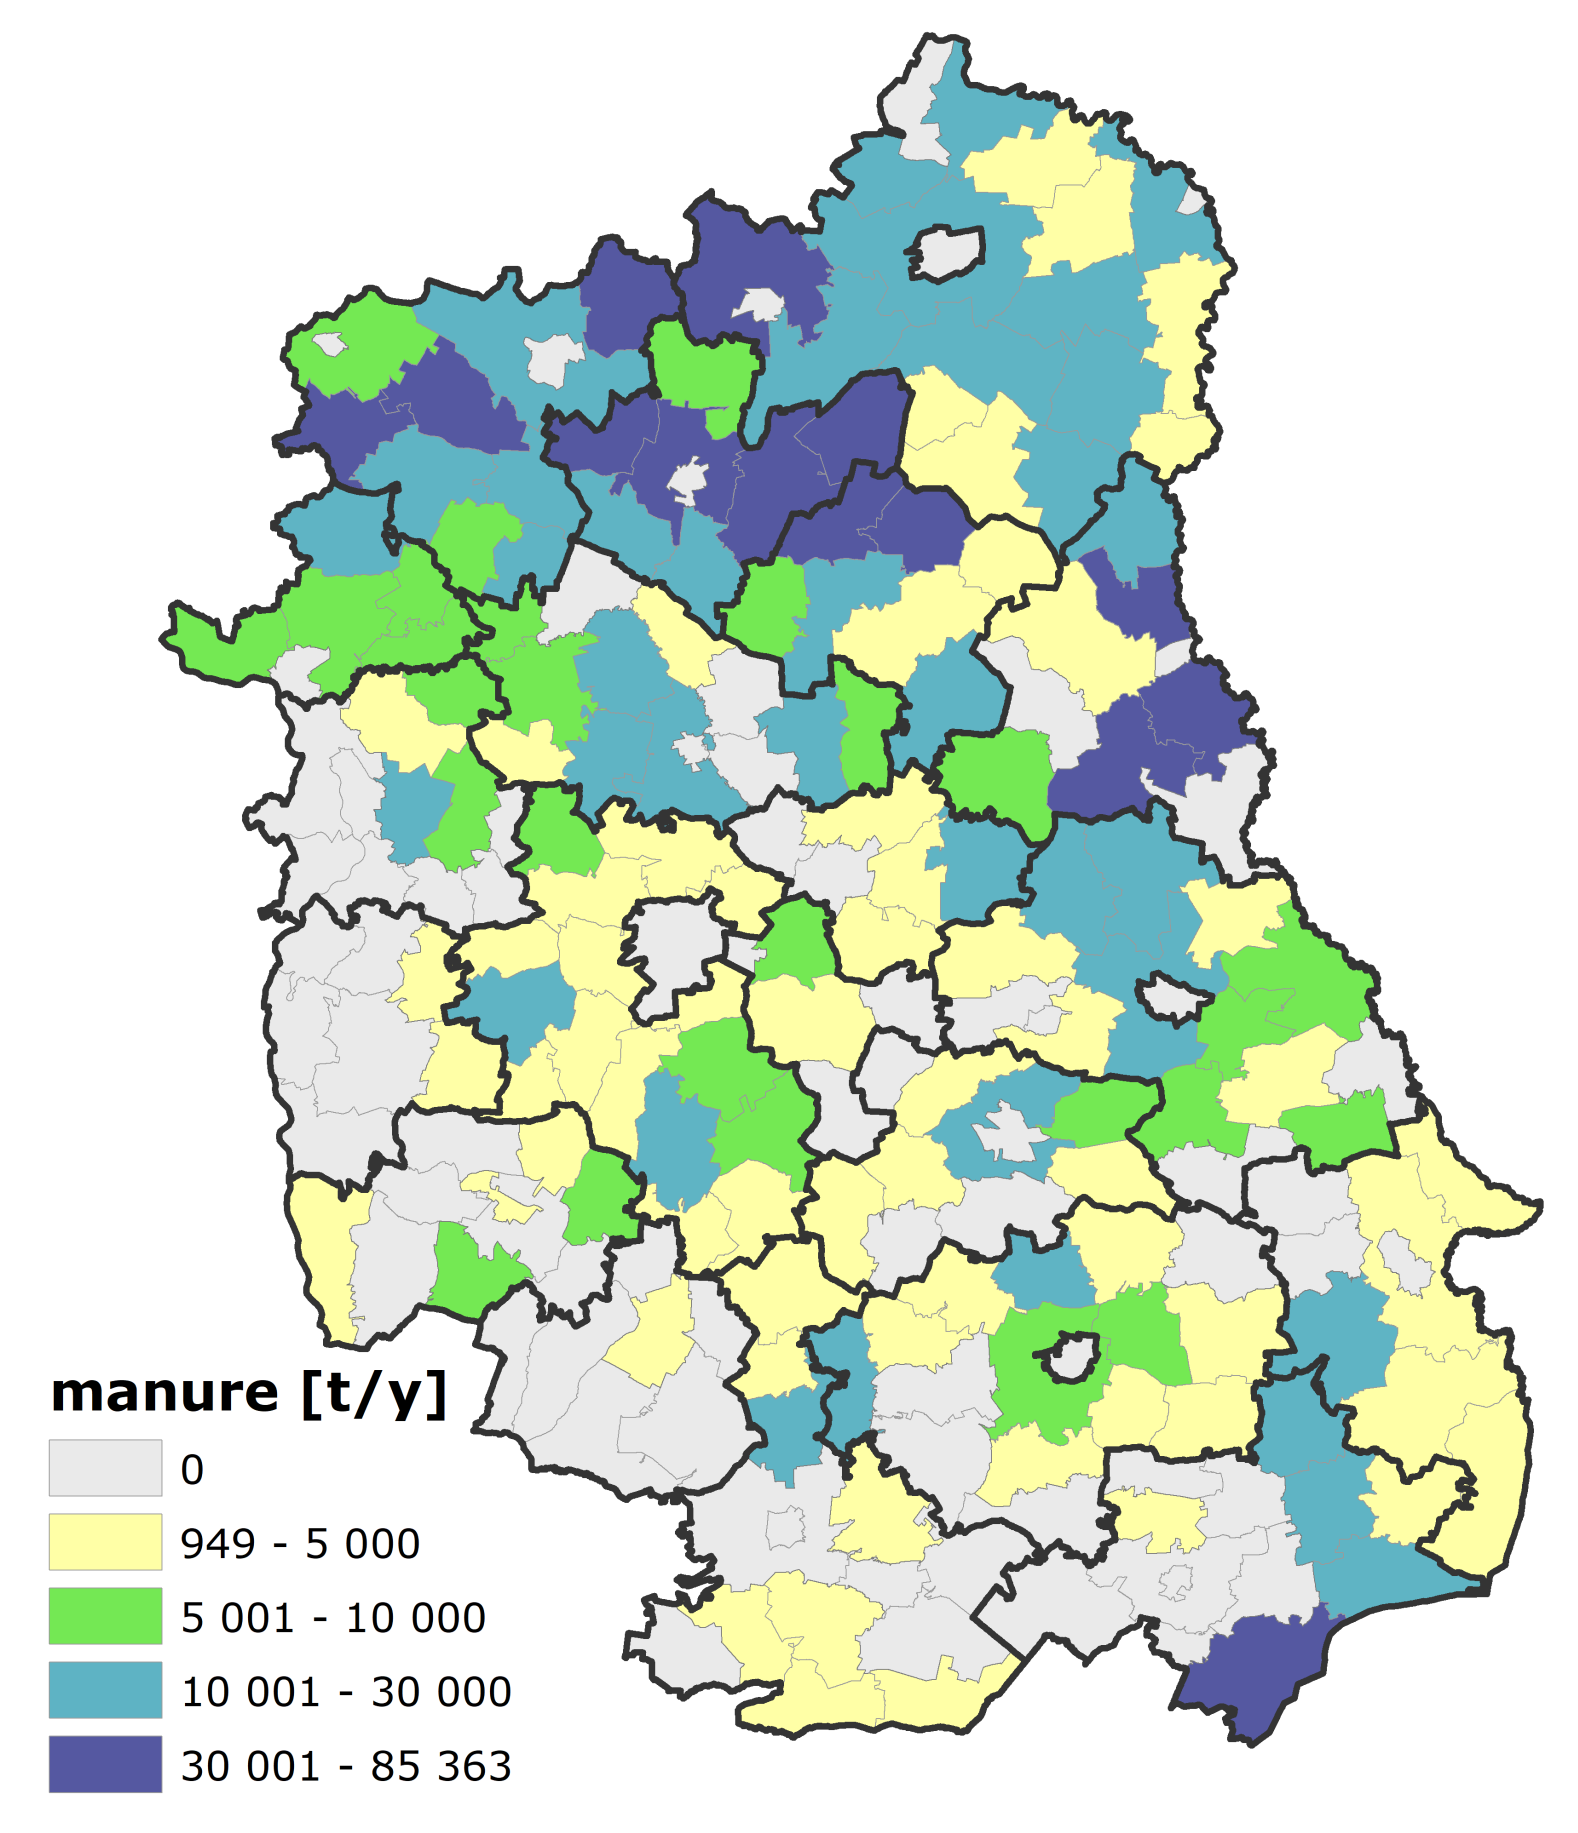
3.1. Manure Supply
We assume the manure and slurry from cattle and swine can be used for biogas fermentation. The data of the population of both kinds of livestock were analyzed at the farm level and then aggregated to the level of gminas (municipality). Data including farm-level livestock numbers (average value from 4 quarters during the year) and the utilized agricultural area in Lubelskie province in 2016 come from the database of the Agency for Restructuring and Modernization of Agriculture (ARMA) [
33]. The recorded number of farms having either cattle or pigs was 74,232 in Lubelskie in 2016.
Excreted manure was estimated based on the coefficients of manure output per livestock unit (LSU), which is derived from the literature and standards [
34]. The database provided the absolute number of cattle and pigs then normalized it in LSU. Although for each region, such coefficients should be chosen individually, there are studies that indicate 75% for cattle manure and 90% for pig manure [
35].
Table 2 presents the key characteristics of livestock farms in Lubelskie province and the coefficients used for calculating the manure supply.
Despite the high number of farms included in the database, only holdings (cattle or pig farms or both cattle and pig farms) with more than 50 LSU per year, that is about 1% of all livestock producers in the Lubelskie province, were taken into account. As in Bartoli et al. [
23] we have excluded farms with less than 50 LSU because in this case, the more realistic assumption for manure management is its direct application at the field level. For small farms, handling manure to centralized biogas plants is not profitable, due to loading and unloading cost and their limited surplus of manure available for biogas production. At the same time, we do not take into account micro-biogas plants (<130 kWe), since we assumed that the related energy production is almost entirely devoted to self-consumption at the farm level. The availability of manure calculated under these assumptions is displayed in
Figure 1.
3.2. Sorghum as a Source for Substrate
Concerning substrates of plant origin, maize is the main crop used for biogas generation in leading countries such as Germany and Italy thanks to long experience on its cultivation with a variety of cultivars and their high productivity. However, this requires intensive use of agricultural resources such as water and fertilizers that may complicate maize cropping in certain circumstances, therefore, other options have been studied. Sorghum, a plant that originated from Africa, represents an interesting alternative extensively studied in Europe as an energy crop. While in Polish climatic conditions it cannot produce grain, sorghum can provide high yield of green matter with low soil, nutrient and water requirements. Its resilience to water shortages and drought that occurs frequently in recent years in Poland makes sorghum competitive to maize, which is highly vulnerable in the aforementioned conditions. The yield of sorghum obtained on medium- and poor-quality soils can reach up to 100 t/ha of green mass (equivalent of 20 t dry mass) and its energy value is similar to maize around 18 MJ/kg [
38]. Moreover, experimental results recently reported an outranking performance of sorghum cultivars compared to maize in Northern Poland [
39] regarding methane content and biogas productivity.
Sorghum can support substrate of manure from, i.e., a dairy farm, alternatively sorghum and maize mix can be used. Agostini et al. [
40] performed a detailed cost analysis with field data and literature sources. Under certain conditions (i.e., co-digestion of manure with at most 30% of sorghum, no-till, and regarding processing gas-tight tanks for digestate storage) evidence is provided both for GHG emission savings (in comparison to the Italian electricity mix) and profit for economic operators in the Po valley in Italy. It is noted that both economic and environmental performance are improved by using sorghum as an input instead of maize [
40] though final accounting requires life-cycle assessment and consideration of local conditions [
41].
According to the literature [
38] and more recent pilot cultivation observations, sorghum can be an interesting option for Polish farmers and equivalent to maize regarding biogas performance [
39]. As we mentioned above, the sustainability sector relies on the use of manure at more than 70% and supplemented by plant biomass so as to achieve maximum efficiency for conversion to biogas. In fact, the main objective of the paper is to detail a modeling tool that can evaluate the supply of both livestock and plant biomass and also of a novel crop based on its shadow price (opportunity cost) generated by means of mathematical optimization of the whole farm plan. If agricultural research provides evidence suggesting more efficient alternative crops, the mathematical programming model can introduce them in the optimal crop mix instead of sorghum. The focus of the paper is to illustrate the use of an integrated modeling approach for assessing policy impacts on biogas rather than promoting a particular crop as the sole source of plant biomass supply.
Scenarios Setting in the Agricultural Sector
First, a baseline scenario is set up to assess the land use change between 2010 and 2030 in the Lubelskie province under the assumption of “business as usual”. The data sets used are extracted from Shu et al. [
42]. The scenario serves as a reference to analyze the spatial distribution of conventional crops as well as the composition of biomass provision from their residues. Since currently there is no large-scale commercial plantation of energy crops in this region, the scenario excludes the participation of energy crops. In other words, this is the validation test of the model as total farming welfare is maximized based on current parameters regarding yields, prices, subsidies, costs, input prices etc., then the optimal crop mix is compared to the observed crop mix for the base or past years.
Next, we proceed to simulate the deployment of sorghum cultivation at the expense of conventional crops in arable land and also in abandoned land. As discussed earlier, biomass production may put food security at risk directly and indirectly through land use change. As opposed to the methodology employed by Simon and Wiegmann [
43], which gives priority to food production, in our model, energy crops compete head-to-head with conventional crops for limited arable land resources. Common crop rotations are considered along with the assumption of a maximum market penetration of sorghum at 20% of arable land, typical for a new crop [
22]. Modeling the process by iterative optimization, we vary the contractual price of sorghum in increasing steps so as to quantitatively and plausibly depict the driving forces that prompt the dynamic introduction process in a relatively long time frame. Thus, we can translate a temporal progressive process into a spatial accumulative process (
Figure 2).
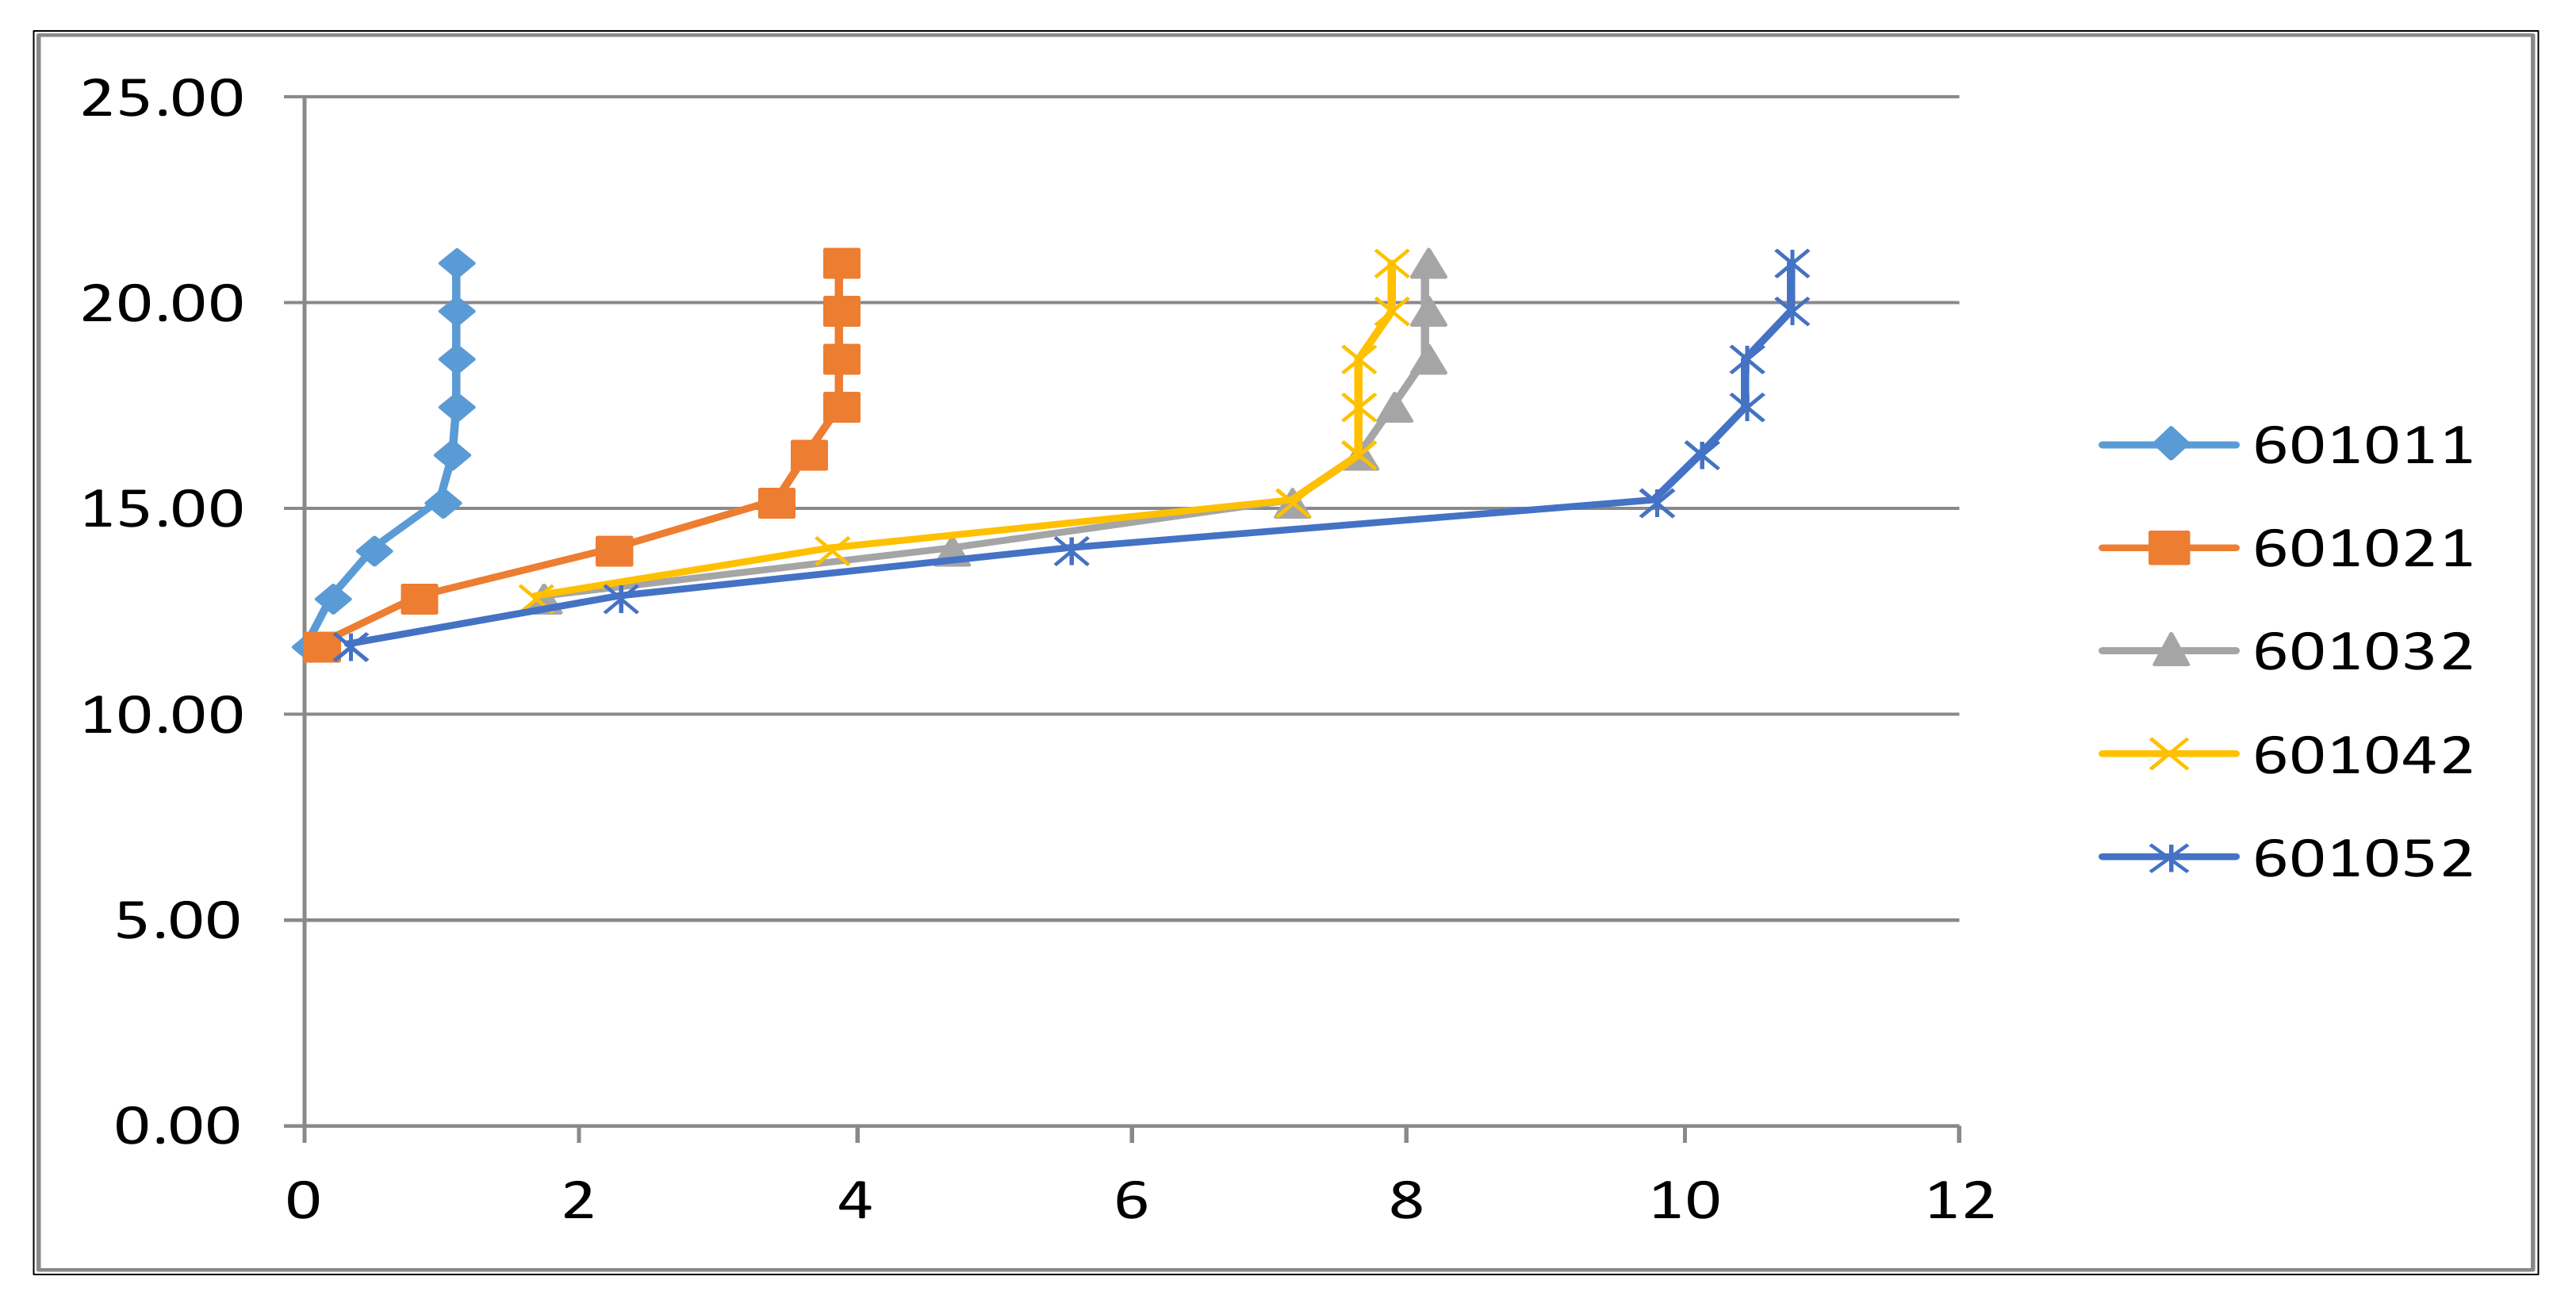
Figure 3 presents all observed pairs of biomass price and quantity generated in the iterative model resolution process. Energy crop cultivated area and subsequent quantities are distinguished by land quality. As a matter of fact, supply curves are separately presented with regard to arable land cultivated and unutilized/abandoned land (blue and red lines respectively). The aggregate supply curve (grey line in
Figure 3) is eventually considered by the integrated model for the market clearing process. Due to the overall cost of sorghum, no farmer cultivates until the market price moves to 8 €/ton. Sorghum adoption really takes off at prices beyond 11.6 €/t, since it jumps from 150 to 1695 thousand tons at the price of 12.8 €/t. The quantity supplied considerably increases until price level of 15 €/t, then it levels off and becomes limited to 5.5 M tons.
One would expect that the actual supply curve in abandoned land would provide cheaper sorghum silage than the one produced on arable land. It has to be taken into account that in the supply model, sorghum still competes with alternative crops which are not bounded by historical crop mix as in the utilized arable land. Abandoned land is mostly less fertile and in small parcels due to farm fragmentation, which may favor conventional crops [
44]. We present the land use change and the spatial composition of biomass supply to dynamically disclose the introduction of sorghum in the regional crop mix (illustrative map in
Figure 4).
3.3. The Industry: Current Conditions and Trends
According to the National Center for Agricultural Support (KOWR, 2021) 123 biogas plants operate in Poland with 10% higher capacity than 2 MWel, about 24% between 1 and 2 MWel, 53% between 1 MW and 0.5 MW and the rest are smaller than 500 kWel installed capacity. Several constructors and technology providers are mentioned, whereas agricultural biogas plant size varies from 20 kWel to 2.5 MWel with the average size at 1.2 MWel. The technical and economic parameters vary, depending on the plant size range, as well as their main characteristics. Typically, a 0.5 MWel cogeneration unit using an ICE (Internal Combustion Engine) and operating 7500 h per year achieves 38% electrical efficiency and a total of 75% thermal. A further literature review indicates capacities of 150 kWel for small-sized units, 500 kWel for medium, and 1000–2000 kWel for large ones [
22,
30,
45,
46]. The highlighted technology for biogas from agricultural biomass from conventional farming is the CHP (combined heat and electricity production) in a co-generation process. The dominant CHP technology is ICE for the biogas produced after mesophilic AD (Anaerobic Digestion) and thus, this is the main technology investigated. To evaluate recent technologies, one can also account MGT (Micro-Gas Turbines), as a market-available, commercially tested and adopted, option.
Moreover, the Oil and Gas Institute of the National Research Institute of Poland (Biomethane project, 2014) issued a report about the agriculture biogas market actors in Poland as well, which concluded that the use of developed and proven technologies in countries like Germany, Austria etc. is crucial. At present, Poland has many domestic and experienced companies offering the construction of a biogas plant. While the investment costs for new installations are estimated to be at the level of 5 MEUR/MWel for smaller, and 3.8 MEUR/MWel for bigger plants [
22], we suggest a more detailed approach based on the allocation of the investment cost in (i) construction cost (ii) machinery/technique cost (iii) CHP cost (iv) planning and authorization cost and (v) maximum connection to the grid cost. Blumenstain et al. [
47] estimated the above costs for a 75, 250 and 500 kW electrical capacity, depending on the feeding regime and origin of the substrate. Our work has processed the numbers above and estimates a total investment cost for AD plants that differ in size (130, 250, 499, 999 and 2000 kWel) and CHP technology used (ICE), while the feeding regime is mixed (30% plant biomass and 70% manure feed based) following the rule of thumb, as mentioned in the literature (FNR, 2010), and the origin of the substrate is from conventional farming. Although the same energy conversion rates can be assumed to simplify the modeling process, we have used a more accurate relationship between the CHP size and technology. As shown by Delzeit et al. [
29] and Pöschl et al. [
3] the efficiency of a CHP changes with the engine’s size and technology. The planning and authorization costs, as well as the investment-related costs and repair and maintenance costs, are adapted from Blumenstein et al. [
47]. The operation and maintenance (O&M) and labor costs are estimated based on the assumption of the plant of 150 kWe capacity requiring 6–7 h/kWel labor input per year, 450 kWel capacity for 3–3.5 h/kWel per year, and 800 kWel capacity for 2.3–2.8 kWel per year [
48]. Lubricating oil cost is added to variable costs, and the insurance, book-keeping and other amount to the overhead costs. The grid connection agreement clearly states that the advance payment must not exceed the total costs of connection and must not exceed 3 M PLN (approx. 0.68 M EUR) [Art.7 par.8b Energy Law]. Priority is given to Renewable Energy Sources (RES) when it comes to the grid connection, and the operators of RES plants whose capacity does not exceed 5 MW only need to pay 50% of these costs [Art.3 No.20b Energy Law], so the maximum grid connection cost is estimated at the level of 341,468 EUR, which is a flat rate, regardless of the plant size and technology adopted.
Locations of biogas plants are primarily decided by the access to suitable substrates. Initially, agricultural biogas plants are built close to large livestock farms to gain easy access to the significant amount of manure and silage, even though there is also a growing interest for the locations close to a food processing source (such as sugar mills, distilleries, slaughterhouses, heat processing plants, fruit and vegetables processing plants, and dairy plants). The reason for the above-mentioned pattern is the ability to regularly acquire low-cost waste substrate, as a year-round guarantee receipt produced by the farm and/or the factory, which is crucial for the economics of the project. Excreted manure and slurry quantities are transported with the use of farm equipment (tractors, trailers) for the production of biogas. We adopt the delivery model described in Sefeedpari et al. [
34], where biogas production was assumed as a manure treatment method at no charge for the farmers, while the fermented digestate will be transported to farms for application in the fields (within approximate distance of 10 km).
3.4. Institutional Arrangements and Policy Context
The Green Investment Scheme provides loans and subsidies to co-finance all kinds of investment costs for biogas projects. In addition, the Infrastructure and Environment Operational Program (2014–2020) supports biogas plants with low emission technologies with 30%–50% of qualified expenses up to a ceiling of 40 M PLN (approx. 9.3 M EUR) per project, depending on the installed capacity. Smaller amounts are provided by the Rural Development Program in the context of non-farming income support up to 500,000 PLN (approx. 116 kEUR). The European Commission has found that the Polish scheme supporting high-efficiency co-generators of heat and power is state aid, but it complies with EU competition rules since it furthers efficient energy production.
According to the principles of the old certificate system, biogas plant operators do not have to reduce the support received for the energy they produce by the investment aid received earlier, including from EU subsidies. According to the National Action Plan for energy from RES released in 2010, a certificate system (green, yellow certificates) has been the main support measure resulting mainly in the introduction of wind and biomass plants. In the process of transition of the energy sector, legislative arrangement followed with the most important regulation adopted in 2015 (Act n. 478/2015 on Renewable Energy Sources) This act introduces new forms of support, namely the auctioning system to replace the certificates.
On 1 July 2016, the auction system was introduced, which assumed support for green energy producers divided into several auction baskets. After the government announced the auction for the purchase of a certain amount of green energy from a given basket, projects submitted to it with the most competitive prices will receive support in the form of a price for energy offered by investors, fixed for the period set by the Minister of Energy. The fixed energy price guaranteed by the auction is to be granted to the investor for 15 years from the start of production and will be increased every year by the inflation rate. A rule of public accumulation was introduced that reduces operating aid which the investor applies for in the auction in the form of a guaranteed price for energy, taking into account the premium over the market price, for all the previously received investment aid—e.g., EU subsidy. The RES Act imposes an obligation on the producer to account for the amount of energy specified in the offer during the full 3 calendar years, with a fine being imposed on the producer that failed to deliver at least 85% of the amount specified in the offer.
Under the above rules, the system operates as follows: a successful bid allows to feed the national energy grid at a fixed price to the companies offering the most attractive energy prices with the overall maximum amount determined by the central authorities on an annual basis. Regarding biogas reference prices corresponding to the maximum acceptable level of production, costs are distinguished to above and below 1 MWel installed capacity. RES Act has a special provision for the small producers as it requires that at least 25% of the volume allocated to auction was produced in installations of a capacity lower than 1 MWel. Unlike the first generation of biogas plants with average capacity of about 1.5 MWel, after 2015 modal installed capacity is set at 999 kWel. It is an outcome of the RES act dividing biogas installations into two groups up to and above 1 MWel. Price competition with large power units, which can offer a significantly lower price for energy due to relatively lower costs of its production, is confined in the second group higher than 1 MWel [
5]. Nevertheless, the agricultural biogas sector dynamics has slowed down due to a record-low price of green certificates (from May, 2016 < 0.0232 €/kWh_el) deteriorating profitability of the existing plants. Moreover, the auctioning system offers low reference prices for agricultural biogas whereas companies bear considerable market risk. Financial support for investment from European and national funds thus becomes of the utmost importance.
The amendment to the RES Act adopted by the government in mid-2019 was motivated by the intention to increase the amount of renewable energy generated in Poland in the context of an urgent attempt to meet the unfeasible commitments towards the EU concerning 2020 (i.e., 15% of total energy output to come from RES). The purpose of the amendment was to reduce the substitution fee and, as a result, the prices of property rights for the following years, to conduct subsequent RES auctions, and to strengthen the mechanism of guarantees of origin. The energy auctions organized in late 2019 were approved by the European Commission to extend the period for the disbursement of the 15-year support for successful installations under the RES auctions. The aforementioned amendment to the RES Act also enabled energy cooperatives to become prosumers with the right to obtain a discount for the energy supplied into the grid at the rate of 1 to 0.6.
The amendment to the RES Act from 2019 assumes that the beneficiaries of existing auctions for biogas plants, thanks to the new regulations, are to be able to switch to the feed in tariff FIT/FIP system with a properly raised price of 90% of the new reference price. There is also the option of settling in the auction system and requesting an appropriate balance adjustment, the value of which will be the difference of the reference price used for biogas plants generating electricity from cogeneration and those working without the possibility of combined energy production. In both cases, it will be necessary to meet the condition of using heat to enter a higher price. The proposed systems are much simpler than the auction system operating since 2016. These systems can be used by installations already functioning and using the certificate system, just planned to be launched, as well as installations that have received support under the auction system. The FIP (feed-in premium) market price subsidy system is dedicated to installations with an installed power of not less than 500 kWel and not more than 1 MWel. Under the system, the energy producer receives aid, which is equal to the difference between the price obtained and the fixed purchase price. The FIT (feed-in-tariff) guaranteed tariff system is, in turn, a dedicated system for micro-installations (below 500 kWel). It consists in ensuring a fixed purchase price (90% of the reference price regulated by the authority).
The institutional aspect of energy policy coordination at the ministerial level in Poland is set to change. As a result of the latest modification of November 2019, concerning the liquidation of the Ministry of Energy, these issues became the remit of the newly established Ministry of State Assets with its dedicated Renewable and Distributed Energy Department. The newly created Ministry of Climate will also support the development of renewable energy sources. Renewable energy auctions are organized by the Energy Regulatory Office. A significant change in the approach to the problem of increasing the share of RES in the energy balance is evidenced by the fact that the Office has planned the auction for December 2020. It will rank among the largest auctions worldwide and the largest one for onshore wind energy in Europe, with about 2.5 GWel of new capacity. Investors will receive a guaranteed rate for the energy produced for 15 years. In this context, we summarized all the above in two scenarios, namely the current incentive scheme of prices determined through auctions (Scenario 2) and the previous one based on certificates and investment support (Scenario 1). These scenarios are detailed in the following section and they are resumed in
Table 3,
Table 4 and
Table 5.
3.5. Industry Assumptions and Profitability
Based on the technical, financial and economic information provided in the previous sub-sections, the Return on Investment (RoI) was calculated for both technologies, selected sizes and policy schemes. We set up two scenarios: the first one is representative of the green certificate system described in
Section 3.5 (Scenario 1) and the second one represents the auction system, updated with the current withdrawal tariffs (Scenario 2).
We calibrated both scenarios with technical coefficient provided by our test (Ecotechnologies Laboratory, Institute of Biosystems Engineering, Poznan University of Life Sciences) concerning: sorghum biomethane efficiency (79 m
3/Mg fresh mass); manure biomethane efficiency (45 m
3/Mg) and working efficiency of CHP unit 8100 MWh/MW installed. Biogas plants are assumed to be operating in cogeneration (i.e., the combined production of heat and power—CHP) and heat sold is assumed at max 600 GWh at a price of 40 €/MWh. Under Scenario 1 tariffs are set equal to 132 €/MWh for all sizes of agricultural biogas plants and technologies tested, but subsidies for the initial investment cost are take into account (50% of the total investment cost). Details for RoI calculation under Scenario 1 are illustrated in
Table 3, where the investment cost, volume of inputs, energy generated and digestate by-product, operating and net returns by installed capacity and technology are displayed. Under the auction system (Scenario 2) feed-in tariffs vary according to the biogas plants size, ranging from 130 €/MWh (2.000 kWel biogas plants size) to 159 €/MWh (130 kWel biogas plant size). Small biogas plants are, therefore, entitled to receive higher withdrawal for the energy produced. Details for RoI calculation under Scenario 2 are illustrated in
Table 4.
Return on Investment after all cost items but biomass expense is defined as RoI-1. It is introduced as a parameter to the industry model in order to launch the process of demand curve estimation. As explained in
Section 2.2, each candidate industry configuration considers the cheapest biomass available adjusting RoI-1 by deducing biomass input cost, thus calculating net Return on Investment denoted as RoI-2 (last column in
Table 5 calculated for illustrative purposes assuming a silage sorghum cost of 10 €/t).
4. Results and Discussion: The Biogas Market Clearing Model
The demand and supply models described in
Section 2 run simultaneously with the same vector of sorghum silage prices. By doing so, on the one hand, the agricultural model provides the supply curve of sorghum and on the other hand, the sorghum and manure demand is generated from the industrial-biogas sector for different biomass price levels. Based on the number and the capacity of plants at each price level, biomass quantities processed can be estimated, deriving the demand curve for biomass with a negative slope as shown in
Figure 5, whose pattern obeys to the law of demand. In other words, for low biomass prices, a high number of biogas plants is likely profitable. As biomass available decreases, the agricultural biogas plants (ABPs) have to pay more to get the required input at prices that few can afford seeking higher prices and so on until no plant achieves profitability. The market clearing process results in equilibrium prices and quantities that are displayed by the intersection of supply and demand curves in each decision-making unit, in other words when the supply from the agricultural sector matches the demand from the industry (biogas sector).
The supply curve generated previously by the agricultural model is plotted against demand to determine the market equilibrium. The market clearing process takes place simultaneously determining equilibria in each DMU (gmina). For the sake of illustration, we pick, in
Table 6, observation for ten gminas. Each line contains data corresponding to one gmina (in column 1 code numbers from 060101 to 060210 gminas appear). In the first two columns (in yellow) quantity and price at the equilibrium, then in the next 3 columns the demand (curve), next the number of plants at the corresponding equilibrium point, and in the right part of the table, the supply (curve) at different price levels. Market clearing takes place in each DMU both for the units with installed plants and those that only provide biomass to the closest neighboring plants. To make this clear, we extract from
Table 6 values of sorghum demand and supply at corresponding prices shown in
Table 7. Market clearing determines the equilibrium at point (
q = 30848,
p = 14.91), that is also shown in
Figure 6, the coordinates of supply and demand curves intersection.
To get the full benefit of model specification and data richness, the model output can be spatially illustrated using GIS, localizing the simulated plants as well as the sorghum delivered quantities from the same gmina or the ones nearby. Price guarantee periods and investment subsidy assumptions differentiate between these scenarios, according to data and assumption displayed in
Table 3 and
Table 4. In the left map in
Figure 7 the biogas plants simulated at the equilibrium under scenario 1 are displayed. In total, 123 biogas plants are simulated in the whole region, whose total installed power reaches 39 MWel (
Table 8). On the right side are displayed results obtained under the actual auction system with separate auctions under and above 1 MWel, resulting in different feed-in prices. Even if tariffs per MWh have been increased by the government, the increase in a total number of simulated biogas plans is limited, as well as the total installed power in the region: 147 biogas plants are simulated in the whole region, whose total installed power is approximately 40 MWel. In the next section, these results are described in detail.
In
Table 8, results obtained under both scenarios at the equilibrium are displayed. As already anticipated in the previous section, shifting from Scenario 1 to Scenario 2, the increase in total number and power of simulated biogas plans is limited, nevertheless, the auction system presents more advantageous feed in tariffs for all typologies of biogas plants taken into account in this model exercise. This is computable to two factors: (i) subsidies for the initial investment cost have been abolished, so that the overall profitability of the system does not differ significantly between scenarios; (ii) the manure availability, that cannot be transported outside the gmina borders. The quantity of manure available is therefore a limiting factor for the establishment of biogas plants in each gmina under investigation. This explains the distribution of biogas plants at the equilibrium under Scenario 1: only one big (2000 kWel) biogas plant is simulated, notwithstanding presenting the higher level of efficiency in terms of Return on Investment (see
Table 3). However, shifting from Scenario 1 to Scenario 2 we can observe in any case the effects related to the introduction of the auction system, where medium-small biogas plants are prompt by higher feed-in tariffs (see
Table 4). The 250 kWel biogas plant size typology increased from 37 to 68, whereas 2000 kWel ABPs are not represented in any model interaction.
The shift concerns mostly the size and number of ABPs simulated; the overall installed power displayed at the equilibrium at the regional level is in line between scenarios (39,001 MWel under Scenario 1 and 40.281 under Scenario 2). Even if this result can be considered as a limitation for the biogas sector development, it must be highlighted that the centrality covered by manure counteracts the increase in energy crops prices due to the additional demand for biogas production: under both scenarios, the sorghum equilibrium price never exceeds 15€ per ton. These observations are in line with Bartoli et al. [
23], who described the Polish biogas sector as strictly related to manure and waste availability. The limited effects on sorghum prices are directly correlated with the combined effects of low tariffs, which prompt biogas production from manure, free of charge, as well as to the marginal amount of sorghum considered in the blend for biogas production. Other important reasons for the slow deployment of agricultural biogas in Poland as reported by commercial operators resume to (a) complicated procedures, (b) high investment expenditures related to the construction of installations, (c) lack of regulations of raw material market necessary to generate biogas, and (d) lack of reliable information in local society concerning agricultural biogas plants. Such reasons often withstand for theoretically profitable projects to take place. Flexibility in policy measures may influence their adoption, so it is important to be able to estimate critical levels of system parameters. In other words, it is important to determine the most reasonable measure (i.e., minimum amount of subsidy) necessary to incite investment in biogas, because that increases chances for its acceptance by public authorities. This is a crucial piece of information to proponents of RES support because it relaxes budgetary constraints giving room to other governmental priorities, as such it has been the subject of quantitative analyses [
49,
50].
5. Conclusions
From the aforementioned issues deterring deployment, most are quantifiable so that investigation of impacts on i.e., acceleration of the administrative process, subsidized loans, direct subsidies to investment and regulations on pricing can be analyzed using appropriate models. With this work, we precisely aimed to set up a tool able to assess the effects of alternative energy policy schemes suitable to prompt biogas production in Poland. Applying a partial equilibrium approach to the case study of the Lubelskie province, we investigated the economic potential of the biogas co-digestion supply chain. By means of the supply-transport-demand integrated model we simultaneously evaluated the effect of incentives for investors as well as different regulations for biomass producers in the context of agricultural policy. Such a comparative static exercise allows dealing even with procedural and societal issues to trigger the development of the sector in terms of market outcomes. The results suggest that changes in policy objectives are followed by a shift in the simulated biogas plant typology, yielding different market equilibrium prices and quantities of feedstock delivered for biogas production. In so doing, we were also able to estimate the total biogas installable power (MWel) in the region and the related demand of land for energy corps dedicated for its production.
As shown under Scenario 2, current Polish policies are prompting medium-small biogas plants (250 kWel). Numerous analyses carried out in many countries indicated rather low profitability of agricultural biogas production, particularly in small farms [
19,
29,
51,
52]. One of the disadvantages of small biogas plants is the lack of economies of scale that can be achieved by larger projects [
53,
54]. Small biogas plants have some advantages which are particularly important from the point of view of sustainability, such as independence from fluctuations of biomass prices, simpler and less costly administrative procedures and securing the energy self-sufficiency of farms [
55,
56]. On the other hand, the logistics of big biogas plants usually requires transportation of substrates and products over long distances, which limits the positive impact of biogas on the reduction of GHG emissions [
57]. More favorable auction schemes with a budget earmarked for small capacities result in significantly higher prices that shift investments to smaller sizes of installed power towards farm level ABPs thus spreading the activity to many more sites in different municipalities. This analysis provides evidence to discuss the question of centralized versus de-centralized biogas industry, or broader issues such as the structural change in agriculture contributing to the relevant literature [
58,
59].
Further research can exploit model results to determine regional impacts in terms of agro-ecosystem services [
60]. One provisioning service, that is, bioenergy generation, is already estimated, whereas elements to assess the magnitude of three regulating services suggested by Tamburini et al. [
60] can be elaborated, namely (1) air quality improvement related to odors reduction, (2) regulation of soil nutrients and (3) global climate regulation. A critical issue on this latter concerns the competition between bio-energy and other agri-food supply chains resulting in additional GHGs emission due to indirect Land Use Change (iLUC). To explore thoroughly the maximum potential of the current biogas policy scheme in vigor in Poland, it would be necessary to extend the analysis to the whole country, limiting the utilization of dedicated crops competing with conventional ones cultivated for food. In addition, food waste from retailing chains, household and the food industry has to be considered as a potential substrate for biogas production to complete the picture. Suffice to say that it would maximize the possibility of the system to break down costs and carbon dioxide emissions improving economic and environmental sustainability, and for this reason further research efforts should focus on this aspect.


 ,
, 


