1. Introduction
Coronavirus disease (COVID-19) has become a global pandemic and has affected many aspects of life, including economic and social systems, health care, transportation, and the energy industry [
1,
2,
3]. A serious problem that has arisen in connection with the ongoing SARS-CoV-2 virus epidemic is the aspect of surface decontamination [
4,
5]. Surface disinfection has been recommended as one of the most effective means to combat the spread of the coronavirus (SARS-CoV-2) that causes coronavirus disease (COVID-19). Surface disinfection is particularly important because this virus can survive in places such as a door handle, table, or bench at a bus stop from 2 h to 9 days. These are average values, which are influenced by many external factors, including temperature or air humidity. The fact that the virus can survive outside the living organism makes it necessary to use effective disinfection. However, disinfection is connected with problems such as exposure of people to chemicals. This can happen when coming into contact with disinfected surfaces or during hand washing. Virucidal ingredients in these products include alcohols, quaternary ammonium salts, phenolic compounds, diols, and biguanides.
There are several methods of disinfecting rooms and flat surfaces: physical, chemical, and thermal-chemical. Physical disinfection of surfaces can be carried out with the use of steam at a temperature of 100–105 °C under reduced pressure or by means of UV rays with a wavelength of 256 nm. Chemical disinfection uses quaternary ammonium salts; ethyl alcohol and isopropyl alcohol; aldehydes such as formaldehyde and glutaraldehyde; phenols such as cresol and resorcinol; biguanides, especially chlordexidine; heavy metal compounds (e.g., silver, copper, and mercury); halogen compounds such as iodine, chloramine, and iodophores; crystal violet (dye); ethacridine lactate, i.e., the popular Rivanol; oxidants in the form of hydrogen peroxide (hydrogen peroxide H2O2); and permanganates. Chemical disinfection, however, does not eliminate all of the microbes. The thermal-chemical method combines the chemical method with the action of high temperature.
The most popular type of disinfection is based on the use of biocides [
6]. These are usually preparations based on alcohol, with a particular emphasis on the appropriate concentration of this component. The concentration of alcohol determines the effectiveness of the mixture. The strongest biocidal effect is demonstrated by water solutions of alcohols with a concentration of 60%–90%. The disadvantage of alcohols is their flammability, lower performance in the presence of organic dirt, and quick evaporation. Most of the available preparations require 1–10 min of contact with the surface to be fully effective. Rapid evaporation makes them ineffective in disinfecting large surfaces [
7]. The advantage of these preparations is, above all, their easy availability and low cost. In addition, many disinfectants, in addition to alcohol, include chlorine, formaldehyde, glutaraldehyde, ortho-phthalaldehyde, hydrogen peroxide, iodophors, peracetic acid, phenolics, and quaternary ammonium compounds [
8].
The effectiveness of disinfection processes depends on the surface onto which the disinfectant is dispensed. In the work [
9], an agent based on peracetic acid (PAA) was used for disinfection. The purpose of the disinfection was to remove the spores of
Geobacillus stearothermophilus. Disinfection was performed on anti-bacterial, oligodynamic copper and brass materials, and on stainless steel, aluminum, polyvinyl chloride, wood, and ceramics. In the case of stainless steel, aluminum, ceramics, and polyvinyl chloride, the disinfection of spores on a surface of 40 cm
2 was achieved with the use of 60 mL of the preparation per m
3. A 30% higher dose was needed to disinfect oligodynamic copper and brass materials. This is most likely due to the accelerated degradation of PAA in the case of these materials.
The effectiveness of a disinfectant depends on its structure. Porous materials such as wood have a great tendency to absorb the disinfectant, which can lead to incomplete coverage of the surface and thus insufficient disinfection. In the case of polymers that exhibit low surface energies, it is difficult to evenly distribute the disinfectant droplets, which may also result in insufficient disinfection. In rooms that additionally have antibacterial surfaces, it should be taken into account that these surfaces often consist of so-called oligodynamic metals. Such materials have the ability to self-disinfect, which is due to the emission of cations from their surfaces [
10].
The use of disinfectants in excessive amounts and in an inappropriate manner may result in negative effects, both directly on human health and on environmental risks [
11,
12]. Therefore, it is necessary to continuously search for optimal disinfectant compositions that allow for the ecological management of the waste they generate, and the use of an appropriate amount of the preparation in an appropriate, effective form [
13].
The coronavirus pandemic has forced the cleaning industry to simultaneously disseminate effective and relatively quick methods of disinfecting surfaces. The requirements of the application methods are to ensure personal safety without harmful effects on the cleaned spaces. One approach that meets these requirements is fogging. Foggers contribute to fighting viruses and bacteria on all types of surfaces. For a device of this type to fulfill its function, it should allow to obtain drops of the desired diameters, and the sprayed stream should have a defined range, allowing the preparation to reach places that are difficult to reach. Moreover, the desired effect is that the generated droplets achieve the same size distribution regardless of the distance from the atomizer. The production of a specific spray, which will be properly used, is related to obtaining the intended movement of the liquid [
14]. This will allow for the effective operation of the applied preparation, while maintaining its minimum consumption.
The work [
15] compares the efficiency of two devices—an electrostatic sprayer (SanoStatic) and a fogger (SanoFog) delivered by Sanondaf Malta (Sanoserv International Franchising Ltd., Naxxar, Malta). The disinfectant used was a 5% hydrogen peroxide solution with trace amounts of silver ions. Silver ions act as a stabilizer, simultaneously increasing the bactericidal effect of the disinfecting mixture. The fogger provides non-contact and uniform coverage of the surface with a disinfectant. The electrostatic sprayer allows the object to be surrounded with a spray, which is permanently deposited on the object’s surface, due to giving the mixture a negative electrostatic charge. The effectiveness of the disinfecting mixture against pathogens of
Enterococcus faecalis (vancomycin-resistant enterococci VRE: clinical isolate),
Klebsiella pneumoniae (extended-spectrum β-lactamase producer ESBL: ATCC 700,603—American Type Culture Collection),
K. pneumoniae (carbapenemase-producing Enterobacterales CPE: NCTC 13,438—National Collection of Type Cultures),
Staphylococcus aureus (Meticillin-resistant
Staphylococcus aureus MRSA: NCTC 12,493—National Collection of Type Cultures), and
Clostridioides difficile was analyzed. For pathogens
E. faecalis (VRE: clinical isolate),
K. pneumoniae (ESBL: ATCC 700603),
K. pneumoniae (CRE: NCTC 13438), and
S. aureus (MRSA: NCTC 12493), the bacterial count was reduced to undetectable levels using both devices. A fogger was found to be a better solution to combat the
C. difficile pathogen. However, the SanoSpray combined with the SanoFog provided the highest effectiveness.
Depending on the specific application, it is expected that the resulting aerosol will be characterized by droplets of a certain size and distribution. The finer the droplets, the better the spraying, because a larger total surface area can be obtained [
14,
16]. When describing the spraying process and in the sprayer design procedure, the mean droplet diameters are important. This concept was introduced for the purposes of the analysis of the jet forming process and the evaluation of the spraying effect. It is more advantageous to use a droplet with a constant diameter, characteristic of the given conditions, rather than a collection of droplets with various diameters. In the literature, several conventional droplet diameters are described that provide different information and are used for various applications [
17]. All of these can be expressed using the general formula:
where the
p and
q exponents are used simultaneously to denote a given diameter. The Sauter mean diameter is, by definition, the ratio of the third to the second moment of the probability density function:
or for any size distribution of discrete entities:
The literature also uses designations, e.g., Dv(10), Dv(50), Dv(90), which are the measured droplet diameters below which 10%, 50%, and 90% of the drop set volume can be found, respectively.
The aim of this study was to analyze the possibility of disinfecting surfaces using portable foggers, taking as an example the RY18FGA-0 battery fogger by RYOBI (TechTronic Industries, Kwai Chung, New Territories, Hong Kong). The volumetric and numerical distributions of the droplet diameters, and the values of the selected substitute diameters for the fogger, were determined depending on the filter used and the distance from the outlet of the device.
2. Materials and Methods
The object of the research was to characterize the generated spray jet by a commercial device, i.e., the RY18FGA-0 battery fogger by RYOBI.
Figure 1 presents a photo of the device.
The basic properties of the spray effect were determined, such as volume distributions of droplet diameters, numerical distributions of droplet diameters, and substitute values of mean droplet diameters. The measurements were made on a specially prepared test stand, the main element of which is an optical unit–the Spraytec droplet size analyzer by Malvern Instruments (Malvern, United Kingdom). In preparing the Spraytec particle size analyzer, a 300 mm lens was selected for the measurements, which is suitable for use with aerosols with diameters in the range 0.5–600 µm. The basic stage in carrying out the measurement process was the creation of a standard measurement procedure (SOP—Standard Operating Procedure Software by Malvern Instruments) [
18]. The continuous measurement mode was selected, with a data collection frequency of 1 Hz. The measurement duration was defined as 60 s. This was done on the basis of multiple observations of the test measurement, and 60 s is a time interval that allows for full stabilization of the measurement and reliable measurement data to be obtained. To ensure repeatability of the results, the samples were sprayed from a designated place, maintaining a constant distance of the aerosol from the measurement zone. The characteristic parameters were selected from the list of possible options and compared to fully characterize the spray. Measurements were repeated 10 times.
Figure 2 shows a diagram of the test stand.
Measurements were made at 3 different distances between the outlet of the tested device and the laser beam (x), which were 0.2, 0.5, and 1 m.
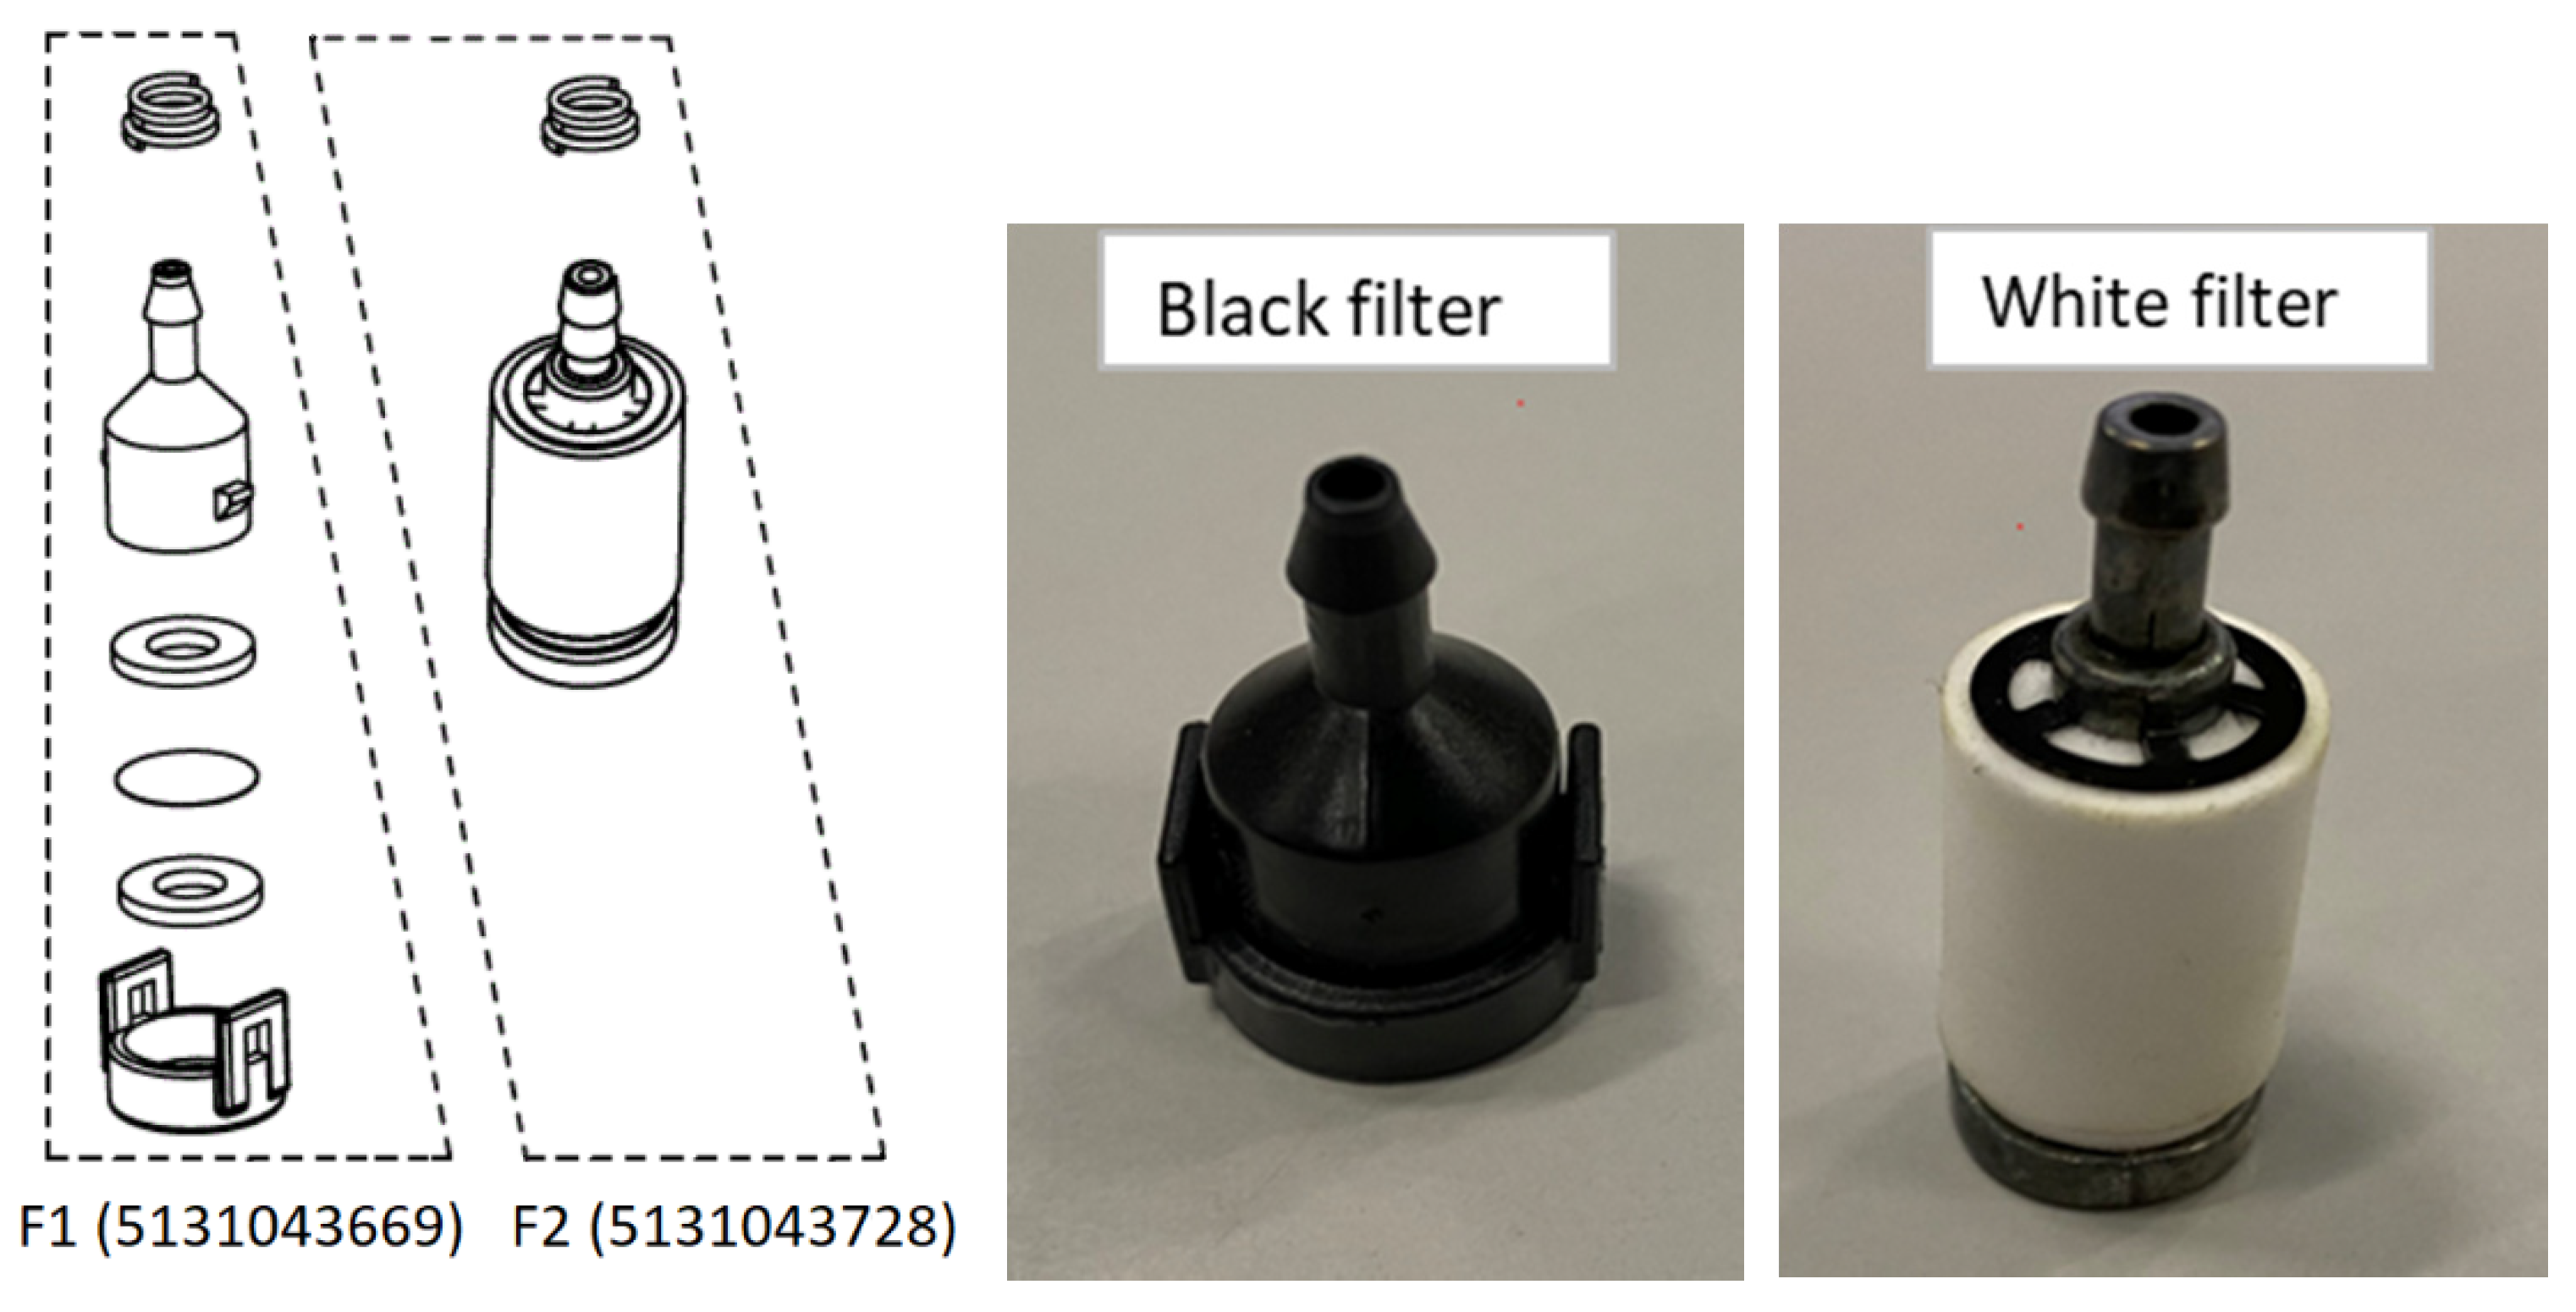
Two filters were used during the tests (
Figure 3): plastic (F1; black filter; part number 5131043669; materials: PC+PBT, FKM F170B, stainless steel) and ceramic (F2; white filter; part number 5131043728; materials: sintered porous, zinc alloy, carbon spring steel). The filter was located in the liquid tank and mounted with a clip on the hose carrying the liquid to the fogger spray system. The mass flow rate for the plastic filter (F1) was (4.81 ± 0.04) × 10
−3 kg/s and for the ceramic filter (F2) was (2.32 ± 0.02) × 10
−3 kg/s.
3. Results
To characterize the filters used, the pressure drop as a function of the volumetric flow rate was studied (
Figure 4). The spray medium was distilled water. To measure the pressure drop, the filter was immersed in the water tank to a depth of 10 cm. The probe for measuring the differential pressure was mounted downstream of the filter. The pressure was measured relative to the ambient pressure. Valves were used to control the flow. The rotameters VA40 produced by Krohne Messtechnik GmbH & Co KG (Duisburg, Germany) were used to measure the liquid flow rate. The pressure drop was measured using a digital pressure gauge DigiComb 1900 produced by Tecsis GmbH (Offenbach am Main, Germany).
As can be seen, in the case of the ceramic filter, the obtained pressure drop values were practically twice as high as those of the plastic filter. The flow resistance (pressure drop) increases with the decrease in the cumulative cross-section of the filter channels. The smaller cross-sectional area of the filter channels contributes to a lower flow rate of the liquid supplied to the atomization system. The less liquid in relation to the volumetric flow rate of the atomizing gas, the greater the kinetic energy of the gas per unit volume of the sprayed liquid. This results in a better breakup of the liquid jet into droplets, which directly affects the reduction in the size of droplets produced.
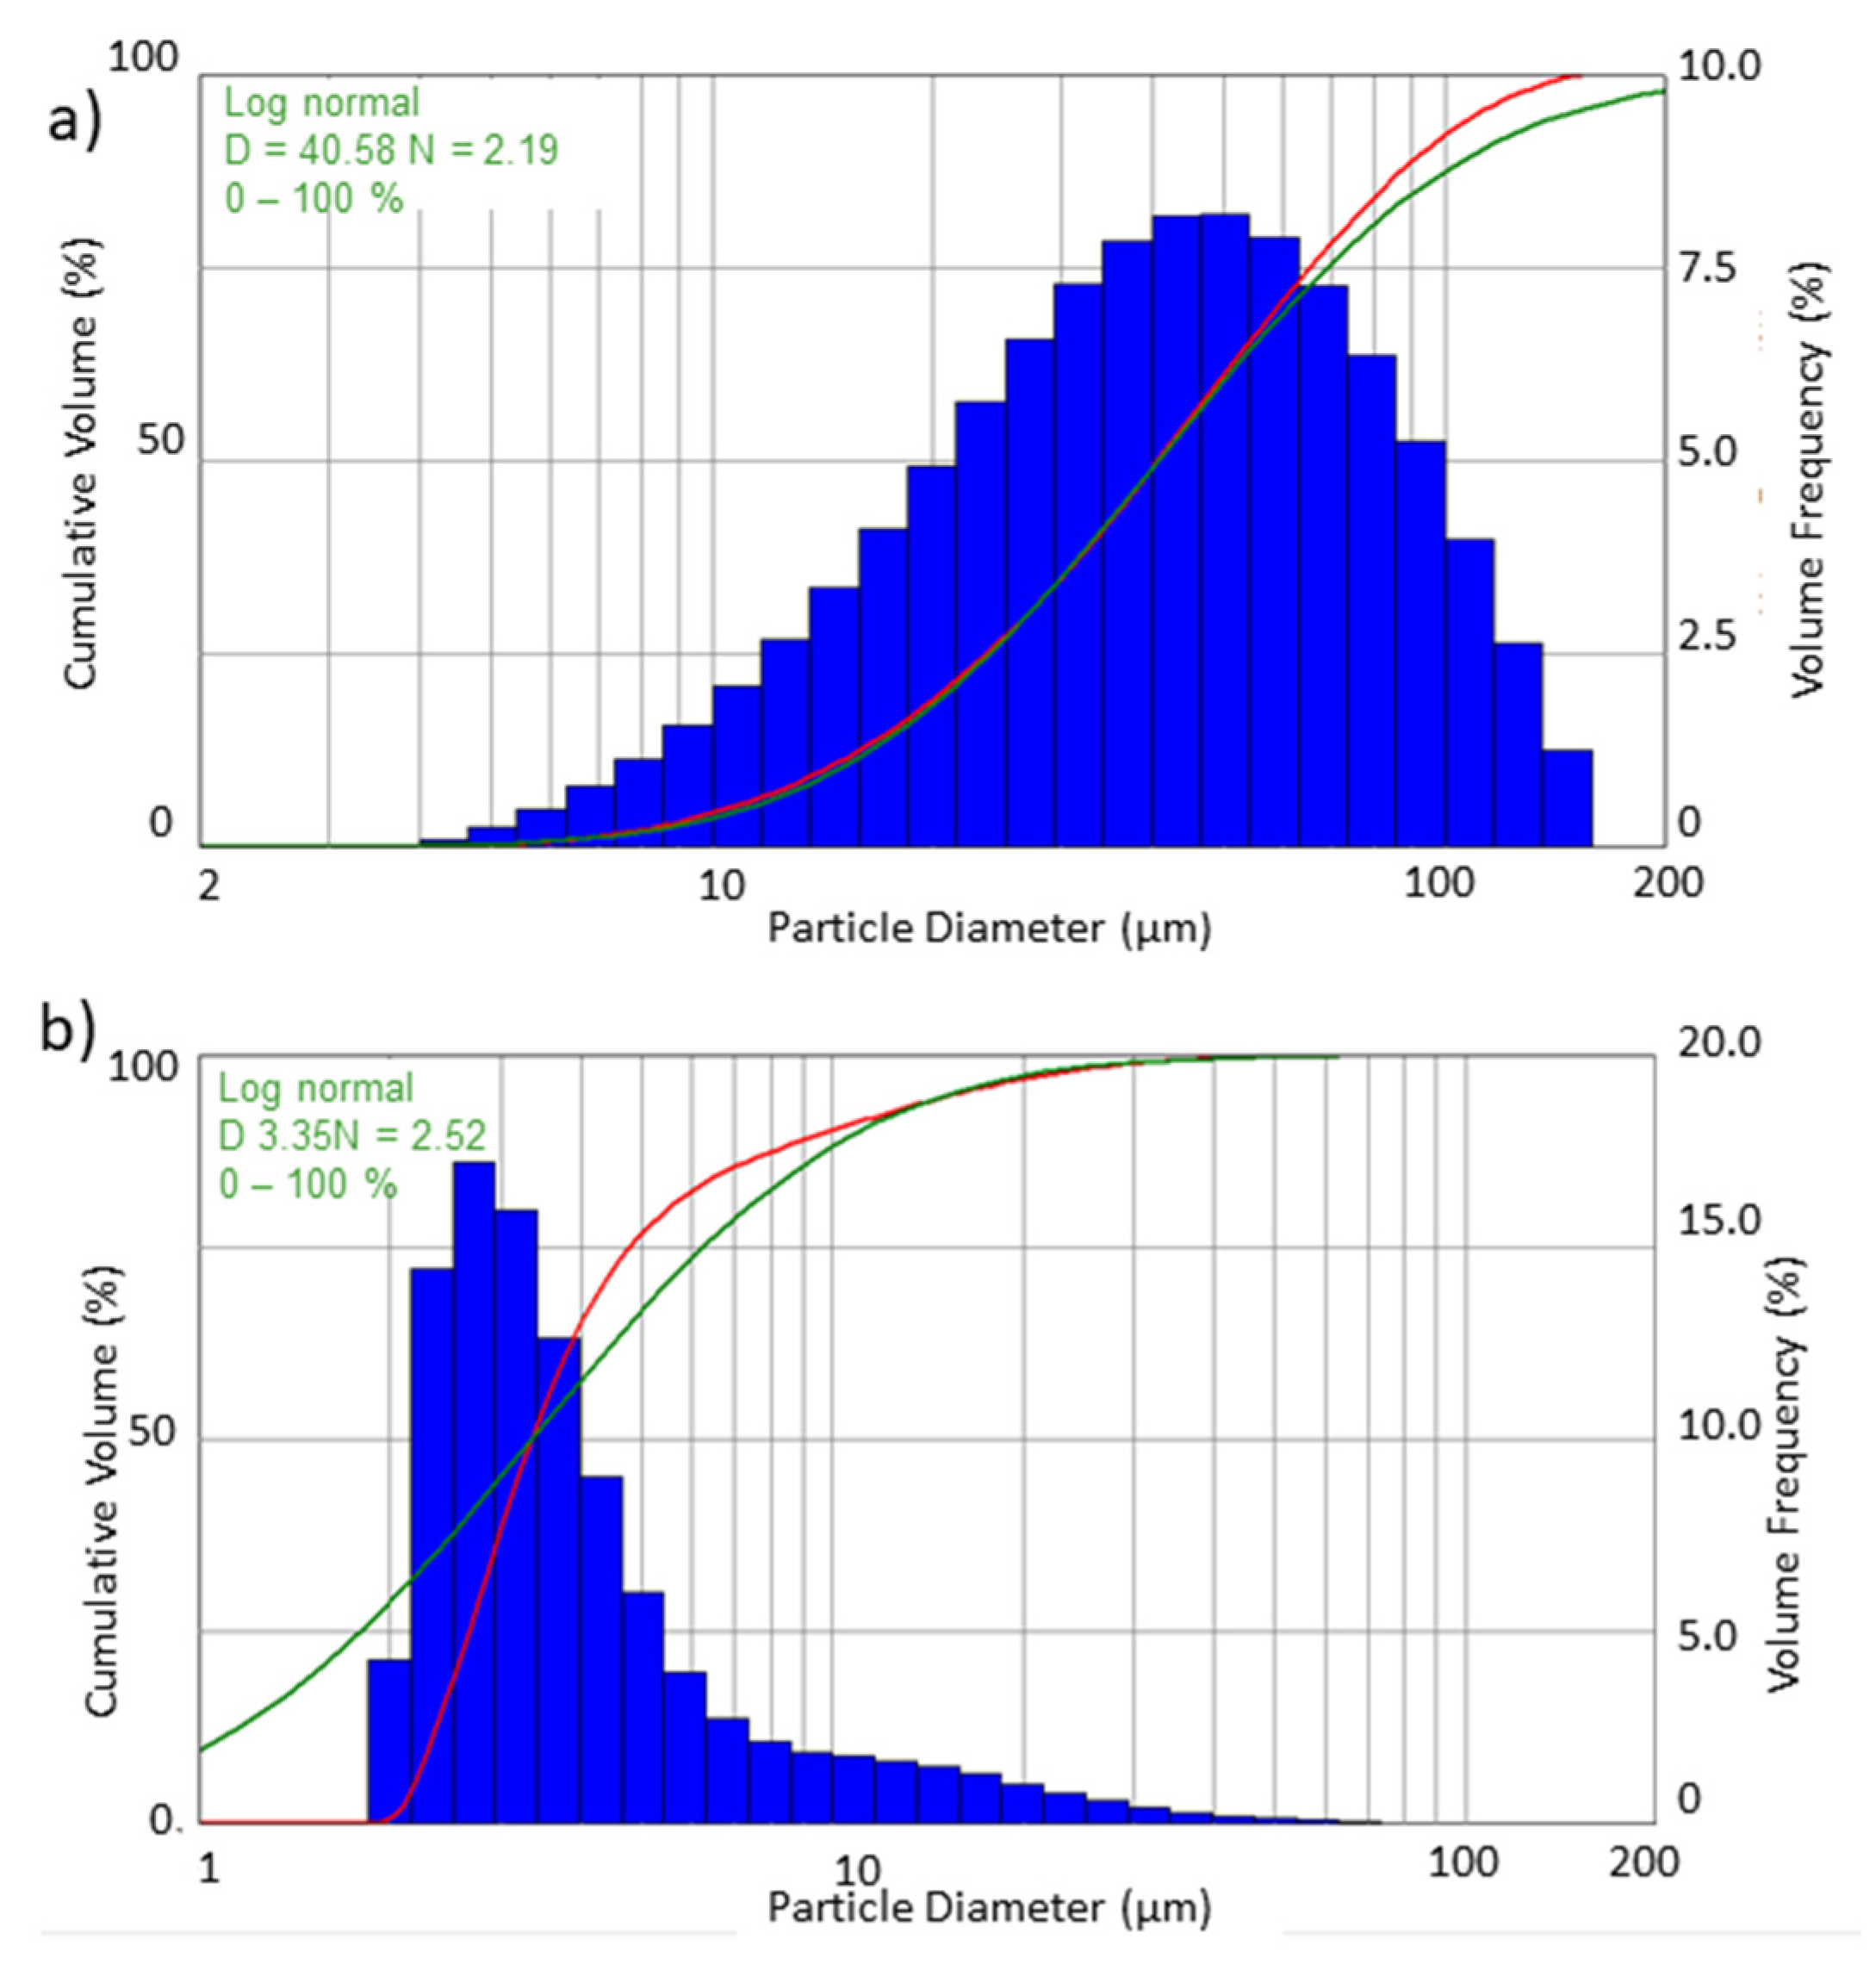
Histograms and cumulative curves were used to describe the droplet populations and their sizes in the sprayed stream of liquid.
Figure 5 and
Figure 6 present the volumetric and numerical distributions obtained when spraying water with the use of both filters.
In addition to the recorded droplet size distribution, the graphs also show the log-normal distribution used for the interpretation. For the log-normal distribution, the analysis provides the parameters of
D—geometric mean and
N—geometric deviation for this distribution. The equation for the log-normal distribution is as follows:
where:
F(
d) is the relative percentage of the dimension
d, and
x and
n are the characteristic dimension and width of the distribution, respectively. The cumulative distribution is the integral of
F(
d) [
16,
18].
The differences that can be observed between the volume and numerical distribution of the obtained droplet diameters result from the calculation methodology. Based on the graphs (
Figure 5 and
Figure 6) it can be determined that all of the recorded drops had a diameter less than 150 µm. A substantial numerical share had droplets with a diameter smaller than 10 µm. According to the presented numerical distribution, it can be seen that about 90% are drops with diameters of 2–10 µm.
Figure 7 shows the numerical distributions obtained when spraying water at a distance of 1 m for a plastic filter and a ceramic filter. On the basis of the presented dependencies, it can be observed that in both cases droplets with a diameter of up to 40 μm mainly occur. Above this value, only a few droplets are present. However, in the case of using a ceramic filter, a larger number of drops are present with a diameter of up to approx. 10 μm compared to a plastic filter. Furthermore, there are fewer droplets with diameters greater than 20 μm.
To determine the size of the formed droplets, measurements were also made using the microscopic method. The method of trapping the droplets on a flat surface was used. The method consists in trapping the droplets by placing a glass plate covered with an immersion liquid in the way of the liquid stream. Then the plate was placed under a Nikon Eclipse 50i microscope equipped with an OptaTech camera and a series of photos were taken using the MultiScanBase program from Computer Scanning Systems II. The methodology is described in detail in [
19].
Figure 8 shows sample photos from the analysis obtained while spraying the liquid at a distance of 1 m from the measuring point for the F1 and F2 filters. The resulting atomization effect is similar. For each tested filter, the number of drops with diameters in the range of 2–10 µm prevails.
The maximum measured droplet size was about 60 µm. The microscopic analysis also confirmed the lack of significant differences between the obtained atomization effect for the black and white filters.
Table 1 and
Table 2 summarize the values of the compared, characteristic sizes for the black and white filters, depending on the distance from the measuring beam in which the liquid was sprayed. It is shown that the Ryobi portable fogger enables continuous spraying with a range of up to 4.5 m. The basic mean droplet diameters [
16] were compared.
4. Conclusions
In this work, the influence of the filter and distance on the distribution of droplets in the spray stream, and the average drop diameter, were analyzed. The Ryobi portable fogger enables continuous spraying with a range of up to 4.5 m. It can be used to spray disinfectants, detergents, pesticides, insecticides, fungicides, etc. The main task of the filters is to filter the liquid fed to the atomizing system. In addition, the filters affect the liquid flow rate. The filters had different flow resistance and allowed droplets of different sizes to be obtained. The obtained spray is characterized by droplets with a diameter of about 30 µm, regardless of the distance from the outlet of the device, reaching all hard-to-reach places. Smaller values of mean droplet diameters were obtained for the plastic filter compared to the ceramic filter, at a distance of 0.2 m. However, when the liquid was sprayed at distances of 0.5 and 1 m, smaller mean diameters were obtained for the ceramic filter. For example, the value of Sauter mean diameter equaled 36.7 µm for a plastic filter and 31.8 µm for a ceramic filter, at a distance of 1 m. Furthermore, the microscopic size of the drops means that the sprayed surfaces were not wet after spraying. The lightweight design of the device allows easy movement around the decontaminated space (e.g., office). Regarding measures to address COVID-19, a better solution is to use a ceramic filter, which generates smaller droplets than a plastic filter. These experiments are important in the context of the COVID-19 virus, particularly in locations with remote or no permanent access to electricity, in which devices powered by a battery can be used.


 ,
, 


