Abstract
The building sector, as a major energy consumer with high direct and indirect CO2 emissions, plays a vital role in the fight against climate change. In order to make buildings more comfortable, functional, efficient and safe, building services are used. Therefore, building services are the key to decrease their contribution to climate change. Due to the lack of organized literature on this topic, this paper presents the first comprehensive assessment of trends in the literature on building services related to climate change, which was completed by conducting a bibliometric analysis of the existing literature on the topic. The ultimate goal is to provide a source where researchers and other interested parties can find this information in an organized manner. Results show that the most abundant and recent studies related to building services are based on improving energy efficiency by optimizing systems such as ventilation or lighting, the latter with the installation of LED lights. In addition, recent studies have focused on social factors such as housing and urban growth.
1. Introduction
Buildings have been identified as high energy consumers, as buildings and the building construction sectors account for more than 30% of the global final energy consumption and 40% of the total CO2 emissions, both direct and indirect [1]. However, at the same time, heating and cooling of buildings is one of the areas where there is a high potential to decrease energy consumption and CO2 emissions [2]. Heating and cooling are indeed clearly identified as energy-consuming building services. Nevertheless, building services other than these and other building energy services (e.g., lighting) should also be considered in order to have a holistic view of the real climate change mitigation potential of buildings.
Building services are the systems installed in buildings to make them more comfortable, functional, efficient, and safe [3]. Building services might include building control systems, energy distribution, and energy supply. This traditional description includes a classification of building services such as building management systems; energy generation, distribution and supply; escalators and lifts; facade engineering; fire safety, detection and protection; heating, air conditioning and air conditioning systems (HVAC); ICT networks; lighting; lighting protection; refrigeration; security and alarm systems; and water, drainage and plumbing.
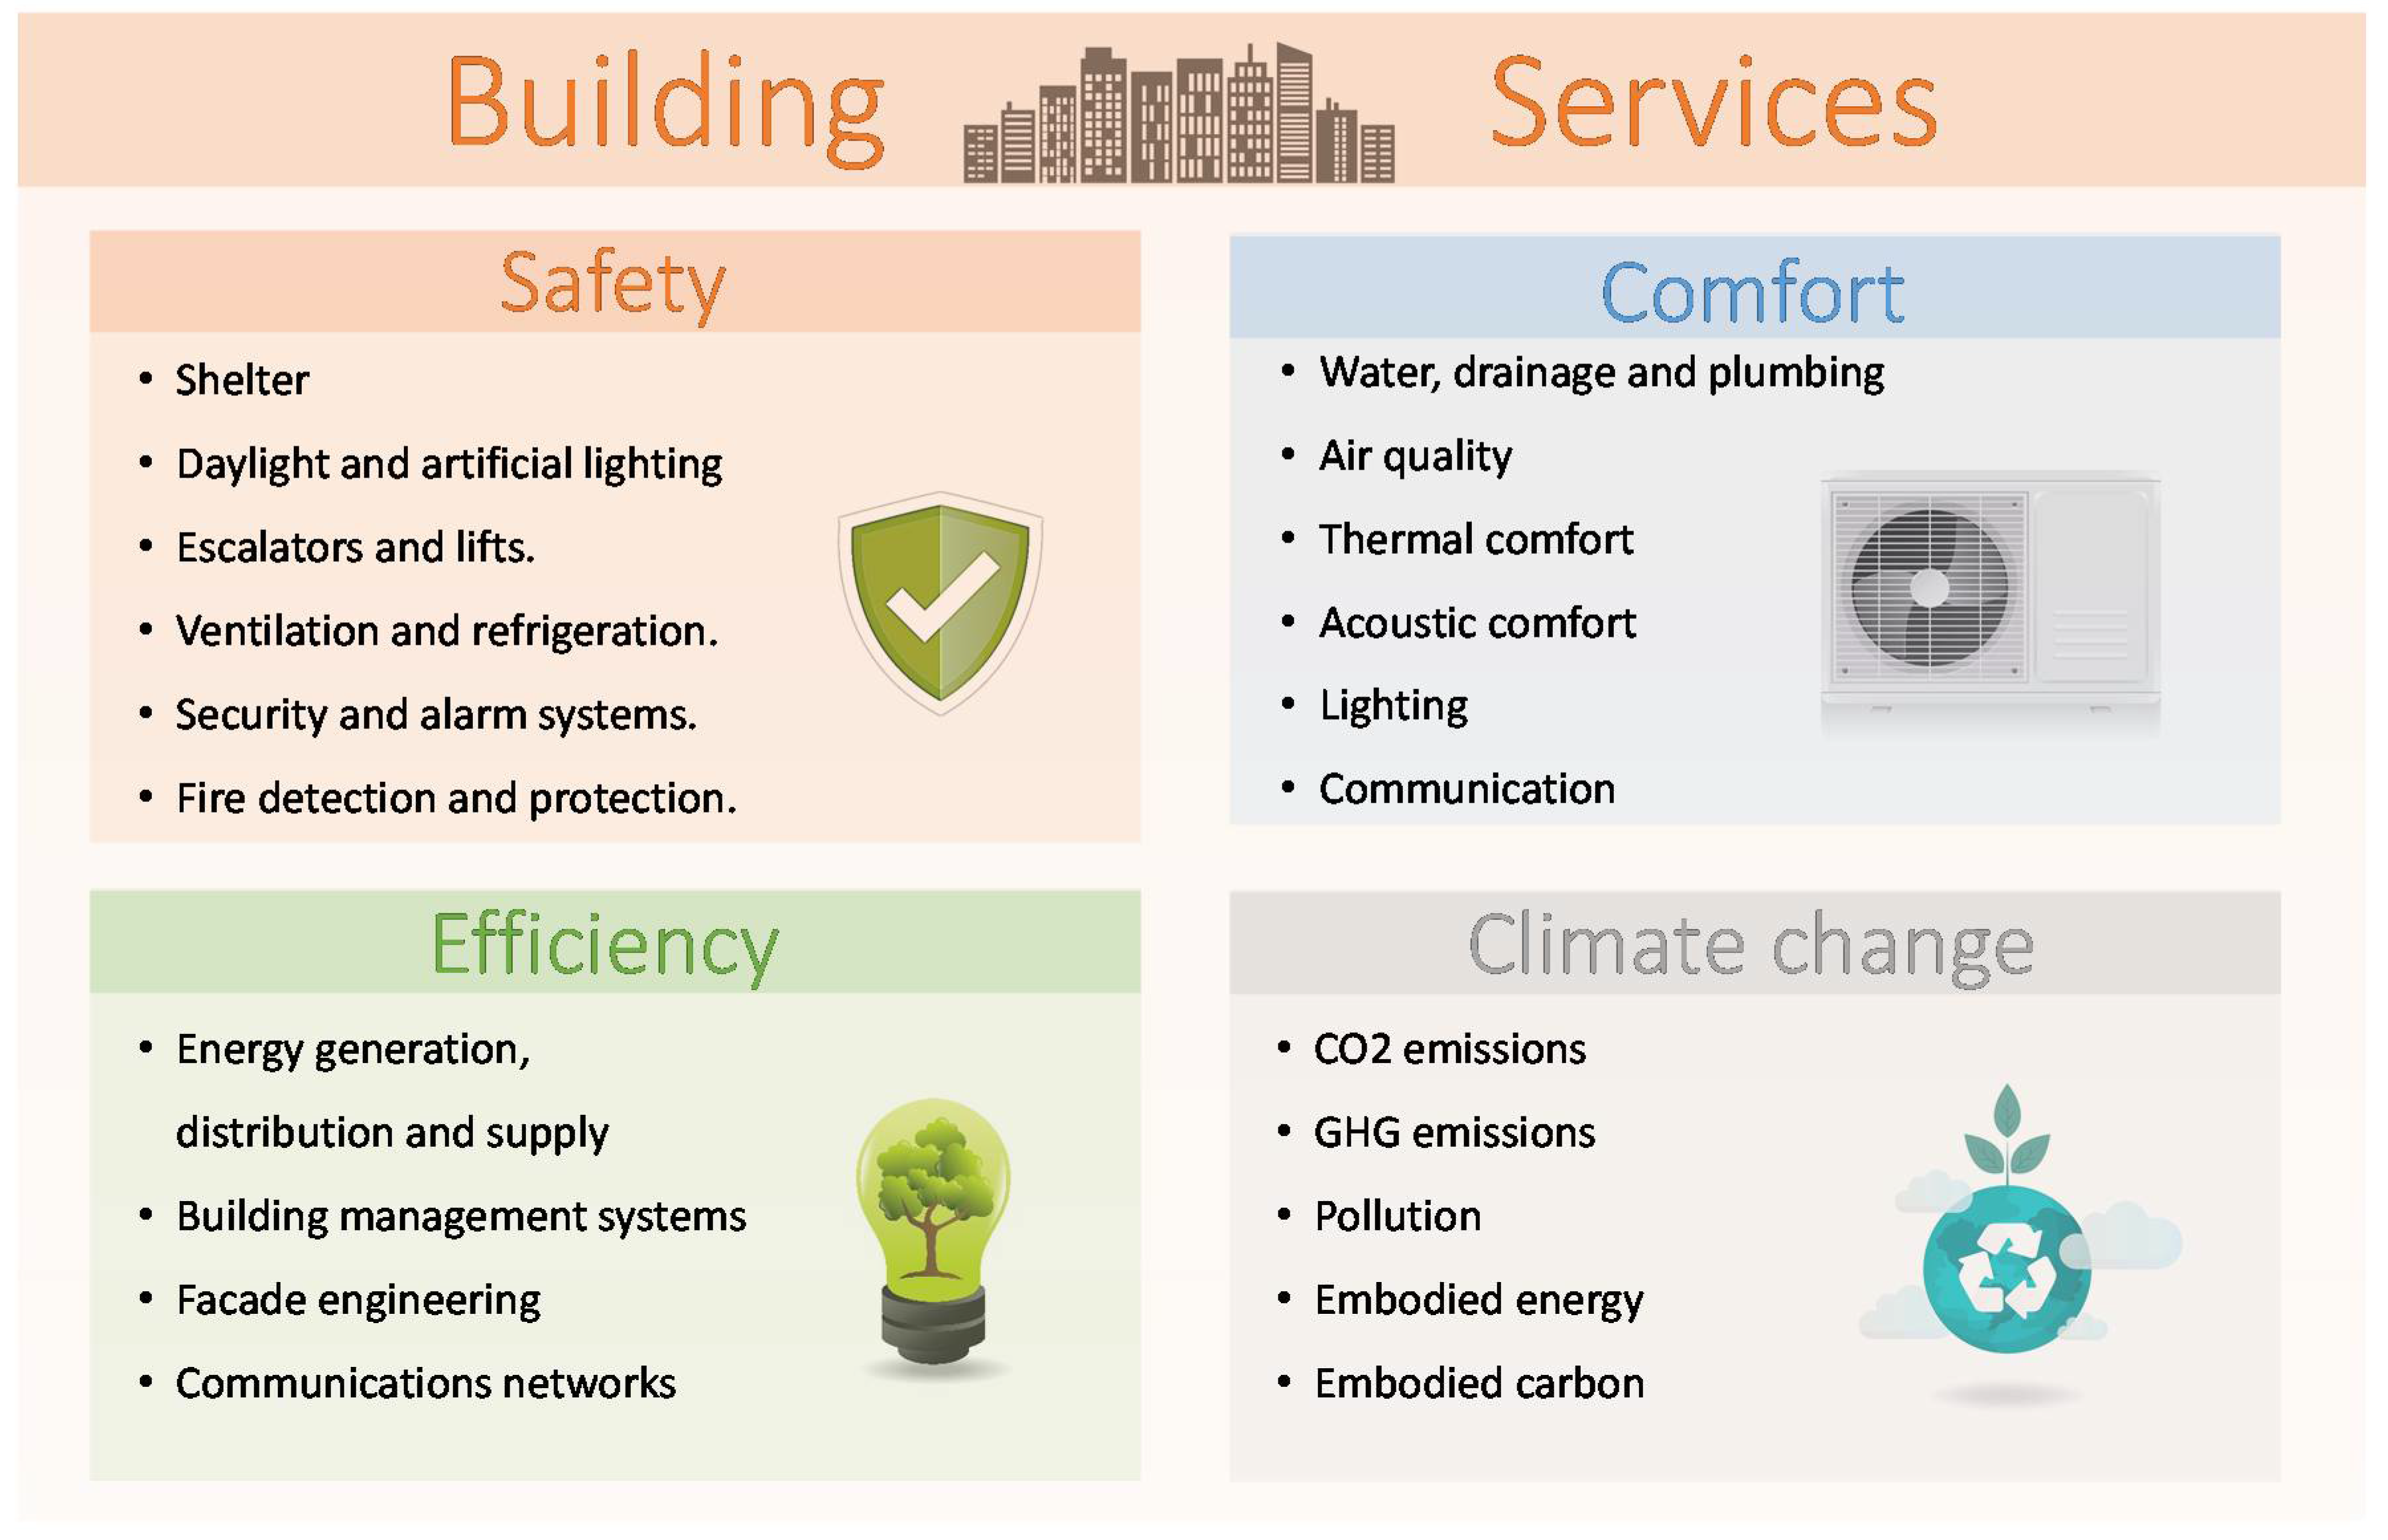
Another definition states that building services aim at achieving a safe and comfortable indoor environment whilst minimizing the environmental impact of a building [4]. Then, other concepts appear in the framework of building services, with wellbeing, circular economy, and climate change mitigation becoming increasingly important, such as air quality, thermal comfort, and acoustic comfort. However, a more holistic approach would also include terms such as shelter, cooking, materials, embodied energy and embodied carbon, CO2 emissions, GHG emissions, and pollution. Therefore, a potential classification of such building services could be the one presented in Figure 1. As it can be seen, building services have been classified into four types; safety-related services, comfort-related, services related to efficiency, and finally, services related to climate change. Within each type, different building services are included, among them are those known as building energy services [5] (i.e., thermal comfort, lighting, energy generation, building management systems).
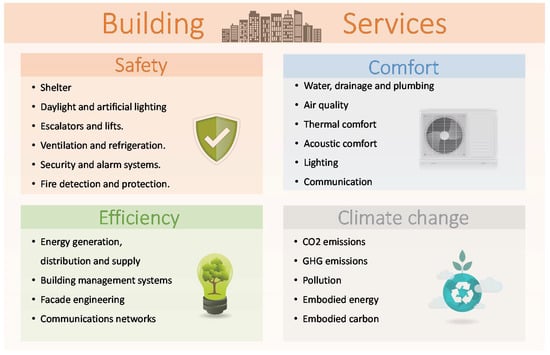
Figure 1.
Identified building services.
However, when assessing the literature to evaluate building services and their relation with climate change, the literature is scarce and very dispersed. Therefore, the aim of this paper is to fill this knowledge gap by performing a bibliometric analysis of the existing literature on the topic. In more detail, this paper includes a comprehensive assessment of trends of the literature on building services related to climate change to give a source where researchers and other interested stakeholders can find this information in an organized manner.
2. Methodology
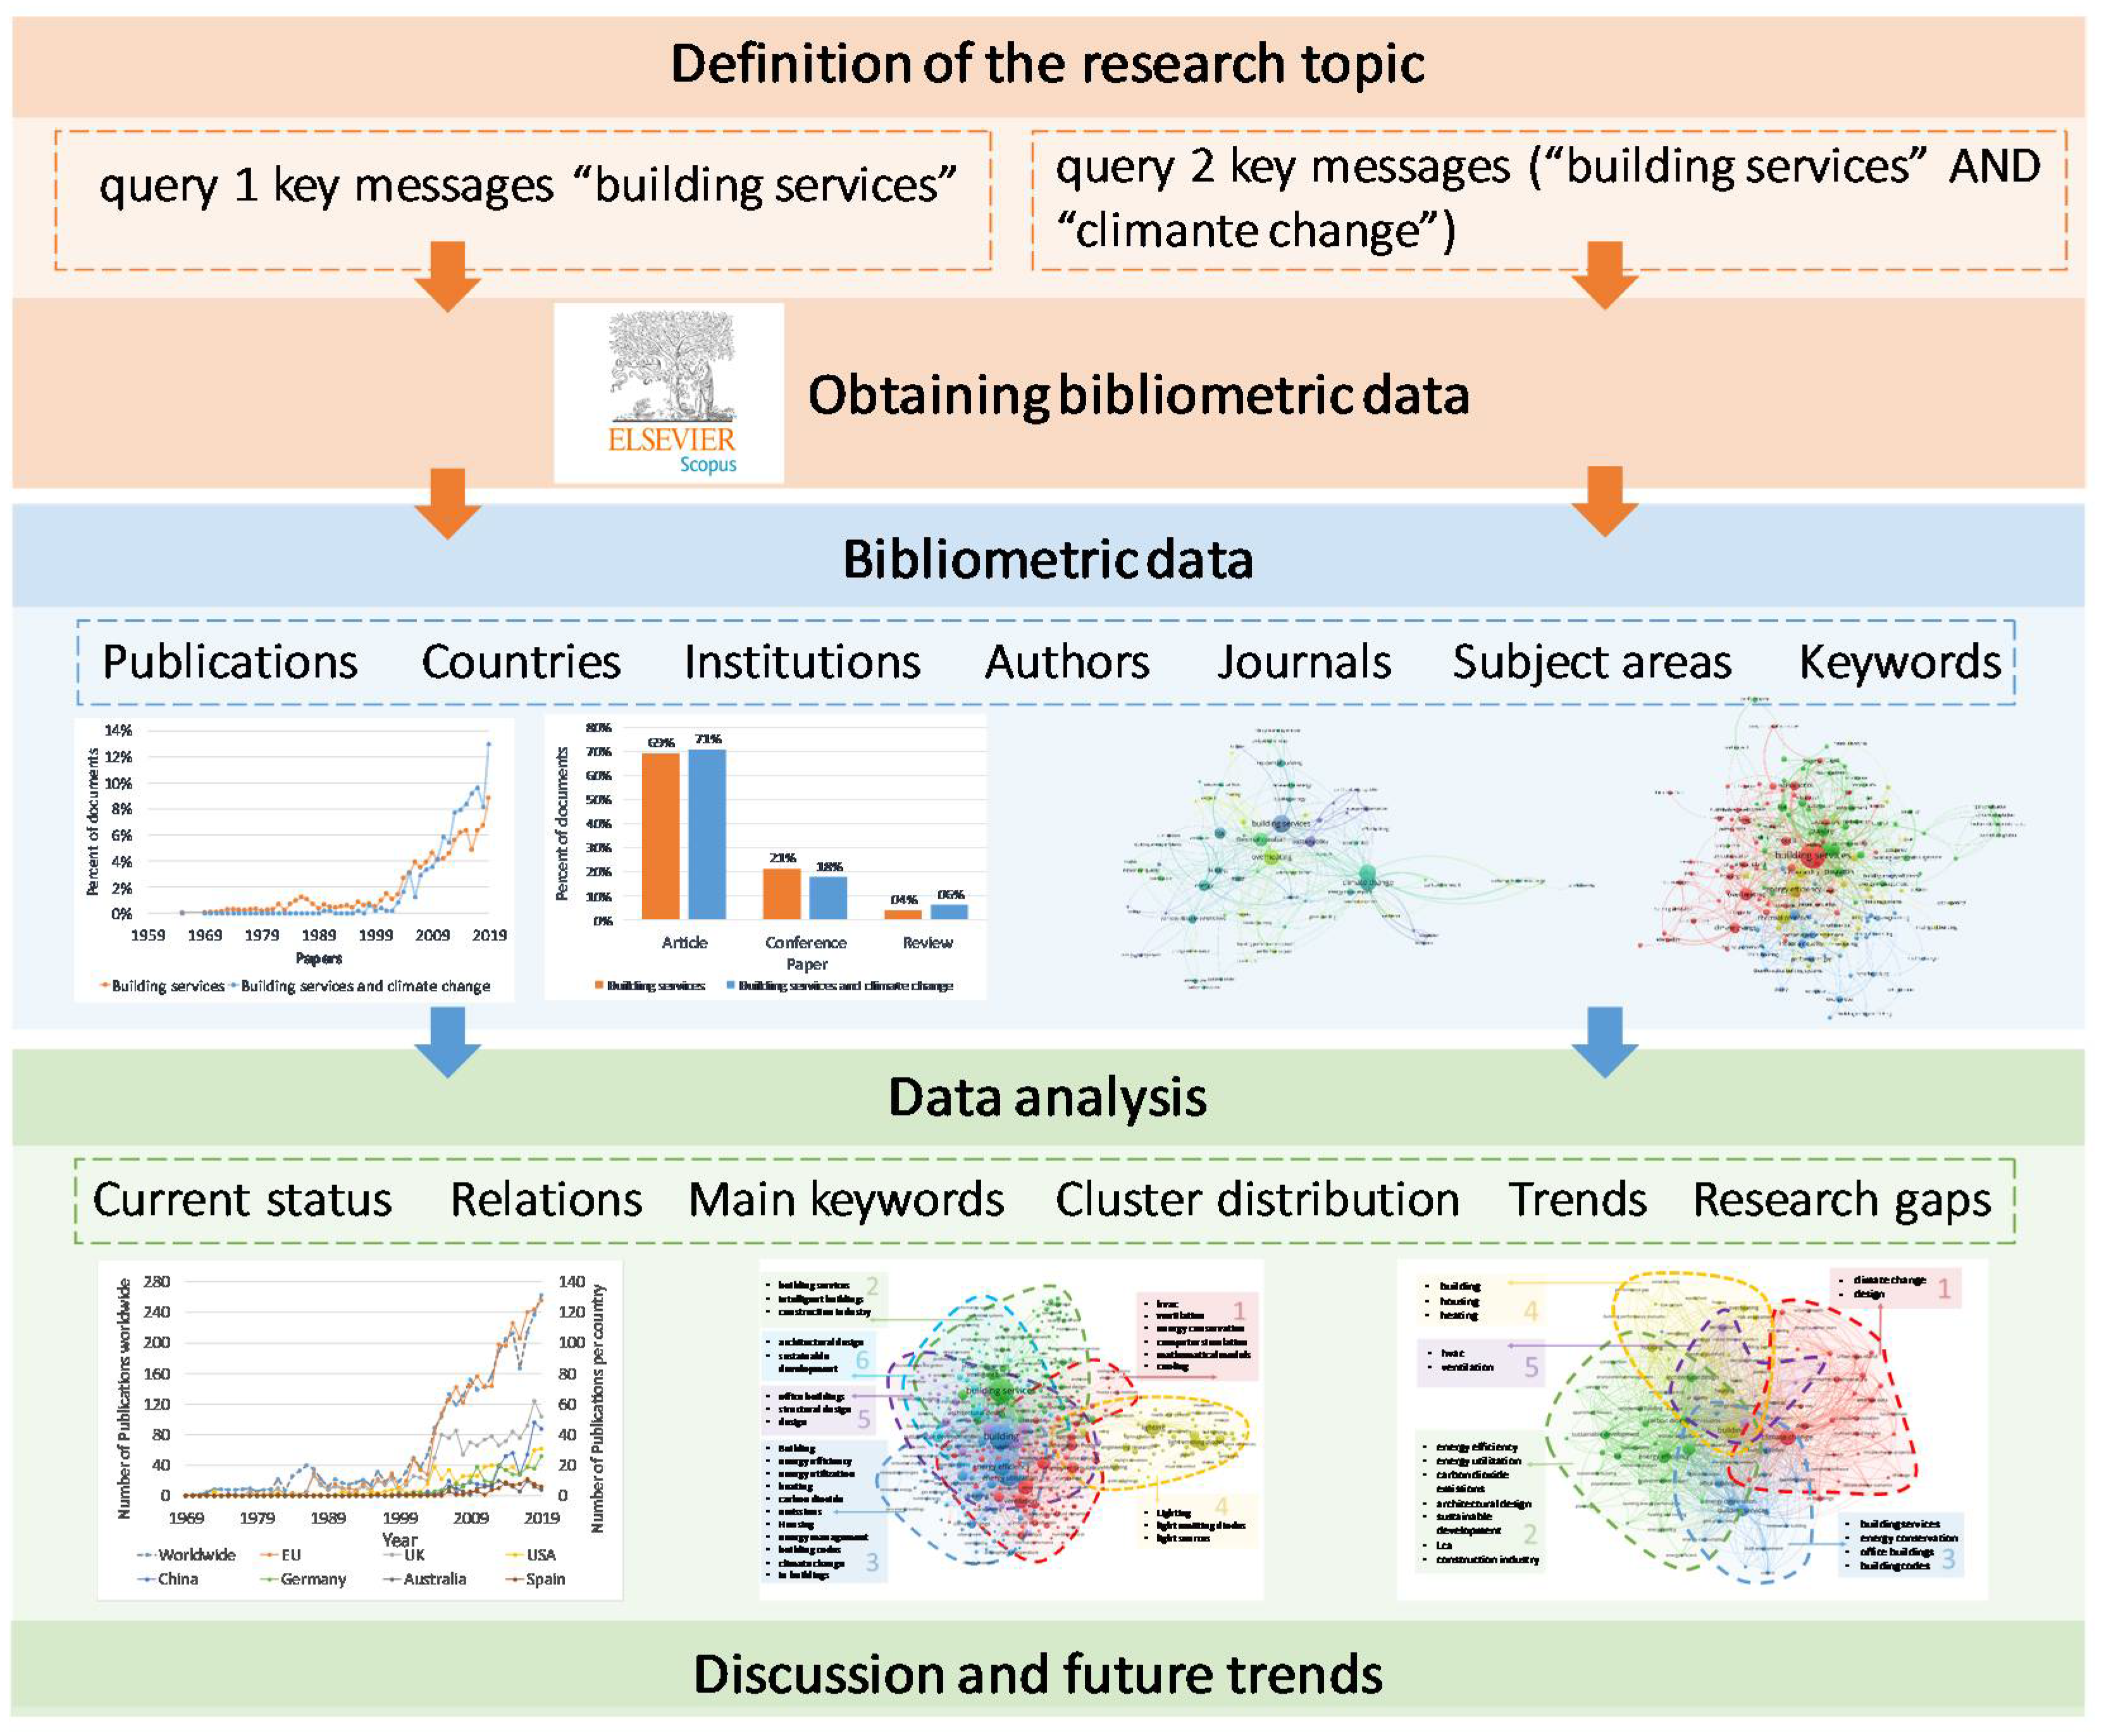
Bibliometrics allows to perform a wide statistical literature analysis of the existing publications in a determined research field [6]. Figure 2 presents the specific methodology utilized to define all the steps to map the state-of-the-art of the scientific topic researched within the scope of this paper. The first step consists of the definition of the research topic, from which two queries were developed, including the key messages of the paper. The next step was the selection of the proper database. On this matter, Wuni et al. [7] stated that the WoS and Scopus databases can be used to extract bibliometric data, but the content of both for the same research tends to differ. Moreover, Cabeza et al. [8] showed that Scopus contains more publications in the area of technology. Therefore, Scopus was selected as the database for the presented study. Then all references were downloaded, as well as the statistics for the bibliometric analysis. Finally, the software VOSviewer [8,9,10] was used to analyze relations between countries and keywords.
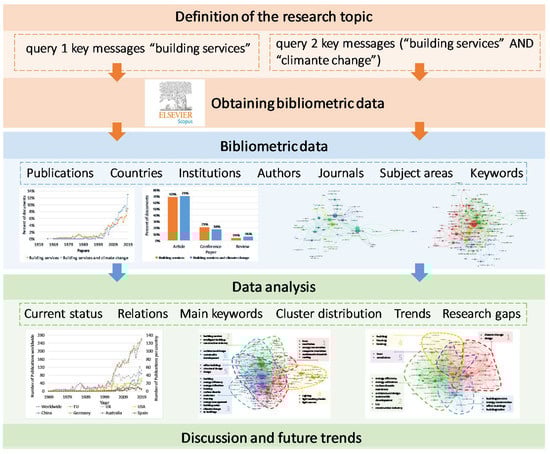
Figure 2.
Methodology of the paper.
The world population was obtained from the United Nations, Department of Economic and Social Affairs [11], and the number of researchers from the United Nations Science Report [12].
3. Results
3.1. Bibliometric Analysis
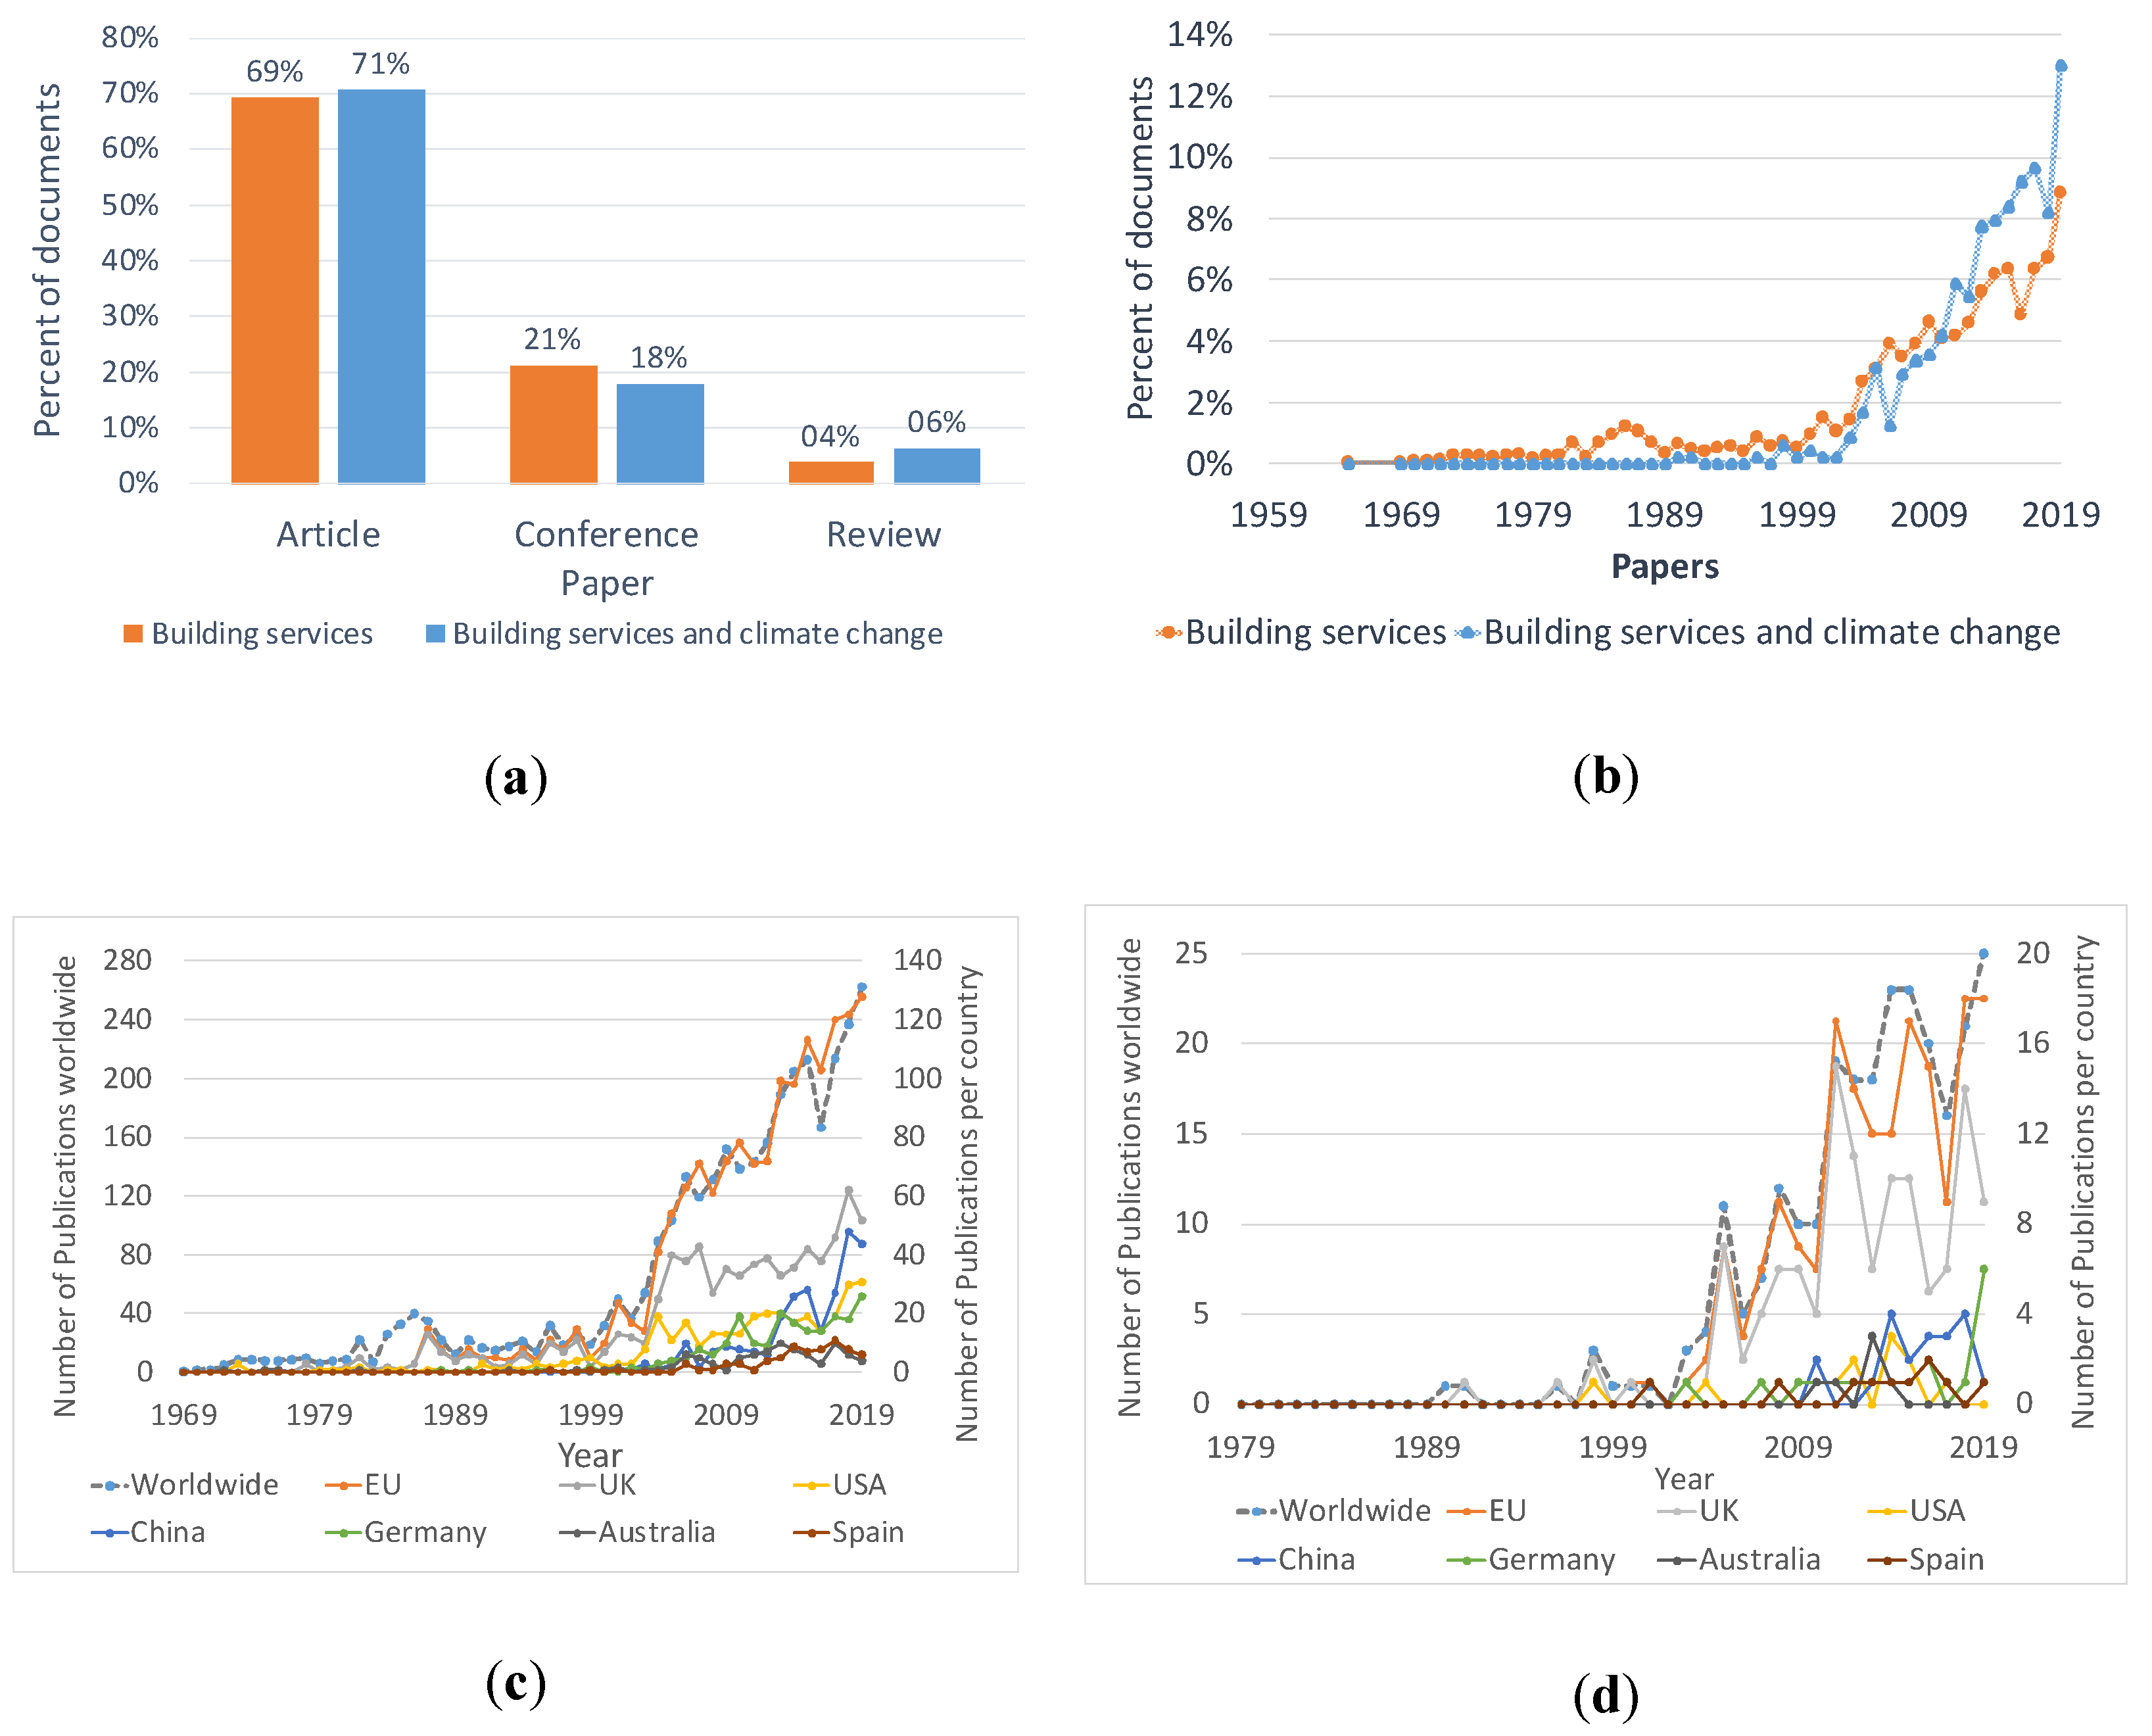
The search carried out on 14 March 2020 revealed 3300 documents related to building services and 477 publications related to building services and climate change. Figure 3a shows that nearly 70% of those documents are papers/articles, and about 20% are conference papers; reviews, book chapters and other types of documents are anecdotic. Moreover, the statistics are similar for the two queries. The assessment of the trends in Figure 3b reveals that both queries have the same profile, with documents talking about the topic since 1965, but with a growth in interest in 2000–2002, and somehow a stagnation in 2014–2015. Considering the countries with more publications on the topic of study and with good representation of the different continents, Figure 3c shows that the EU publishes one-third of the literature published worldwide. The UK published a similar number of documents as the EU; although, in the last ten years, this number seemed to stagnate (in 2010, the UK had nearly the same number of publications as the EU—37 and 39, respectively, while in 2018, it had only half—62 and 122, respectively). China increased its publication rate on the topic only recently (in 2015, it published 28 documents and 48 in 2018). When the relation with climate change is considered (Figure 3d), the UK shows a higher number of publications but also more stability than the other countries/territories considered. The EU has more publications than the UK, and all other countries have much fewer documents.
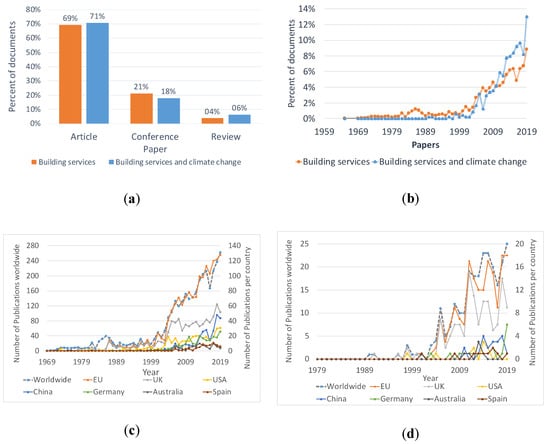
Figure 3.
(a) Type of documents, (b) trends in publications, (c) trends in countries general query, and (d) trends in countries query with climate change.
Figure 4 shows the specific number of publications for the countries/territories with more documents. It is interesting to see that although the EU is the territory with more publications, its contribution only stands out when the number of documents per number of researchers with the general query is considered. The USA stands out when the number of publications per number of inhabitants is considered for both queries. China stands out when the number of publications per number of researchers in the query with climate change is considered, focusing their studies on LED light sources, as shown in Figure 4e, to improve energy efficiency [13,14,15], and 12 publications in the Lighting Research and Technology journal.
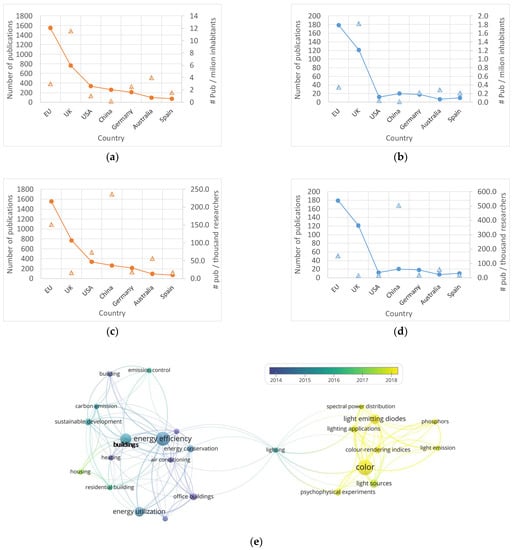
Figure 4.
Scientific production per country: (a) per million inhabitants (general query), (b) per million inhabitants (query with climate change), (c) per thousand researchers (general query), (d) per thousand researchers (query with climate change), and (e) overlay visualization for China (query 2).
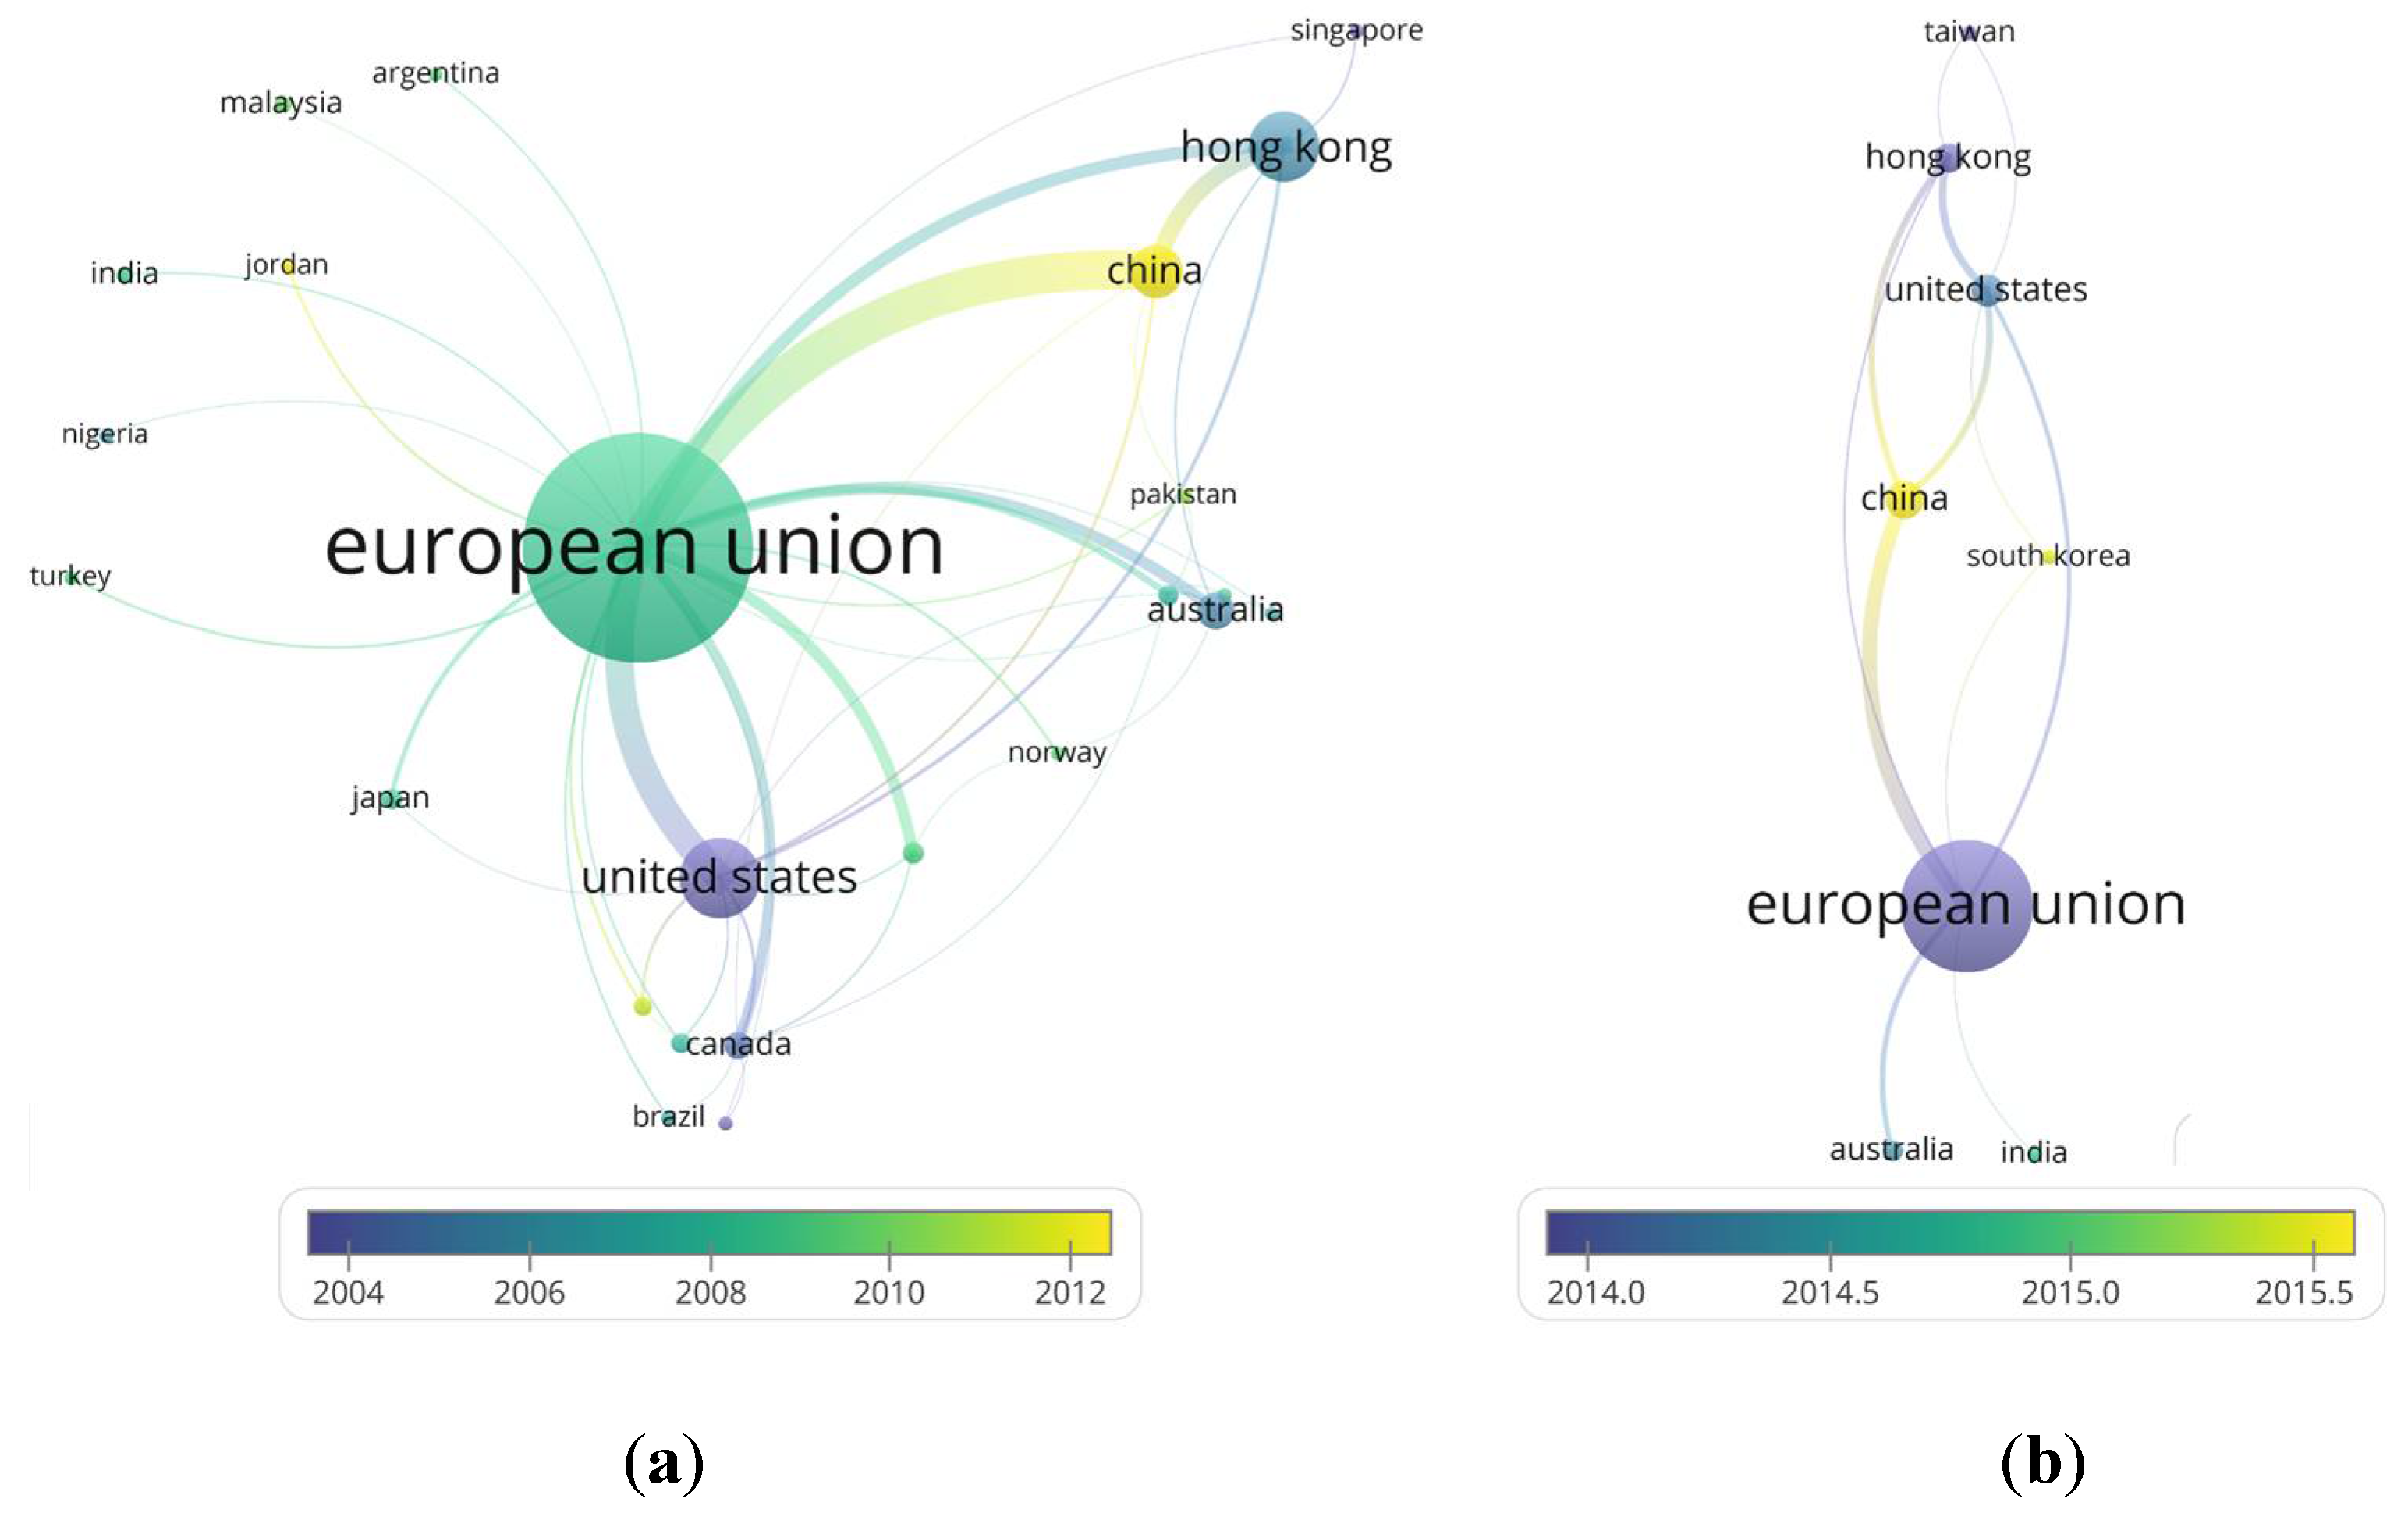
The relations between countries/territories are presented in Figure 5. In both queries, the EU centralize all collaborations, and in both queries, China and South Korea are the newest countries to appear (in the general query, Jordan also appears as new). It is interesting to see that the research on building services is older in the USA and Canada than in the EU, while its relation to climate change is older in the EU, which could be because of the fast implementation of climate change mitigation policies in the EU [16] (in general, this relation with climate change is newer).

Figure 5.
Relations between countries/territories: (a) general query, (b) query with climate change.
Table 1 lists the researchers with more documents on the topic of building services (Query 1). It is interesting to see that there is not a clear correlation between the authors with more publications and the countries with more publications. For example, the UK includes three authors (Steve A. Fotios, Michael J. Davis, and Chris Cheal), and only two institutions are represented (University of Sheffield with two authors and Univ. College London). Hong Kong also contributes with three researchers, but in this case, only one institution is represented (Hong Kong Polytechnic University). In both cases, we find two researchers publishing together, Steve A. Fotios and Chris Cheal for the UK, and L.T. Wong and K.W. Mui for Hong Kong.

Table 1.
Authors with more publications on the topic of building services and their impact.
Furthermore, the topics of research are different for the different authors and countries/territories. For example, the main topic of S.A. Fotios from the UK and M.S. Rea from the USA is lighting [17,18,19,20,21,22]. W. Zeiler from the Netherlands studied building design from the human perspective point of view [23], and energy efficiency [24]. L.T. from Hong Kong worked on indoor air quality, pollution, and ventilation [13].
Finally, Table 1 shows that all these authors study topics related to building services but without this being their unique research interest.
As expected, the journal Building Services Engineering Research and Technology is one of the journals with more documents (511) (Figure 6a), but surprisingly, the journal Lighting Research and Technology has more publications (670). All other journals used have much fewer documents on the topic, i.e., the third journal is Energy and Buildings, with 55 documents. On the other hand, when the relation with climate change is studied (Figure 6b), the journal Building Services Engineering Research and Technology includes 88 documents, more than four times the second journal listed.
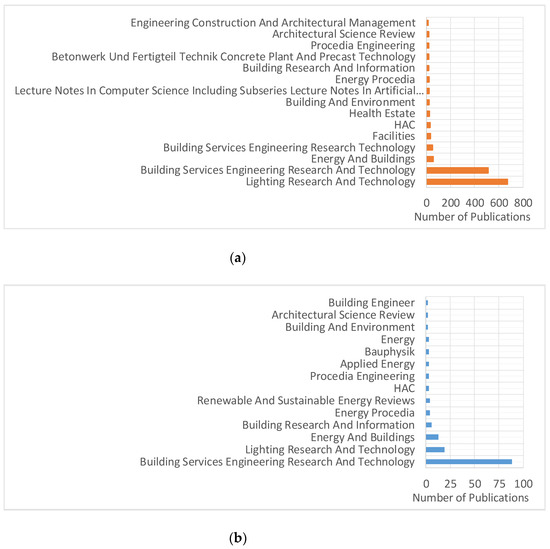
Figure 6.
Journals used to publish this research topic: (a) general query, (b) query with climate change.
Table 2 shows that when the authors select the journal to publish their research on the topic, the impact factor and classification of the journal is not as important as the scope of the journal (the first and second journal are Q2 and Q3, respectively). This is interesting to highlight since this is not the same trend found in other studies on different topics [8].
Table 2.
Journals with more publications on the topic of building services and their impact.
Finally, Figure 7 shows that most documents published on the topic of building services are within the area of engineering (77% in building services and 78% in building services and climate change). All other areas found have a much lower number of publications (i.e., computer science includes 9% of documents on building services). However, it is interesting to highlight that in building services, the next most published topics are climate change energy 15% and environmental science 13 %.
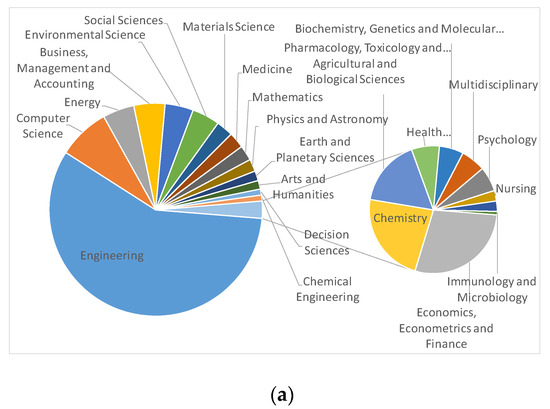
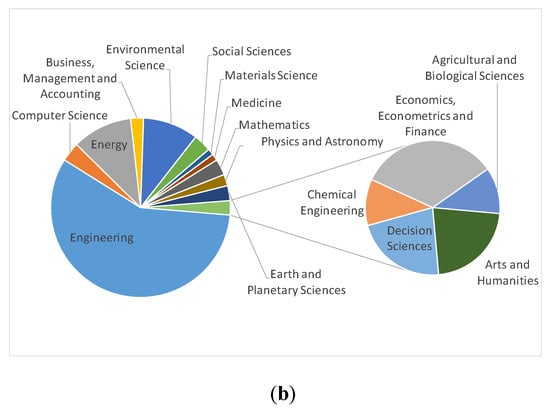
Figure 7.
Subjects used to publish this research topic: (a) general query, (b) query with climate change.
3.2. Keywords Network Analysis
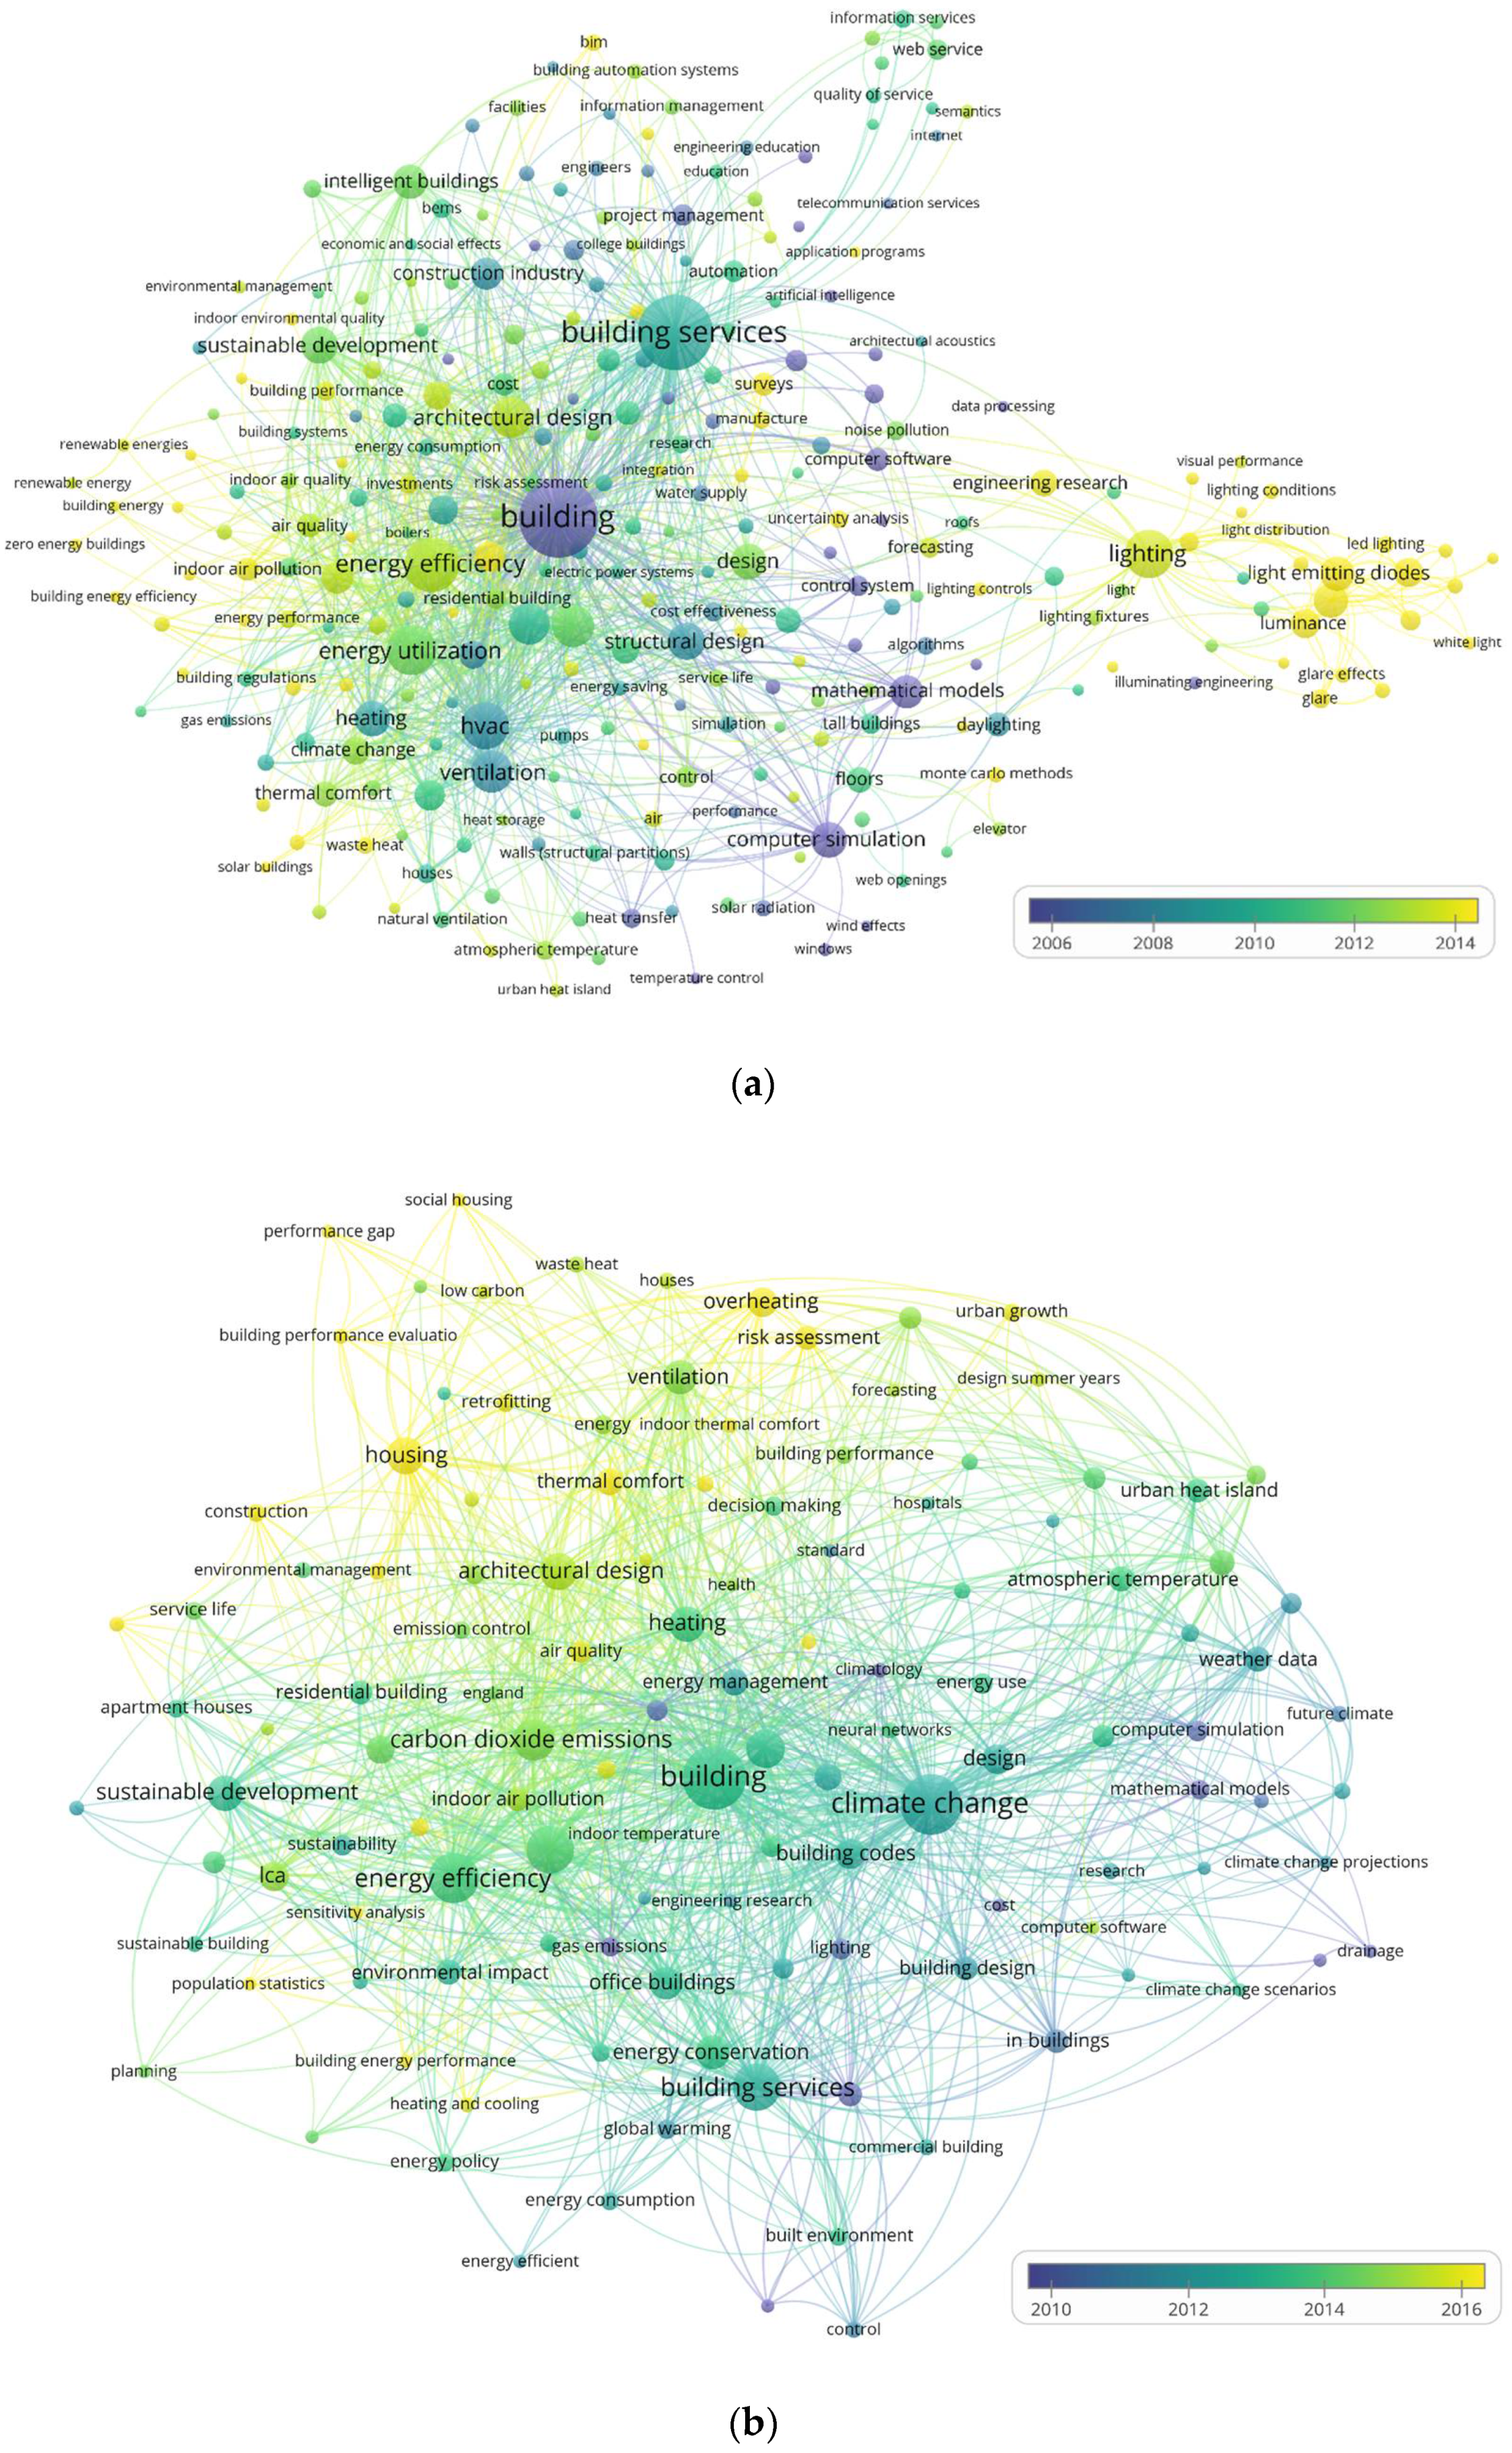
Table 3 and the literature map presented in Figure 8 (the one for the general query) shows that the co-occurrences keywords can be grouped into six clusters. The first one, in red, groups “hvac” and “ventilation” with the building service “thermal comfort”. Interestingly, “thermal comfort” is also linked to “air quality” and “indoor air pollution”, as is stated in [25,26]. This cluster also groups “hvac”, with “energy conservation”, “computer simulation”, “mathematical model”, “optimization”, and “control” [27,28,29,30,31], and “elevator”, with “Monte Carlo method” and “high rice building”. The second cluster, in green, links “building services” with “intelligent buildings” (also related to control in cluster 1), “bems”, and “control system”. It also groups “building service” with “construction industry”, and “project management”, “maintenance”, and “cost”. The third cluster, in blue, groups “building”, “energy efficiency” and “energy utilization” with “building codes”, “climate change”, “carbon dioxide emissions”, and “renewable energies”. It is important to highlight the keyword “energy efficiency” in this cluster as it has the highest number of occurrences (324) of the map (excluding the keywords present in query 1), therefore is of great interest in the research on building services [32,33,34,35,36,37]. The fourth cluster, in yellow, groups the “lighting” building service; this keyword has been of great interest globally since the introduction of light-emitting diodes (LED) and their low energy consumption as reflected in [37,38,39,40,41], thus the strong relationship with “energy efficiency” is expected. This cluster groups “lighting”, “engineering research” and “light emitting diodes”, with “light sources”, “color”, “luminance”, “spectral power distribution”, and “color rendering”. The fifth cluster, in purple groups “office buildings”, “structural design”, and “design”, with “lca”, “environmental impact” and “building material”. The last and sixth cluster, in light blue groups “architectural design” and “sustainable development” with “sustainable building” and “built environment.
Table 3.
Keywords with more than 80 occurrences (query 1).
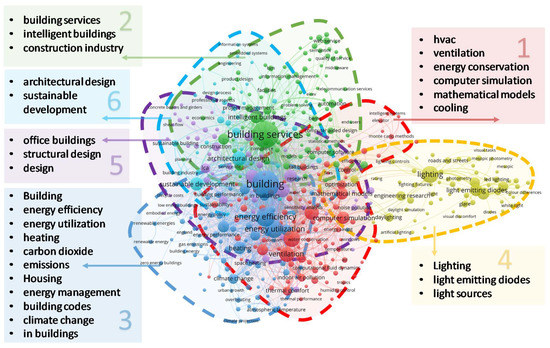
Figure 8.
Co-occurrence keywords network query 1.
When “climate change” is added to the query, a more detailed analysis can be done, as shown in Figure 9 and Table 4. The first cluster, in red, groups “climate change” and “design” with “building simulation”, “energy use”, “weather data”, “meteorology”, and “urban heat island”. This cluster shows the effort made to achieve mathematical models that represent complex phenomena such as urban heat island [42,43], which in building services is highly necessary for efficient energy retrofit of existing buildings [44] and is used to optimize the dimensioning of heating and cooling systems [45]. The second cluster, in green, groups “energy efficiency”, “energy utilization”, “carbon dioxide emissions” and “architectural design”, with “environmental impact”, “embodied energy”, “lca” [46,47], “sustainable development”, and “intelligent building”. Interestingly, “energy efficiency” continues to have the highest number of occurrences (61) of the map (excluding the keywords present in query 2). The third cluster, in blue, links “building services”, “energy conservation”, and “office buildings”, with “building codes”, “climate control”, and “lighting”. The use of the Passivhaus [48] and NZEB standards [49] have proved to be effective in improving the building’s energy efficiency, but it has also increased the overheating risk [50,51,52]. Therefore, the fourth cluster, in yellow, groups “building”, “energy management”, and “heating” with “thermal comfort”, “building performance”, and “overheating”. This cluster also links “building” with “housing” and “retrofitting”. The fifth and last cluster, in purple, links “hvac” with “ventilation”, “air quality”, and “natural ventilation”.
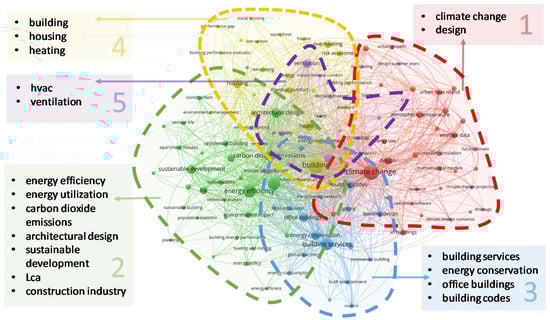
Figure 9.
Keywords network (query 2).
Table 4.
Keywords with more than 20 occurrences (query 2).
4. Discussion, Past Trends and Future Perspectives
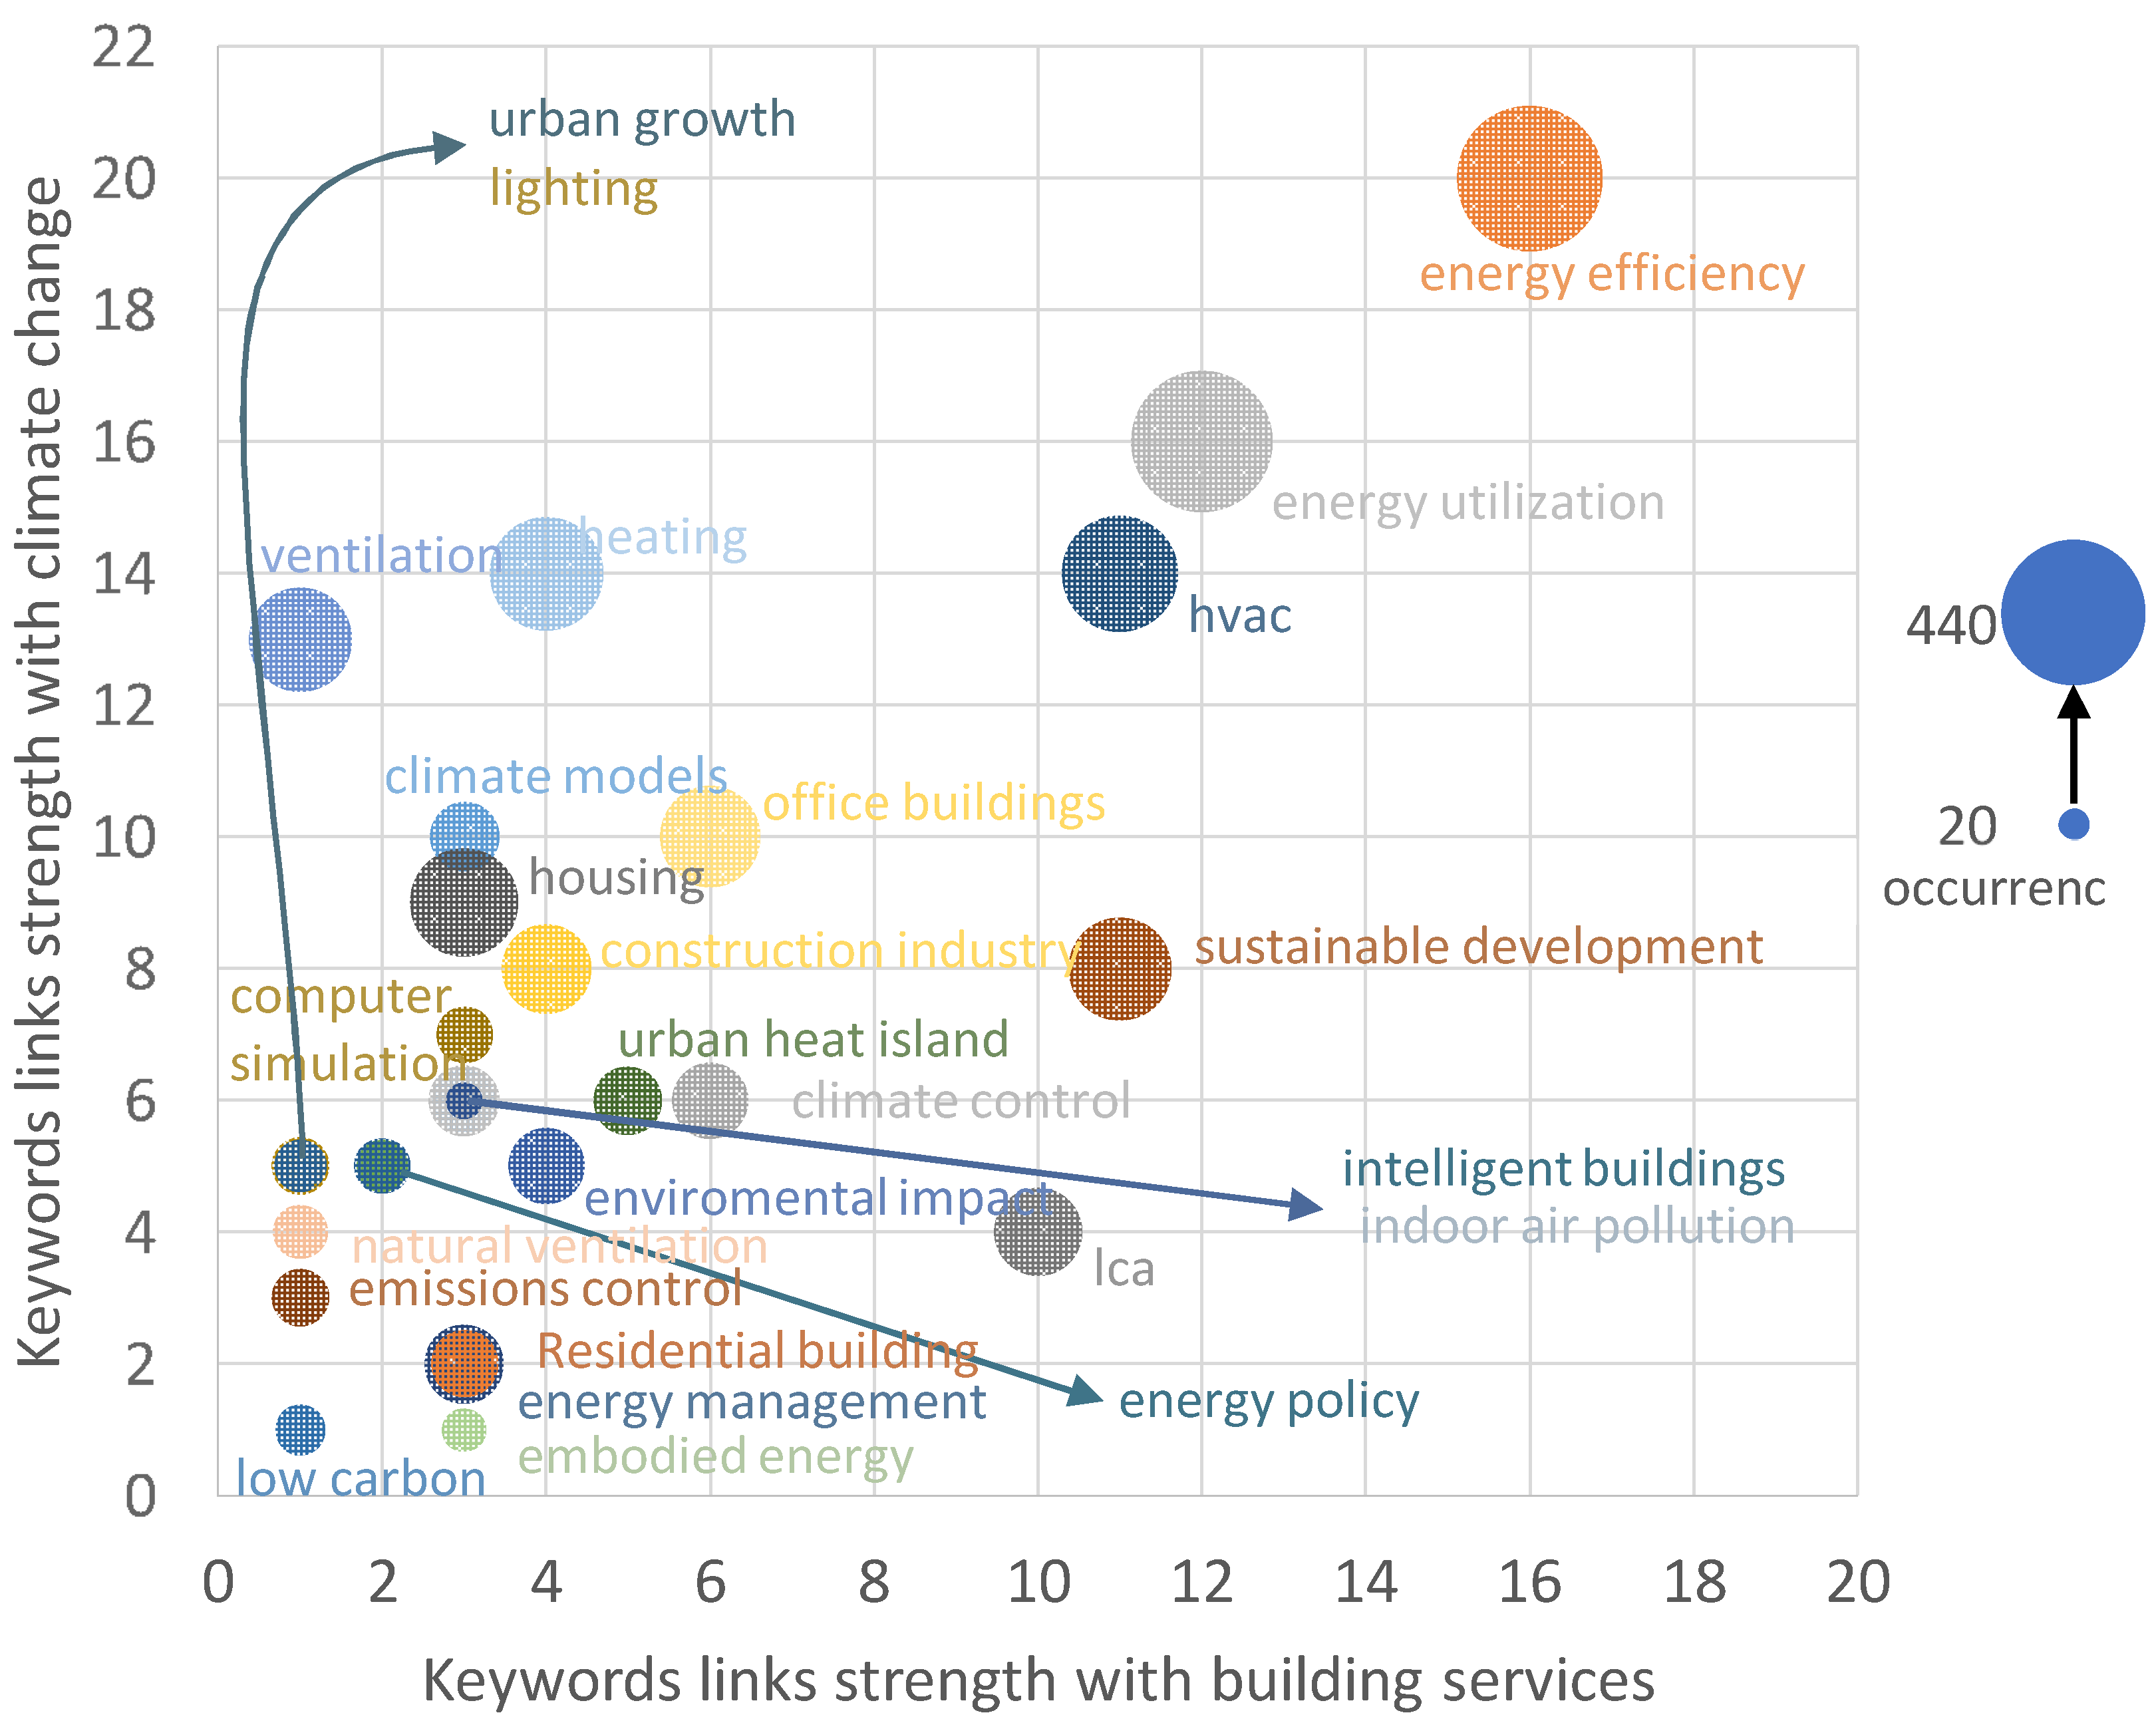
To better understand which building services are analyzed in the literature with more emphasis on climate change, Figure 10 shows the keywords that have a direct link with “building services” and “climate change” keywords in query 2. It shows that “energy efficiency” is one of the most studied topics with the highest number of occurrences (440) and the highest link strength with both “building services” (16) and “climate change” (20). The next keywords are “energy utilization” and “hvac”. Moreover, “ventilation”, “heating” and “climate models” have a clear affinity to climate change, while “sustainable development” and “lca” have higher affinity to “building services”.
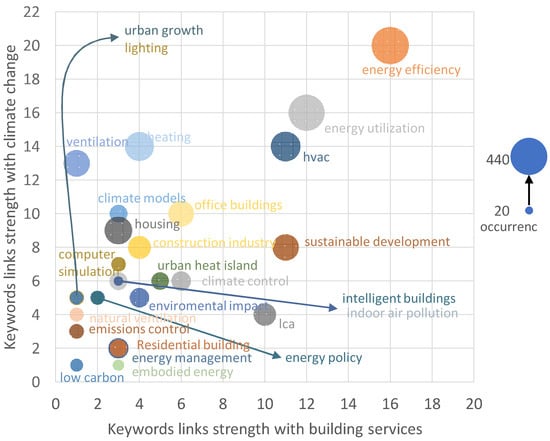
Figure 10.
Keywords link strength directly related to building services and climate change in query 2 keywords network analysis.
Following the trend presented in Figure 3b, the overlay visualization by year of the keyword analyses (Figure 11) shows that most keywords appear after 2002, highlighting the progress of research towards new topics. Figure 11a shows that the keywords used in earlier documents were “maintenance”, “architecture”, “project management”, also “computer simulation” and “mathematical models”, related to “control system”, “hvac”, “ventilation”, and “heating”; indeed, these are the building services classified within the safety and comfort types in Figure 1. However, most recent interests have changed to energy efficiency topics such as “lighting”, “luminance” and “led emitting diode”, the transition from building to city with “urban heat island”, and more recent building subjects such as “embodied carbon”, “data centre”, “overheating”, “performance gap”, and finally “bim”, which are within the efficiency and climate change types in Figure 1.

Figure 11.
Trends in keywords network: (a) general query, (b) query with climate change.
Moreover, when the relation between building service and climate change is studied Figure 11b, with all the topics newer than in query 1, the keywords used in earlier documents were “gas emissions”, “climate control” and “building regulations” [53], showing that the literature related building services with climate change when HVAC systems are studied, also mentioning regulations and policies. Recent interests can be grouped, for example, social topics like “housing” close to “social housing”, “urban growth” and “retrofitting” [46,54,55], highlighting that retrofitting of social housing is a topic to consider to ensure thermal comfort to low-income population and to avoid energy poverty. Other recent keywords are “overheating”, “risk assessment”, “thermal comfort”, and “embodied energy”, with the latter closely related to “carbon dioxide emissions”, “energy efficiency”, and “lca” [56,57], showing the growing importance of sustainable topics in recent research.
5. Conclusions
This paper presents a bibliometric-driven analysis of research trends in the field of building services and their relationship to climate change. It was developed using data from the Scopus database from 1969 to March 2020. Two queries were analyzed, TITLE-ABS-KEY (“building service*”) and TITLE-ABS-KEY (“building service*” AND “climate change”). The results of both queries were analyzed in terms of publications by years, countries and top journals in which the research was published and through a keyword network analysis. This made it possible to identify the most recent research trends. The most recent research on building services can be associated with safety, comfort and efficiency. The studies show that improvements in thermal efficiency in buildings and improvements in air quality are made by studying natural ventilation techniques coupled with HVAC systems and the development of new HVAC technologies. On the other hand, improvements in electrical efficiency focus on the use of LED lighting and the use of intelligent control strategies, optimized through building simulations. When relating building services to climate change, the most recent studies focus on social aspects such as social housing, urban growth, and thermal comfort. The main research gaps identified are the lack of integration of the four groups of building services identified in this study in order to draw more effective research in the fight against climate change. Finally, the study of building services not related to energy services is also a research gap.
Author Contributions
Conceptualization, L.F.C.; methodology, D.V. and L.F.C.; formal analysis, D.V. and L.F.C.; investigation, D.V. and L.F.C.; resources, L.F.C.; data curation, L.F.C.; writing—original draft preparation, D.V.; writing—review and editing, L.F.C.; visualization, D.V.; supervision, L.F.C.; project administration, L.F.C.; funding acquisition, L.F.C. All authors have read and agreed to the published version of the manuscript.
Funding
This research was partially funded by the Ministerio de Ciencia, Innovación y Universidades de España (RTI2018-093849-B-C31—MCIU/AEI/FEDER, UE) and by the Ministerio de Ciencia, Innovación y Universidades—Agencia Estatal de Investigación (AEI) (RED2018-102431-T).
Data Availability Statement
Data are available upon request to the corresponding author.
Acknowledgments
The authors would like to thank the Catalan Government for the quality accreditation given to their research group GREiA (2017 SGR 1537). GREiA is a certified agent TECNIO in the category of technology developers from the Government of Catalonia. This work is partially supported by ICREA under the ICREA Academia programme.
Conflicts of Interest
The authors declare no conflict of interest.
References
- International Energy Agency 2019. Available online: www.iea.org. (accessed on 15 December 2020).
- Ürge-Vorsatz, D.; Khosla, R.; Bernhardt, R.; Chan, Y.C.; Vérez, D.; Hu, S.; Cabeza, L.F. Advances Toward a Net-Zero Global Building Sector. Annu. Rev. Environ. Resour. 2020, 45, 227–269. [Google Scholar] [CrossRef]
- Designing Buildings Wiki. Available online: www.designingbuildings.co.uk (accessed on 7 February 2020).
- Making Buildings Better. Available online: www.bsria.com (accessed on 7 February 2020).
- Building Energy Services. Available online: https://buildingenergysrv.net/ (accessed on 7 August 2020).
- Pritchard, A. Statistical Bibliography or Bibliometrics? J. Doc. 1969, 25, 348–349. [Google Scholar]
- Wuni, I.Y.; Shen, Q.; Osei-Kyei, R. Scientometric review of global research trends on green buildings in construction journals from 1992 to 2018. Energy Build. 2019, 190, 69–85. [Google Scholar] [CrossRef]
- Cabeza, L.F.; Chàfer, M.; Mata, É. Comparative analysis of web of science and scopus on the energy efficiency and climate im-pact of buildings. Energies 2020, 13, 409. [Google Scholar] [CrossRef] [Green Version]
- van Eck, N.J.; Waltman, L. Software survey: VOSviewer, a computer program for bibliometric mapping. Scientometrics 2010, 84, 523–538. [Google Scholar] [CrossRef] [Green Version]
- Tarragona, J.; de Gracia, A.; Cabeza, L.F. Bibliometric analysis of smart control applications in thermal energy storage systems. A model predictive control approach. J. Energy Storage 2020, 32, 101704. [Google Scholar] [CrossRef]
- UNDESA. World Population Prospects: The 2010 Revision; United Nations, Department of Economic and Social Affairs, Population Division: New York, NY, USA, 2011. [Google Scholar]
- Nations, U. Unesco Science Report: Towards 2030; UNESCO: Paris, France, 2016. [Google Scholar]
- Mui, K.W.; Wong, L.T.; Yu, H.C.; Cheung, C.T.; Li, N. Exhaust ventilation performance in residential washrooms for bioaerosol particle removal after water closet flushing. Build. Serv. Eng. Res. Technol. 2017, 38, 32–46. [Google Scholar] [CrossRef]
- Huang, Z.; Liu, Q.; Liu, Y.; Pointer, M.R.; Luo, M.R.; Wang, Q.; Wu, B. Best lighting for jeans, part 1: Optimising colour preference and colour discrimination with multiple correlated colour temperatures. Light. Res. Technol. 2019, 51, 1208–1223. [Google Scholar] [CrossRef]
- Huang, Z.; Liu, Q.; Westland, S.; Pointer, M.R.; Luo, M.R.; Xiao, K. Light dominates colour preference when correlated colour temperature differs. Light. Res. Technol. 2018, 50, 995–1012. [Google Scholar] [CrossRef]
- European Climate Change Programme. Available online: https://ec.europa.eu/clima/policies/eccp_en (accessed on 20 June 2020).
- Fotios, S.; Monteir, A.L.; Uttley, J. Evaluation of pedestrian reassurance gained by higher illuminances in residential streets us-ing the day–dark approach. Light. Res. Technol. 2019, 51, 557–575. [Google Scholar] [CrossRef] [Green Version]
- Fotios, S.; Cheal, C.; Fox, S.; Uttley, J. The transition between lit and unlit sections of road and detection of driving hazards after dark. Light. Res. Technol. 2017, 51, 243–261. [Google Scholar] [CrossRef] [Green Version]
- Kent, M.; Fotios, S.; Altomonte, S. Discomfort glare evaluation: The influence of anchor bias in luminance adjustments. Light. Res. Technol. 2017, 51, 131–146. [Google Scholar] [CrossRef]
- Figueiro, M.; Kalsher, M.; Steverson, B.; Heerwagen, J.; Kampschroer, K.; Rea, M. Circadian-effective light and its impact on alertness in office workers. Light. Res. Technol. 2018, 51, 171–183. [Google Scholar] [CrossRef]
- Rea, M. Thewhatand thewhereof vision lighting research. Light. Res. Technol. 2017, 50, 14–37. [Google Scholar] [CrossRef] [Green Version]
- Rea, M.; Bullough, J.D.; Brons, J. Parking lot lighting based upon predictions of scene brightness and personal safety. Light. Res. Technol. 2015, 49, 293–304. [Google Scholar] [CrossRef]
- Zeiler, W.; Labeodan, T. Human-in-the-loop energy flexibility integration on a neighbourhood level: Small and Big Data man-agement. Build. Serv. Eng. Res. Technol. 2019, 40, 305–318. [Google Scholar] [CrossRef]
- Sayigh, A. Sustainable High Rise Buildings in Urban Zones: Advantages, Challenges, and Global Case Studies; Springer: Berlin/Heidelberg, Germany, 2016; 248p. [Google Scholar]
- Khalid, W.; Zaki, S.A.; Rijal, H.B.; Yakub, F. Investigation of comfort temperature and thermal adaptation for patients and visitors in Malaysian hospitals. Energy Build. 2019, 183, 484–499. [Google Scholar] [CrossRef]
- Chenari, B.; Carrilho, J.D.; da Silva, M.G. Towards sustainable, energy-efficient and healthy ventilation strategies in buildings: A review. Renew. Sustain. Energy Rev. 2016, 59, 1426–1447. [Google Scholar] [CrossRef]
- Eshraghi, A.; Salehi, G.; Heibati, S.; Lari, K. An enhanced operation model for energy storage system of a typical combined cool, heat and power based on demand response program: The application of mixed integer linear programming. Build. Serv. Eng. Res. Technol. 2019, 40, 47–74. [Google Scholar] [CrossRef]
- D’Oca, S.; Gunay, H.B.; Gilani, S.; O’Brien, W. Critical review and illustrative examples of office occupant modelling formalisms. Build. Serv. Eng. Res. Technol. 2019, 40, 732–757. [Google Scholar] [CrossRef]
- Kalamees, T.; Väli, A.; Kallavus, U.; Kurik, L.; Alev, Ü. Simulated influence of indoor climate and ventilation on schoolwork performance in Estonian manor schools. Int. J. Vent. 2015, 14, 153–164. [Google Scholar] [CrossRef]
- Dols, W.S.; Emmerich, S.J.; Polidoro, B.J. Using coupled energy, airflow and indoor air quality software (TRNSYS/CONTAM) to evaluate building ventilation strategies. Build. Serv. Eng. Res. Technol. 2015, 37, 163–175. [Google Scholar] [CrossRef] [Green Version]
- Vakiloroaya, V.; Samali, B.; Eager, D. Performance prediction of a new integrated central cooling plant for energy efficiency and comfort enhancement. Build. Serv. Eng. Res. Technol. 2015, 37, 379–394. [Google Scholar] [CrossRef]
- Sahamir, S.R.; Zakaria, R.; Omar, M.F.; Shakri, M.R.; Chughtai, M.W.; Mustafar, M. Energy Efficiency Criteria for Planning and Design of Green Hospital Buildings Rating System. In IOP Conference Series: Materials Science and Engineering 2019; IOP: Bristal, UK, 2019; Volume 620, p. 012082. Available online: https://iopscience.iop.org/article/10.1088/1757-899X/620/1/012082/pdf (accessed on 7 August 2020). [CrossRef]
- Bermejo-Busto, J.; Martín-Gómez, C.; Zuazua-Ros, A.; Baquero, E.; Miranda, R. Performance simulation of heat recovery ventilator cores in cascade connection. Energy Build. 2017, 134, 25–36. [Google Scholar] [CrossRef]
- Raide, I.; Kalamees, T.; Mauring, T. Õppetunnid esimestest passiivmajadeks kavandatud avalikest hoonetest Eestis. Proc. Est. Acad. Sci. 2015, 64, 157–167. [Google Scholar] [CrossRef]
- Kovári, G.; Kistelegdi, I. Building performance simulation modeling techniques. Pollack Period. 2016, 11, 135–146. [Google Scholar] [CrossRef]
- Mokhtar Azizi, N.S.; Wilkinson, S.; Fassman, E. Strategies for improving energy saving behaviour in commercial buildings in Malaysia. Eng. Constr. Archit. Manag. 2015, 22, 73–90. [Google Scholar] [CrossRef]
- Alev, Ü.; Eskola, L.; Arumägi, E.; Jokisalo, J.; Donarelli, A.; Sirén, K.; Broström, T.; Kalamees, T. Renovation alternatives to improve energy performance of historic rural houses in the Baltic Sea region. Energy Build. 2014, 77, 58–66. [Google Scholar] [CrossRef]
- Askola, J.; Çalkin, Y.; Vaskuri, A.; Poikonen, T.; Ikonen, E. Accelerated ageing of organic LED panels using ultraviolet exposure. Light. Res. Technol. 2018, 51, 1263–1274. [Google Scholar] [CrossRef]
- Davidovic, M.; Djokic, L.; Cabarkapa, A.; Kostic, M. Warm white versus neutral white LED street lighting: Pedestrians’ impres-sions. Light. Res. Technol. 2019, 51, 1237–1248. [Google Scholar] [CrossRef]
- Lu, Y.; Li, W.; Xu, W.; Lin, Y. Impacts of LED dynamic white lighting on atmosphere perception. Light. Res. Technol. 2019, 51, 1143–1158. [Google Scholar] [CrossRef]
- Raul, D.; Ghosh, K. Performance of chip-on-board and surface-mounted high-power LED luminaires at different relative hu-midities and temperatures. Light. Res. Technol. 2019, 51, 1249–1262. [Google Scholar] [CrossRef]
- Levermore, G.; Parkinson, J. The urban heat island of London, an empirical model. Build. Serv. Eng. Res. Technol. 2019, 40, 290–295. [Google Scholar] [CrossRef]
- Levermore, G.J.; Parkinson, J.B. An empirical model for the urban heat island intensity for a site in Manchester. Build. Serv. Eng. Res. Technol. 2016, 38, 21–31. [Google Scholar] [CrossRef]
- Filippín, C.; Larsen, S.F.; Ricard, F. Improvement of energy performance metrics for the retrofit of the built environment. Adaptation to climate change and mitigation of energy poverty. Energy Build. 2018, 165, 399–415. [Google Scholar] [CrossRef]
- Herrera, M.; Natarajan, S.A.; Coley, D.; Kershaw, T.; Ramallo-González, A.P.; Eames, M.; Fosas, D.; Wood, M. A review of current and future weather data for building simulation. Build. Serv. Eng. Res. Technol. 2017, 38, 602–627. [Google Scholar] [CrossRef] [Green Version]
- Devi, L.P.; Palaniappan, S. Life cycle energy analysis of a low-cost house in India. Int. J. Constr. Educ. Res. 2018, 15, 256–275. [Google Scholar] [CrossRef]
- Kovacic, I.; Reisinger, J.; Honic, M. Life Cycle Assessment of embodied and operational energy for a passive housing block in Austria. Renew. Sustain. Energy Rev. 2018, 82, 1774–1786. [Google Scholar] [CrossRef]
- Passive House Institute. Available online: https://passivehouse.com/ (accessed on 5 October 2020).
- European Commission. Progress towards Nearly Zero-Energy Buildings Uptake. Available online: https://ec.europa.eu/energy/topics/energy-efficiency/energy-efficient-buildings/nearly-zero-energy-buildings_en (accessed on 17 August 2020).
- Mitchell, R.; Natarajan, S. Overheating risk in Passivhaus dwellings. Build. Serv. Eng. Res. Technol. 2019, 40, 446–469. [Google Scholar] [CrossRef]
- Roberts, B.M.; Allinson, D.; Diamond, S.; Abel, B.; Das Bhaumik, C.; Khatami, N.; Lomas, K.J. Predictions of summertime overheating: Comparison of dynamic thermal models and measurements in synthetically occupied test houses. Build. Serv. Eng. Res. Technol. 2019, 40, 512–552. [Google Scholar] [CrossRef] [Green Version]
- Gao, X.; Zhao, T.; Luo, G.; Zheng, B.; Huang, H.; Han, X. Thermal Property Enhancement of Paraffin-Wax-Based Hydrox-yl-Terminated Polybutadiene Binder with a Novel NanoSiO2-Expanded Graphite-PW Ternary Form-Stable Phase Change Material. Energy Fuels 2018, 32, 4016–4024. [Google Scholar] [CrossRef]
- Ji, Y.; Swan, W.; Fitton, R.; Fernando, T. Assessing the requirements from ‘BB101′ 2006 and 2018 for a naturally ventilated pre-paratory school in the UK. Build. Serv. Eng. Res. Technol. 2019, 40, 638–659. [Google Scholar] [CrossRef]
- Teli, D.; Dimitriou, T.; James, P.; Bahaj, A.; Ellison, L.; Waggott, A. Fuel poverty-induced ‘prebound effect’ in achieving the anticipated carbon savings from social housing retrofit. Build. Serv. Eng. Res. Technol. 2015, 37, 176–193. [Google Scholar] [CrossRef] [Green Version]
- Gupta, R.; Kapsali, M. Evaluating the “as-built” performance of an eco-housing development in the UK. Build. Serv. Eng. Res. Technol. 2016, 37, 220–242. [Google Scholar] [CrossRef]
- Dixit, M.K. Life cycle recurrent embodied energy calculation of buildings: A review. J. Clean. Prod. 2019, 209, 731–754. [Google Scholar] [CrossRef]
- Parkin, A.; Herrera, M.; Coley, D.A. Energy or carbon? Exploring the relative size of universal zero carbon and zero energy de-sign spaces. Build. Serv. Eng. Res. Technol. 2019, 40, 319–339. [Google Scholar] [CrossRef]


Publisher’s Note: MDPI stays neutral with regard to jurisdictional claims in published maps and institutional affiliations. |
© 2021 by the authors. Licensee MDPI, Basel, Switzerland. This article is an open access article distributed under the terms and conditions of the Creative Commons Attribution (CC BY) license (https://creativecommons.org/licenses/by/4.0/).