1. Introduction
The motion of a car can be analysed as a consequence of certain energy transformations occurring in the drive unit of its drive system. Currently, the dominant power units in cars are power units based on ICE (internal combustion engines), where the basic transformation is related to the conversion of the chemical energy contained in the fuel into mechanical energy delivered to the drivetrain in order to overcome the resistance to the car’s motion [
1]. The current trends in the automotive industry are related to the replacement of the primary source of energy from traditional fuels [
2] with electricity obtained from electric energy storage (accumulator battery) [
3,
4,
5] or hydrogen storage [
6]. Regardless of the method of obtaining energy to drive the car, its basic traction parameters related to the speed profile realized by it are determined. The primary speed profile consists of four phases (accelerated motion, steady-state motion-constant speed, decelerated motion, and standstill). Standstill and deceleration motion are a motion phase realized without the transmission of power to the wheels in the car, since in hybrid systems mainly energy recovery of the driven car is activated during the deceleration phase, therefore, in terms of the energy required to drive the car, the main phases are the phases in which we supply energy to the drive system. The value of energy supplied to the propulsion system depends on many components. All components can be defined with one word resulting from the acronym CARE, which defines the influence of all groups of components on the energy properties of the entire car coexisting in the environment (C—chauffeur, A—auto, R—road, E—environment). It should be emphasized that all these groups of the listed components have a different impact on the total energy consumption of a car driving in dynamic road conditions. The total energy consumption of a car is defined as the energy expenditure from the energy reservoir expressed as the amount of energy from the combusted fuel. In the paper, the works of Fontras et al. [
7] on fuel consumption and CO
2 emissions in internal combustion propulsion systems resulting from factory data, in relation to the results obtained under laboratory and road tests, were reviewed. The most important components influencing the increased total energy consumption of the car are:
- -
trailer towing—38%;
- -
traffic volume—32%;
- -
driving dynamics—23%;
- -
roof rack—20%;
- -
ambient temperature (−7 °C)—16%.
Other components indicated in the work that reduce the total energy consumption of the car are:
- -
Advanced Driving Assistant: −1 to −4%;
- -
eco-driving principle: −6%;
- -
a new type of tire with a reduced rolling resistance coefficient: −3%;
- -
new lubricants with a reduced lubricity coefficient: 3%;
- -
ambient temperature up to 30 °C: −2%.
On the basis of comparisons of various types of vehicles, the authors of the paper [
8] analysed the effect of their mass, inter alia, on the total energy consumption of a vehicle, and concluded that in modern vehicle designs, the increase in energy consumption is in the range of 0.4 kWh–1.3 kWh per 100 kg the weight of the car. From several publications, the components from Group I of the car that affect its total energy consumption include the following:
- -
aerodynamic coefficients, frontal area [
2,
9,
10],
- -
Driving dynamics (acceleration, braking, coasting) [
11,
12,
13,
14],
- -
regarding the running gear and suspension [
15,
16],
- -
concerning the properties of oils, greases, or tires [
2,
17],
- -
regarding comfort systems, air conditioning, power steering, telematics systems [
18,
19,
20].
The analysis of the literature shows unequivocally that the value of the components contributing to the increase in total energy consumption is significant, and their impact is over 12%. Therefore, this leads to an unfavourable increase in CO
2 emissions to the environment, where currently all car manufacturers calculate every gram of CO
2 emitted into the environment, considering the applicable emission standards. For example, an additional electric energy receiver in a 250 (W) car increases fuel consumption by 0.25 (l/100 km) in the case of combustion engines. The author’s work [
21] highlights the diversification of a car’s energy demand in real traffic conditions resulting from the dynamics of its acceleration. This problem is also described in works [
22,
23,
24,
25] concerning increased fuel consumption because of an aggressive driving style. In road tests, significant discrepancies in the mileage fuel consumption were found, ranging from 12.44 to 31.8 (l/100 km), which translates into the recorded energy expenditure from 1.67 to 4.29 (MJ) over a distance of a ¼ mile, depending on the dynamics of acceleration and choice gear ratios in the drivetrain. Choosing a gear ratio with lower values resulted in lower energy requirements with average drivetrain efficiency ranging from 19.38% to 24.6%. The values presented above are recorded for a car with an internal combustion powertrain (ICV) with a spark ignition, turbocharged combustion engine with a displacement of 1.2 dm
3, power of 85 kW at a speed of 5200–5400 rpm and an engine torque of 185 Nm at a rotational speed range of 1500–4000 rpm, with direct fuel injection into the combustion chamber. This aspect was pointed out by the authors Thomas et al. [
26] in the paper, where they compared the internal combustion vehicle (ICV) and the hybrid electric vehicle (HEV) powertrains based on driving style, showing that driving dynamics change energy expenditure. For ICV drivetrains, the fuel consumption differences are up to 74% and for HEV hybrid drivetrains the differences are 105%. On the other hand, Pitanuwat et al. [
27] compared energy expenditure under real-world driving conditions due to dynamics, showing fuel consumption gains for ICVs ranging from 80% to 113%, while for HEVs the differences ranged from 102.5% to 220%, with average cycle acceleration not exceeding 1.5 m/s
2.
In this context, other authors [
22] analysed data on the intensity of acceleration and braking from many vehicles. A wide segment of vehicles from motorcycles through to cars and trucks were analysed, finding a maximum acceleration range of 0.45–2.87 m/s
2 and average acceleration values were in the range of 0.2–0.82 m/s
2. The existing wide variation in acceleration has an impact on the energy expenditure. The works [
28] highlighted the variation in driving style in relation to the realized speed profile in real traffic conditions. It has been shown that the increase in driving dynamics causes an increased fuel consumption of up to 45% in urban traffic and 40% in non-urban traffic. The author of the dissertation [
29] determined the points of highest efficiency for the ICV combustion powertrain for fixed speeds of a Euro 5 car, indicating a speed of about 70 km/h for a diesel engine and 75 km/h for a gasoline engine, respectively. In the work of the author of the dissertation and others [
30,
31], the effect of different transmission systems was analysed, paying attention to AT (automatic transmission) and MT (manual transmission), where the points of maximum efficiency of the internal combustion powertrain were determined to be 24% at a fixed car speed of about 70 km/h. The author of the work [
32] drew attention to the length of the implemented driving profiles, showing an increase in fuel consumption relative to the distance travelled, at the same time paying attention to the losses the combustion engine obtained during winter, increasing fuel consumption by 14%.
It is predicted that over the next 30 years, the number of new cars produced in the world will increase by nearly 30% [
21], which will mean that there will be over 2 billion cars on the roads around the world. The new cars will be equipped with advanced powertrains in a single or hybrid system. However, regardless of the drive system used, electric motors powered by batteries (currently used) or future ones powered directly by fuel cells which will be widely used. From the chauffeur’s point of view, it is irrelevant, because what he requires from the car is a whole energy system and appropriate traction parameters. As to the basic traction parameters related to the car, which have a significant impact on the energy expenditure, we can include travel time of a specific road section, achievement of the assumed travel speed or obtaining appropriate traffic dynamics. On the basis of the energy balance, the total energy consumption of the car consists of the sum of energy supplied to the drive system (energy consumption of the car movement), the sum of energy losses in the drive unit, the sum of energy losses in the drivetrain, as well as the energy necessary to drive additional devices in the car. In this approach, regardless of the drive system used, the total energy consumption of the car depends on the influence of the components on the car in CARE, because smooth driving of the car on a good and flat road surface, with an ambient temperature of about 18 °C and without rain, significantly reduces the amount of energy required to overcome a given road section. The energy expenditure is not comparable for different types of cars, because they differ in terms of construction, but most of all in terms of weight and construction properties of the car.
The aim of the work is to analyse the total energy consumption of the car and analyse in terms of the total weight of the car and the distance travelled for the PHEV hybrid drive system, which operates in variable traffic conditions in a complex speed profile. Such a reference makes it possible to define the new unit index, as the total unit energy consumption of the car [
21]. This makes it possible to estimate the energy needed to drive a car weighing 1 kg over a distance of 1 m for the actual speed profile due to the participation of individual energy-generating components in the CARE system.
2. Total Unit Energy Consumption of the Car
The total energy consumption of the car is a measure of the energy expended from the storage tanks to fully drive the car with all secondary processes depending, inter alia, on the drive unit used now.
In the case of an internal combustion engine, the total energy (
ETf) expended to drive the car depends on the product of the amount of fuel consumed (
FC) and its calorific value (
WO), and is expressed by formula (1).
where:
FC—time consumption of fuel, (kg/s);
WO—calorific value of fuel, depending on its type (gasoline, diesel and others) (J/kg);
ts,p—time of beginning and end of energy calculation.
For an electric drive unit, the total energy (
ETe) is expressed by Equation (2), where, depending on the design of the electric motor, it results from the delivered instantaneous electric power from the electric motors
PE (W); determined as
PE =
U(
t)
I(
t) when supplied with direct current and
PE =
U(
t)
I(
t) cos
φ(
t) when supplied with alternating current.
where:
PE—instantaneous electric power, (W);
t—power consumption time (s).
The total energy consumption of the car in the case of a hybrid drive system is the sum of the energy spent from various storage tanks over time in accordance with Equation (3),
In the case of hybrid and electric drive systems, their additional advantage is the possibility of energy recovery in delayed motion, during coasting or braking, which is not included in Equation (3), because it supplements the energy storage, increasing its energy value and thus the range of the car.
For a simple car speed profile consisting of only the four basic phases of motion, the value of the total energy intensity of the car is calculated from start to stop, and the kinetic energy of the car at the beginning and end of a flat road section is equal to zero. Hence, in the energy balance of the entire car, the energy expended from the reservoirs is equivalent to the losses accompanying individual changes in the drive system and the resistance to movement of the car during the drive. Equation (4) shows the energy balance of the car, where on the left side of the equation is the total energy consumption and on the right the energy consumption of movement (
EM), i.e., the energy needed to overcome the car’s resistance to motion, energy losses of the drive unit (Δ
EE) and losses in the drivetrain-from engine to wheels (Δ
ED), as well as energy losses supplied to the drive system without transmitting to the driving wheels (Δ
EL), among others car standstill phase:
The listed components of the energy balance of the car are time-varying and depend on the profile parameter and the CARE system. The fundamental values of the speed profile parameters, expressed in terms of the average value of the cars speed
V, the road
L or the acceleration
a, depend on the contribution of each phase to the speed profile on a given road section. In practice, the occurrence of a simple velocity profile is uncommon. There are complex velocity profiles, where individual phases of motion are repeated many times. The mean values of velocity and acceleration of the car can be calculated from Equations (5) and (6), where the mean velocity of the complex profile is determined from dependence (5),
where (
i) is the number of straight modules;
a-average acceleration of the profile composed of the dependence (6),
or otherwise
By transforming the balance Equation (4), we can write the total energy consumption of the car as the quotient of the energy consumption of traffic in relation to the efficiency of the drive system (
ηP) over the length of the road section (8).
The total energy consumption of a car is often presented in (MJ) or per km or per 100 km. This reference is unreliable since it is related to a specific car and specific components of the CARE system, hence in many scientific papers [
21,
33,
34], the total energy intensity of the car is related to the mass and the distance travelled. Such a reference is defined as the total unit energy consumption of a car (9):
In contrast to the commonly used conversion rate per 100 km, such a rate allows a much more objective assessment and comparison of the energy requirements of cars with different constructional features and weights. Filling a certain speed profile of the car makes the total unit energy intensity of the car vary in a narrow range of values and is related not only to the car but also to the operation in a random environment and the users random driving style. In the physical dimension, the parameters of the total unit energy consumption of a car are presented in (m/s
2), which corresponds to the unit of average acceleration of the speed profile according to Equations (6) and (7). However, despite the same physical unit (m/s
2), each of them has different features and properties, because the average acceleration of the profile depends on the speed of the car and the total unit energy consumption of the car depends on the energy expenditure in the drive system. As indicated in [
35], there is a directly proportional relationship between the total unit energy intensity and the average acceleration during the car acceleration process, regardless of the acceleration dynamics.
3. Methodology
The analysis covered an advanced drive system with two energy storage (fuel and battery) as well as two independent drive units (combustion and electric) that operate within one drive system. For such a PHEV drive system, the total unit energy consumption of the car in the TTW (tank to wheels) system was determined, which is the sum of the influence of all components from CARE.
The influence of average speed, distance travelled by the car, type of energy carrier (fuel, electricity, and the influence of temperature on the unit energy consumption of a car) were analysed.
The analysis was broken down into individual drive units, determining the intensity ratio of the increase in energy used in relation to the distance travelled. The road sections were divided into three groups in terms of their distance:
I—short-distance runs up to 20 km—SDC,
II—medium-distance runs up to 70 km—MDO,
III—long-distance runs over 70 km—LDFD.
The groups were divided according to the type and scope of the energy storage. Road tests were carried out with a test car for any chauffeurs, with no imposed driving style. Speed profile parameters in the form of average speed, distance, and time as well as energy parameters in the form of fuel consumption or battery energy were recorded for each trip from start to stop. The ride from groups I and II were carried out with the 100% domination of the electric drive unit, as the range of the energy storage secured such a distance.
Despite the dominance of the electric drive unit, in situations involving a significant increase in power demand, the internal combustion drive unit was automatically connected to the drive system. The ride of group III was carried out with the use of two drive units, either simultaneously or in a separated arrangement resulting from the selected mode of driving the car. The maximum speed during the runs did not exceed 130 km/h, in accordance with the recommendations of the WLTP test (Worldwide Harmonized Light-Duty Test Procedure), against which the achieved energy performance was compared in real road conditions.
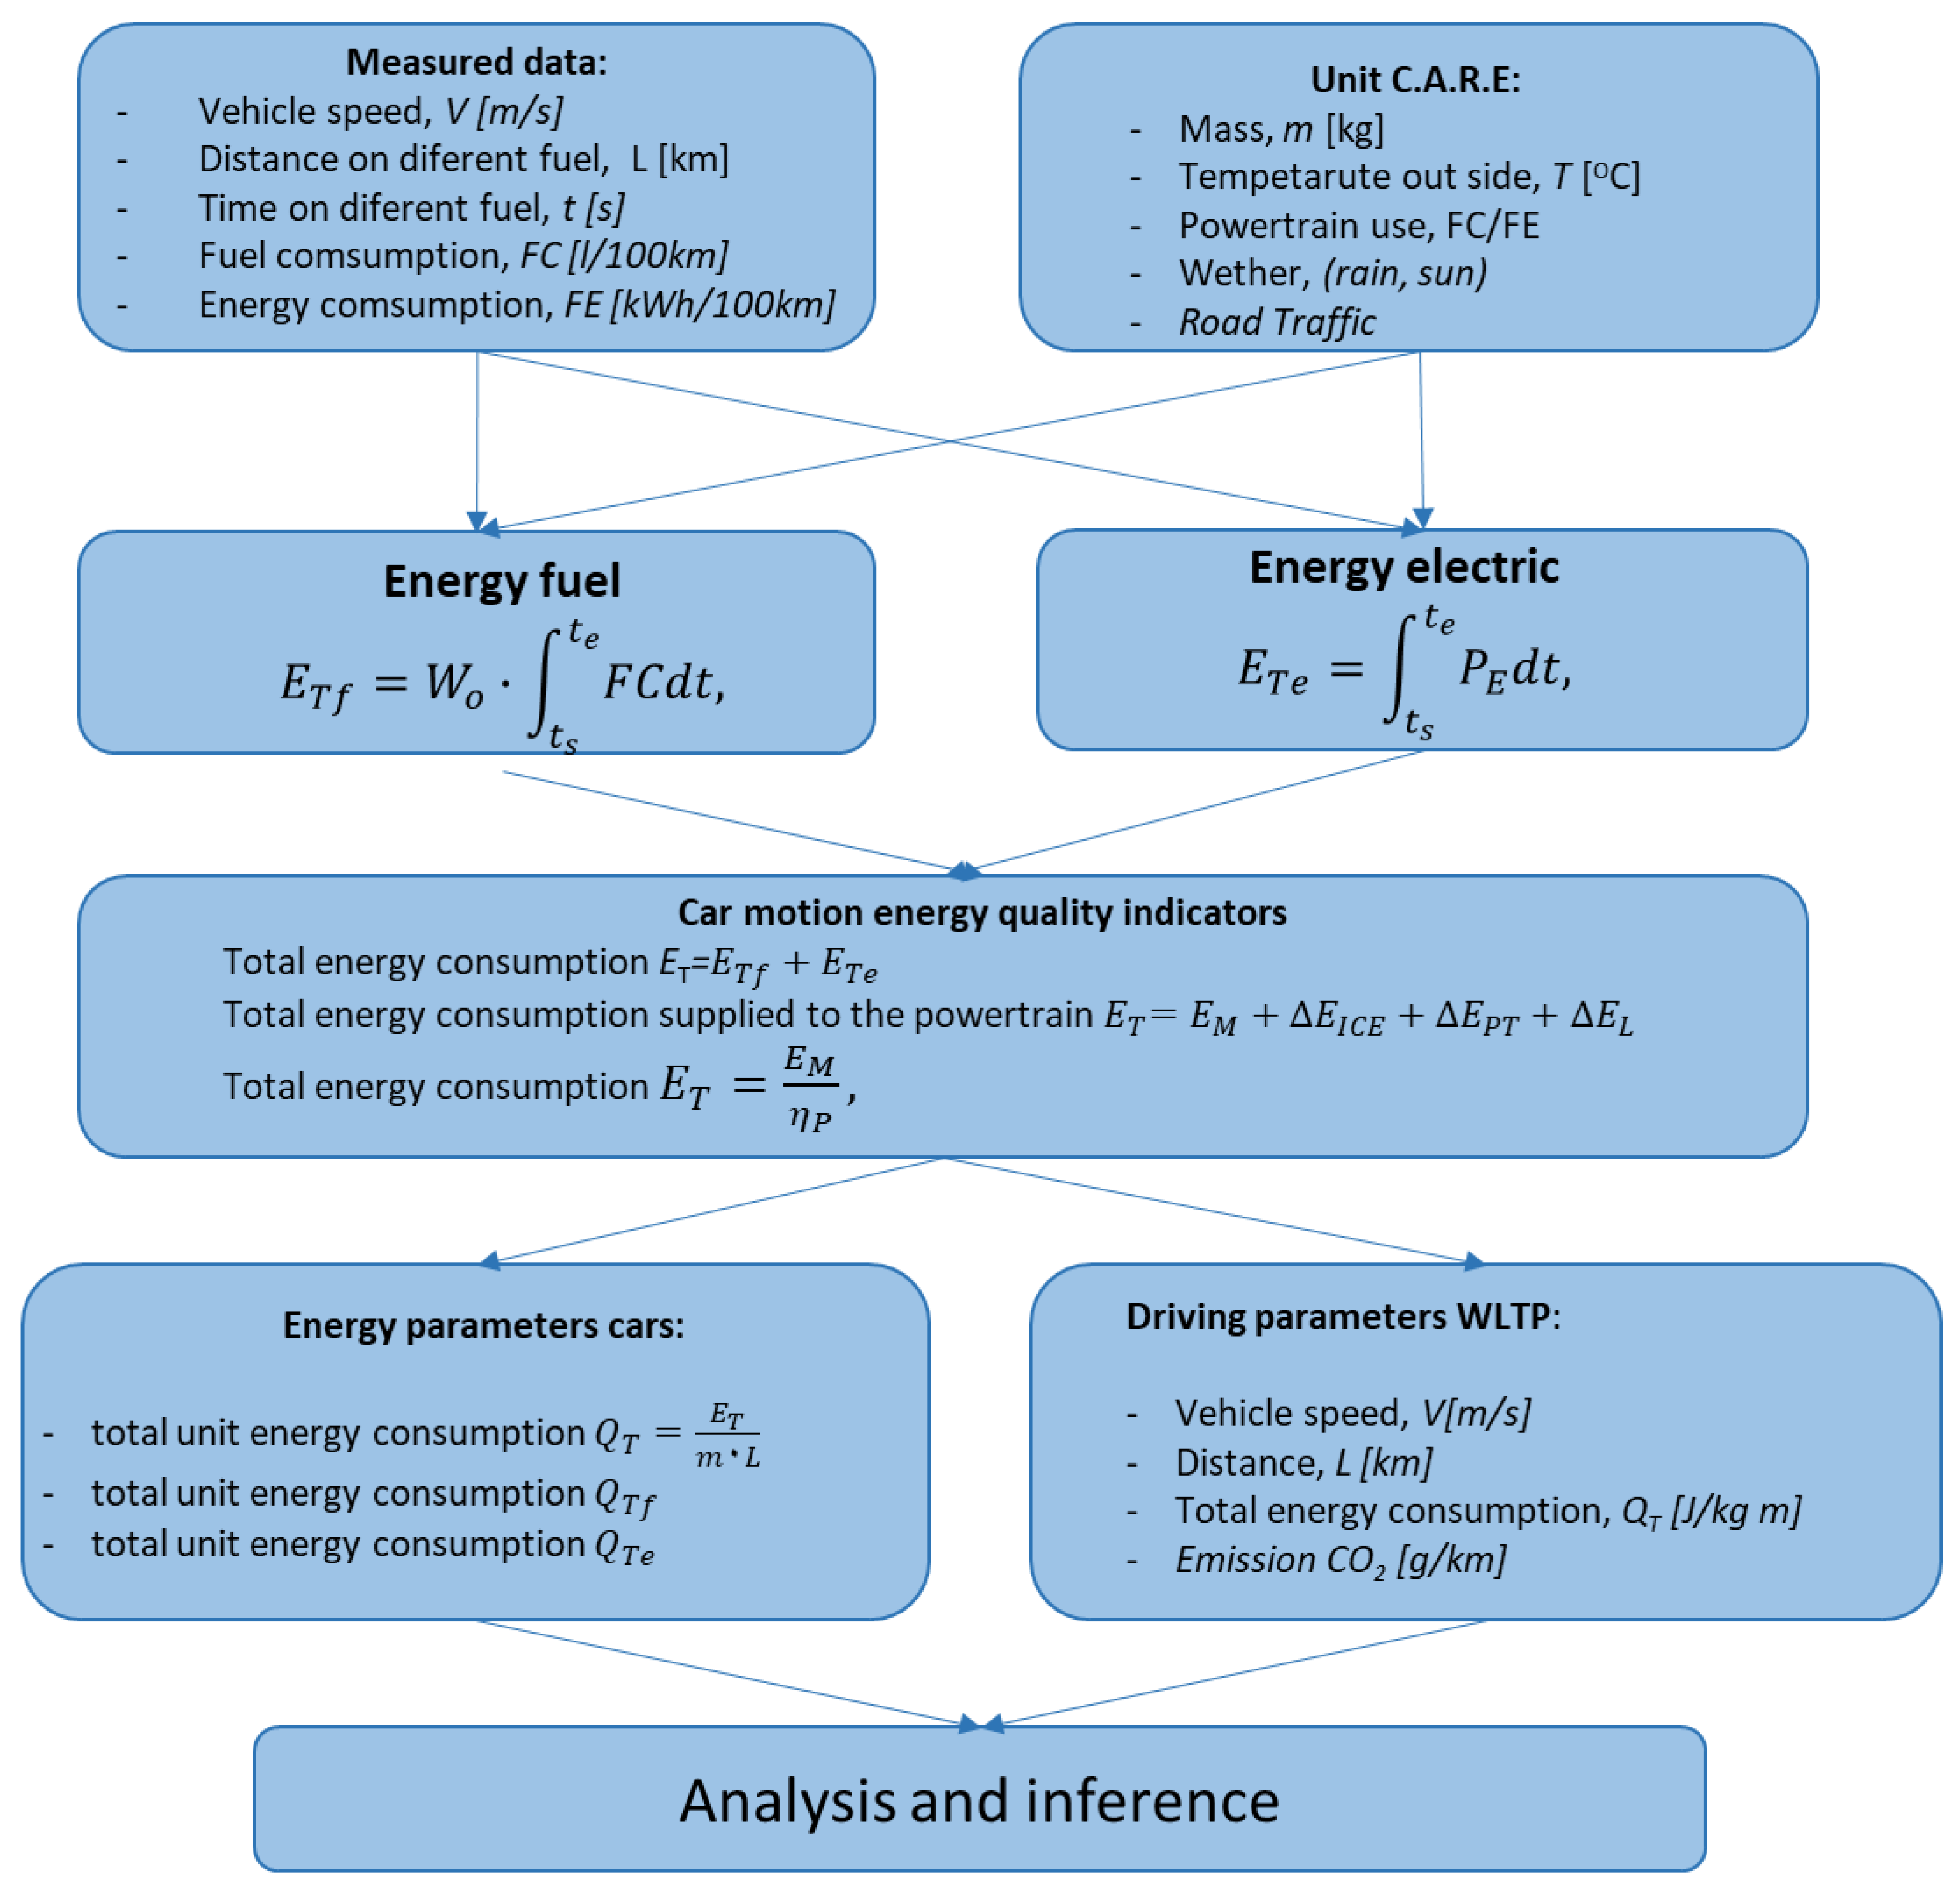
The recorded energy expenditure in the form of mileage and energy consumption per 100 km of the road travelled, was converted into the total unit energy consumption of the car in the TTW system, taking into account the overall energy losses in the car’s drive system. This is a different methodological approach that is presented in the flowchart in
Figure 1.
The use of instantaneous traction or energy parameters in the form of average values for speed or distance and energy consumption is, due to the variety of power units used, unreliable in a direct comparison. There is no way to compare the direct fuel consumption in litres per 100 km to the electricity consumption in kWh per 100 km in terms of the consumption of these energy carriers from the reservoirs. To compare, it is necessary to convert the energy delivered to the drive system per km or 100 km of the distance travelled. Such a comparison in terms of energy expenditure is effective if two identical vehicles are analysed. In the case of the same vehicles, but differing in weight, for example due to the number of passengers, these parameters will differ from each other and are incomparable.
Therefore, during the analysis, attention was paid to the new unit energy consumption index of the car, which is a reference to the energy expenditure from the reservoir in relation to the weight of the car and the distance travelled, regardless of the drive unit used. Until now, in the dominance of internal combustion engines, the key parameter related to the qualitative analysis of traffic was the traffic energy consumption indicator, considering only the energy expenditure for the propulsion phase. This assumption is correct only in the case of the comparison of homogeneous classic combustion propulsion systems. The use of an additional other source of energy complicates the analysis and is not reliable.
5. Research and Analysis of the Total Unit Energy Consumption of a Hybrid Car
The study of the total unit energy consumption of a car was carried out in real traffic conditions, dividing the road test sections into three run groups.
The average traction and energy parameters of the car for the analyzed runs are summarized in
Table 2.
In groups I and II, the electric motor powered by the battery was the dominant drive unit, when power has increased in the system there has been a momentary activation of the combustion engine, co-driving the vehicle drive system in the PHEV operation mode. The recorded values of the mileage fuel consumption in both groups are at a low level, not exceeding the fuel consumption of 2.0 l/100 km. However, the conversion of the fuel used in the total unit energy consumption of the car for the internal combustion drive system causes these values to be higher than the total unit energy consumption of the car for the electric drive (
Table 2). In first run group, this situation took place in 40% of them, and in second run group, this was the case in 30% of them (
Figure 2). The energy parameters of the car’s operation in groups I and II, using only an electric drive unit, are presented in
Table 3.
The average parameters of runs in a particular group in the mode of a fully discharged electric energy storage, when the car was driven only by an internal combustion unit, are presented in
Table 4.
Some of the runs in groups II and III were carried out with both power units of the car. The summary of the time density histograms allowing to determine the speed dominance during the runs and the dominant total unit energy consumption of the car is shown in
Figure 2. The presented data indicate the dominant speed of the car in the range: average speed in the range of 50 km/h to 60 km/h over a distance in the range of 28 to 53, for a period of 28 to 53 min, with increased expenditure (
Figure 2).
In all tested mileages in individual groups (
Figure 3), in the real conditions of the car traffic, significant differences were noted in the mileage consumption of energy from the storage tanks, resulting from energy density. The presented direct comparison of the waveform fuel consumption or the waveform electricity consumption is difficult to compare directly due to the energy density values of energy carriers (
Figure 3a). From this point of view,
Figure 3b) shows a division in relation to the total energy consumption in individual run groups. Particular attention should be paid to groups II and III. In group II, the use of the combustion engine is occasional but in group III is significant, it depends on the run range and the energy availability in the electric storage.
Taking the groups of car runs into consideration, the highest total energy consumption is shown with driving a car with an internal combustion engine. The average increase in energy expended in the internal combustion drive system is approximately 3.05 MJ for each kilometer traveled. These values are on average 4.2 times higher than the energy consumption related to the electric propulsion system, for which the average value of energy consumption per kilometer of the traveled distance is 0.72 MJ.
Figure 4 also shows the average value of the total energy consumption for all runs for the PHEV hybrid system, which is 1.23 MJ/km. In terms of the energy consumption resulting from the WLTP cycle for the test car, it is 1.09 MJ/km and is lower by 12.8% at an average speed of 47.1 km/h and a distance of 49.9 km (
Table 2). Therefore, the average parameters recorded for runs in real road conditions, including all runs from groups I–IV, correspond to the distance traveled by the car and is twice as large as in the WLTP test, where the test section is 23.25 km, but with an average speed of the car on a similar level 46.5 km/h. It should be noted that the above-standard energy consumption for all runs (
Figure 5) concerns mileages over 140 km, which significantly exceeds the range of the electric drive storage tank. Hence, in relation to runs only from group II, where we have similar average speeds and the mileage does not exceed the range of the electric energy storage, the energy consumption is 0.52 MJ/(kg·m) and it is 11.7% lower than the limit achieved by the test car in the WLTP cycle (
Figure 5a).
Dependencies presented in
Figure 5 were related to the achieved WLTP standard, where the average values of the total unit energy consumption of the car for the groups were plotted on the background of the runs. The runs implemented to the capacity range of the electricity storage are below the WLTP consumption standard. The presented total energy consumption per unit of a car varies within a wide range and depends primarily on the range. There is only one run in group III that has met the energy consumption requirements of the WLTP cycle. However, this is since during the test drive, a quick charger was used, and the electric energy storage was supplemented.
The determined coefficients of energy consumption increase in relation to the distance traveled for the tested car, presented in
Figure 4, allow for the estimation of the parameters of the car’s operation on the selected crossing and road section. In this case, after transforming Equation (9), it is possible to calculate the energy consumption, costs, CO2 emission in the TTW system for various variants of the ICV, EV or PHEV drive systems. For example, the average energy consumption for a distance of 50 km is presented in
Table 5.
In the case of the test car, the use of the drive in the hybrid configuration enables the achievement of results consistent with the WLTP test (
Table 5). For example, covering a distance of 50 km results in an energy expenditure of 36.3 MJ for the electric drive system of the EV, while using only the internal combustion engine increases the energy expenditure by more than 4 times to 152.5 MJ. Assuming high efficiency of the electric drive system, in relation to this drive, the internal combustion drive is characterized by efficiency at the level of 24%. During the research, attention was paid to the relationship between the capacity of the electric energy storage and the ambient temperature. The values of the total unit energy consumption of an electric car presented in
Figure 6 show an increase in electricity consumption at low ambient temperatures. The increased wear recorded during the tests confirms the problem of reducing the range with a temperature drop described in the literature.
Attention should be paid to the total energy consumption per unit of an electric car, where the energy consumption at minus temperature (−15 °C), is more than twice that at plus temperature (15 °C). In sub-zero temperature conditions, the range of the car has decreased, and the real distance travelled was only 21 km, after which only the internal combustion engine (ICV) is available. For the tested car, based on the obtained results of energy consumption, it was simulated using the coefficient of energy increase in relation to the road (
Figure 4) with changing outside temperature (
Figure 7).
The simulation of the difference in energy expenditure presented in
Figure 6 is consistent with the results obtained from the experiment. The lowest energy expenditure up to 50 MJ is ensured only by the electric drive, but its range depends on the ambient temperature.
In the works [
7,
26,
27,
34], the unit (kWh) is used to compare the energy consumption of different cars, which is converted into the distance traveled. For standard cycles such as WLTP, this unit can be used because the test runs under strictly defined profile traction parameters (speed and acceleration over time). However, in the case of the studies described in [
10,
27,
28,
36,
37], the topic of discrepancy in energy consumption and road emissions of the substances contained in exhaust gases is raised. According to the author, these values cannot be directly related to changes in the kinetic energy in the cycle resulting from the mass of cars because mass is one of the main factors in determining energy consumption in CARE. In the work of Pielech et al. [
34], the analysis of energy consumption of a car with a hybrid PHEV drive system in different real driving cycles (RDE) was compared. They determined the energy consumption in (kWh) or per 100 km distance traveled. They showed an increase in energy consumption in the real road cycle compared to the test for each of the car’s drive units. At the same time, in the work [
26] the waveform energy consumption recorded in the tests in the case of the combustion drive system is almost three times higher than the consumption for the electric drive system. These values are comparable with the results obtained by the authors of the research [
21,
38,
39], but here they are referred to the index unit of the unit energy consumption of the car.
The characteristics presented in the energy expenditure of the car include the different components of the CARE system resulting from the driving dynamics, the environment, the road, and the powertrain used. Using these data, it is possible to estimate the cost of operating a vehicle over a distance of 100 km. The differences between the use of an electric or combustion unit are significant. The cost of operating the car with the use of only the combustion engine is 3.7 times higher in the TTW system. The traction and energy parameters of the tested car for the entire period of the analysed runs over a distance of 5131 km are summarized in
Table 6.
The parameters of the total unit energy consumption of the car increased in relation to the PHEV hybrid drive in group II, due to the increase in the share of the combustion engine to 63.9% of the total operating time. These parameters are accumulated from the beginning of the test and calculated from one trip to another as average values. Despite the significant, aforementioned increase in weight of the test car with a hybrid drive system by nearly 300 kg, its average fuel consumption over the entire distance of the tested car was 2.78 l/100 km. In terms of the new regulations to limit CO
2 emissions from 2021 at 95 g/km [
36,
40], the calculated road emissions of the analysed car are 63.9 g/km and is lower than the permissible limit by 32.6% in the TTW system.
6. Conclusions
The analysed total unit energy consumption of a car with a hybrid drive system (PHEV), presented in the article, while driving in real traffic conditions on the road, shows its different values depending on the drive unit used at a given moment whether internal combustion or electric. Particularly noticeable is the variation in energy consumption between individual drive units, which is shown in
Figure 4, and this is due to the energy density of the energy carrier stored in the storage to power them, as well as the lack of thermodynamic changes in the case of an electric drive unit resulting from fuel combustion. In relation to the presented analysis, we can formulate the following conclusions:
the total unit energy consumption of a car is a good new indicator that allows you to compare individual drive systems, regardless of the drive unit used and the distance travelled;
combustion drive systems are characterized by a significantly higher total unit energy consumption index in the TTW system, resulting in a 3.4 times higher energy consumption;
the total unit energy consumption of a car in all journeys depends mainly on the share of individual drive units during driving and in the average value it is higher by about 30% compared to the purely electric car (EV) drive;
the total energy consumption of the car in real traffic conditions is consistent with the energy consumption resulting from the WLTP cycle and amounts to 0.53 (J/(kg * m)) but only for the second group of journeys, characterized by a higher speed of travel and the availability of energy from the reservoir;
the road emission of carbon dioxide during all journeys is 63.9 g/km and in relation to the currently applicable EURO 6d standard in 2021, this emission is 38% lower;
there is a noticeable impact of the ambient temperature on the total unit energy consumption of the car, causing it to double at −15 °C.
The presented variability of the total unit energy consumption of a car with a hybrid drive system (PHEV) shows the benefits of using this type of advanced drive system, in relation to the car’s internal combustion drive system. It is a promising technical solution, especially in terms of reducing CO2 emissions into the environment. It allows the chauffeur to maintain energy independence on the road in terms of the depletion of the electric energy storage. In the car, the chauffeur is the main factor determining energy consumption in the TTW system, and it is it that which determines the dynamics and speed of the ride.
However, the behaviour of good energy indicators on longer journeys is related to the charging system. The average charging of the electric energy storage for the test car, from 0 to 100% of capacity, is for:
- -
220 V alternating current (AC)—up to 2.2 kW charging power takes about 5.5 h;
- -
380 V AC—up to 7.8 kW charging power takes about 1.5 h;
- -
direct current (DC) voltage CCS—up to 22 kW takes about 0.5 h.


