Article

Hygrothermal and Acoustic Performance of Two Innovative Envelope Renovation Solutions Developed in the e-SAFE Project

1
Department of Electric, Electronic and Computer Engineering, University of Catania, 95100 Catania, Italy
2
Department of Civil Engineering and Architecture, University of Catania, 95100 Catania, Italy
*
Author to whom correspondence should be addressed.
Energies 2021, 14(13), 4006; https://doi.org/10.3390/en14134006
Submission received: 8 June 2021 / Revised: 22 June 2021 / Accepted: 29 June 2021 / Published: 2 July 2021
(This article belongs to the Special Issue Challenges and Research Trends of Building Energy Performance)

Abstract

:
In order to reach the ambitious decarbonizing goals set by the European Union for 2030, deep renovation of the existing European building stock is a key issue. Within this context, the recently funded H2020 project “e-SAFE” is investigating market-ready wooden envelope renovation solutions for non-historic buildings, which encompass both energy and seismic improvement. The research carried out in the project aims at developing, testing and demonstrating these solutions on a real pilot. More specifically, this paper presents preliminary analyses to verify that the solutions satisfy the requisites set by the national regulations in force in most European countries, in terms of hygrothermal and acoustic performance. The analysis, carried out following relevant technical European Standards and based on calculations, considers different climate conditions and existing wall structures, selected amongst those most commonly adopted in Europe. The results show that the addition of a Cross Laminated Timber (CLT) layer with some wooden-based insulation on the outer side allows reaching very good thermal and acoustic performance. However, interstitial condensation may occur in cold climates under high indoor humidity values. This aspect deserves further investigation accounting for the transient behavior of the walls and all vapor transport mechanisms.

1. Introduction

Recent data available on the EU building stock database highlights that around 90% of the current EU buildings was built before 1990 [1]; moreover, one third (35%) of them are over 50 years old, and more than 40% were built before 1960 [2]. This implies that more than 75% of the building stock is energy inefficient, according to the current building standards, since they were built when no regulations regarding energy performance were in force [2]. This calls for a massive renovation of the building stock.
The urgent need of renovating the European building stock has also emerged in the EU communication “Renovation Wave for Europe—greening our buildings, creating jobs, improving lives”. In this strategic document, the EU announces the ambitious goal of doubling the annual renovation rate of buildings by 2030, with particular emphasis on deep renovation, i.e., those renovation solutions implying primary energy savings higher than 60%. Currently, the annual energy renovation rate in Europe amounts on average to just 1%, but deep renovation is carried out only in 0.2% of the building stock per year, and in some regions this practice is even virtually absent [3].
However, energy inefficiency is certainly not the only problem faced by the European building stock. In fact, nearly 50% of the European territory is earthquake-prone [4]: in seismic countries, in the face of a destructive earthquake, any solution addressing only building decarbonization will turn out to be unsustainable, from social, economic and environmental points of view. In these countries, energy renovation actions must therefore strategically combine with seismic retrofitting. Furthermore, energy poverty remains a major challenge: indeed, it is estimated that in Europe around 34 million people are unable to afford keeping their home adequately heated [3].
In conclusion, building renovation can be a chance to generate social, environmental and economic benefits. With the same intervention, buildings can be made healthier, greener, interconnected within a neighborhood district, more accessible and resilient to extreme natural events [2]. Improving the attractiveness of deep renovation through such non-energy-related factors is then imperative, but this requires reliable and accessible technical and financial solutions.
In this context, the recently funded H2020 project called e-SAFE (“Energy and seismic affordable renovation solutions”) proposes a new deep energy renovation system aimed at the improvement of the external cladding of low-performing non-historic buildings with a new performing “skin” based on modular, customizable, prefabricated, multifunctional panels (e-PANEL) with low environmental impact. These panels are made of a timber structure combined with local insulating bio-materials (hemp, cork, wood fiber, cellulose fiber, sheep wool, etc.), and finished by the desired cladding.
The use of prefabricated timber panels for the external cladding of existing buildings has been already explored by various research projects such as the smartTES (“Innovation in timber construction for the modernization of the building envelope”) [5], with demonstrations realized in different continental and northern Europe locations (e.g., the surroundings of Munich in Germany and the city of Oulu in Finland), and P2Endure (“Plug-and-Play product and process innovation for Energy-efficient building deep renovation”) that developed a wooden substructure allowing the integration of water ducts and pipes, air supply or/and even ventilation channels, as well as heating and cooling functions [6]. Both projects led to the commercialization of the technologies.
However, in earthquake-prone countries, seismic improvement is also required. For this reason, the prefabricated wooden-based panel (e-PANEL) proposed by e-SAFE can be coupled to a structural system that increases seismic resilience, called e-CLT. This consists of adding cross laminated timber (CLT) panels including an insulating material layer to the outer walls, to be combined with e-PANELs and connected to the existing reinforced concrete (RC) frame via energy dissipation devices (dampers).
The e-SAFE project also envisages the introduction of innovative technical systems to achieve deep renovation levels; however, technical systems are not within the scopes of this paper. Instead, the paper reports about the preliminary research activities aiming at calculating the hygrothermal and acoustic performance of e-PANEL and e-CLT when applied to three existing wall structures typically used in non-historic buildings in Europe. The research should clarify whether the proposed solutions are not suitable in specific European countries, and in this case highlight any necessary technical improvement to achieve the expected level of thermal and acoustic performance. The investigation considers a variety of climatic conditions and includes a comparison with the normative prescriptions in force in various European countries, thus showing the expected applicability potential.
The results discussed in this study will serve as a guideline during the design stage of the pilot building that will be renovated during the project to demonstrate the effectiveness of the e-SAFE solutions.

2. Methodology

This section reports on the methods employed to calculate the thermal and acoustic parameters that characterize both existing typical wall structures in European countries and their renovation with e-PANEL or e-CLT. Specific reference is made to relevant national regulations in force when dealing with building renovations, in order to show the potential applications of the e-SAFE cladding solutions.

2.1. Stationary and Dynamic Thermal Parameters

There are various thermal parameters concerning the building envelope’s thermal performance and recalled in law requirements or building codes of European countries. Amongst these parameters, the thermal transmittance of a building component—also known as U-value—is the most prominent because it measures the heat transfer rate through the building’s shell in steady-state conditions. In fact, the U-value is defined as the amount of heat transferred through a unit surface of the component under a unit temperature difference between the environments separated by the component itself (W∙m−2∙K−1). The thermal transmittance can be calculated for every building element through the mathematical relation reported in the EN ISO Standard 6946:2017 [7]:
U = ( 1 h out + i   =   1 n s i λ i + R gap + 1 h i n ) 1
Here, hin = 7.7 W∙m−2∙K−1 and hout = 25 W∙m−2∙K−1 are the internal and external combined heat transfer coefficients, respectively.
Many European countries impose threshold U-values and diversify them in case of new constructions and building renovations. These thresholds are assigned according to the peculiar climate conditions of the different regions, as summarized by the Heating Degree Days (HDDs), which are defined as the summation of all the positive differences between a conventional indoor set point temperature (Tin) and the average daily outdoor air temperature (Tout) over a defined heating period Δτ:
H D D = j [ ( T i n T o u t , j ) · Δ τ j ]   ( ° C   day )
For instance, the conventional indoor set point temperature for residential and office buildings is set to 20 °C in Italy and 19 °C in Turkey. The national territory is classified into six climate zones ranging from A (warmest) to F (coldest) in Italy (see Figure 1), and a similar scheme—but with fewer climate regions—is adopted also in Greece, Spain and Turkey as shown in Table 1. Then, Table 2 reports the threshold U-values for various envelope components when subject to renovations in different European countries.
Along with the stationary U-value, the EN ISO Standard 13786:2017 also defines other parameters that characterize the dynamic performance of a wall, such as the periodic thermal transmittance YIE (W∙m−2∙K−1), the attenuation factor fa (non-dimensional, also known as decrement factor), the phase shift ϕ (h) and the specific internal areal heat capacity κi (kJ∙m−2∙K−1) [23]. These parameters are useful for describing the thermal behavior of the various building components when they are subject to periodic boundary conditions, i.e., variable heat flow rate or temperature profiles on one or both of their boundaries. This issue is particularly relevant in summer because of the combined action of variable solar radiation and air temperature values exerted on the wall.
If referring to a typical (daily) cyclic excitation with a 24-h period (Figure 2), the periodic thermal transmittance (YIE) is the ratio of the amplitude of the transferred heat flux to the amplitude of the temperature excitation, while holding a constant indoor temperature (see Figure 2 for a graphical representation [24]).
A national regulation in Italy states that external walls must have YIE < 0.10 W∙m−2∙K−1 [19]: this condition applies to new buildings and when more than 50% of the building envelope is renovated. However, this condition does not apply to north-facing walls and in those locations with average horizontal solar irradiance lower than 290 W·m−2 during the month with highest insolation.
On the other hand, the decrement factor fa is the ratio between the periodic and the steady thermal transmittance. The lower the value, the higher the attitude of the wall to attenuate the heat wave transferred inside [25].
The phase shift ϕ is the time lag between the peak outdoor temperature and the peak heat flux transferred indoors under dynamic conditions (Figure 2). Walls with excellent dynamic thermal performance have a high phase shift (ϕ > 12 h), whereas ϕ < 6 h means poor dynamic thermal performance. A recent study suggested that phase shift is the most relevant dynamic thermal parameter, and that, in hot regions of Spain, ϕ > 15 h should be achieved: in this case, the thermal transmittance U is not the most relevant factor in the thermal design of a wall [26].
Finally, the internal areal heat capacity κi measures the heat stored by a unit surface of a wall under a unit indoor air temperature fluctuation with a 24-h period. A wall with high internal areal heat capacity has a high potential for thermal storage on its inner side, which helps to attenuate the indoor overheating produced by intense heat gains and to improve the indoor thermal comfort in summer. For instance, according to Di Perna et al. [27] κi > 50 kJ∙m−2∙K−1 can be regarded as a good performance level, especially when YIE ≤ 0.03 W∙m−2∙K−1, while they suggest κi > 70 kJ∙m−2∙K−1 when YIE ≤ 0.07 W∙m−2∙K−1. Furthermore, a recent Italian regulation [28] states that all newly built public buildings in Italy must have κi > 40 kJ∙m−2∙K−1. The internal areal heat capacity mainly depends on the features of the materials located on the inner side of the wall, and usually is not significantly affected by outer insulating materials [29].
It must be observed that, despite the importance of periodic thermal properties—especially in warm Mediterranean regions—so far many European countries have ignored them in the legislation regarding energy performance of buildings, while Italy remains an exemplary case within the European context [26].

2.2. Internal and Surface Vapor Condensation

Surface condensation and mold growth on the internal surface of building components are directly related to their surface temperature, which in turn depends on the U-value of the components and the presence of thermal bridges, as well as on the psychrometric conditions of indoor air. The standard approach employed to assess the risk of surface condensation and mold growth is defined in the EN ISO Standard 13788 [30] that introduces the so called “temperature factor” (otherwise known as f-factor), a bulk index that describes the thermal quality of an envelope component in terms of surface condensation and mold formation avoidance. It can be calculated according to Equation (3):
f R S I = T s i T o u t T i n , o p T o u t
Here, Tsi is the internal surface temperature, while Tin,op is the indoor operative temperature calculated as the arithmetic mean of the air temperature and the mean radiant temperature of the room. The f-factor calculated in this way is then compared to minimum allowable temperature factor fRSI,min derived by imposing a threshold condition for the surface relative humidity. The critical relative humidity values considered by the European national regulations range from 75% in Sweden to 100% in Bulgaria, most frequently being 80% as prescribed in Germany, Italy and Spain. In other countries, such as in Denmark and UK, the surface condensation and mold growth risks are instead taken into account indirectly through the prescription of a maximum U-value.
However, condensation can also take place in the inner layers of a building component, and it would not be visible from the outside. In this case, the approach prescribed by the EN ISO 13788 Standard only considers the vapor diffusion mechanism generated by the difference in partial vapor pressure between the indoors and the outdoors and can be appraised through the Glaser’s method yet pertaining to the steady-state regime. This kind of assessment is generally conservative for typical indoor conditions, while more detailed analyses accounting for other transport mechanisms—such as vapor convection, capillary transport and surface diffusion—may be reserved just to worst cases. For this reason, this research considers only the vapor diffusion mechanism and relies on the Glaser’s method prescribed by the EN ISO 13788 Standard.
For a multi-layer construction assembly, the Glaser’s method prescribes to first set reference conditions indoors and outdoors; in this research work, indoor air temperature is set to 20 °C when heating, while it coincides with the outdoor air temperature value in the remaining of the year (a lower threshold of 18 °C applies in case of particularly cold outdoor conditions). The indoor vapor content is instead defined as a function of outdoor conditions and internal vapor production rate, which depends on the intended use of the indoor space (e.g., offices, spaces with or without a mechanical ventilation system, kitchens, etc.). The amount of condensate predicted through the Glaser’s method should then be lower than the threshold values reported for various materials in Table 3, while for other materials it should be always below 500 g·m−2.
Since vapor production from indoor sources can significantly influence the hygrothermal performance of the walls, both the suggested “vapor class production 3”—i.e., houses without mechanical ventilation and with unspecified occupancy pattern—and the more demanding “class production 4”—i.e., gyms, kitchens and canteens—are taken into account in the hygrothermal analyses.

2.3. Acoustic Parameters and Descriptors

Building acoustic regulations most often apply to new buildings only, including buildings converted to other uses, while usually they do not apply to renovated buildings with unchanged use profile. However, in case of important building refurbishment, some local regulations require the same level of acoustic quality as for a new building. Furthermore, many European countries have introduced a voluntary classification scheme for the acoustic performance of buildings, where gaining the top classes implies that the acoustic quality outperforms new buildings. In this paper the acoustic performance of the proposed renovation solutions is compared to the acoustic requisites for new buildings—even if these are not strictly binding in case of building renovation—in order to ensure high indoor acoustic comfort.
When dealing with the sound insulation of a building façade, the national building regulations in force in the European countries make use of many different descriptors. These can be divided into two main categories, namely:
  • Descriptors referring to the sound insulation capacity of the façade itself.
  • Descriptors referring to the sound pressure level ensured indoors, and thus indirectly measuring the sound insulation capacity of the façade.
While in the first category the numerical value of the descriptor depends only on the properties of the façade components, in the second case the outdoor noise level has also a relevant role, and this means that a certain façade solution can turn out to be unsuitable in noisy urban areas while being acceptable in quiet peripheral areas. Table 4 resumes the main descriptors that are used to measure the sound insulation performance of façades in Europe, whereas Table 5 reports the corresponding thresholds holding in tehmain European countries. All descriptors are measured in dB, and they must be verified on-site after the building construction (or renovation); the measurements must be performed according to the procedures described in the EN ISO 16283-3 Standard [31].
It is useful to outline some relevant issues related to the descriptors listed in Table 4. For instance, Equation (4) correlates the A-weighted indoor day–evening–night noise level (Lden) to the A-weighted equivalent indoor sound pressure levels measured in three different periods of the day. It contains correction factors to account for the increase in the perceived noise level in the evening (+5 dB) and during night time (+10 dB):
L d e n = 10 · log [ 1 24 · ( 12 · 10 ( L A e q , 7 19 ) 10 + 4 · 10 ( L A e q , 19 23 )   +   5 10 + 8 · 10 ( L A e q , 23 7 )   +   10 10 ) ]
Furthermore, Equation (5) expresses the standardized level difference (DnT) of a façade as the difference between the outdoor and the indoor equivalent sound pressure levels, corrected through the reverberation time (T60) measured in the indoor space (T0 = 0.5 s is the reference reverberation time):
D n T = L A e q ( o u t d o o r ) L A e q ( indoor ) + 10 · log ( T 60 T 0 )
The mathematical procedure to calculate the weighted value (DnT,W) starting from the measured spectrum of DnT is reported in the ISO 717-1 Standard [43], as well as the procedure to determine the spectrum adaptation term for traffic noise (Ctr). It is here worth reminding that Ctr usually takes negative values (commonly ranging from −4 to −9 dB), which operates on DnT as a decreasing factor.
Finally, Equation (6) correlates the weighted standardized level difference (D2m,nT,W) to the weighted apparent sound reduction index (R′W) [44]:
D 2 m , n T , W = R W + Δ L f s + 10 log ( 0.16 · V T 0 · S t o t )
Here, V (in m3) is the volume of the indoor space behind the facade, Stot (in m2) is the surface of the facade and ΔLfs (in dB) is a correction term that roughly accounts for the presence of balconies and overhangs that modify the sound field close to the facade (ΔLfs = 0 dB in case of a plane façade, ΔLfs = 1 ÷ 2 dB in case of balconies with parapets). Equation (6) is particularly useful in the design stage for a preliminary assessment of the weighted standardized level difference.

3. The Proposed Envelope Solutions

3.1. Typical Configurations for External Walls in The European Context

The wall structures selected for the preliminary hygrothermal and acoustic analysis of the e-SAFE envelope components are those reported in Table 6. Wall structure ID1 is typical of single-family houses and terraced houses built throughout Europe, and in particular in Northern Europe, up to 1980. Wall structure ID2 is made of two leaves of hollow clay bricks and is peculiar of multi-family houses and apartment blocks built in warmer Mediterranean countries from 1945 to 1980. Wall structure ID3 was employed mostly throughout Europe especially in multi-family houses and apartment blocks built between 1945 and 1980.
These assemblies are taken from the final report of the EU Tabula project [45], and are representative of a large share of the non-historic EU building stock, which is the main target of the e-SAFE renovation strategy.
Given the wide variety of construction techniques found throughout Europe, these external wall configurations are only indicative of likely wall typologies found in various non-historic buildings in EU countries. As such, they do not aim to cover all the possible existing configurations, but rather to provide an indication of likely target walls for the application of the e-SAFE envelope solutions.

3.2. The Proposed Envelope Solutions

The envelope solutions for renovation proposed by e-SAFE try to conjugate energy savings with the need to minimize occupants’ annoyance, implementation costs and the time needed on-site for installation, while also addressing the seismic resistance improvement. This is accomplished through the development of customizable, prefabricated, plug-and-play, multifunctional panels respectively called e-PANEL (energy efficiency improvement only) and e-CLT (energy and seismic resistance improvement). These will be applied first to a pilot building located in Southern Italy that will be renovated during the project and will fully comply with Italian laws.
On the one hand, the e-PANEL is made up of a timber-framed structure combined with local bio-based recyclable (or recycled) insulating materials and finished by customizable cladding material. The pre-assembled modular panels also include high-performance double-glazed windows, which replace the existing ones. The new windows are thus integrated in the prefabricated e-PANELs and are equipped with solar blinds to reduce indoor overheating in summer, avoid glare risks and enhance visual comfort. The choice of the insulating material is oriented either to locally available bio-based materials (e.g., wood fiber, cork) or to materials with a high recycling rate (e.g., cellular glass), with a consequent reduction of the carbon footprint of the renovation project. In this view, polystyrene and mineral wool will in principle be avoided. The insulation thickness is set according to the climate, the current state of the building and the desired level of performance.
On the other hand, the e-CLT consists of applying CLT panels on the outer side of the existing walls, by connecting them to the RC structure through innovative dissipative devices for the sake of seismic performance. The use of CLT panels for structural reinforcement of existing buildings has shown great potential, thanks to the high strength and stiffness of this engineered wood product. The dissipative devices are being developed and tested within e-SAFE [46], and their final version will be described in upcoming papers.
The e-CLT, like the e-PANEL, further integrates local bio-based and/or recyclable (or recycled) insulating materials plus a customizable cladding. Size and number of CLT (structural) panels applied on the façade are established based on the initial seismic deficiency of the building and the assumed target performance. Hence, (non-structural) e-PANELs can be combined to e-CLTs to complete the envelope of the building by retaining an aesthetic uniformity: in this case, they will of course have the same overall thickness. The result is a new performing envelope—applied to the existing one—that concurrently improves the energy, seismic and aesthetic performance of the final design (Figure 3).
The thermophysical properties of the materials used in both the initial wall assemblies and their upgraded version are listed in Table 7, as gathered from the EN ISO 10456:2007 Standard [48].

3.3. Climatic Context

Different Italian cities representative of various climate conditions, ranging from very hot (zone A) to very cold (zone F) according to their Heating Degree Days (HDDs) (see Table 1), were considered for the sake of understanding the specific design requirements in each climate. Although HDDs do rigorously account only for air temperature and not for relative humidity conditions, a comparison with other European contexts showing similar HDDs can preliminary inform on the most appropriate design choices (e.g., insulation type and thickness) to guarantee energy savings while avoiding condensation issues.

4. Results and Discussion

4.1. Stationary and Dynamic Thermal Performance

This section reports the thermal analysis of the typical wall assemblies described in Section 3.1 when the same walls are renovated through e-CLT and e-PANEL. The aim of this analysis consists of identifying the minimum thickness of insulation that is necessary to comply with the European regulations, while also comparing the two proposed solutions in terms of thermal performance.
As a first step, Table 8 describes the stationary and dynamic thermal parameters referring to the wall assemblies before applying the e-SAFE solutions, calculated according to the Standards EN ISO 6946:2017 [7] and EN ISO 13786:2017 [23].
Then, Figure 4 plots the stationary and dynamic thermal parameters calculated for the same wall assemblies but with the additions of the two proposed renovation solutions, as a function of the insulation thickness. The continuous red line applies to e-CLT, while the dashed black line refers to e-PANEL. A circle marker identifies an existing solid brick structure (ID 1), while a cross marker a reinforced concrete wall (ID 3); no marker is used for cavity walls made of hollow clay bricks (ID 2). The plots refer to the case where wood fiber is used as insulating material (Table 7), which is the choice made for the pilot building in Catania (Southern Italy, climate zone B); however, the results remain almost unchanged when adopting other materials (cellulose fiber, cellular glass, cork).
It is possible to observe from Figure 4a that the U-value declines asymptotically if increasing the wooden fiber thickness: for any given thickness, the lowest values pertain to the walls renovated with e-CLT, since the CLT layer provides a significant additional thermal resistance. However, if the insulation thickness is above 12 cm the differences between e-CLT and e-PANEL are much less pronounced, irrespective of the wall structure to which both solutions are applied. In any case, a wood fiber layer of 10 cm allows keeping the U-value below 0.35 W·m−2·K−1, which guarantees compliance with the minimum requirements listed in Table 2 for most European countries, except for the coldest regions in Italy (zone E and zone F) and some countries in Northern Europe (England, Belgium Germany, Netherland, Norway), where 14–16 cm are required. In Spain, the required U-values in the coldest regions (zone E) can be achieved with only 2 cm of wooden fiber in the e-CLT, and 4–6 cm in the e-PANEL.
If looking at the dynamic thermal parameters, a similar asymptotical behavior is shown by the periodic thermal transmittance YIE (Figure 4b), but in this case the best performance pertains to solid bricks and hollow clay bricks, in order. YIE values below 0.10 W·m−2·K−1 (the maximum threshold set by Italian regulations) are always achieved with e-CLT, thanks to the additional thermal inertia brought by CLT. Instead, the worst performance pertains to concrete walls renovated with e-PANEL, where YIE values below 0.10 W·m−2·K−1 can be achieved only with a minimum insulating layer of 6 cm. No other limitations apply to this parameter in other European countries.
As far as the time shift is concerned (Figure 4c), once again the walls renovated with e-CLT perform the best. Excellent performance (ϕ > 12 h) calls for at least 8–10 cm of wooden fiber if e-CLT applies to concrete walls and even 12 cm when the e-PANEL adds to hollow bricks. It is also interesting to observe that the high time shift suggested in Spain [26] now implies non-negligible insulation thickness, which was not required if only looking at the U-value.
Finally, the areal internal heat capacity turns to be the most insensitive parameter to the type of element (e-CLT or e-PANEL) and to the amount of insulation installed. In fact, as shown in Figure 4d, κi keeps around 50 kJ·m−2·K−1 for hollow clay bricks, around 60 kJ·m−2·K−1 for solid bricks walls and 72 kJ·m−2·K−1 for concrete walls, in order. This is because the amount of thermal mass “seen” from the indoors remains the same for each specific construction assembly given that both e-CLT and e-PANEL are applied from the outside of the existing walls. Even in case of existing cavity walls with hollow clay bricks, good performance levels are ensured, especially if the thickness is at least 6–8 cm, thus also getting YIE < 0.03 W·m−2·K−1 [27].
In the light of the above considerations, in the real pilot in Catania, whose walls correspond to ID 2 typology, 6 cm of insulation should be installed in the e-CLT, and at least 8 cm used for e-PANEL. The corresponding thermal performance parameters are reported in Table 9.

4.2. Internal and Surface Vapor Condensation

The hygrothermal risk assessment of the various wall assemblies was carried out through the freeware software PAN v.7.1.0.4, a tool developed by the Italian National Association for Thermal Insulation (ANIT) that complies with all the relevant previously listed European Standards and implements the Glaser’s method [49].
Starting with the pre-retrofit wall configurations, the results of this analysis show that the most problematic existing wall structures are concrete walls, for which a risk of internal surface condensation and mold growth is predicted in all climate zones because of the low thermal resistance (U = 3.20 W∙m−2∙K−1), followed by solid brick walls (U = 1.71 W∙m−2∙K−1) for which surface condensation and mold growth can be an issue for climate zones C, D, E and F in Italy, respectively. No internal surface condensation is instead predicted for hollow clay brick walls (wall ID2).
As far as interstitial condensation is concerned, a limited amount of condensate (about 330 g∙m−2) is predicted for “vapor class production 3” in concrete walls only at the interface between the internal plaster and the reinforced concrete layer, but only in the coldest climate zones (E and F) and completely re-evaporates within the year.
On the other hand, if considering a higher indoor vapor production (“vapor class 4”), surface condensation and mold growth are now an issue for all the different wall assemblies in climate zones ranging from C to F, while interstitial condensation issues are of concern only for concrete walls in the coldest climate zone F where the amount of condensate predicted is of about 1400 g∙m−2 in February (see Figure 5). This value is considerably higher than the threshold of 500 g∙m−2—and more than four times higher than the corresponding case with “vapor class production 3”—and cannot be completely re-evaporated within a year.
The improvements in the thermal parameters of the walls renovated through the e-CLT solution do positively influence the hygrometric behavior. In fact, surface and mold growth risks are solved for all wall structures and indoor vapor production classes, because of the increased thermal resistance that raises the temperature of the walls’ internal surface and so reducing the risk of achieving dew point conditions.
In terms of interstitial condensation, no condensate is predicted for concrete walls renovated with e-CLT for every climate zone and vapor production class. On the other hand, some condensate appears at the exterior face of the insulating material for “vapor class production 3” in the case of cavity wall with hollow clay bricks in the coldest climate zone F, but the very low amount predicted (2.2 g∙m−2) is easily re-evaporated. When considering an increased indoor vapor production (“vapor production class 4”), some interstitial condensation may occur in climate zones E and F for both solid bricks and hollow clay brick structures, but once again the amount of condensate is low (below 20 g∙m−2) and re-evaporated (Figure 5).
In the case of e-PANEL, mold growth and surface condensation are avoided as well for every wall assembly, climate condition and indoor vapor production class. However, some interstitial condensation is predicted on the exterior face of the insulation material for climate zones D, E and F for all the wall structures analyzed—except for the reinforced concrete one—and for both vapor production classes 3 and 4.
Hence, the hygrothermal performance of e-PANEL is worse than that of e-CLT: as an example, the amount of condensate predicted for hollow clay brick structures located in the coldest climate zone F under the indoor “vapor class production 4” is close to the normative limit of 500 g∙m−2 (see Figure 5). This can be attributed to the lower water vapor resistance of the walls renovated with e-PANEL, which ease the water vapor to move through and reach the coldest points of the walls, thus eventually condensing.
For these reasons, in such extreme conditions the use of a vapor screen/barrier on the internal face of the insulation layer might be advisable. Further investigations about these strategies are ongoing based on dynamic numerical heat and mass transfer software tools, which include other transport mechanisms such as vapor convection, capillary transport and surface diffusion.

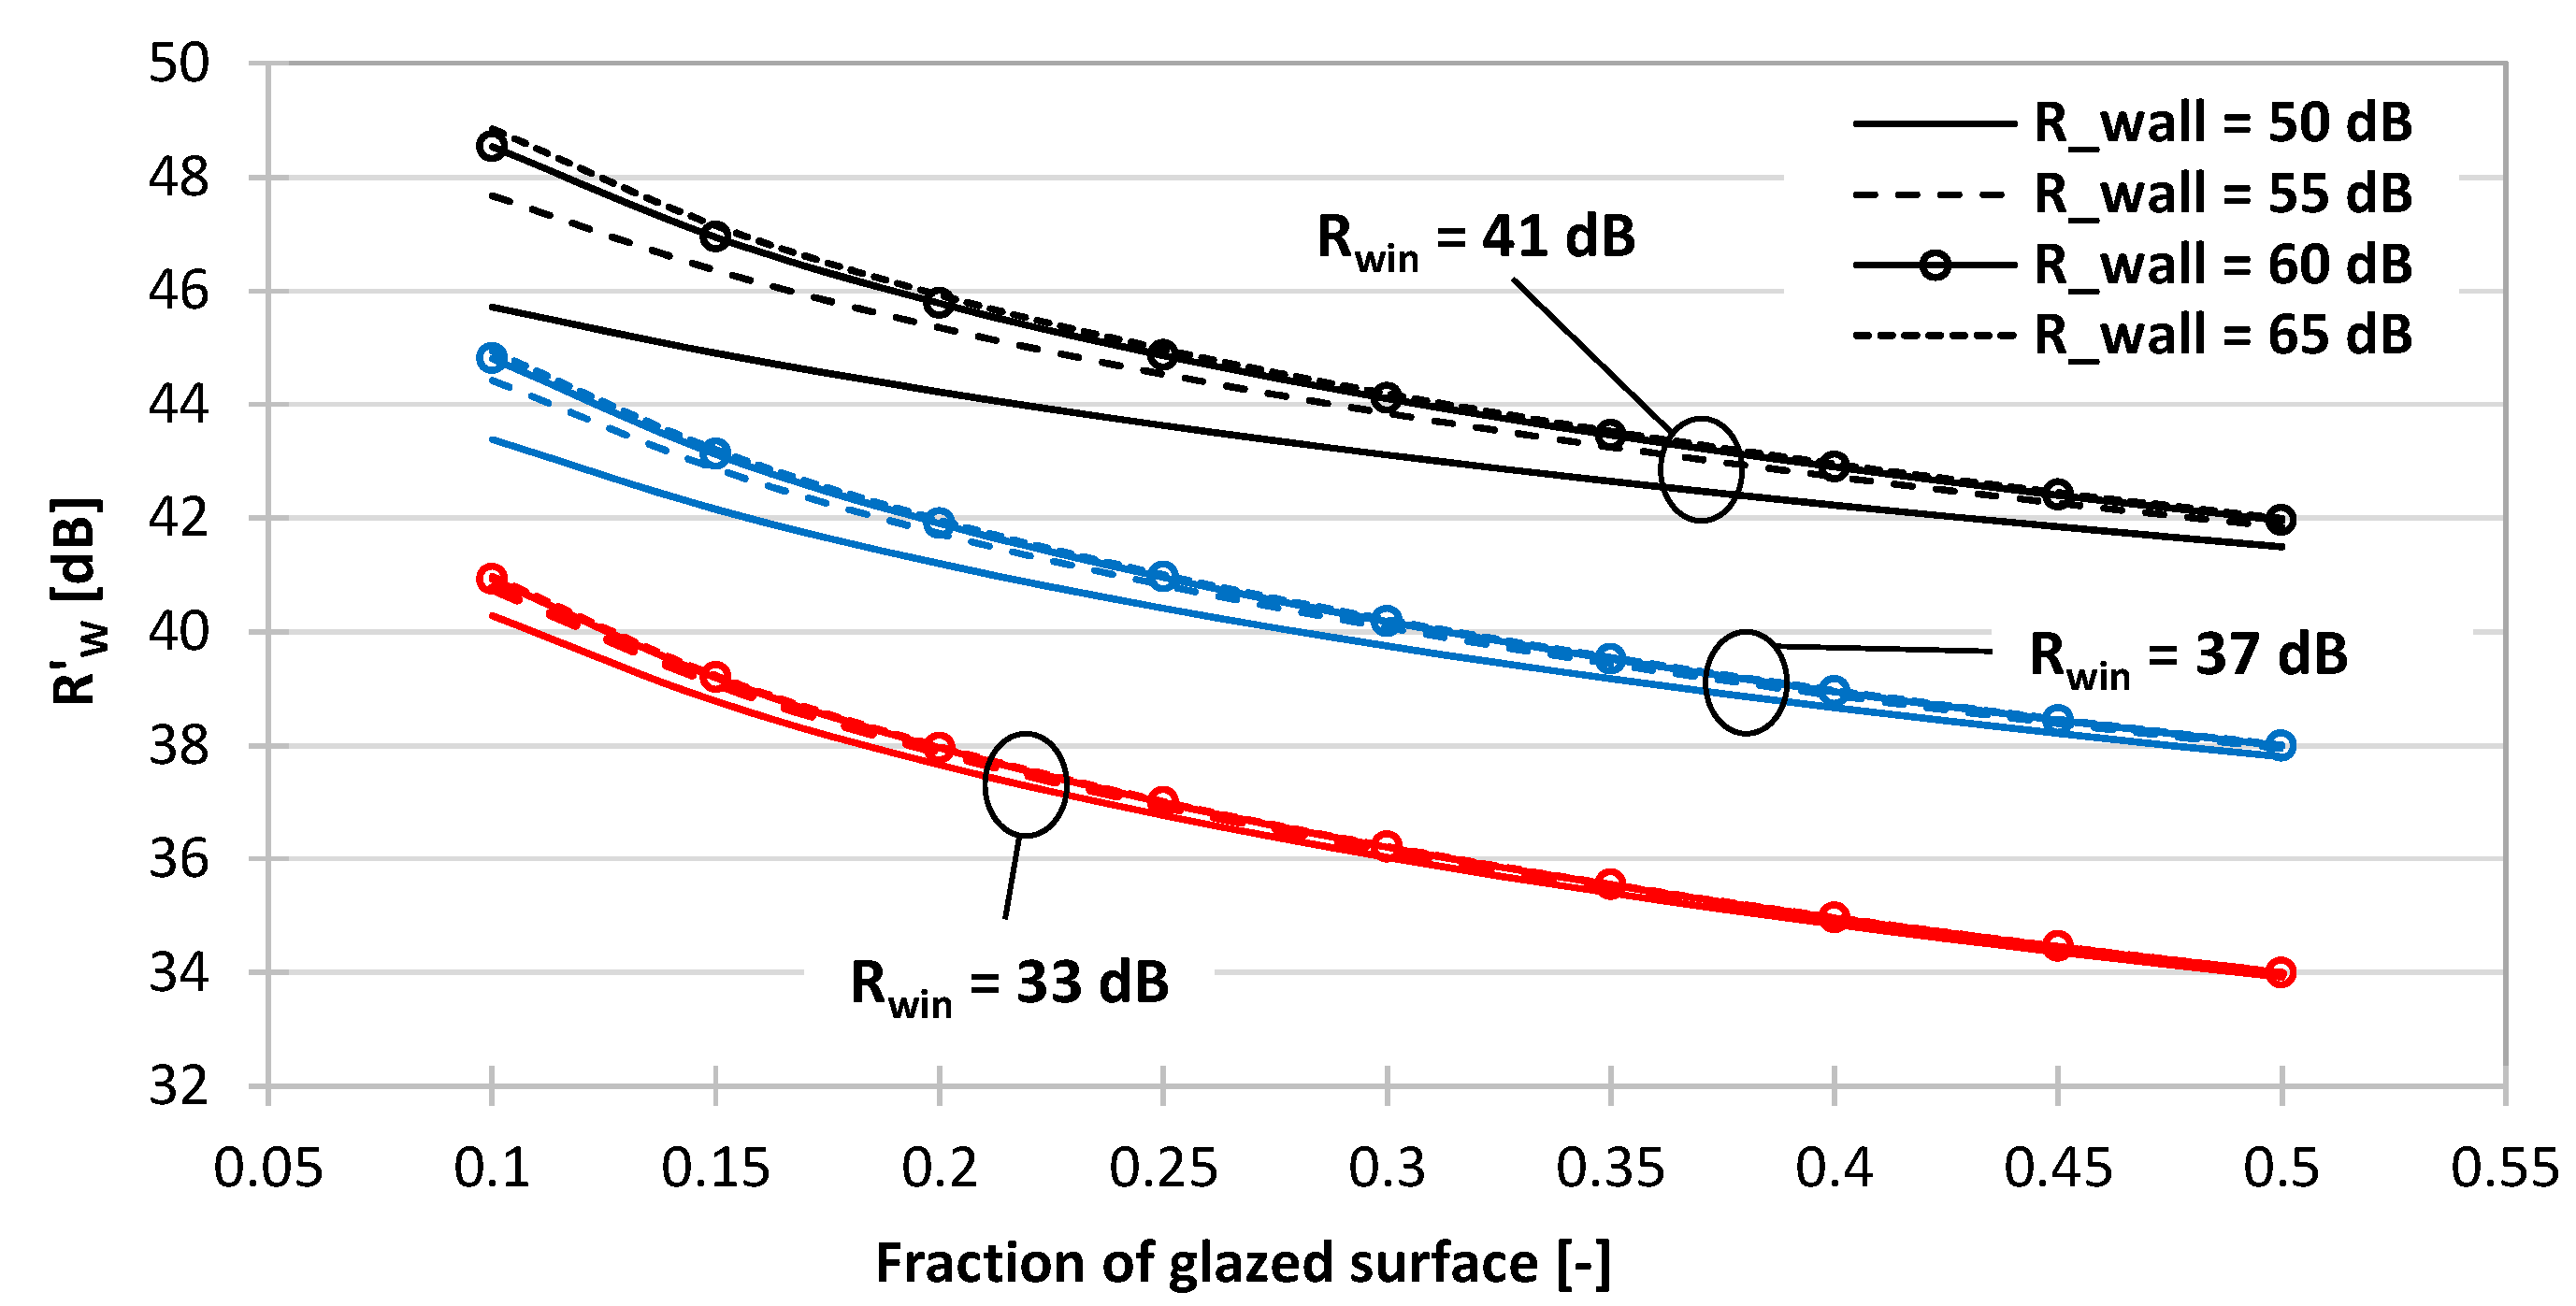
4.3. Sound Reduction Provided by Building Facades

This section discusses the compliance of the e-PANEL and the e-CLT with the national regulations that are in force in the European countries and pertain to acoustic building performance, as discussed in Section 3. To this aim, it is necessary to remind that the sound reduction level provided by a façade depends not only on the acoustic performance of the opaque components, but also on the features of the glazed components. Indeed, the weighted apparent sound reduction index of a façade can be assessed as in Equation (7) [44]:
R W = 10 · log ( S g · 10 R g , W 10 + S o p · 10 R o p , W 10 S g + S o p ) K = 10 · log [ f g · 10 R g , W 10 + ( 1 f g ) · 10 R o p , W 10 ] K
Here, Sg and Sop are the areas of the glazed and the opaque surfaces in the façade, respectively, while Rg,W and Rop,W are the corresponding values of the weighted sound reduction index. K is a term that accounts for the sound transmission through lateral paths: K = 2 dB is the suggested value for facades with heavy and rigidly connected elements, while otherwise K = 0 is considered [44]. Equation (7) does not include the role of vents and ventilation grilles, but these are not relevant to the proposed renovation solutions.
Now, the windows have usually a much lower sound reduction index than the walls, and the exponential structure of Equation (7) makes them able to severely undermine the acoustic performance of a façade, even if they are of relatively low surface area. In fact, let us consider Figure 6, which reports the solution of Equation (7) for three possible window performance levels, namely:
  • Rg = 33 dB (basic double glazing such as 6-12(air)-6, with aluminum frame).
  • Rg = 37 dB (average double glazing with glass panes having different thicknesses, such as 6-12(air)-10, plus aluminum or PVC frame).
  • Rg = 41 dB (double glazing with stratified safety glass, such as 10-12(air)-44.1, plus wood frame).
When installing a basic window (Rg = 33 dB), the acoustic performance of the opaque surface is almost irrelevant to the overall result; this last one in fact is the fraction of glazed surface, and hardly exceeds R′W = 40 dB if Rg is below 10%. The acoustic performance of the walls starts becoming relevant above Rg = 37 dB, but in any case, forcing Rop > 55 dB is almost useless in terms of improved overall apparent sound reduction index. In conclusion, once the opaque component ensures Rop > 50 ÷ 55 dB, the overall weighted apparent sound reduction index depends only on the acoustic features and the surface area of the windows.
Now, let us consider the opaque components included in this study, starting from the uninsulated cavity wall with hollow bricks (identified as ID 2 in Table 8). This wall solution is very common in Italy, and its weighted sound reduction index ranges between 47 and 48 dB. By retrofitting it with the e-PANEL, i.e., by adding at least 8 cm of a fibrous insulation plus a rigid cladding, one can easily expect an improvement of the weighted sound reduction index by around 6 dB, getting Rop = 53 ÷ 54 dB.
If one assumes that windows with average performance (Rg = 37 dB) are installed together with the e-PANEL, Figure 6 provides R′W = 44.5 dB for a 10% glazed surface, or R′W = 41.0 dB for a 25% glazed surface, both glazed ratios being representative of common situations in residential buildings.
Let us also recall the correlation between the weighted standardized level difference (D2m,nT,W) and the weighted apparent sound reduction index (R′W), which has been already introduced in Equation (6). In case of a 3 m high room with 4 × 4 m2 of net floor surface area, Equation (6) becomes:
D 2 m , n T , W = R W + Δ L f s + 10 log ( 0.16 · V T 0 · S t o t ) = R W + 10 log ( 0.16 · 4 0.5 ) = R W + Δ L f s + 1
According to Equation (8), and assuming ΔLfs = 0 (no balconies) the above described configurations would lead to D2m,nt,W = 42.0 ÷ 45.5 dB.
On the other hand, the wall solutions identified as ID 1 (solid brick wall) and ID 3 (concrete wall) are far heavier than the cavity wall with hollow clay bricks, leading in both cases to Rop > 56 dB even in their uninsulated version. However, as already highlighted, the overall acoustic performance of the façade is not expected to change significantly.
These results are encouraging and allow ensuring compliance with law for residential and office buildings in those countries where the parameter D2m,nt,W is enforced (Italy, Portugal). In some countries (Spain, Turkey, France, Belgium) the regulations apply to the weighted standardized level difference plus the spectrum adaptation term for traffic noise (D2m,nt,W + Ctr). It is not easy to foresee the value of Ctr, as this can be determined only through on-site measurements: however, common practice suggests that in the worst scenarios this can reach Ctr = −7 dB or even Ctr = −9 dB, which still implies (D2m,nt,W + Ctr) > 33 ÷ 35 dB. This would allow compliance with law in Spain, Turkey and France, except for those areas where the outdoor noise level exceeds LAeq = 65 dB.
Possible improvements to this level of performance do not depend on the features of the e-PANEL itself: on the other hand, the choice of the window is a key element in the acoustic design of the e-PANEL renovation system, and must be attentively verified case-by-case in relation to the outdoor noise level and the local regulations.
Similar conclusions apply to the e-CLT: indeed, the e-CLT is expected to ensure better sound insulation levels than the e-PANEL, thanks to the high mass provided by the CLT panels, but further enhancement of the sound reduction index for the opaque components has no effect if windows are not improved.

5. Conclusions

The deep renovation of the largely energy-inefficient building stock in Europe calls for technological solutions that are market-ready and able to overcome the most significant barriers faced by renovation actions in European Countries today. With the aim of overcoming such barriers, the e-SAFE project is conducting research and development activities to design, test and demonstrate external wooden-based cladding solutions able to significantly improve both the energy (e-PANEL) and seismic (e-CLT) performance of existing non-historic buildings with RC frame.
This paper reported the results of a preliminary research activity to assess the hygrothermal and acoustic performance of such solutions when applied to different existing wall structures under various climate conditions in Europe, with different insulation thicknesses. In particular, the main research questions consisted of verifying whether the proposed solutions are not suitable in specific countries, and in this case highlight any necessary technical improvement to achieve the expected level of thermal and acoustic performance—or the minimum required insulation thickness if relevant.
The results show that excellent thermal performance can be already achieved by using a 10 cm thick wood fiber insulating layer (U < 0.35 W·m−2·K−1, YIE ≤ 0.05 W·m−2·K−1), almost independently from the existing wall structures to which e-PANEL and e-CLT are applied. This allows compliance with the minimum requirements for most European countries, except for the coldest regions in Italy and some countries in Northern Europe, where 14–16 cm are required.
Furthermore, the e-CLT shows higher time shift (ϕ) than the e-PANEL, and this suggests better summer thermal performance. Instead, the internal areal heat capacity (κi) mainly depends on the existing wall assemblies and is almost independent of the selected renovation solution. In any case, compliance with the existing regulations is ensured.
Some condensation issues emerge under certain climates and indoor vapor production rates. In fact, although surface condensation is always avoided when applying e-PANEL and e-CLT, some interstitial condensation is predicted for both of them in cold climates. The amount of cumulated condensate evaluated through the Glaser’s method for indoor “vapor production class 4” is very low (below 20 g·m−2) in the case of e-CLT application to solid bricks, while for the e-PANEL the condensate predicted amounts to about 400 g·m−2, a value close to the Italian threshold of 500 g·m−2. For this reason, further investigations are planned with the use of a transient heat and mass transfer tool in order to consider additional vapor transfer mechanisms and to better inform the selection of the most suitable insulating material.
Finally, the calculation of the weighted apparent sound reduction index of a façade (R′W) highlighted how the acoustic performances of the e-PANEL and e-CLT solutions strongly depend on the amount of glazed surfaces installed. Indeed, if a weighted sound reduction index RW = 53 ÷ 54 dB is achieved by e-PANEL with 8 cm thick insulation, R’W ranges between 41.0 dB with a 25% glazed surface and 44.5 dB with a 10% glazed surface. In terms of weighted standardized level difference (D2m,nT,W)—a parameter often adopted in various national regulations (e.g., in Italy and Portugal)—the above described configurations would lead to D2m,nt,W = 42.0 ÷ 45.5 dB for a typical room without balconies, thus complying with law requirements for residential and office buildings. Possible improvements to the acoustic performance do not depend on the features of the proposed renovation solutions, but they are found to depend mainly on the choice of the windows, and will be attentively addressed during the implementation stage, also in relation to the outdoor noise levels.
Overall, the results of this preliminary investigation are promising, and suggest the e-CLT and e-PANEL can be applied in most European countries without the need of particular precautions. In cold and humid climates, condensation issues may occur: these must be verified with care by dynamic heat and mass transfer simulations, since the presented investigation only relies on stationary calculations, as suggested by European standards.
The results discussed in this study will serve also as a guideline during the design stage of the pilot buildings to demonstrate the effectiveness of the e-SAFE solutions during the project.

Author Contributions

Conceptualization, G.E. and V.C.; methodology, L.M.; software, V.C.; formal analysis, G.E.; investigation, G.E. and V.C.; data curation, G.E. and V.C.; writing—original draft preparation, G.E. and V.C.; writing—review and editing, L.M.; supervision, G.E.; funding acquisition, G.E. All authors have read and agreed to the published version of the manuscript.

Funding

This paper was carried out in the framework of the “Energy and seismic affordable renovation solutions” (e-SAFE) project, which has received funding from the European Union’s Horizon 2020 research and innovation programme under grant agreement No. 893135. Neither the Executive Agency for Small-and-Medium-sized Enterprises (EASME) nor the European Commission is in any way responsible for any use that may be made of the information it contains. Some activities were partially funded by the University of Catania in the framework of the SIS-RENEW research project (Piano di incentivi per la Ricerca 2020–2022).

Conflicts of Interest

The authors declare no conflict of interest. The funders had no role in the design of the study; in the collection, analyses, or interpretation of data; in the writing of the manuscript, or in the decision to publish the results.

References

  1. EU Buildings Database. Available online: https://ec.europa.eu/energy/en/eu-buildings-database (accessed on 26 May 2021).
  2. Filippidou, F.; Jimenez Navarro, J.P. Achieving the Cost-Effective Energy Transformation of Europe’s Buildings; EUR 29906 EN; Publications Office of the European Union: Luxembourg, 2019; Available online: https://publications.jrc.ec.europa.eu/repository/handle/JRC117739 (accessed on 26 May 2021).
  3. European Commission. Communication from the Commission to the European Parliament, the Council, the European economic and social Committee and the Committee of the Regions. In A Renovation Wave for Europe—Greening our Buildings, Creating Jobs, Improving Lives; European Commission: Brussels, Belgium, 2020. [Google Scholar]
  4. La Greca, P.; Margani, G. Seismic and energy renovation measures for sustainable cities: A critical analysis of the Italian scenario. Sustainability 2018, 10, 254. [Google Scholar] [CrossRef] [Green Version]
  5. Lattke, F.; Cronhjort, Y. smartTES—Introduction to a New Retrofit Method; Technische Universität München: Munich, Germany, 2014. [Google Scholar]
  6. P2ENDURE Project. Plug & Play Building Renovation. Available online: https://www.p2endure-project.eu/en (accessed on 26 May 2021).
  7. EN ISO 6946:2017. Building Components and Building Elements—Thermal Resistance and Thermal Transmittance—Calculation Methods; European Committee for Standardization: Brussels, Belgium, 2017. [Google Scholar]
  8. Decreto del Presidente della Repubblica 26 agosto 1993, n. 412 Regolamento recante norme per la progettazione, l’installazione, l’esercizio e la manutenzione degli impianti termici degli edifici ai fini del contenimento dei consumi di energia, in attuazione dell’art. 4, comma 4, della legge 9 gennaio 1991, n. 10412/93. 1993. (In Italian)
  9. Gaglia, A.G.; Tsikaloudaki, A.G.; Laskos, C.M.; Dialynas, E.N.; Argiriou, A.A. The impact of the energy performance regulations’ updated on the construction technology, economics and energy aspects of new residential buildings: The case of Greece. Energy Build. 2017, 155, 225–237. [Google Scholar] [CrossRef]
  10. Touloupaki, E.; Theodosiou, T. Optimization of external envelope insulation thickness: A parametric study. Energies 2017, 10, 270. [Google Scholar] [CrossRef] [Green Version]
  11. Orden FOM /1635/2013 del 10 de septiembre por el que se actualiza el Documento Básico DB-HE. 2013. (In Spanish)
  12. Turkish Standards Institution. TS 825—Thermal Insulation Requirements for Buildings; Turkish Standards Institution: Ankara, Turkey, 2008.
  13. Österreichisches Institut für Bautechnik. OIB-330.6-009/15 OIB-Richtlinie 6; Österreichisches Institut für Bautechnik: Vienna, Austria, 2015. (In Austrian) [Google Scholar]
  14. Concerted Action-Energy Performance of Buildings, 2018, CA-EPBD, Implementing the Energy Performance of Buildings Directive—Featuring Country Reports 2018. Available online: https://epbd-ca.eu/archives/1859 (accessed on 26 May 2021).
  15. Cypriot Law n. 210 (I)/2012. The Regulation of the Energy Performance of Buildings (Amendment) Act 2012, 2012.
  16. Approved Document L1B. Conservation of Fuel and Power in Existing Dwellings; HM Government: London, UK, 2018.
  17. Energieeinsparverordnung—EnEV 2014. 2014. (In German)
  18. Law n. 4122/2013: The Energy Performance of Buildings; Greek Government: Athens, Greece, 2013.
  19. Inter-Ministerial Decree 26/06/2015. Applicazione delle Metodologie di Calcolo delle Prestazioni Energetiche e Definizione delle Prescrizioni e dei Requisiti Minimi degli Edifici. Ministero dello Sviluppo Economico. 2015. (In Italian)
  20. Staatsblad van het Koninkrijk der Nederlanden, STB 2018-291. 2018. (In Dutch)
  21. Forskrift om tekniske krav til byggverk. Byggteknisk forskrift—TEK17. 2017. (In Norwegian)
  22. Bienvenido-Huertas, D.; Oliveira, M.; Rubio-Bellido, C.; Marin, D. A comparative analysis of the international regulation of thermal properties in building envelope. Sustainability 2019, 11, 5574. [Google Scholar] [CrossRef] [Green Version]
  23. EN ISO 13786:2017. Thermal Performance of Building Components—Dynamic Thermal Characteristics—Calculation Methods; European Committee for Standardization: Brussels, Belgium, 2017. [Google Scholar]
  24. Marletta, L.; Evola, G.; Giuga, M. Using the dynamic thermal properties to assess the internal temperature swings in free running buildings. A general model and its validation according to ISO 13792. Energy Build. 2015, 87, 57–65. [Google Scholar] [CrossRef]
  25. Rossi, M.; Rocco, V.M. External walls design: The role of periodic thermal transmittance and internal areal heat capacity. Energy Build. 2014, 68, 732–740. [Google Scholar] [CrossRef]
  26. Bienvenido-Huertas, D.; Rubio-Bellido, C.; Pulido-Arcas, J.A.; Perez-Fargallo, A. Towards the implementation of periodic thermal transmittance in Spanish building energy regulation. J. Build. Eng. 2020, 31, 101402. [Google Scholar] [CrossRef]
  27. Di Perna, C.; Stazi, F.; Ursini Casalena, A.; D’Orazio, M. Influence of the internal inertia of the building envelope on summertime comfort in buildings with high internal heat loads. Energy Build. 2011, 43, 200–206. [Google Scholar] [CrossRef]
  28. Criteri Ambientali Minimi per L’affidamento di Servizi di Progettazione e Lavori per la Nuova Costruzione, Ristrutturazione e Manutenzione di Edifici Pubblici; Italian Ministry of the Environment: Rome, Italy, 2015.
  29. Stazi, F.; Ulpiani, G.; Pergolini, M.; Di Perna, C. The role of areal heat capacity and decrement factor in case of hyper insulated buildings: An experimental study. Energy Build. 2018, 176, 310–324. [Google Scholar] [CrossRef]
  30. EN ISO 13788:2013. Hygrothermal Performance of Building Components and Building Elements—Internal Surface Temperature to Avoid Critical Surface Humidity and Interstitial Condensation—Calculation Methods; European Committee for Standardization: Brussels, Belgium, 2013. [Google Scholar]
  31. EN ISO 16283-3:2016. Acoustics—Field Measurement of Sound Insulation in Buildings and of Building Elements—Part 3: Façade Sound Insulation; European Committee for Standardization: Brussels, Belgium, 2016. [Google Scholar]
  32. Requirements and Drivers of EENSULATE Module, Deliverable 1.1 of the EENSULATE EU Project. 2016. Available online: https://ec.europa.eu/research/participants/documents/downloadPublic?documentIds=080166e5aeb8b494&appId=PPGMS (accessed on 26 May 2021).
  33. Austrian Standard: ÖNORM B 8115-2. Sound Insulation and Room Acoustics in Buildings, 2006.
  34. Belgian Standard NBN S 01-400-1:2008. Acoustics—Acoustical Criteria for Dwellings, 2008.
  35. Rasmussen, B.; Machimbarrena, M.; Fausti, P. Building Acoustics throughout Europe—Volume 2: Housing and Construction Types Country by Country. Report of the COST Action TU0901: Integrating and Harmonizing Sound Insulation Aspects in Sustainable Urban Housing Constructions. 2014. Available online: https://www.cost.eu/publications/building-acoustics-throughout-europe-volume-2-housing-and-construction-types-country-by-country/ (accessed on 26 May 2021).
  36. Lang, J.; Schönbäck, W.; Pierrard, R. Sound Insulation in Housing Construction; University of Technology: Wien, Austria, 2006. Available online: https://ifip.tuwien.ac.at/publications/EN/ (accessed on 26 May 2021).
  37. Körper, S. German regulations on building acoustics—The new standard DIN 4109. In Proceedings of the Inter Noise Conference, Madrid, Spain, 16–19 June 2019. [Google Scholar]
  38. Decree of the President of the Council of Ministers (DPCM) 5-12-1997. Requisiti Acustici Passivi Degli Edifici, 1997. (In Italian)
  39. Polish Standard PN-B-02151-3: 1999. Building Acoustics—Noise Protection of Apartments in Buildings—Sound Insulation in Buildings and of Building Elements—Requirements, 1999.
  40. Ministério do Ambiente, do Ordenamento do Território e do Desenvolvimento Regional, Decreto-Lei 96/2008. Regulamento dos Requisitos Acústicos dos Edifícios (RRAE) (Portuguese Building Acoustics Code), 2008. (In Portuguese)
  41. Machimbarrena, M.; Carrascal, T. The Spanish Acoustics Building Code (DB HR) and its first year of application. In Proceedings of the 2° Convention Nazionale del Gruppo di Acustica Edilizia, Florence, Italy, 13 December 2010. [Google Scholar]
  42. Bayazit, N.T.; Kurra, S.; Sentop, A.; Obilen, B.S. Acoustical classification and proposed methodology for performance assessment of buildings in Turkey. In Proceedings of the 23rd International Congress on Sound & Vibration, Athens, Greece, 10–14 July 2016. [Google Scholar]
  43. ISO 717-1:2013. Acoustics—Rating of Sound Insulation in Buildings and of Building Elements Airborne Sound Insulation; International Organization for Standardization: Geneve, Switzerland, 2013. [Google Scholar]
  44. EN ISO 12354-3:2017. Building Acoustics—Estimation of Acoustic Performance of Buildings from the Performance of Elements—Part 3: Airborne Sound Insulation Against Outdoor Sound; European Committee for Standardization: Brussels, Belgium, 2017. [Google Scholar]
  45. Typology Approach for Building Stock Energy Assessment. Main Results of the TABULA Project. 2012. Available online: https://episcope.eu/fileadmin/tabula/public/docs/report/TABULA_FinalReport_AppendixVolume.pdf (accessed on 26 May 2021).
  46. Barbagallo, F.; Margani, G.; Marino, E.M.; Moretti, A.; Tardo, C. Impact of retrofit of RC frames by CLT panels and friction dampers. In Proceedings of the 8th International Conference on Computational Methods in Structural Dynamics and Earthquake Engineering, CompDyn 2021, Streamed from Athens, Athens, Greece, 28–30 June 2021. [Google Scholar]
  47. Margani, G.; Evola, G.; Tardo, C.; Marino, E.M. Energy, seismic, and architectural renovation of RC framed buildings with prefabricated timber panels. Sustainability 2020, 12, 4845. [Google Scholar] [CrossRef]
  48. EN ISO 10456:2007. Building Materials and Products—Hygrothermal Properties—Tabulated Design Values and Procedures for Determining Declared and Design Thermal Values; European Committee for Standardization: Brussels, Belgium, 2007. [Google Scholar]
  49. PAN v.7.1.0.4 Software. Available online: https://www.anit.it/software-anit/pan/ (accessed on 26 May 2021).
Figure 1. Climate zones classification in Italy with highlighted the representative cities. Catania (zone B) hosts a pilot building that will be refurbished within the e-SAFE project.
Energies 14 04006 g001
Figure 2. Schematic of the periodic heat transfer process in an external wall.
Energies 14 04006 g002
Figure 3. The e-SAFE envelope renovation concept, with a combination of e-PANEL and e-CLT: in non-seismic countries, only e-PANEL is applied (elaborated from [47]).
Energies 14 04006 g003
Figure 4. Stationary and dynamic thermal parameters vs. insulation thickness. (a) Thermal transmittance; (b) periodic thermal transmittance; (c) time shift; (d) internal areal heat capacity.
Energies 14 04006 g004
Figure 5. Amount of condensate predicted for different wall assemblies in the coldest climate zone F for indoor “vapor production class 4”.
Energies 14 04006 g005
Figure 6. Abacus for the solution of Equation (7), with K = 2.
Energies 14 04006 g006
Table 1. Climate zones with representative cities and Heating Degree Days (HDD, in °Cdays).
Climate ZoneItaly [8]Greece [9,10]Spain [11] *Turkey [12] **
AHDD < 600
(Lampedusa: 568)
HDD < 1000
(Heraklion: 702)
Malaga (<100 m.a.s.l.)
Granada (<50 m.a.s.l.)
Region 1: south-western
(Antalya, Izmir)
B600 ≤ HDD < 900
(Catania: 833)
1000 ≤ HDD < 1500
(Athens: 947)
Sevilla (<200 m.a.s.l.)
Valencia (<50 m a.s.l.)
Region 2: coastal
(Istanbul, Bursa)
C901 ≤ HDD < 1400
(Naples: 1034)
1500 ≤ HDD < 2000
(Thessaloniki: 1677)
Barcelona (<250 m.a.s.l.)
Madrid (<500 m.a.s.l.)
Region 3: central
(Ankara)
D1401 ≤ HDD < 2100
(Rome: 1415)
HDD ≥ 3000
(Kastoria: 2420)
Valladolid (<800 m.a.s.l.)
Lugo (<500 m.a.s.l.)
Region 4: eastern
(Erzurum)
E2101 ≤ HDD < 3000
(Bologna: 2259)
-Leon (all altitudes)-
FHDD ≥ 3000
(Cuneo: 3012)
---
* Climate zones in Spain may change within the same municipality with the height above sea level.
** HDD values are not explicitly stated for the climate zones in Turkey.
Table 2. Maximum U-values (W·m−2·K−1) for various building components in different European countries (values holding in case of energy renovation).
CountryZoneWallsRoofsWindows
Austria [13]All0.350.201.40
Belgium [14]All0.240.241.50
Cyprus [15]All0.400.402.25
England [16]All0.280.16 *
0.18 **
1.60
Germany [17]All0.24 #
0.35 ##
0.20 (flat)
0.24 (pitched)
1.30
Greece [18]A0.600.503.20
B0.500.453.00
C0.450.402.80
D0.400.352.60
Italy [19]A, B0.400.323.00
C0.360.322.00
D0.320.261.80
E0.280.241.40
F0.260.221.00
Netherlands [20]All0.210.151.65
Norway [21]All0.220.181.20
Portugal [22]I10.500.402.80
I20.400.352.40
I30.350.302.20
Spain [22]A1.250.805.70
B1.000.654.20
C0.750.503.10
D0.600.402.70
E0.550.352.50
Turkey [12]Region 10.700.452.40
Region 20.600.402.40
Region 30.500.302.40
Region 40.400.252.40
* pitched roof with insulation at ceiling level.
** pitched roof with insulation at rafter level, flat roof.
# outer insulation.
## inner insulation.
Table 3. Maximum condensate allowed in the inner layers of a wall [30].
MaterialDensity ρ (kg·m−3)Maximum Tolerable Condensate (g·m−2)
Clay600–2000≤500
Concrete400–2400≤500
Wood and derived materials500–800≤30·ρ·d
Plasters and mortars600–2000≤30·ρ·d
Organic fibers with waterproof glue300–700≤20·ρ·d
Organic fibers with non-waterproof glue300–700≤5·ρ·d
Mineral fibers10–150≤5000·ρ·d·λ·(1–1.7·λ)−1
Cellular plastic materials10–805000·ρ·d·λ·(1–1.7·λ)−1
Table 4. Descriptors for façade sound insulation used in European national regulations [32].
Cat.DescriptorSymbolNotes
(i)Weighted apparent sound reduction indexR′W-
(i)Weighted apparent sound reduction index (plus spectrum adaptation term for traffic noise)R′W + Ctr1
(i)Weighted standardized level differenceD2m,nT,W2
(i)Weighted standardized level difference (plus spectrum adaptation term for traffic noise)DnT,W + Ctr3
(ii)A-weighted maximum indoor sound pressure level (measured with fast time weighting)LAF,max-
(ii)A-weighted equivalent indoor sound pressure levelLAeq4
(ii)A-weighted day–evening–night (den) indoor noise levelLden-
1 Additionally indicated as (R′res,W + Ctr) in Austria and RA in Poland.
2 The subscript “2m” implies that the outdoor noise level is measured at 2 m from the façade.
3 Additionally indicated as DA,tr in Belgium.
4 This is usually referred to specific time intervals (e.g., LAeq,7-22 or LAeq,24h).
Table 5. Requirements for façade sound insulation in the main European countries.
CountryDescriptorRequirement
Austria [33]R′res,w + CtrIt must keep above a threshold value that depends on the outdoor noise level measured in front of the façade
Belgium [34]DA,trDA,tr ≥ (LAeq(outdoor) − 34 dB) and DA,tr ≥ 26 dB (≥34 dB for bedrooms near airports and railways)
Croatia [35]LAeq,day (indoor)Dwellings: LAeq,day ≤ 40 dB; offices: LAeq,day ≤ 35 dB
LAeq,night (indoor)Dwellings: LAeq,night ≤ 30 dB; offices: LAeq,night ≤ 25 dB
Denmark [36]LAeq,24h (indoor)LAeq,24h ≤ 30 dB
Finland [36]LAeq,7-22 (indoor)LAeq,7-22 ≤ 35 dB
LAeq,22-7 (indoor)LAeq,22-7 ≤ 30 dB
France [35]DnT,W + Ctr(DnT,w + Ctr) ≥ 30 dB
Germany [37]LAeq,day (indoor)LAeq,day ≤ 35 dB
LAeq,night (indoor)LAeq,night ≤ 25 dB
Greece [32]LAeq (indoor)LAeq ≤ 35 dB (during public quiet hours)
Iceland [32]LAeq,24h (indoor)LAeq,24h ≤ 30 dB
LAFmax,22-6 (indoor)LAmax,22-6 ≤ 45 dB
Italy [38]D2m,nT,WDwellings: D2m,nT,W ≥ 40 dB; offices: D2m,nT,W ≥ 42 dB
Hospitals: D2m,nT,W ≥ 45 dB; schools: D2m,nT,W ≥ 48 dB
Netherlands [32]D2m,nT,W + Ctr(D2m,nT,W + Ctr) ≥ 23 dB
Lden (indoor)Lden ≤ 30 dB
Norway [32]LAeq,24h (indoor)LAeq,24h ≤ 30 dB
LAFmax,23-7 (indoor)LAmax,23-7 ≤ 45 dB
Poland [39]RAIt must keep above a threshold value that depends on the outdoor noise level measured in front of the façade
Portugal [40]D2m,nT,wDwellings: D2m,nT,w ≥ 33 dB; offices: D2m,nT,w ≥ 30 dB
Spain [41]D2m,nT,w + CtrIt must keep above a threshold value that depends on the outdoor A-weighted sound pressure level 1
Sweden [32]LAeq,24h (indoor)LAeq,24h ≤ 30 dB
LAFmax,22-6 (indoor)LAmax,22-6 ≤ 45 dB
Turkey [42]D2m,nT,w + CtrIt must keep above a threshold value that depends on the outdoor A-weighted day–evening–night (den) noise level 2.
LAeq (indoor)LAeq ≤ 30 dB (during occupancy, new buildings)
LAeq ≤ 34 dB (during occupancy, existing buildings)
1 For instance, in sleeping rooms: if LAeq(outdoor) ≤ 60 dB then (D2m,nT,w + Ctr) ≥ 30 dB, if 60 dB < LAeq(outdoor) ≤ 65 dB then (D2m,nT,w + Ctr) ≥ 32 dB.
2 For instance, in new buildings: if 55 dB < Lden(outdoor) ≤ 60 dB then (D2m,nT,w + Ctr) ≥ 28 dB, if 60 dB < Lden(outdoor) ≤ 65 dB then (D2m,nT,w + Ctr) ≥ 34 dB.
Table 6. The typical wall assemblies considered in this study.
Wall Structure ID 1
(Uninsulated Solid Brick Wall)
Wall Structure ID 2
(Uninsulated Cavity Walls)
Wall Structure ID 3
(Uninsulated Concrete Walls)
  • External plaster (2 cm)
  • Solid brick (25 cm)
  • Internal plaster (2 cm)
  • External plaster (3 cm)
  • Hollow clay brick (12 cm)
  • Unventilated air cavity (7 cm)
  • Mortar (1 cm)
  • Hollow clay brick (8 cm)
  • Internal plaster (2 cm)
  • External plaster (3 cm)
  • Reinforced concrete (15 cm)
  • Internal plaster (2 cm)
Table 7. Thermophysical properties of wall construction materials.
MaterialDensity (kg·m−3)Thermal Conductivity (W·m−1·K−1)Specific Heat (J·kg−1·K−1)Water Vapor Resistance (-)
External plaster (lime)18000.90100010
Internal plaster (gypsum)13000.57100010
Cement mortar20001.4100010
Unventilated air cavity1.2*10001
Solid brick18000.72100010
Hollow clay brick (12 cm)7750.3884010
Hollow clay brick (8 cm)7150.4084010
Reinforced concrete24002.00100080
Materials Added by The e-SAFE Solutions
CLT panel (10 cm)4200.12160060
Wood fiber500.03821001.1
Partially ventilated air cavity (2 cm)1.2**10001
Cladding (open wooden slats)4600.1316601
* Thermal resistance = 0.18 m2·K·W−1.
** Thermal resistance = 0.09 m2·K·W−1.
Table 8. Thermal performance of the three typical wall assemblies introduced in Table 6.
Wall IDSurface Mass (kg·m−2)U (W·m−2·K−1)YIE (W·m−2·K−1)Attenuation Factor (-)Phase Shift (h)Internal Areal Heat Capacity (kJ·m−2·K−1)
15301.710.4250.2510.266.1
2248.51.070.5750.547.355.2
34403.201.5550.495.674.6
Table 9. Minimum thermal performance for the pilot building in Catania (after renovation with e-PANEL and e-CLT).
Solution 2.Insulation Thickness (cm)Surface Mass (kg·m−2)U (W·m−2·K−1)YIE (W·m−2·K−1)Attenuation Factor (-)Phase Shift (h)Internal Areal Heat Capacity (kJ·m−2·K−1)
e-CLT6294.90.300.0250.0814.548.5
e-PANEL8252.10.320.0400.1311.548.8
Publisher’s Note: MDPI stays neutral with regard to jurisdictional claims in published maps and institutional affiliations.

