Article

On the Optimisation of Urban form Design, Energy Consumption and Outdoor Thermal Comfort Using a Parametric Workflow in a Hot Arid Zone

Department of Architecture and Civil Engineering, University of Bath, Bath BA2 7AY, UK
*
Author to whom correspondence should be addressed.
Energies 2021, 14(13), 4026; https://doi.org/10.3390/en14134026
Submission received: 1 June 2021 / Revised: 29 June 2021 / Accepted: 30 June 2021 / Published: 4 July 2021
(This article belongs to the Special Issue Resilience and Climate Adaptability of Buildings and Urban Areas)

Abstract

:
The recent reports from the Intergovernmental Panel on Climate Change (IPCC) urge for the reconceptualization of our design of the urban built environments. However, current efforts to integrate urban environmental assessment into practice in Egypt are proving insufficient. This paper utilises the Ladybug tools simulation plugins to investigate the impact of changing the morphological characteristics of three-block typologies (scattered, linear and courtyard) and their associated parameters to understand their multidimensional relationship with environmental conditions, outdoor thermal comfort and energy use intensity. This study based in Cairo, Egypt, considers 3430 hypothetical geometrical configurations comprising of a variety of design parameters and indicators. The results show a strong correlation between the design parameters and the combined performance of thermal comfort and energy consumption (R2 = 0.84), with urban density having the strongest impact on both thermal comfort and energy use (R2 = 0.7 and 0.95, respectively). The design parameters exhibited a consistent impact on the different typologies, albeit with varying magnitude. Compact and medium-density urban forms are shown to elicit the best overall performance, especially for ordinal orientations (e.g., ~45°) across all typologies. Compact high-density scattered forms are favoured when considering thermal comfort, while courtyards outperform other typologies when considering energy efficiency and overall performance.

1. Introduction

The global population is expected to grow to 9.7 billion by 2050, with ~70% of those people living in urban areas [1]. With cities currently consuming ~76% of global primary energy and producing 43% of the related CO2 emissions [2], it is clear that urban scale studies are a crucial part of the discussion about the future of built environments. Moreover, the building sector alone accounts for approximately 30% of the global final energy consumed, 70% of which are shared by the residential sector [3]. Urbanisation, as a process, not only transforms the spatial and socio-economic distribution of rural and urban populations, but also alters the energy budget of the built environment. Densification of the built environment is often typified by narrower urban canyons with impervious construction materials, reduced vegetation, and increased pollution, leading to increased sensible heat storage, shifting longwave heat emission, entrapment of shortwave radiation within the street level, as well as hindering the potential for evaporative and convective cooling, creating an Urban Heat Island (UHI) [4].
The study of the built environment is inextricably linked with the energy exchanges between the pedestrians and their surrounding urban elements. Outdoor thermal comfort is recognised as one of the key performance indicators (KPI)s for urban environmental assessment and further can be a determinant of travel choices pedestrians make and activities they undertake. However, there are relatively few studies dealing with outdoor comfort compared to those dealing with indoor spaces. This is mainly due to the huge spatial and temporal fluctuations of microclimatic conditions surrounding pedestrians, e.g., air temperature, wind speed, humidity and solar radiation, as well as the interconnectivity between these conditions and how pedestrians react physically and physiologically to achieve psychological satisfaction [5,6]. Given the interdependent relationship between the size, density, morphological and typological characteristics of a city and both the urban microclimate and energy consumption, the built environment has a key role to play in addressing global environmental issues, rather than just being part of the dilemma [7,8].

1.1. Background

The relationship between the local climate and the urban form design is reciprocal, such that the design response of architects and urban designers is often informed by the local climatic conditions, and in return, urban elements pose an impact on the local as well as the micro-scale climate [9]. One of the pioneering studies trying to understand this relationship was the work of March et al. [10] who suggested six simplified urban patterns in the form of archetypal building forms to investigate how density and surface coverage affect daylighting. Studies using these archetypes have recently proliferated to investigate different environmental qualities. Gupta [11] studied the thermal performance of three archetypes in a hot-arid climate with respect to their discomfort index as a function of solar exposure. In the same context, Ratti et al. [12], by virtue of image processing of Digital Elevation Models (DEMs), analysed shadow density and daylight distribution along with sky view factors as indicators for the thermal performance of March and Martin’s archetypes. Both studies have acknowledged the courtyard design as appropriate for hot-arid climates. Within those studies, the rationale behind employing generic urban forms was to seamlessly standardise a set of morphological parameters and link them to environmental conditions. Following the same approach, Oke proposed a simplified classification of urban climate zones based on the built form configuration, terrain roughness, aspect ratio and ground imperviousness [13], which was further developed into 17 Local Climate Zones (LCZs) that delineate regions of uniform built types, land cover, material and human activity that extend horizontally from several hundreds of meters up to several kilometers [14]. “The internal homogeneity portrayed by each LCZ is unlikely to be found in the real world. The 17 patterns should nevertheless be familiar to users in most cities, and should be adaptable to the local character of most sites” Oke articulated [14]. In a series of studies by Salvati and others [15,16], they examined the UHI intensity, heating and cooling demand along with the diurnal cycles of air temperature in five normalised urban textures in Rome and Barcelona. They concluded that, in a Mediterranean climate, compact (horizontally dense) urban textures with Site Coverage Ratio (SCR) greater than 0.5 entail lower annual energy consumption than in rural areas, although they exhibit relatively higher UHI intensities in winter. Tereci et al. [17], pointed out that courtyard forms are disadvantaged in the oceanic climate of Stuttgart, where they showed higher heating demand that reached up to 20% at their highest density. Taleghani et al. [18] on the other hand, compared the pavilion, linear and courtyard forms in the temperate climate of Rotterdam, with regards to their annual heating and lighting energy demand, and using the running mean temperature as an indication for thermal comfort. Their results showed the courtyard saving up to 22% of heating energy and, besides the linear forms, with less discomfort hours at both low and high densities. Part of this disparity can be explained by the way Taleghani et al. compared their results on each apartment’s total energy rather than the whole building’s consumption as in Tereci et al. [17]. The main reason, nonetheless, remains the different climatic contexts, built form configurations and their corresponding design objectives as Oke [19] explained.
The definition of design parameters is largely associated with the scale, objectives and study approach. On the urban canyon scale, building heights (H), street width (W) and the aspect ratio (H/W) along with Sky View Factor (SVF) have long been agreed upon among researchers to represent the urban geometry [20,21]. Orientation is another key aspect that affects the canyon performance but also the seasonal variations of energy loads [22] and comfort levels [23]. On the block or urban scale, the parameters extend to include, but are not limited to, Floor Area Ratio (FAR), Surface to Volume ratio (S/V), building coverage ratio (BCR) and Open Space Ratio (OSR) [24]. Martins et al. [25] used CitySim to investigate the impact of eight morphological parameters on solar radiation availability to a generic scattered layout in Maceió, Brazil, to conclude that albedo, H/W and distance between buildings together account for 80% of the impact over west facades and roofs. A recent study proposed a new satellite-based method for extracting six morphological parameters, namely, BCR, H, SVF, as well as Building Volume Density (BVD), Frontal Area Index (FAI) and roughness length [26]. Meanwhile, urban scale studies are always confronted by conflicting objectives, even using simulation tools. Despite the advancements in computational capabilities, the integration of multiple tools to bring different environmental considerations together is computationally expensive and time-consuming. For this reason, urban geometry studies in the last 2 decades, by and large, can be categorised into; (1) studies investigating the impact of urban geometry on energy consumption, passive solar radiation and daylight availability and; (2) studies concerned with urban geometry, UHI and microclimate.

1.1.1. Urban Geometry and Energy Consumption

The study of Ratti et al. [27] sought to link the gap between solar gain modelling and energy demand. They used the Light and Thermal (LT) method to estimate building energy demand in three case studies in London, Toulouse and Berlin. Their results showed that the passive (reflected/diffuse light only) to non-passive area is a stronger indicator of energy consumption than SVR. Additionally, around 10% and 55% difference in energy usage is due to morphology variations and glazing optimisation, respectively. Okeil [28] introduced the residential solar block—a hypothetical building form—that outperforms linear and conventional block typologies by maximising winter but minimising summer solar radiation as a strategy for minimising heating and cooling demands, respectively. Space cooling demands for stand-alone buildings were compared to that of buildings within a street canyon configuration in Allegrini et al. [29] and Vallati et al. [30]. Both studies have shown that the latter requires less cooling demand than stand-alone buildings. With the increased tendency of using parametric studies, the concept of regenerative urban design became evident in energy usage studies, which included either Martin’s archetypes or hybrids thereof. Vartholomaios [31] utilised the Ladybug tools [32] to calculate the annual energy loads for three typologies with a total of 540 possible configurations, in a Mediterranean climate of Thessaloniki, Greece. Their results proposed an elongated perimeter block over E-W axis with minimum distances as the best configuration. Javanroodi et al. [33] simulated 1600 cases of different built densities, building forms and urban patterns of the neighbouring buildings to test the cooling loads and ventilation potential of a target building in a hot-arid climate in Tehran. Recorded from April to September, their results showed that maximum density, U-shaped and Courtyard-shaped forms presented the lowest cooling loads and the highest ventilation potential, respectively, among the different patterns. While some authors argue about the higher cooling demand of the courtyard typology [34,35], other authors took the concept of “nearly zero-energy buildings” (NZEB) [36] to the broader level of urban scale, to claim that courtyards are the most eligible forms for achieving 100% load match (Load match stands for the ratio between energy demand and energy supply by on-site PV generation.), compared to other typologies [37,38]. Furthermore, a multi-objective optimisation algorithm was used to evaluate the cooling and heating demands as well as PV potential for 12 generic typologies in the humid subtropical climate of Shanghai by Wortmann et al. [39]. Their analysis showed that L-shaped courtyard represented 33% of the optimum cases followed by high FAR linear and open courtyard typologies.

1.1.2. Urban Geometry and the Microclimate

The energy budget of an urban canyon was first investigated in the pioneering study of Nunez et al. [40], followed by studies on the vertical gradients of air [41] and surface temperatures [42]. The relationship between the canyon’s aspect ratio (H/W), SVF and UHI was established by Oke [43], and confirmed by many others. Higher H/W with lower SVF provides more shading to the canyon facets and the ground [44], and hence offers lower daytime air and ground temperatures [45,46], albeit with lower radiative losses [47] and cooling rates during the night [48]. Johansson [20], on the other hand, found that the relative cooling of the canyon’s daytime air temperature exceeded the night-time warming in a hot-dry climate of Fez [20], and in another study in a hot humid climate of Colombo [49]. Additionally, orientation has a key role in defining a canyon’s thermal performance. For instance, studies in hot-arid climates advocated the use of deep canyons with NS orientations [50,51], while EW orientations were recommended in temperate [23] and tropical wet-dry climates [52]. Qaid et al. [53] found that NE-SW canyons with higher building heights on the NW side performed better in the hot-humid climate of Putrajaya, Malaysia, when they investigated six asymmetrical canyons in terms of their daytime air temperature and night-time UHI. Notwithstanding, the role of orientation is also dependent on the H/W. In their study of 18 urban canyons in a Mediterranean climate in Thessaloniki, Greece, Chatzidimitriou et al. [54] recommended using very deep canyons (H/W~3.3) in all orientations except NE-SW canyons where medium ratios (H/W~1.7) were shown to be favourable in both summer and winter. A few studies have sought to understand the relationship between a city’s morphology and the local climate. Taleghani et al. [55] compared three typologies within two orientations and claimed that courtyard and NS slab typologies are best for lower air temperatures, Mean Radiant Temperature (MRT) and Physiological Equivalent Temperature (PET) in a temperate climate. Allegrini et al. [56], although in a similar climate, criticised the two typologies with regards to their lower convective cooling. Moreover, some authors have sought to link the thermal performance of urban blocks to their morphological parameters. Jin et al. [57] compared eight parameters of 27 locations in Singapore, characterised by tropical rainforest climate. Their regression analysis showed correlations of daytime air temperatures with an SVF and green plot ratio of 0.59 and 0.47, respectively. Further, a study of five quarters comprising 50 urban blocks in New Aswan, Egypt has revealed that 56% of blocks’ PET depend on FAR and space enclosure [58]. More recently, in a Mediterranean climate, a parametric study of four FARs, three widths and four window-to-wall ratios was conducted by Natanian and Auer [59], to estimate the thermal comfort, daylighting as well as the load match of four different typologies (192 total cases). Courtyard typology was shown to outperform other typologies in thermal comfort, and so did they in average load match, given lower FAR are used [59].
It is clear from this review of previous studies that results and trends in performance are disparate and constituently driven by various conflicting design objectives, regional and climatic contexts, as well as the geometrical characteristics investigated. Additionally, the fact that the computational capabilities are rapidly increasing spurs the research on the multi-aspect environmental qualities of the built environment, especially in areas susceptible to severe climatic conditions, especially, where performance-informed decisions are most needed, such as in Egypt. The recent transformation in many Arabic countries, including Egypt, from the concept of a traditional neighbourhood unit into luxurious but socially segregated private communities has increased the number of factors (land value, privacy, etc) competing with environmental considerations. This explains why low-rise apartment buildings and villas are ubiquitous in preference of the courtyard residential complexes, despite the agreement on the improved performance of the courtyard typology in hot-arid regions.

1.1.3. Advancements in Urban Modelling Tools

Building and urban performance simulation has become an essential approach for modelling and evaluating the built environment. Given the recent growth of computational capabilities, several models have been developed. Building Energy Models (BEMs), such as EnergyPlus [60], TRNSYS [61] and CitySim [62] are often criticised for not using the real microclimatic conditions of the outdoor environment within urban areas and rather using typical meteorological data files representative of open and rural areas. District-scale Urban Climate Models (UCMs) such as the Urban Weather Generator (UWG) [63] and ENVI-met [64] have widely been acknowledged to successfully reflect the outdoor conditions and as such been coupled with BEMs in a growing body of research [65]. Examples are abundant, for instance, ENVI-met with TRNSYS [66], UWG with EnergyPlus [15], and METEONORM with CitySim [29]. A recent example of chaining models was using the World Urban Database and Access Portal Tools (WUDAPT) to generate LCZs based on Stewart and Oke’s classification [14] as inputs to the district scale Weather Research and Forecasting (WRF) model which in turn generates the boundary conditions needed in the microclimate simulations using ENVI-met [67]. The tendency to couple UCM and BEM, however, is often confronted by the need to balance the computational cost of detailed bottom-up approaches and the reliability of simplified top-down approaches, as well as having different inputs needed. Moreover, most of these workflows are rarely used in parametric analyses or urban scale optimisations due to the considerable computational overhead [38]. The necessity to couple—or chain—various tools and automatically exchange data between them qualifies Grasshopper [68] to be a panacea for urban design rigidity and foreshadows a paradigm shift in environmental performance-based design exploration. Grasshopper, the visual platform for scripting, is an integrated feature of Rhinoceros 3D (Rhino), which allows architects, designers and others with no significant knowledge about programming to develop their own generative algorithmic designs in a user-friendly graphical interface. Developed in 2007 by David Rutten, at McNeel & Associates [69], Grasshopper allows users to seamlessly and repetitively manipulate their input parameters in a flow chart-like working procedure, and simultaneously have real-time feedback as well as integrated post-processing platforms. Thanks to these features, together with two-way data streaming (looping) plugins, e.g., Hoopsnake and Anemone, parametric analyses of regenerative urban design with multiple iterations have become viable [59]. More interestingly, using the Rhino Common Software Development Kit (SDK), Grasshopper integrates such common scripting platforms as Python, C# and VB.NET, giving the designers the opportunity to develop their own components or rather modify an existing one. Furthermore, Grasshopper includes components for single (Galapagos) and multi-objective (Octopus) evolutionary optimisation [68]. Undoubtedly, the use of open-source plugins in Grasshopper makes it popular amongst designers and facilitates the application of optimisation studies in practice.

1.2. Research Problem and Objectives

Egypt is racing against overwhelming population growth and striving to contain slums and urban sprawl within and around its metropolis, Cairo. There has been an extensive campaign for expanding existing cities as well as planning for new communities. However, the governmental endeavours to reduce energy consumption [70] were confined to the building scale taking no account of the morphological relationship with neighbouring buildings. Furthermore, The Egyptian Unified Construction Act [71] stipulates mainly spatial rather than climate-based design criteria. The fact that the total final energy consumption in Egypt has nearly doubled between 2000 and 2020 with the building sector responsible for 42% of this consumption [72] necessitates a paradigm shift in both research and practice, but most importantly, linking the gap between them. However, to the best of the authors’ knowledge, there are no multi-dimensional studies of Egypt that investigate energy efficiency together with outdoor thermal comfort, despite the urgent need for them.
This paper addresses the need of urban planners and designers to bring energy performance and thermal comfort together to acquire a multi-criteria performance-driven decision support in the early design stages. The paper does so by investigating the impact of different typologies and their associated morphological parameters, namely, the distance between buildings, building heights, orientation, FAR and BCR on the outdoor thermal comfort and building energy consumption. The study capitalises on the parametric capabilities of Grasshopper and its environmental analysis plugins, Ladybug tools to highlight the trade-offs between different performance criteria through an iterative simulation workflow.
The study is conducted in the hot-arid climate of Cairo, Egypt, where Cairo accommodates almost 50% of Egypt’s urban residents and accounts for at least 32% of the current residential constructions, and around 44% of the residential apartments with air conditioning [73]. The objective of this study is to define the optimum design parameters on an urban block scale that simultaneously maximise outdoor thermal comfort and minimise energy consumption. Design guidelines are presented to help design experts achieve more liveable and sustainable urban communities.

2. Methodology

A simulation approach for hypothetical case studies is applied in this study. This approach is appropriate in parametric studies aiming to support stakeholders in the planning stage, where the use of abstracted building typologies and standardised design parameters reduces the complexity of parametric combinations, hence the simulation of a higher number of case studies, whose results can be easily interpreted by designers.

2.1. Case Study Modelling

A hypothetical urban block comprising of arrays of residential buildings, 21 × 21 m2 each was parametrically modelled in Grasshopper within a 3 × 3 identical surrounding context. Each building is 441 m2 per floor, which comprises four residential apartments. Floor heights were set to 3 m to match the step size of the building heights in Table 1 (a single floor higher per each building height increment). Unlike parametric studies using the same approach [31,38], a generic Python script was used in this study to automatically switch back and forth between different building typologies (Figure 1-top), based on the distance between buildings (see Supplementary Materials). Scattered layouts are simulated with distances between buildings ranging between 6 m and 18 m, where the distances between blocks are kept at half of this distance (as illustrated in Figure 1). Distances 21 m and 24 m trigger the creation of an intermediate building that transforms scattered layouts into linear forms (one axis triggered) or courtyard forms (both axes triggered). Distances 24 m on both axes were set to create a courtyard form with 6 m rather than 12 m distance between blocks in order to have a comparative analysis of the same distances throughout the different typologies.
This number of permutations resulted in a simulation of 3430 cases in a single run. Since linear forms could be generated in both NS and EW directions, maximum orientation was set to 90°. Maximum and minimum thresholds of the simulated parameters (Table 1) were limited in accordance with the Egyptian Construction Act [71], with the exception that the minimum distances between buildings were one step lower, recommended based on a previous study by the authors [74]. This dynamic parametrisation of buildings’ geometry has generated a wide range of density indicators; BCR ranging from 0.33 to 0.64 and FAR ranging from 1.00 to 7.65. The ground surface was further subdivided into a number of sub-surfaces proportional to the number of points of interest (Figure 1-bottom row) for outdoor comfort calculation in a way that balances the accuracy of shading variation and computation time.

2.2. Simulation Workflow

The simulation workflow applies an aggregated bottom-up approach by chaining the inputs and outputs of validated software engines, i.e., EnergyPlus [60] and UWG [63], by means of the Ladybug tools [32], the plugins of Grasshopper. EnergyPlus, the BEM interface, was validated with ASHRAE 1052RP test and verified against the BESTEST [75], as such was proven to be suitable for small district-scale analyses similar to the study in hand. The UWG uses an algorithm that combines a variety of geometrical parameters, such as average building heights, footprints, surface roughness and thermal properties to reflect the UHI effect induced by the built environment. This happens by morphing the hourly air temperatures and relative humidity within the “rural” weather data file and generating a new “urban” weather file. Moreover, the validation of the algorithm with field measurements in various climates [16,63,76] has shown its reliability in homogeneous urban contexts as in this study. Figure 2 depicts how the input and output data are streamed between the Ladybug tools and different simulation engines. Simulation parameters (see Section 2.4) and climatic data (Section 2.5) are kept fixed in this study. The iteration of the dynamic parameters (Section 2.1) triggers the simulation engines via the Ladybug tools (see Supplementary Materials); Dragonfly links Grasshopper to the UWG to generate an urban weather file where; Honeybee links Grasshopper to EnergyPlus to calculate the energy loads and the outside surface temperatures. View factors between the points of interest (representing a standing mannequin) and the sky or surrounding surfaces are calculated using the raytracing capabilities of Rhino. View factors are further passed through a Python component dedicated to accounting for the absorbed sky longwave and solar shortwave radiation by a human body, following, respectively the equations of the MENEX [77] and SolarCal [78] models. The aggregate amount, together with the longwave radiation from surrounding surfaces constitute the MRT, which in turn is combined with the urban climatic data from UWG to estimate the outdoor thermal comfort. Ladybug components are used for the visualisation of environmental data and the results. A full description of the equations governing the model can be found in Ibrahim et al. [79], where detailed graphical representations of the Grasshopper components used were shown by Evola et al. [80]. The workflow described above was validated against the ENVI-met software, which in turn was validated against field measurements in Cairo [81]. The results showed considerable agreement between the two models in terms of the MRT and the Universal Thermal Climate Index (UTCI) with (R2 = 0.94 and 0.96 respectively) over a whole day, and even more precise during daytime hours [82]. Furthermore, the workflow was validated with field measurements in a Mediterranean climate as well as a hot-arid climate similar to the current study, showing a good agreement with regards to both MRT and the Physiological Equivalent Temperature (PET) with R2 = 0.92. This qualifies the workflow to be sufficiently appropriate for the purpose of this study.

2.3. Performance Evaluation

In this study, the performance of different typologies and their corresponding morphological parameters are evaluated based on two environmental indicators, energy consumption and outdoor thermal comfort. Energy consumption is accounted for by the Energy Use Intensity (EUI) metric; the total energy loads due to cooling, heating, lighting and electric equipment normalised by the total floor area. Note that the courtyard form is exemplified here as a group of residential buildings, also known as a perimeter urban block, rather than a single courtyard building. This is accounted for by dividing the total EUI by the number of buildings in the typology to estimate the EUI in a single building, following [18]. The Universal Thermal Climate Index (UTCI) [83] was adopted to indicate outdoor thermal comfort for several reasons. UTCI has widely been applied across all climatic contexts and validated against field surveys and other thermal indices. Additionally, UTCI presents a detailed categorisation of thermal sensation for extreme cold and hot conditions, in which the equivalent temperature for sensation is provided in degrees Celsius, which makes it more perceptible by designers. On a grid size of 6 m, receptor points were distributed in and around each geometrical iteration (Figure 1-bottom), 1.1 m above ground level, to denote the thermal sensation of a standing person. Outputs of the UTCI are recorded during daytime hours (5 am to 7 pm) and averaged across all the receptor points. UTCI results are further averaged across a typical hot month, July (see Section 2.5.) to provide a basic value for comparison, while EUI results are presented as monthly aggregate.

2.4. Parameterisation

In each case, the analysed buildings were vertically subdivided into EnergyPlus thermal zones, respective to the number of building floors, where the surrounding blocks were defined as shading contexts, and the solar distribution module “Full interior and exterior with reflections” was used. An EnergyPlus thermal zone with no wind exposure nor internal loads was defined as a ground zone, where the upper surface represents the ground floor surface. Heat, Ventilation and Air Conditioning (HVAC), activities, schedules, as well as the thermal properties of construction materials were set following the study of Mahdy et al. [84], based on the Egyptian Residential Energy Code [70]. Cooling setpoint was set as the upper temperature bound calculated according to the adaptive comfort model by ASHRAE 55–2013 with 90% of occupants comfortable and using the weighted running mean temperature of the previous week in hybrid (air-conditioned/naturally ventilated) buildings, as a common practice for energy saving in energy modelling studies [85]. A fixed schedule for HVAC and occupation template (weekdays, working hours, etc.) was used in all scenarios, based on the common lifestyle of Egyptian residents [84], where the default “EnergyPlus Ideal Air Loads” HVAC algorithm was used. Window-to-Wall ratios (WWRs) were set as 12% for Eastern and Western facades, 15.6% for Northern façades and 15% for Southern façades, according to the Egyptian Residential Energy Code [70]. Table 2 lists the different simulation parameters as used in this study, while the physical and thermal properties of the construction materials can be found in Appendix A.
Based on a preliminary study by the authors, coupling the simulation workflow with OpenFOAM for CFD analyses using the wind factors method had minimal impact on the output UTCI. The sensitivity analysis of Natanian et al. [86] using the same workflow in a hot desert climate confirmed our inference and showed the MRT to be the most dominant factor. Consequently, weather file 10 m-high wind speeds were converted into 2 m-high wind speeds and based on the wind profile power law by using a dedicated Ladybug component.

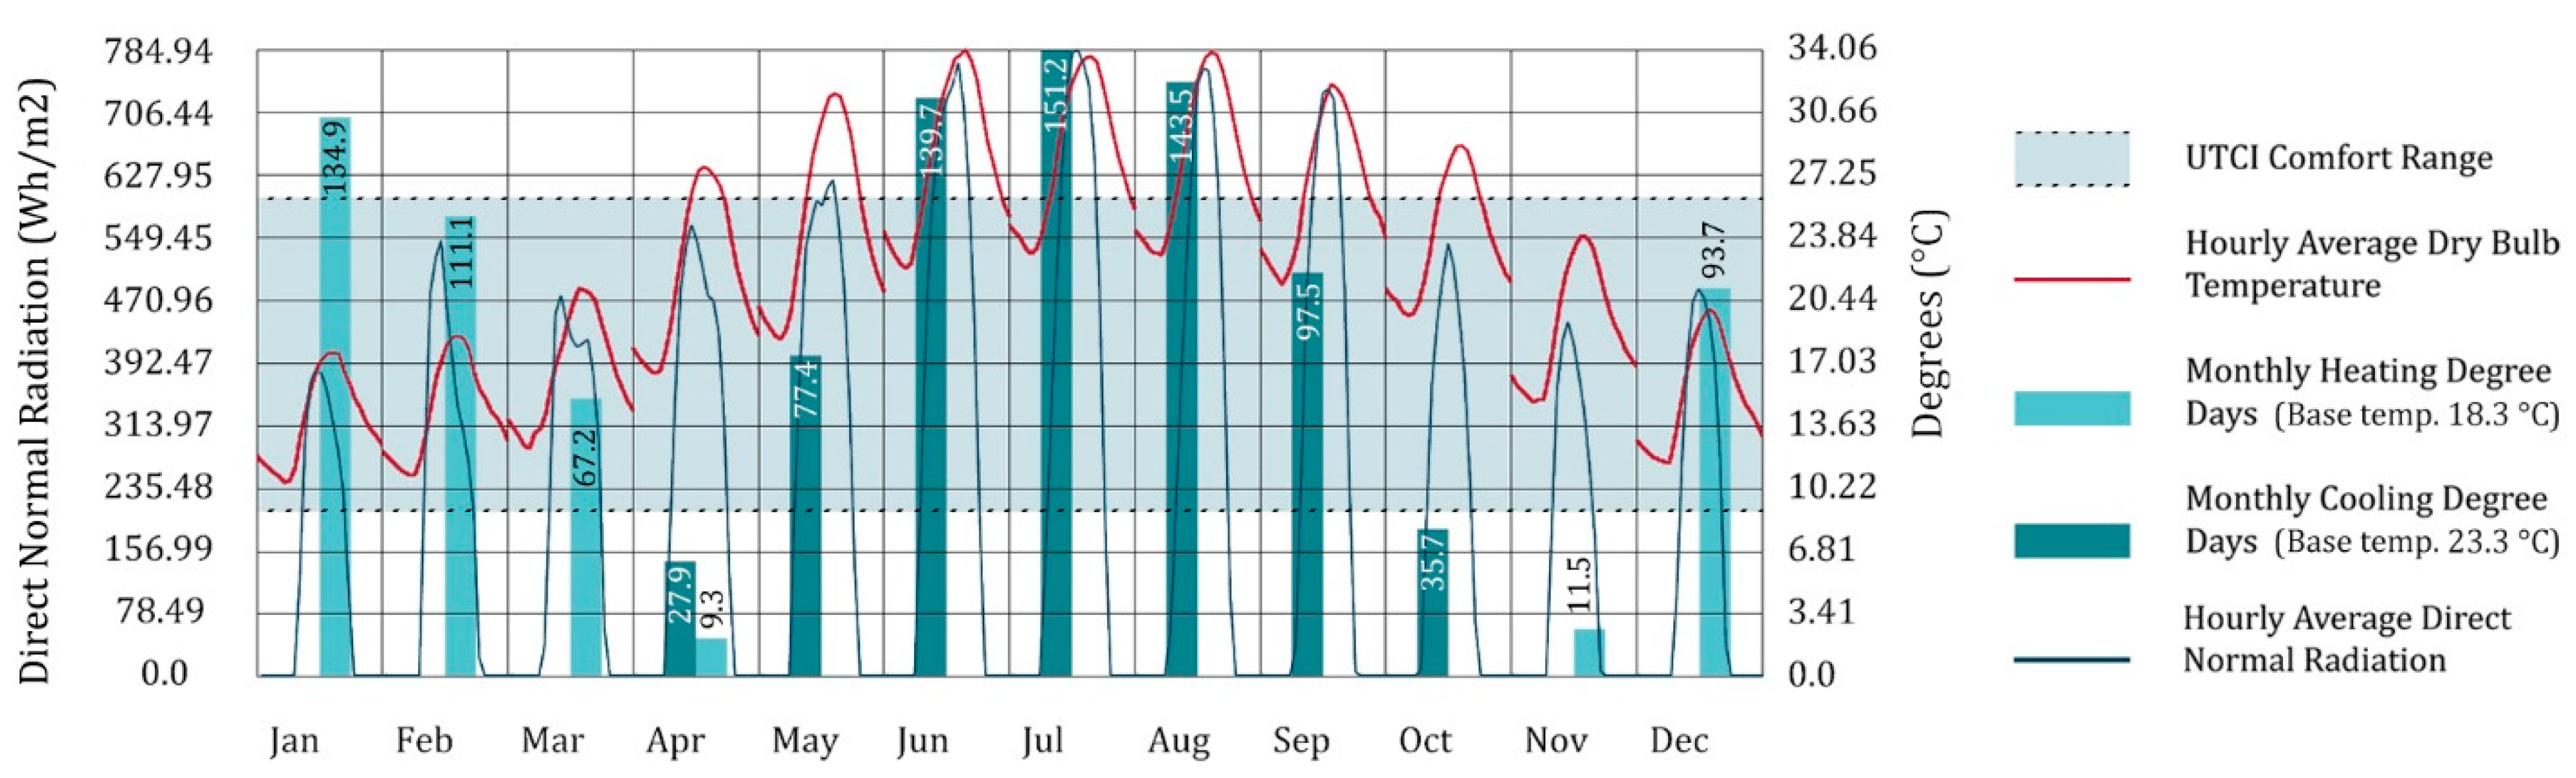
2.5. Climate Context

Egypt encompasses a diversity of climatic conditions, ranging from extreme hot to extreme cold conditions. However, it is generally categorised as a hot-desert climate (BWh), according to the Köppen Geiger classification. The climate is characterised by very high solar radiation intensity most of the year, with the highest average temperatures recorded in July and the lowest in January.
Figure 3 shows the highest average hourly air temperatures, direct normal radiation as well as cooling degree-days occurring in July. Accordingly, this study is conducted in July to represent the worst-case scenario. Cairo, the governorate of Egypt, is selected for this study since, in addition to the aforementioned reasons, it represents a typical hot-arid climate in Egypt, and also suffers from the UHI phenomenon. The International Weather for Energy Calculations (IWEC) weather file for Cairo was obtained from the official webpage of the U.S Department of Energy [87] and used as input for the simulation.

3. Results and Discussion

In this section, the impact of typologies and their corresponding design parameters and density indicators on environmental performance is discussed. Design parameters are compared against 2 performance indicators, see Section 2.3., as well as a combined fitness function that refers to the joint dimensionless quality of both the average UTCI (Av.UTCI) and EUI together. The lower the fitness value, the higher the environmental performance. The following formula was used after [88] to represent the fitness function (y):
y = Av.UTCI i Av.UTCI min · C 1 + EUI i EUI min · C 2
C 1 = 100 Av.UTCI max Av.UTCI min ,   C 2 = 100 EUI max EUI min
where the subscripts (i) is the result of an iteration, (min) is the minimum value of all iterations, and (max) is the maximum value of all iterations. In order to present a perceptible interpretation for the fitness function as the percentage improvement over the lowest fitness, the following formula was used:
Combined   fitness = 1 y y max × 100
where ( y max ) is the worst fitness. The higher the combined fitness, the greater the improvement over the lowest fitness.

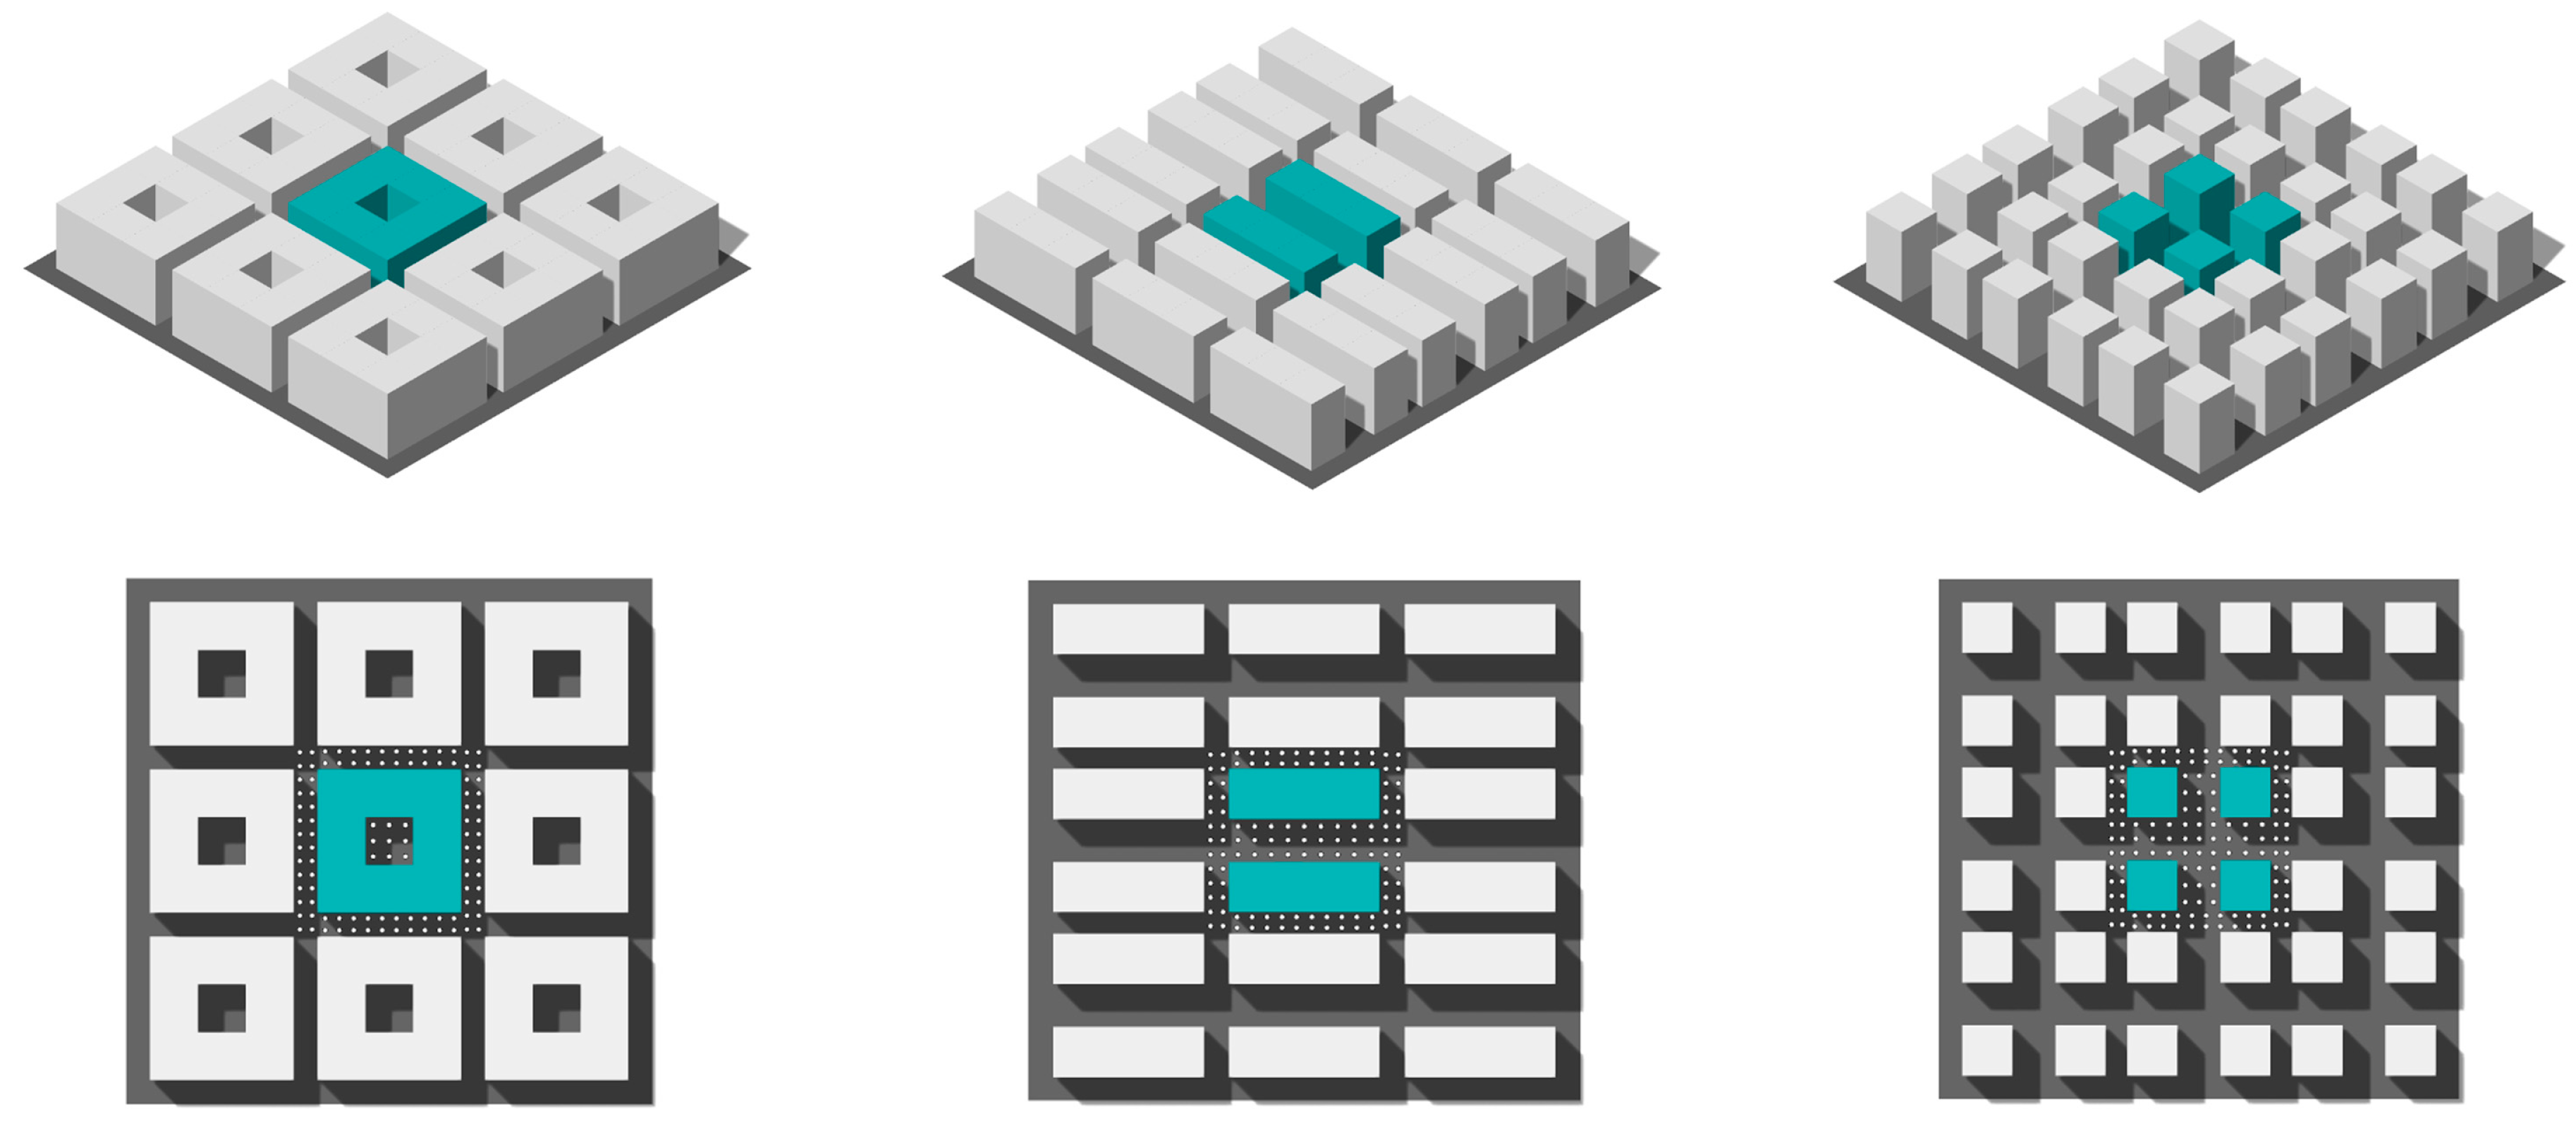
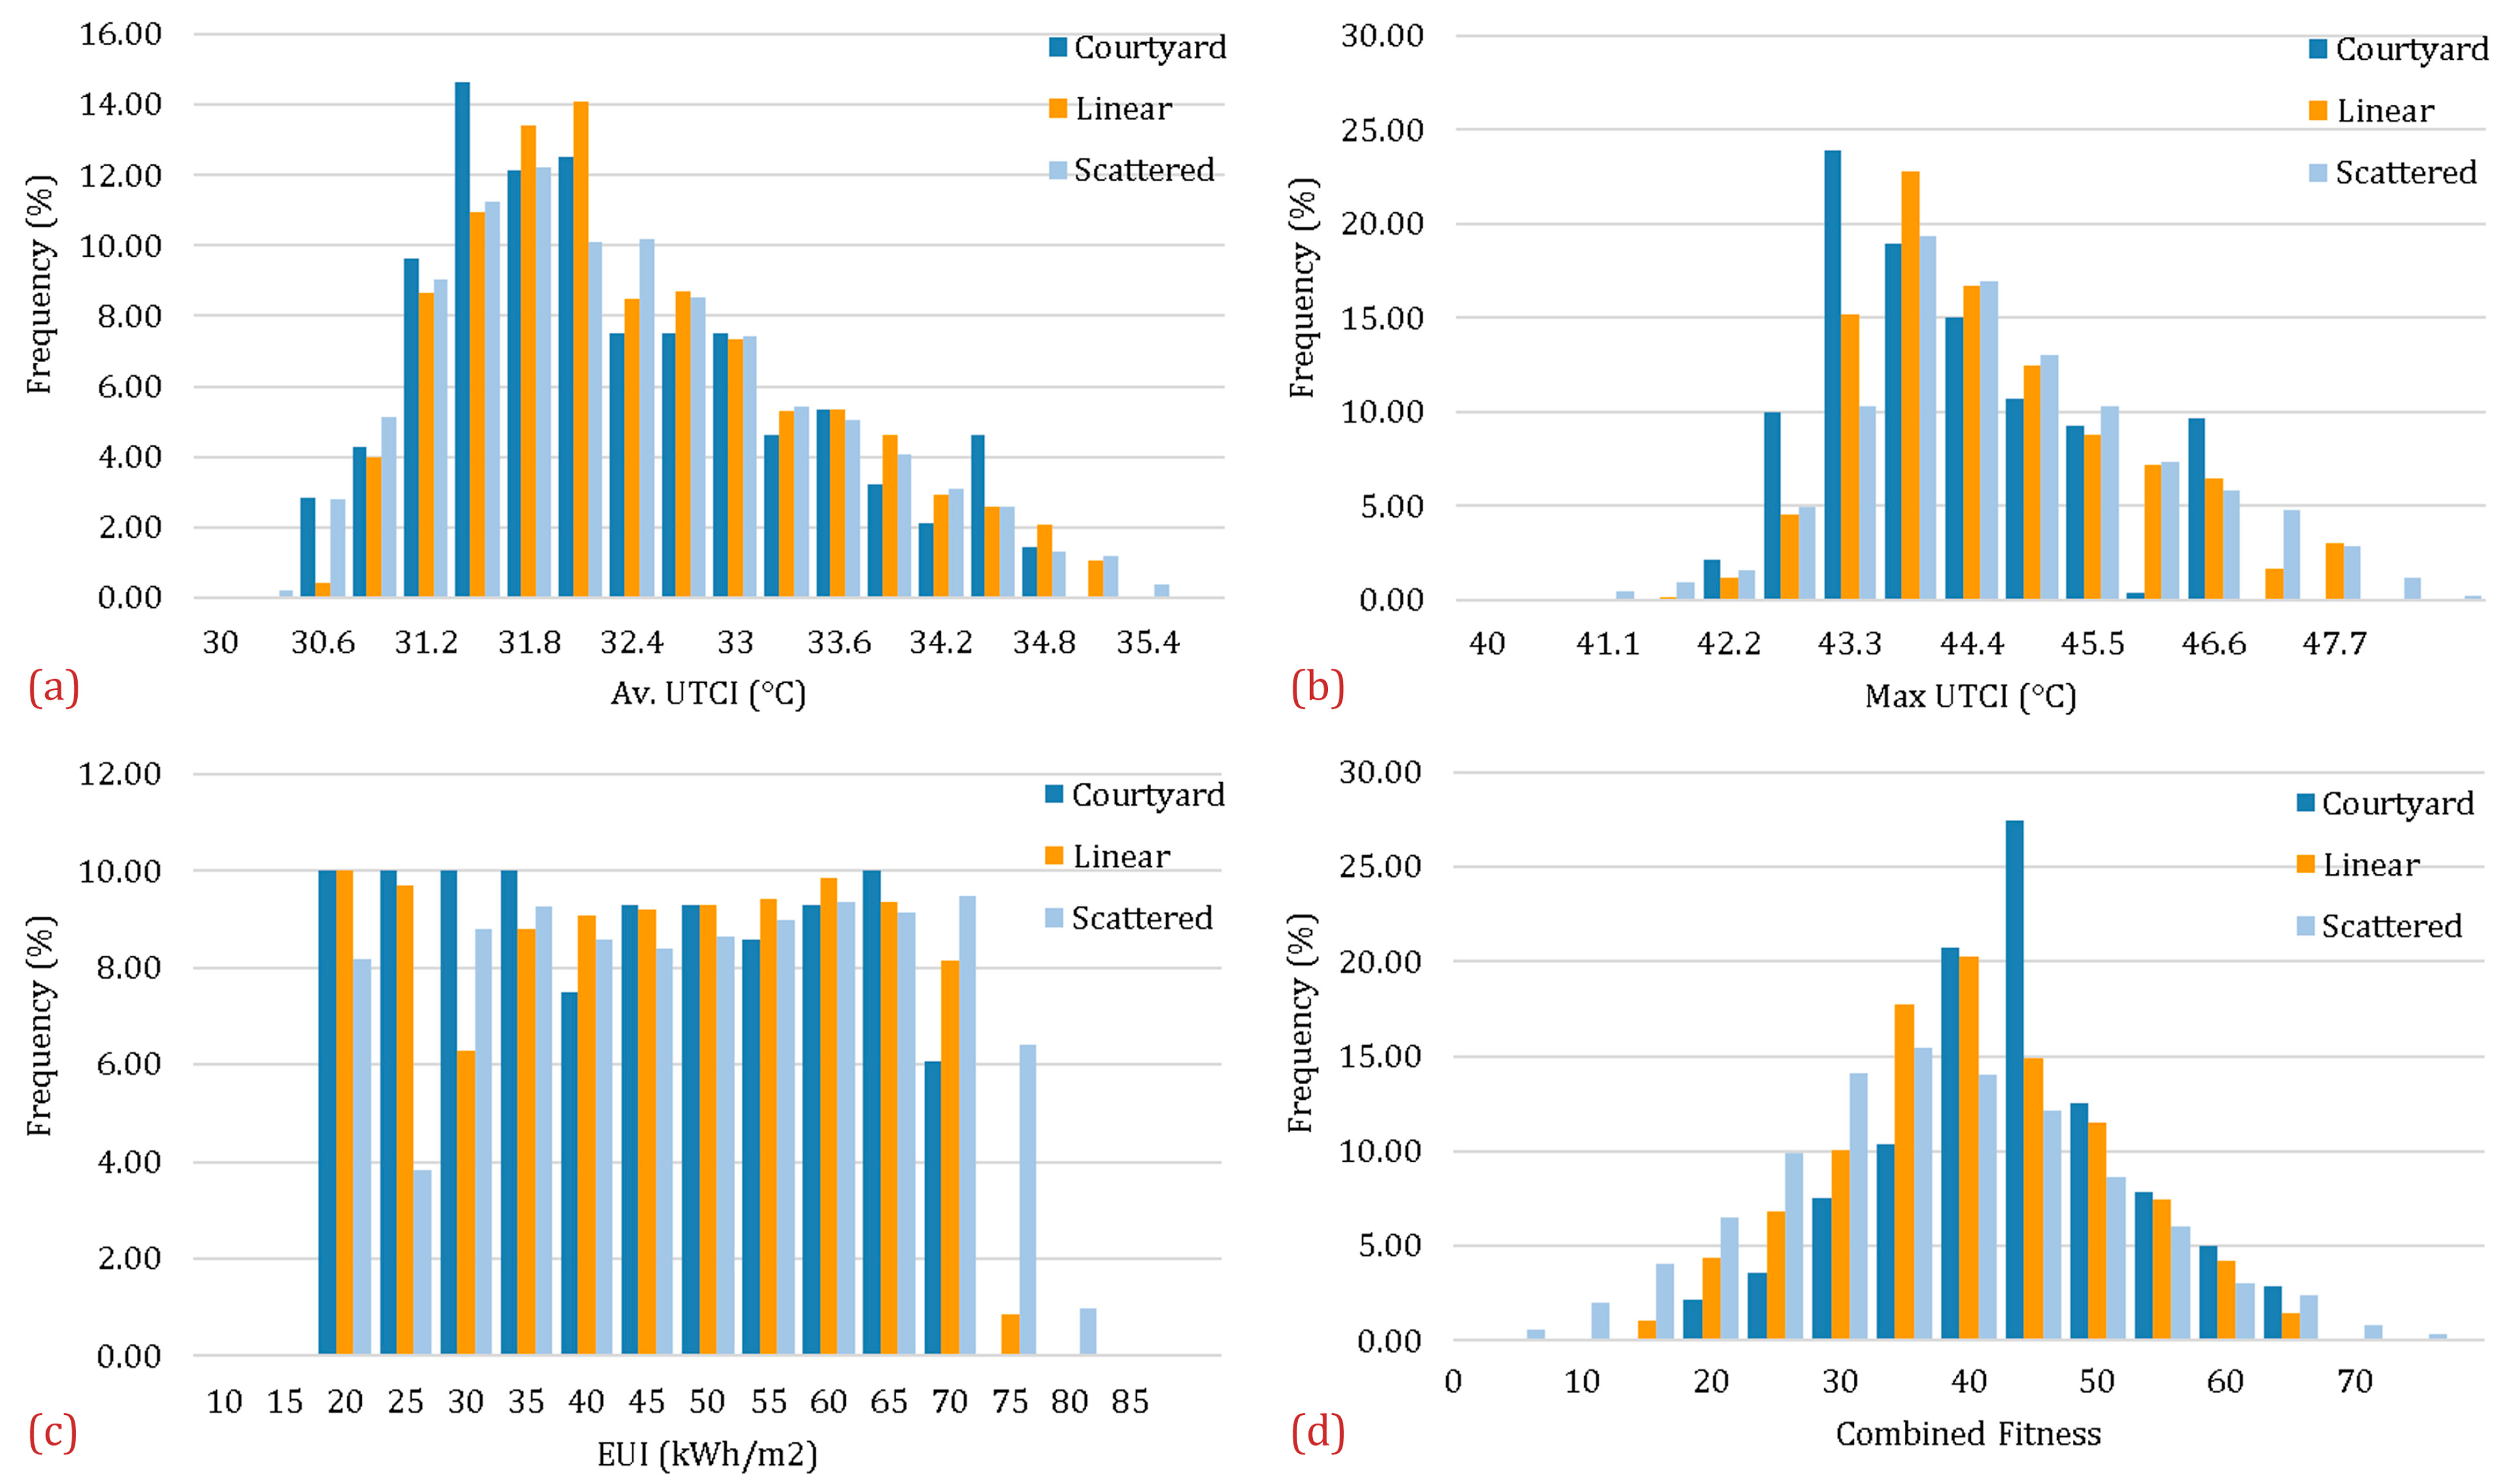
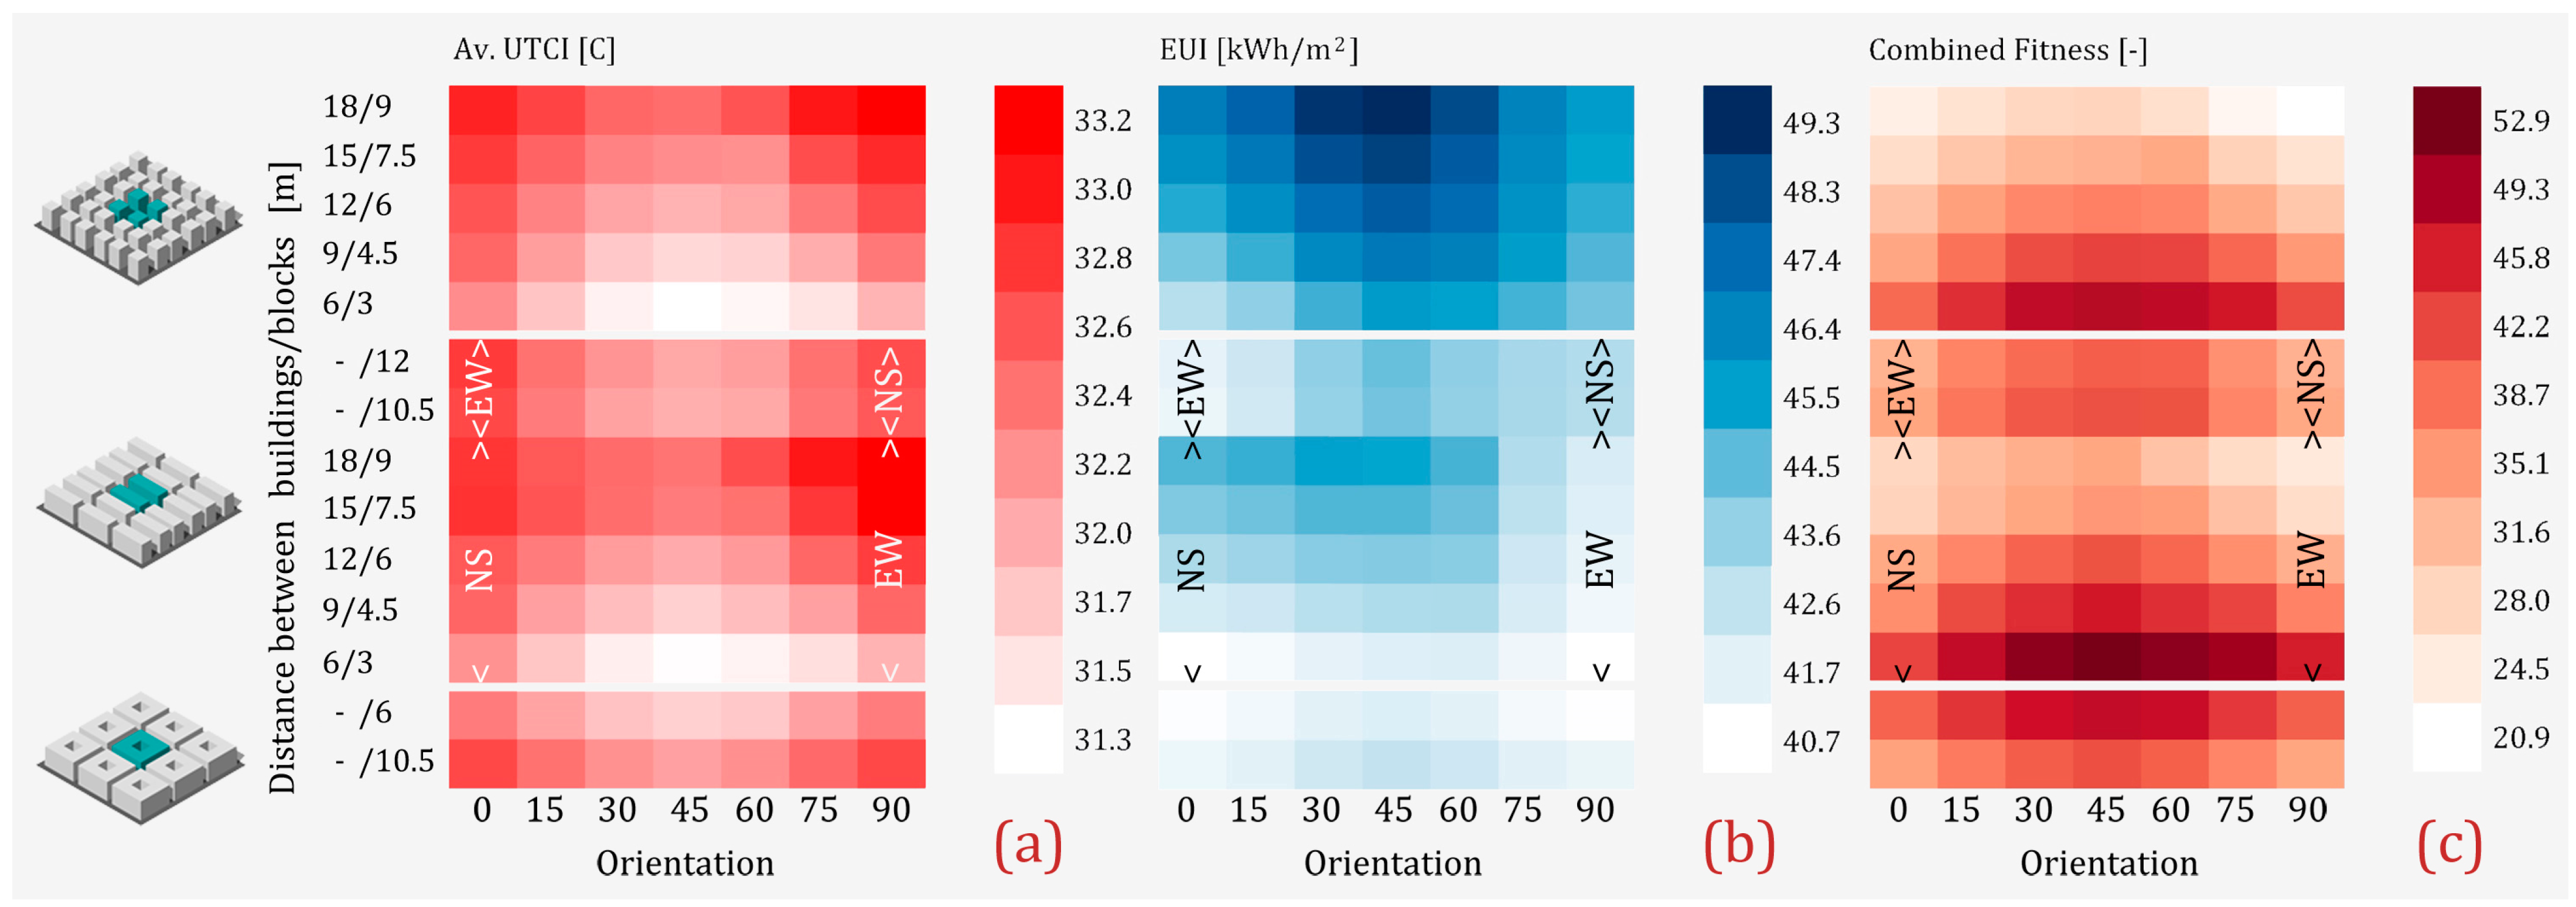
3.1. Typology and Environmental Performance

The performance of each typology varied across each of the fitness criteria. Figure 4 shows the frequency distribution for each performance criterion, recorded across the different typologies. In Figure 4a, the courtyard and scattered forms shared higher percentages of the lowest Av.UTCI. Linear forms exceeded the other two typologies around mid-range Av.UTCI, while scattered forms shared with the latter most of the highest Av.UTCI. This indicates a tendency of courtyards to maintain lower Av.UTCI as opposed to linear forms with higher values. Scattered forms are more distributed along the whole range with a mean value similar to that of the whole sample of 32.2 °C. This is also confirmed in Figure 4b, with courtyards possessing higher shares of lower maximum UTCI values recorded and the opposite for linear and scattered forms in mid and higher maxima. This implies that compact high-density scattered forms can perform as well as courtyards due to the shading they cast in both street directions. Figure 4c shows the courtyards and linear forms sharing the lowest EUI due to the larger shades they pose on blocks’ surfaces and lower percentage area of intermediate buildings’ envelopes exposed to solar radiation, especially when facing cardinal directions, keeping the indoor temperatures lower, and accordingly with a lower EUI. Scattered forms dominated the highest EUI, and again with a mean value slightly above the whole sample of 46 kWh/m2. A similar trend is noticed in Figure 4d where scattered forms are two units below average, while linear and courtyards are one and four units, respectively, above the average combined fitness of 40. This comes in agreement with the study of Natanian et al. [59] in a hot Mediterranean climate.

3.2. The Effect of Design Parameters
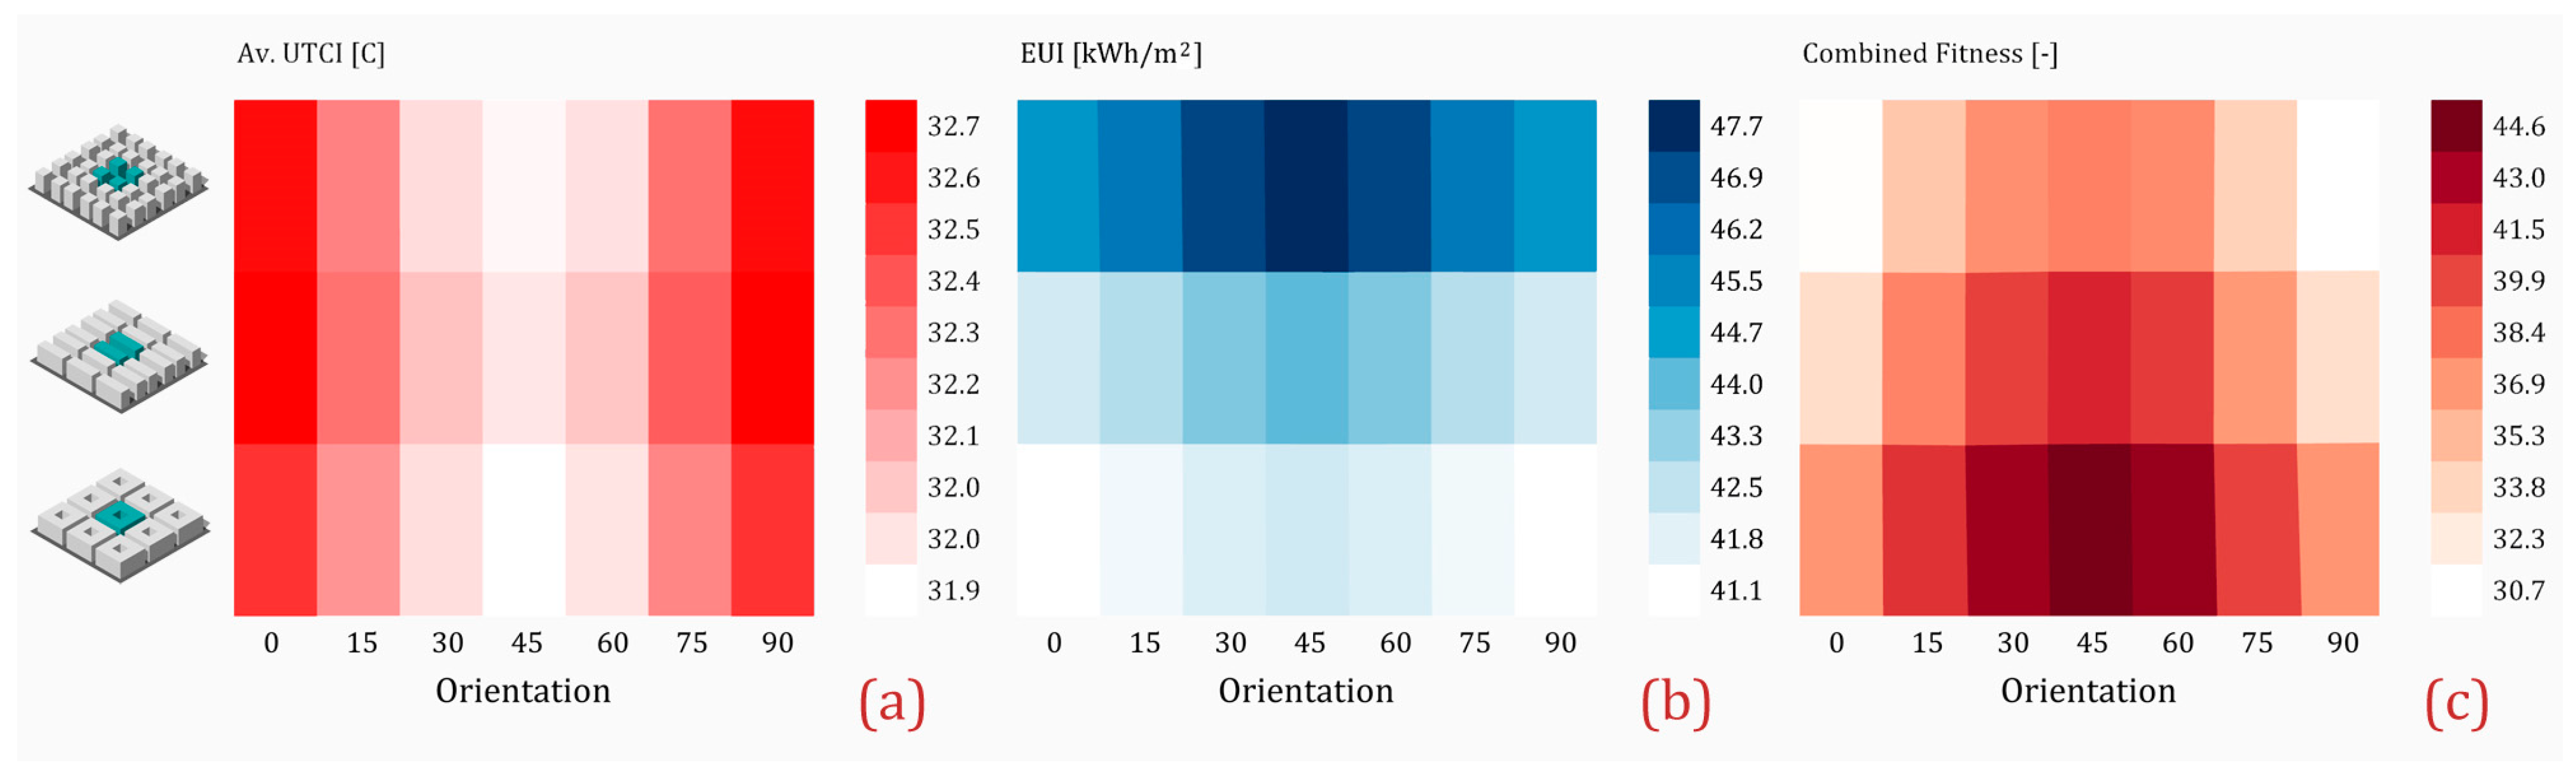
A series of linear and multiple regression analyses were run to check for the interdependency and correlation between design and morphological parameters and the performance criteria. To avoid misleading regressions due to the definition of changing typologies based on the distance between buildings, the latter was replaced by the distance between blocks. Although the first set of regressions show a statistically significant correlation with combined fitness (F (5, 3424) = 3032, p < 0.001, R2 = 0.84), they also exhibit multicollinearity, for instance between building heights and FAR, or distances and BCR. Consequently, density parameters’ regressions were made separately. A strong correlation was found between both Av.UTCI and EUI and the design parameters’ model with R2 = 0.73 and 0.97, respectively, albeit with weak to moderate individual correlations (Table 3). As a single orientation comprises a variety of other design parameters, it exhibited insignificant correlations (p > 0.05) in different analyses, although the effect of orientation is well pronounced as discussed in the next section.

3.2.1. Orientation

With solar altitude reaching as high as 83° in July, NS streets are shaded during the morning and late afternoon, while being fully exposed to higher solar radiation intensities at noon. EW streets are exposed during almost all daytime hours with minimal shading at noon due to the high solar altitude. This makes ordinal orientations preferred for lower Av.UTCI as they provide shading in both directions as shown in Figure 5a. Courtyards tend to exhibit slightly lower Av.UTCI than scattered forms, while both appear to be lower than linear forms. On the other hand, EW-facing building walls (NS streets) tend to be more exposed to solar radiation than NS-facing walls. Again, courtyards and linear elongated built forms have higher mutual or courtyard self-shading between building walls. This is clear in Figure 5b, where courtyards and linear forms appear to have less EUI than scattered forms. Although cardinal orientations entail less EUI than ordinal ones, the variations are more pronounced due to changing typology. On aggregate, as in Figure 5c, courtyards with intermediate orientations appear to be favoured, followed by linear and then scattered forms. This makes orientation alone responsible for almost 15% and 10% difference in Av.UTCI and EUI, respectively. Vartholomaios [31] reported that orientation and surface-to-volume ratio exerted the greatest influence on annual energy loads in a Mediterranean climate. Our results come into agreement with studies in temperate climates with regards to EUI [18,29], as well as in a hot-arid climate with regards to thermal comfort [58].

3.2.2. Distance between Buildings

The effect of the distance between buildings on the EW axis is similar to that on the NS axis. Accordingly, EW distances were plotted against different orientations in Figure 6 to highlight their impact on the performance of each typology. It should be noted that a single EW distance comprises the average of all other NS distances. This is exemplified in linear forms, where distances 21 and 24 represent linear EW canyons with different (NS) street widths (6–18 m) and vice versa. It can clearly be noticed that increasing distances entails higher Av.UTCI and EUI, due to the lack of shading on streets and building walls Figure 6a. The effect of orientation overpasses that of the distances, where NS canyons orientated 90° (into EW) with 18 m distances are shown to maintain higher Av.UTCI, while the lowest Av.UTCI were recorded in scattered and linear forms orientated 45° and 6 m apart. The effect also applies to the EUI with a constant increase in cooling energy as the distances increase and the shading on building walls decreases. Figure 6b shows courtyards, linear NS with minimum distances or linear EW canyons to have yielded the lowest EUI. It also reveals that NS canyons can be as energy efficient as EW canyons if streets are kept 6 m wide. This is useful in cases where both outdoor thermal comfort and energy efficiency are of equal priority in the design process. As it might seem, however, with regards to the combined fitness (Figure 6c) that linear and scattered forms with 6 m streets (3 m alleys between blocks) are the most favourable, these arrangements are not always achievable from a practical point of view.

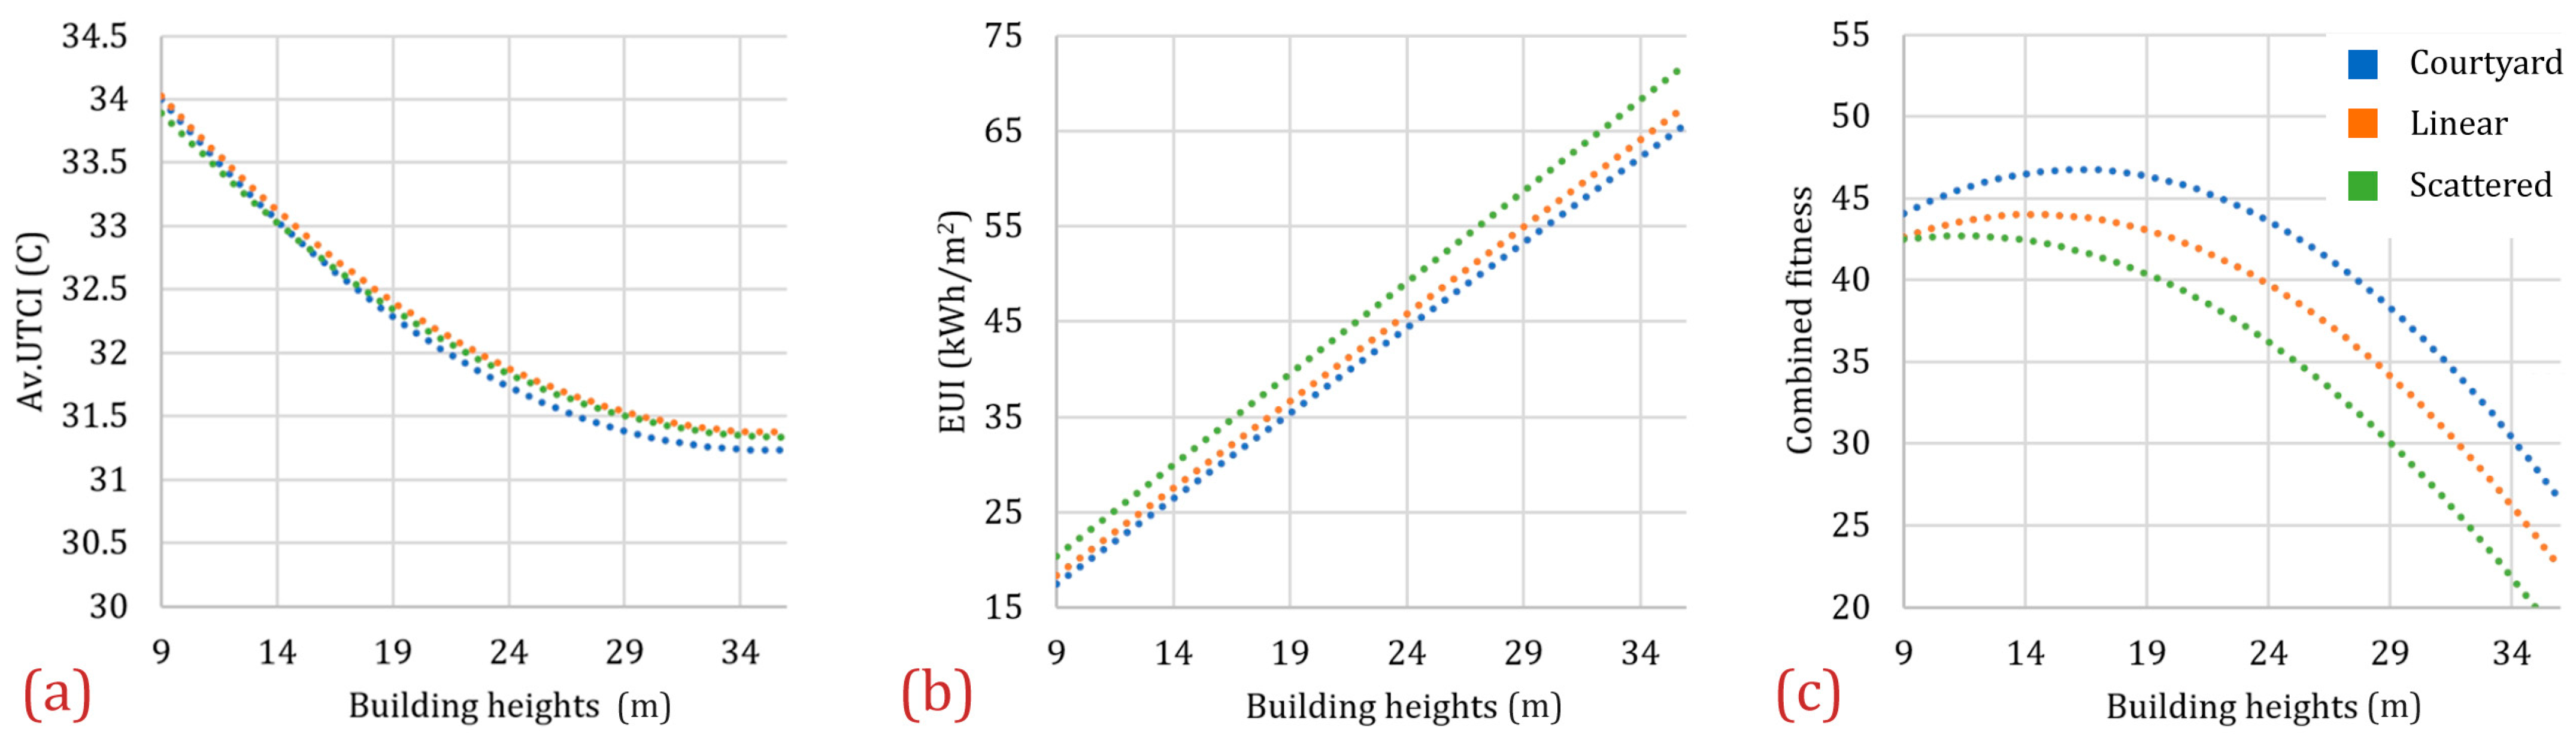
3.2.3. Building Heights

Buildings’ heights are shown to have the strongest correlation with thermal and energy performance. Figure 7 shows the trendlines indicating the variations in performance as building heights change. The effect of changing building heights appears to be more significant than changing the typology. In Figure 7a, As building heights increase, Av.UTCI decreases by 2.5 °C, due to improved shading, thereby improving thermal comfort. The relationship, however, between the Av.UTCI and building heights is polynomial, and so is the relationship with FAR as discussed in the next section, indicating a near-constant Av.UTCI above a certain height (33 m in this study), after which the streets become fully shaded and do not benefit from any further increase in building heights. Differences between typologies seem to be negligible, showing the courtyards slightly lower in Av.UTCI. Conversely, taller buildings with larger floor spaces resulted in higher EUIs, increasing by as much as 50 kWh/m2 (Figure 7b). The impact of changing the heights is more significant on EUI than on Av.UTCI, and so are the variations between typologies. This is well explained by the linear relationship between EUI and the building heights. The effect is more pronounced in the combined fitness with larger differences between taller buildings (Figure 7c). On aggregate, the overall fitness improves with increasing building heights until the effect of shading becomes marginal (height 24 m) and then declines due to higher EUI. Similar inferences were reported by Martins et al. [25] in hot-humid conditions, who concluded that albedo, H/W ratio and distance between buildings account for almost 80% of the variation in solar radiation exposure.

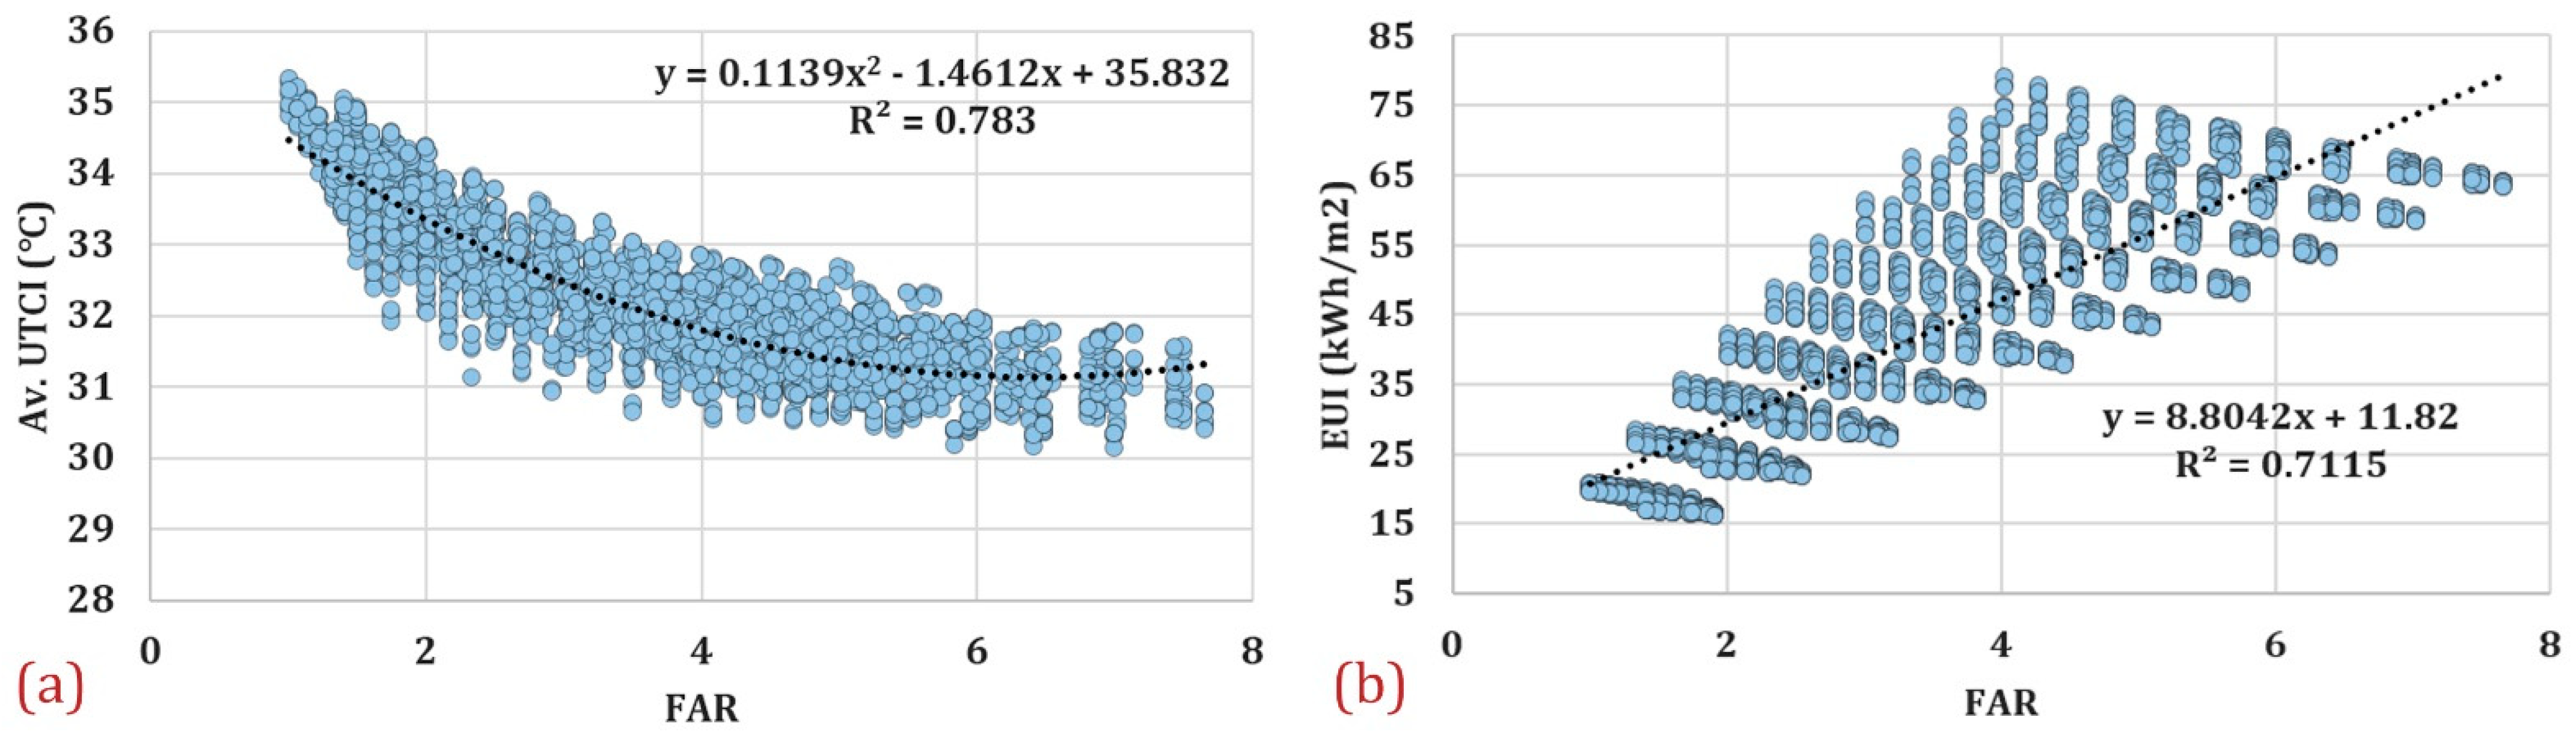
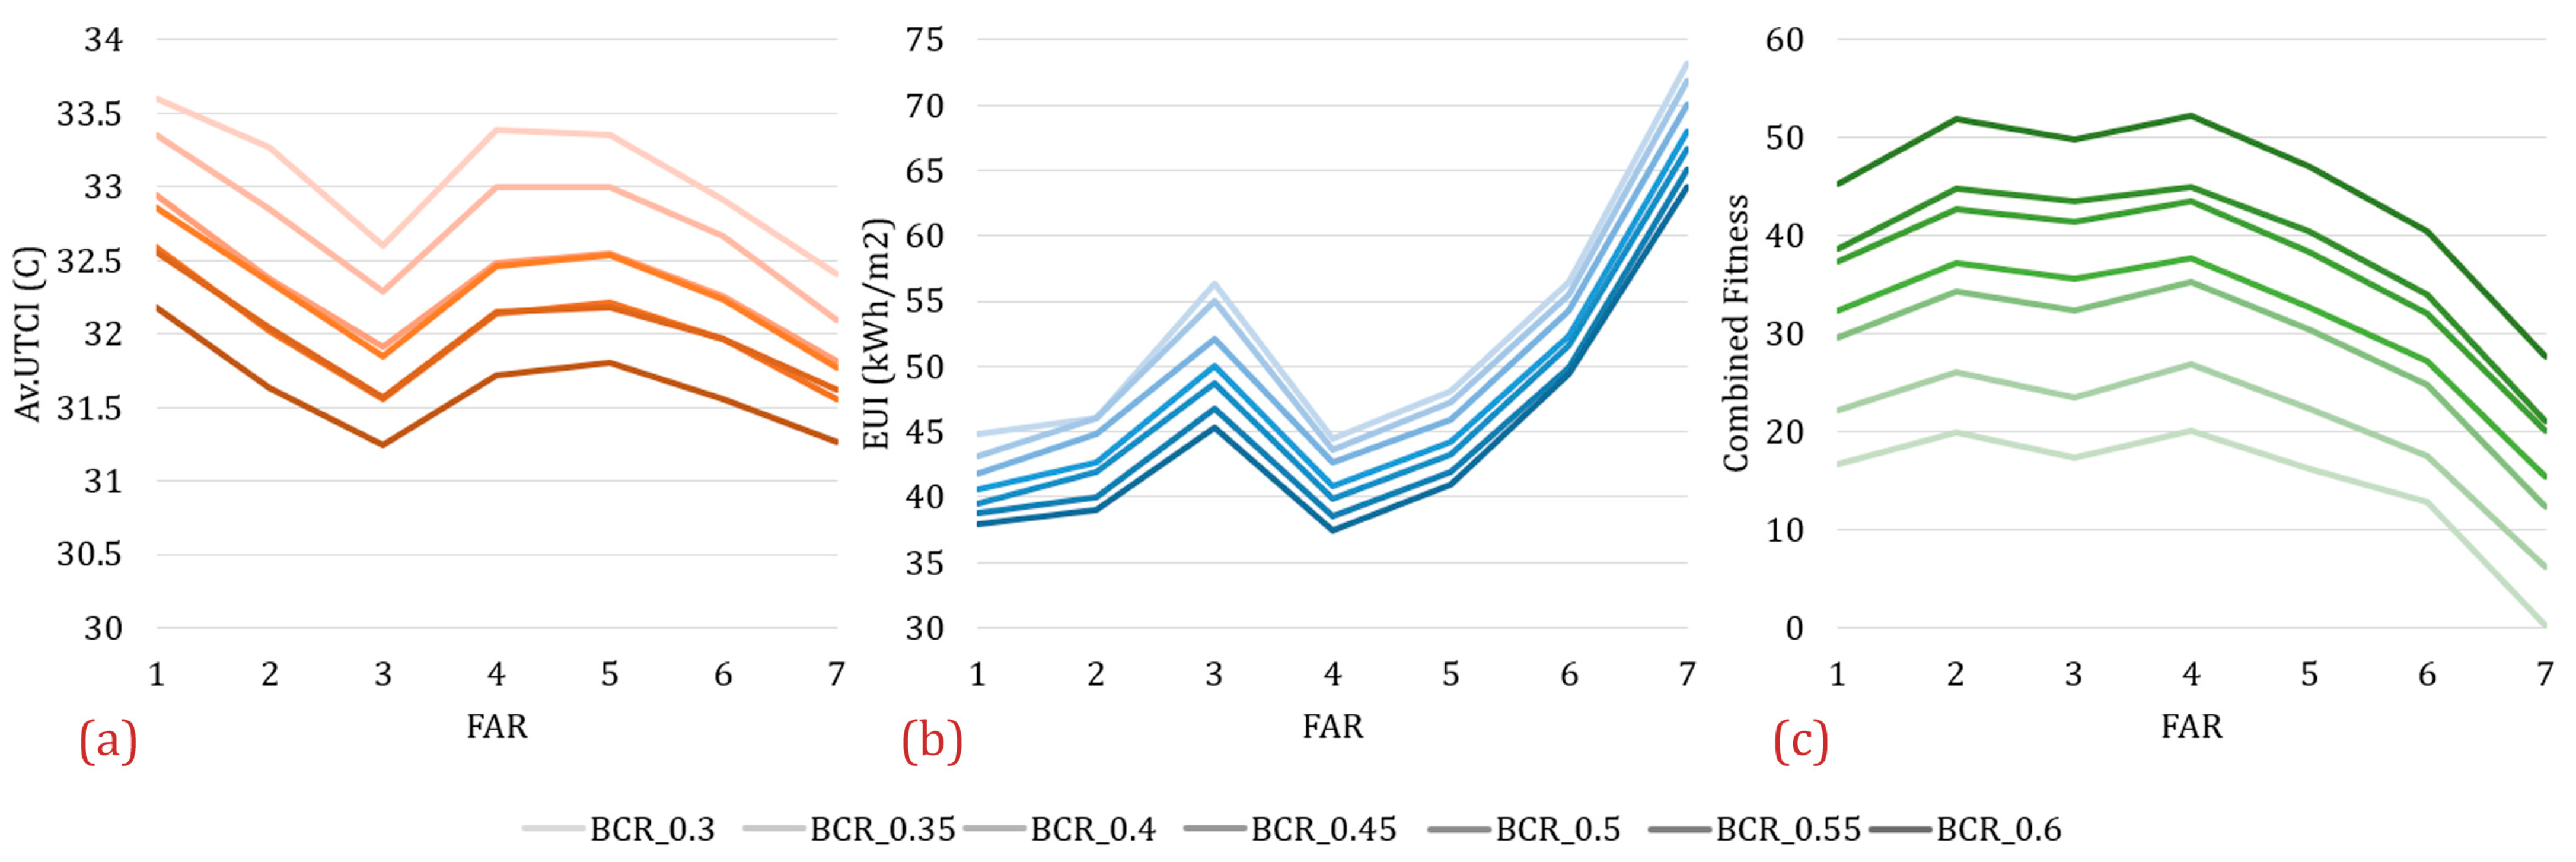
3.3. The Effect of Density

A multi-regression analysis of density parameters, i.e., FAR and BCR, has revealed a significant correlation with performance indicators, such that 70% and 95% of the variation of Av.UTCI and EUI, respectively, can be explained by FAR and BCR together. However, BCR showed an insignificant p-value against Av.UTCI (p = 0.06). Simple linear regression analyses have shown that BCR has moderate correlations with Av.UTCI, while EUI and Av.UTCI, as anticipated following the effect of building heights, are strongly dependent on FAR (Table 4). A 2nd order polynomial regression shows a stronger correlation with Av.UTCI (Figure 8), showing marginal reductions in Av.UTCI within the highest FARs. Furthermore, the correlation between FAR and the combined fitness was higher for a single building height (15 m) with R = 0.74, and for a single distance (9 m) with R = 0.92. This indicates that, although FAR exhibits a strong impact on both AV.UTCI and EUI, it cannot be used alone as an indicator for density, yet rather have to be associated with the horizontal density (compactness) parameters as shown below.
Intriguingly, the categorisation of FAR into BCRs has shown distinct insights. Figure 9 shows the relationship between the performance indicators and FAR in each BCR. Fitness values were averaged for each FAR, e.g., 1 ≤ FAR < 2, and then averaged for each BCR, e.g., 0.3 ≤ BCR < 0.35. As FAR increases as high as 3, shading over ground increases and brings about lower Av.UTCI. As it continues to increase, the amount of longwave radiation from building walls increases and causes the Av.UTCI to rise up to a limit (FAR = 5), after which the effect of overshadowing surpasses that of the longwave heat exchange and lower Av.UTCI values ensue (Figure 9a). Conversely, the first few increments in FAR induce higher EUI, followed by a decline due to shading over building walls and then a constant increase as of FAR = 4 (Figure 9b). Quan et al. [34] found similar trends in their analysis of annual energy loads in a mixed humid climate. It can also be noticed that, for a constant FAR, higher BCR results in 1.5 °C lower Av.UTCI on average and up to 10 kWh/m2 lower EUI. Wei et al. [89] recommended similar configurations for lower ambient and radiant temperatures when they performed a cross-evaluation of FAR and BCR in a humid subtropical climate. Moreover, in a similar hot-arid climate, Krüger et al. [90] reported that for a constant FAR, increasing H/W (thereby increasing BCR) does reduce cooling demand when they investigated 32 hypothetical cases from January to August. Again, where both lower Av.UTCI and EUI are acquired, a combined fitness would qualify a compact (BCR ≥ 60%), medium-density (2 ≤ FAR < 4) configuration to be the best trade-off (Figure 9c).

4. Selective Cases and Urban Design Implications

Using Core Studio Design explorer [91], a web-based design exploration interface, we were able to visualise the multivariate relationship between all the design parameters and the fitness criteria. As shown previously, some typologies outperformed the others with regards to a specific fitness criterion, for instance, the scattered in Av.UTCI and the courtyards in EUI. Accordingly, in Figure 10, Figure 11 and Figure 12, the best performing case within each typology is selected, rather than the optimum cases. Each column of these figures represents a different parameter used in the optimisation. The first (leftmost) six columns plot the values of the six input parameters, and the last (rightmost) two plot the values of the output being measured. Each line running left to right plots the values for an individual geometric case being analysed. On each figure, the lines representing the best performing courtyard, linear and scattered form for the output being studied are coloured in blue, green and red, respectively. Distances in these figures refer to the distance between buildings rather than blocks. For instance, linear forms with an NS distance of 21 m have an NS distance between blocks of 10.5 m. Courtyards with distances of 24 m have a 6 m distance between blocks in both directions (see Section 2.1. and Section 3.2.2.) Figure 10 depicts the optimum configurations required to achieve the lowest Av.UTCI, where the selected cases confirm the results obtained regarding each design parameter. Compact and highly dense scattered forms orientated 45° appear to possess the lowest Av.UTCI. In fact, these configurations might not seem applicable in practice in Egypt, although they are extensively found in North African countries with similar climates, such as Morocco [20] and Algeria [46]. Figure 10 also shows a variety of design thresholds that can deliver a moderate heat stress Av.UTCI of <32 °C; building heights ≥ 21; BCR ≥ 50% and; FAR ≥ 4, preferably orientated between 30 and 60°.
In Figure 11, the three best performing typologies share approximate design parameters to attain EUI lower than ~32 kWh/m2 which is only ~40% of the highest consumption recorded. Courtyards and linear forms dominated the objective space for EUI; however, the common features of low energy urban forms are the same in all typologies; higher BCR and lower FAR are the most predominant (Section 3.3.), followed by orientating blocks to the South. Despite the large number of design parameters that bring forth the lowest 40% EUI, cases with lower building heights and BCR bring about higher AV.UTCI due to the lack of shadowing on streets. Our results are partially congruent with the recommendations of Olgyay in [18] and Dekay and Brown in [31] for hot-arid regions. The latter, however, recommended designing for wide EW streets to allow for winter sun but narrow NS streets to maximise shading. Such street configurations in extreme hot conditions as in Egypt will bring about intolerable heat stress in summer.
Figure 12 depicts the optimum case in each typology achieving moderate heat stress AV.UTCI of <32 as well as the lowest 40% EUI. The optimum cases tend to have lower building heights ≤15, and FAR below ~3.3 and higher BCR ≥50%. Under these configurations, orientation does not seem to have a strong impact on the overall performance of courtyards and scattered forms, whereas the shading potential of linear forms remains a function of street orientation (also see Section 3.2.1.). Our results support the recommendation of Galal et al. [58] for designing perimeter blocks in ordinal directions for best thermal conditions. They are shown here as candidates for the best overall performance. For online access to the data analysis and visualisation on Design Explorer, see Supplementary Materials.
Based on the results and implications presented above, Table 5 lists the optimum design thresholds in each typology that can be interpreted as design guidelines towards achieving pedestrian-friendly but also resource-efficient urban built environments which conform to the sustainable development goals.

5. Conclusions

This study harnessed the capabilities of the Ladybug tools simulation workflow via Grasshopper/Rhino3D to highlight the relationship between urban form design parameters and energy performance together with outdoor thermal comfort in summer, in the hot-arid climate of Cairo, Egypt. The workflow was capable of assessing the multi-aspect performance of various typological and morphological configurations. Presenting such results using open-source simulation engines is just one of the many reasons which qualify this workflow to be widely applicable in practice. Another reason is the possibility of extending this methodology by linking the current workflow with multi-objective evolutionary algorithms, allowing for the investigation of complicated parametric combinations. The results presented here are for the hot-arid climate of Cairo, Egypt, however, the methodology used in this study can easily be applied to other climatic contexts. It is anticipated that the optimum geometric forms will vary with location and background climatic conditions. For instance, scattered forms might be a better trade-off in hot-humid areas, where ventilation is most needed [9]. Moreover, the scalability of this workflow is associated with exponential computation time, depending on the spatial resolution of the area investigated. This study was limited by using uniform building heights over the whole quarter, however, while simulating each building height independently may result in more rigorous performative insights, under the same number of parameters examined in this study, it would result in billions of parametric combinations that even evolutionary algorithms would find unwieldy to be solved, also known as the “curse of dimensionality” [31].
Our results have shown a statistically significant correlation between the design parameters and the performance indicators, Av.UTCI and EUI, such that 70% and 95% of the variations in each respective metric can be explained by the density parameters, FAR and BCR. The design parameters exhibited such impacts on the different typologies that seemed similar in nature, but disparate in magnitude. Compact and dense scattered forms were shown to be as good as (or slightly better than) courtyard typologies, outperforming linear configurations when accounting for outdoor thermal comfort. On the other hand, courtyards and linear forms surpassed the scattered forms regarding their energy performance owing to their ability to deliver adequate self and mutual shading to the building walls. Moreover, it was shown that orientation possesses a decisive impact on the overall performance, but also that their impact on typological differences is less absolute. From an environmental and practical point of view, compact (BCR ≥ 60%) and medium-density (4 ≥ FAR > 2) courtyards orientated 45°, not only offer a satisfying thermal versus energy performance trade-off, but also exhibit a greater potential for achieving net-zero energy urban communities. The results of this study present performance-driven insights in the pre-design process to urban planners, designers and stakeholders aiming to create healthy, liveable and resource-efficient urban communities now, but will also increase the resilience of urban environments to the increasing temperatures projected as a result of climatic change. Future work will include integrating the workflow with multi-objective evolutionary algorithms to investigate the impact of non-uniform building densities on the overall performance. This should include minimising the number of design parameters to a limit, below which the complexity of the search space can be appropriately managed.

Supplementary Materials

The following are available online at https://researchdata.bath.ac.uk/1021, Video S1: Iteration of different typologies based on the distance between buildings. Video S2: Simulation sample showing the calculation of performance indicators for different cases [92]. Access to the data visualisation on design explorer at: http://tt-acm.github.io/DesignExplorer/?ID=BL_3o1ZHVX (accessed on 27 May 2021).

Author Contributions

Conceptualisation, Y.I., T.K., P.S. and D.C.; methodology, Y.I., T.K. and P.S.; software, Y.I., P.S. and T.K.; validation, Y.I., T.K. and P.S.; data curation, Y.I.; writing—original draft preparation, Y.I.; writing—review and editing, Y.I., T.K., P.S. and D.C.; visualisation, Y.I.; supervision, T.K. and P.S.; All authors have read and agreed to the published version of the manuscript.

Funding

This research was funded by the Egyptian Ministry of Defence.

Data Availability Statement

Data available in a publicly accessible repository. The data presented in this study are openly available in [University of Bath Research Data Archive] at [https://doi.org/10.15125/BATH-01021] [92].

Conflicts of Interest

The authors declare no conflict of interest.

Appendix A

Table A1. Thermal and Physical properties of the construction materials used in the study.
ConstructionThickness (cm)U-Value (W/m2K)Material- Outer   to   Inner   Face   Thickness (cm)Density (kg/m3)Thermal Conductivity (W/m.K)Specific Heat (J/kg.K)Thermal Resistance (m2K/W)
Full red-brick wall with expanded polystyrene insulation321.058Plaster0.56000.1610000.031
Mortar215700.98960.022
polystyrene2350.03414000.588
Full Brick25195018290.25
Mortar215700.98960.022
Plaster0.56000.1610000.031
Standard reinforced concrete roof290.627Tiles121001.410000.007
Mortar215700.98960.022
Sand515200.338000.152
Polystyrene4350.03414001.176
Damp proof210550.1510001.333
R. concrete1524601.4410000.104
Standard reinforced concrete floor203.785Tiles121001.410000.007
Mortar215700.98960.022
Sand515200.338000.152
R. concrete1224601.4410000.083
Clear GlassThickness: 0.6U-value: 5.76SHGC: 0.71Transmissivity: 0.65

References

  1. United Nations Department of Economic and Social Affairs Population Division. World Urbanization Prospects: The 2018 Revision; United Nations: New York, NY, USA, 2018; p. 126. [Google Scholar]
  2. Seto, K.C.; Dhakal, S.; Bigio, A.; Blanco, H.; Delgado, G.C.; Dewar, D.; Huang, L.; Inaba, A.; Kansal, A.; Lwasa, S. Human settlements, infrastructure and spatial planning. In Climate Change 2014: Mitigation of Climate Change. Contribution of Working Group III to the Fifth Assessment Report of the Intergovernmental Panel on Climate Change; Cambridge University Press: Cambridge, UK, 2014. [Google Scholar]
  3. IEA. Energy Technology Perspectives 2020; IEA: Paris, France, 2020. [Google Scholar]
  4. Oke, T. The heat island of the urban boundary layer: Characteristics, causes and effects. In Wind Climate in Cities; Springer: Berlin/Heidelberg, Germany, 1995; pp. 81–107. [Google Scholar]
  5. Jamei, E.; Rajagopalan, P.; Seyedmahmoudian, M.; Jamei, Y. Review on the impact of urban geometry and pedestrian level greening on outdoor thermal comfort. Renew. Sustain. Energy Rev. 2016, 54, 1002–1017. [Google Scholar] [CrossRef]
  6. Nikolopoulou, M.; Steemers, K. Thermal comfort and psychological adaptation as a guide for designing urban spaces. Energy Build. 2003, 35, 95–101. [Google Scholar] [CrossRef]
  7. Cities, L. Cities and Energy: Urban Morphology and Heat Energy Demand; London School of Economics and Political Science: London, UK, 2014. [Google Scholar]
  8. Naboni, E.; Natanian, J.; Brizzi, G.; Florio, P.; Chokhachian, A.; Galanos, T.; Rastogi, P. A digital workflow to quantify regenerative urban design in the context of a changing climate. Renew. Sustain. Energy Rev. 2019, 113, 109255. [Google Scholar] [CrossRef]
  9. Golany, G.S. Urban design morphology and thermal performance. Atmos. Environ. 1996, 30, 455–465. [Google Scholar] [CrossRef]
  10. March, L.; Martin, L. Urban Space and Structures; Cambridge University Press: Cambridge, UK, 1972. [Google Scholar]
  11. Gupta, V. Thermal efficiency of building clusters: An index for non air-conditioned buildings in hot climates. In Energy and Urban Built Form; Hawkes, D., Owers, J., Rickaby, P., Steadman, P., Eds.; Butterworths: London, UK, 1987; pp. 133–145. [Google Scholar]
  12. Ratti, C.; Raydan, D.; Steemers, K. Building form and environmental performance: Archetypes, analysis and an arid climate. Energy Build. 2003, 35, 49–59. [Google Scholar] [CrossRef]
  13. Oke, T.R. Initial Guidance to Obtain Representative Meteorological Observations at Urban Sites; World Meteorological Organization: Geneva, Switzerland, 2006; p. 51. [Google Scholar]
  14. Stewart, I.D.; Oke, T.R. Local climate zones for urban temperature studies. Bull. Am. Meteorol. Soc. 2012, 93, 1879–1900. [Google Scholar] [CrossRef]
  15. Salvati, A.; Coch, H.; Morganti, M. Effects of urban compactness on the building energy performance in Mediterranean climate. Energy Procedia 2017, 122, 499–504. [Google Scholar] [CrossRef] [Green Version]
  16. Salvati, A.; Monti, P.; Roura, H.C.; Cecere, C. Climatic performance of urban textures: Analysis tools for a Mediterranean urban context. Energy Build. 2019, 185, 162–179. [Google Scholar] [CrossRef]
  17. Tereci, A.; Ozkan, S.T.E.; Eicker, U. Energy benchmarking for residential buildings. Energy Build. 2013, 60, 92–99. [Google Scholar] [CrossRef]
  18. Taleghani, M.; Tenpierik, M.; Van Den Dobbelsteen, A.; De Dear, R. Energy use impact of and thermal comfort in different urban block types in the Netherlands. Energy Build. 2013, 67, 166–175. [Google Scholar] [CrossRef]
  19. Oke, T.R. Street Design and Urban Canopy Layer Climate. Energy Build. 1988, 11, 103–113. [Google Scholar] [CrossRef]
  20. Johansson, E. Influence of urban geometry on outdoor thermal comfort in a hot dry climate: A study in Fez, Morocco. Build. Environ. 2006, 41, 1326–1338. [Google Scholar] [CrossRef]
  21. Ali-Toudert, F. Dependence of Outdoor Thermal Comfort on Street Design in Hot and Dry Climate; Institutes der Universität Freiburg: Freiburg, Germany, 2005. [Google Scholar]
  22. Futcher, J.A.; Kershaw, T.; Mills, G. Urban form and function as building performance parameters. Build. Environ. 2013, 62, 112–123. [Google Scholar] [CrossRef] [Green Version]
  23. Elnahas, M. The effects of urban configuration on urban air temperatures. Archit. Sci. Rev. 2003, 46, 135–138. [Google Scholar] [CrossRef]
  24. Rode, P.; Keim, C.; Robazza, G.; Viejo, P.; Schofield, J. Cities and energy: Urban morphology and residential heat-energy demand. Environ. Plan. B Plan. Des. 2014, 41, 138–162. [Google Scholar] [CrossRef] [Green Version]
  25. Martins, T.; Adolphe, L.; Bastos, L.; Martins, A. Sensitivity analysis of urban morphology factors regarding solar energy potential of buildings in a Brazilian tropical context. Sol. Energy 2016, 137, 11–24. [Google Scholar] [CrossRef]
  26. Xu, Y.; Ren, C.; Ma, P.; Ho, J.; Wang, W.; Lau, K.K.-L.; Lin, H.; Ng, E. Urban morphology detection and computation for urban climate research. Landsc. Urban Plan. 2017, 167, 212–224. [Google Scholar] [CrossRef]
  27. Ratti, C.; Baker, N.; Steemers, K. Energy consumption and urban texture. Energy Build. 2005, 37, 762–776. [Google Scholar] [CrossRef]
  28. Okeil, A. A holistic approach to energy efficient building forms. Energy Build. 2010, 42, 1437–1444. [Google Scholar] [CrossRef]
  29. Allegrini, J.; Dorer, V.; Carmeliet, J. Impact of radiation exchange between buildings in urban street canyons on space cooling demands of buildings. Energy Build. 2016, 127, 1074–1084. [Google Scholar] [CrossRef]
  30. Vallati, A.; Grignaffini, S.; Romagna, M.; Mauri, L.; Colucci, C. Influence of street Canyon2019s microclimate on the energy demand for space cooling and heating of buildings. Energy Procedia 2016, 101, 941–947. [Google Scholar] [CrossRef]
  31. Vartholomaios, A. A parametric sensitivity analysis of the influence of urban form on domestic energy consumption for heating and cooling in a Mediterranean city. Sustain. Cities Soc. 2017, 28, 135–145. [Google Scholar] [CrossRef]
  32. Roudsari, M.S.; Pak, M.; Smith, A. Ladybug: A parametric environmental plugin for grasshopper to help designers create an environmentally-conscious design. In Proceedings of the 13th International IBPSA Conference, Lyon, France, 25–30 August 2013. [Google Scholar]
  33. Javanroodi, K.; Mahdavinejad, M.; Nik, V.M. Impacts of urban morphology on reducing cooling load and increasing ventilation potential in hot-arid climate. Appl. Energy 2018, 231, 714–746. [Google Scholar] [CrossRef]
  34. Quan, S.J.; Economou, A.; Grasl, T.; Yang, P.P.-J. Computing energy performance of building density, shape and typology in urban context. Energy Procedia 2014, 61, 1602–1605. [Google Scholar] [CrossRef] [Green Version]
  35. Natanian, J.; Maiullari, D.; Yezioro, A.; Auer, T. Synergetic Urban Microclimate and Energy Simulation Parametric Workflow. J. Phys. Conf. Ser. 2019, 1343, 012006. [Google Scholar]
  36. Recast, E. Directive 2010/31/EU of the European Parliament and of the Council of 19 May 2010 on the energy performance of buildings (recast). Off. J. Eur. Union 2010, 18, 2010. [Google Scholar]
  37. Zhang, J.; Xu, L.; Shabunko, V.; Tay, S.E.R.; Sun, H.; Lau, S.S.Y.; Reindl, T. Impact of urban block typology on building solar potential and energy use efficiency in tropical high-density city. Appl. Energy 2019, 240, 513–533. [Google Scholar] [CrossRef]
  38. Natanian, J.; Aleksandrowicz, O.; Auer, T. A parametric approach to optimizing urban form, energy balance and environmental quality: The case of Mediterranean districts. Appl. Energy 2019, 254, 113637. [Google Scholar] [CrossRef]
  39. Wortmann, T.; Natanian, J. Multi-Objective Optimization for Zero-Energy Urban Design in China: A Benchmark. In Proceedings of the SimAUD2020, Online Conference, 25–27 May 2020; pp. 203–210. [Google Scholar]
  40. Nunez, M.; Oke, T.R. The Energy Balance of an Urban Canyon. J. Appl. Meteorol. 1977, 16, 11–19. [Google Scholar] [CrossRef]
  41. Nakamura, Y.; Oke, T.R. Wind, Temperature and Stability Conditions in an East-West Oriented Urban Canyon. Atmos. Environ. 1988, 22, 2691–2700. [Google Scholar] [CrossRef]
  42. Santamouris, M.; Papanikolaou, N.; Koronakis, I.; Livada, I.; Asimakopoulos, D. Thermal and air flow characeristics in a deep pedestrian canyon under hot weather conditions. Atmos. Environ. 1999, 33, 4503–4521. [Google Scholar] [CrossRef]
  43. Oke, T.R. Canyon geometry and the nocturnal heat island: Comparison of scale model and field observations. J. Climatol. 1981, 1, 237–254. [Google Scholar] [CrossRef]
  44. Matzarakis, A.; Rutz, F.; Mayer, H. Modelling radiation fluxes in simple and complex environments—Application of the RayMan model. Int. J. Biometeorol. 2007, 51, 323–334. [Google Scholar] [CrossRef]
  45. Shashua-Bar, L.; Hoffman, M.E. Quantitative evaluation of passive cooling of the UCL microclimate in hot regions in summer, case study: Urban streets and courtyards with trees. Build. Environ. 2004, 39, 1087–1099. [Google Scholar] [CrossRef]
  46. Bourbia, F.; Boucheriba, F. Impact of street design on urban microclimate for semi arid climate (Constantine). Renew. Energy 2010, 35, 343–347. [Google Scholar] [CrossRef]
  47. Holmer, B. A simple operative method for determination of sky view factors in complex urban canyons from fisheye photographs. Meteorol. Z. 1992, 1, 236–239. [Google Scholar] [CrossRef]
  48. Giannopoulou, K.; Santamouris, M.; Livada, I.; Georgakis, C.; Caouris, Y. The impact of canyon geometry on intra urban and urban: Suburban night temperature differences under warm weather conditions. Pure Appl. Geophys. 2010, 167, 1433–1449. [Google Scholar] [CrossRef]
  49. Johansson, E.; Emmanuel, R. The influence of urban design on outdoor thermal comfort in the hot, humid city of Colombo, Sri Lanka. Int. J. Biometeorol. 2006, 51, 119–133. [Google Scholar] [CrossRef]
  50. Bourbia, F.; Awbi, H.B. Building cluster and shading in urban canyon for hot dry climate Part 2: Shading simulations. Renew. Energy 2004, 29, 291–301. [Google Scholar]
  51. Ali-Toudert, F.; Djenane, M.; Bensalem, R.; Mayer, H. Outdoor thermal comfort in the old desert city of Beni-Isguen, Algeria. Clim. Res. 2005, 28, 243–256. [Google Scholar] [CrossRef] [Green Version]
  52. Sharmin, T.; Steemers, K.; Matzarakis, A. Microclimatic modelling in assessing the impact of urban geometry on urban thermal environment. Sustain. Cities Soc. 2017, 34, 293–308. [Google Scholar] [CrossRef]
  53. Qaid, A.; Ossen, D.R. Effect of asymmetrical street aspect ratios on microclimates in hot, humid regions. Int. J. Biometeorol. 2015, 59, 657–677. [Google Scholar] [CrossRef]
  54. Chatzidimitriou, A.; Yannas, S. Street canyon design and improvement potential for urban open spaces; the influence of canyon aspect ratio and orientation on microclimate and outdoor comfort. Sustain. Cities Soc. 2017, 33, 85–101. [Google Scholar] [CrossRef]
  55. Taleghani, M.; Kleerekoper, L.; Tenpierik, M.; Van Den Dobbelsteen, A. Outdoor thermal comfort within five different urban forms in the Netherlands. Build. Environ. 2015, 83, 65–78. [Google Scholar] [CrossRef]
  56. Allegrini, J.; Dorer, V.; Carmeliet, J. Influence of morphologies on the microclimate in urban neighbourhoods. J. Wind Eng. Ind. Aerodyn. 2015, 144, 108–117. [Google Scholar] [CrossRef]
  57. Jin, H.; Cui, P.; Wong, N.H.; Ignatius, M. Assessing the effects of urban morphology parameters on microclimate in Singapore to control the urban heat island effect. Sustainability 2018, 10, 206. [Google Scholar] [CrossRef] [Green Version]
  58. Galal, O.M.; Sailor, D.J.; Mahmoud, H. The impact of urban form on outdoor thermal comfort in hot arid environments during daylight hours, case study: New Aswan. Build. Environ. 2020, 184, 1–15. [Google Scholar] [CrossRef]
  59. Natanian, J.; Auer, T. Beyond nearly zero energy urban design: A holistic microclimatic energy and environmental quality evaluation workflow. Sustain. Cities Soc. 2020, 56, 1–11. [Google Scholar] [CrossRef]
  60. Crawley, D.B.; Lawrie, L.K.; Winkelmann, F.C.; Buhl, W.F.; Huang, Y.J.; Pedersen, C.O.; Strand, R.K.; Liesen, R.J.; Fisher, D.E.; Witte, M.J. EnergyPlus: Creating a new-generation building energy simulation program. Energy Build. 2001, 33, 319–331. [Google Scholar] [CrossRef]
  61. Thermal Energy System Specialists (TESS). TRNSYS-Transient System Simulation Tool. Available online: http://www.trnsys.com/ (accessed on 21 April 2021).
  62. Robinson, D.; Haldi, F.; Leroux, P.; Perez, D.; Rasheed, A.; Wilke, U. CitySim: Comprehensive Micro-Simulation of Resource Flows for Sustainable Urban Planning. In Proceedings of the Eleventh International IBPSA Conference, Glasgow, Scotland, 27–30 July 2009; pp. 1083–1090. [Google Scholar]
  63. Bueno, B.; Norford, L.; Hidalgo, J.; Pigeon, G. The urban weather generator. J. Build. Perform. Simul. 2013, 6, 269–281. [Google Scholar] [CrossRef]
  64. Bruse, M. ENVI-met. Available online: https://www.envi-met.com/ (accessed on 30 March 2020).
  65. Rodler, A.; Lauzet, N.; Musy, M.; Azam, M.-H.; Guernouti, S.; Mauree, D.; Colinart, T. Urban Microclimate and Building Energy Simulation Coupling Techniques. In Urban Microclimate Modelling for Comfort and Energy Studies; Palme, M., Salvati, A., Eds.; Springer Nature: Cham, Switzerland; Glasgow, UK, 2021. [Google Scholar]
  66. Perini, K.; Chokhachian, A.; Dong, S.; Auer, T. Modeling and simulating urban outdoor comfort: Coupling ENVI-Met and TRNSYS by grasshopper. Energy Build. 2017, 152, 373–384. [Google Scholar] [CrossRef]
  67. McRae, I.; Freedman, F.; Rivera, A.; Li, X.; Dou, J.; Cruz, I.; Ren, C.; Dronova, I.; Fraker, H.; Bornstein, R. Integration of the WUDAPT, WRF, and ENVI-met models to simulate extreme daytime temperature mitigation strategies in San Jose, California. Build. Environ. 2020, 184, 107180. [Google Scholar] [CrossRef]
  68. Rutten, D. Grasshopper3D. Available online: https://www.grasshopper3d.com/ (accessed on 20 April 2021).
  69. McNeel, R. Rhinoceros 3D. Available online: https://www.rhino3d.com/ (accessed on 20 April 2021).
  70. Ministry of Housing Utilities & Urban Communities (MMHUUC). Egyptian Code for Improving the Efficiency of Energy Use in Buildings (306/2005). In Part 1: Residential Buildings (306/1); National Housing & Building Research Centre, HBRC: Cairo, Egypt, 2008; p. 152. [Google Scholar]
  71. Ministry of Housing Utilities & Urban Communities (MMHUUC). The Executive Regulations for the Egyptian Unified Construction Act; General Organisation for Physical Planning: Cairo, Egypt, 2008; p. 163.
  72. International Energy Agency, IEA, IEA Energy Atlas. Available online: http://energyatlas.iea.org (accessed on 20 April 2021).
  73. CAPMAS. Bulletin of Housing in Egypt; Central Agency for Public Mobilization & Statistics: Cairo, Egypt, 2019; p. 50. [Google Scholar]
  74. Ibrahim, Y.; Kershaw, T.; Shepherd, P. A parametric optimisation study of urban geometry design to assess outdoor thermal comfort. SC&S 2021. Manuscript under review. [Google Scholar]
  75. Witte, M.J.; Henninger, R.H.; Glazer, J.; Crawley, D.B. Testing and Validation of a New Building Energy Simulation Program. In Proceedings of the 7th IBSPA Conference, Rio de Janeiro, Brazil, 13–15 August 2001; International Building Performance Simulation Association: Rio de Janeiro, Brazil, 2001; pp. 353–359. [Google Scholar]
  76. Bueno, B.; Roth, M.; Norford, L.; Li, R. Computationally efficient prediction of canopy level urban air temperature at the neighbourhood scale. Urban. Clim. 2014, 9, 35–53. [Google Scholar] [CrossRef] [Green Version]
  77. Blazejczyk, K. MENEX· the man-environment heat exchange model and its applications in bioclimatology. In Proceedings of the Fifth International Conference on Environmental Ergonomics, Warszawa, Poland, 1992; pp. 142–143. [Google Scholar]
  78. ASHRAE. ANSI/ASHRAE Standard 55-2017: Thermal Environmental Conditions for Human Occupancy; American Society of Heating, Refrigerating and Air-Conditioning Engineers: Atlanta, GA, USA, 2017. [Google Scholar]
  79. Ibrahim, Y.; Kershaw, T.; Shepherd, P. Improvement of the Ladybug-tools microclimate workflow: A verification study. In Building Simulation and Optimization 2020; Loughborough University: Loughborough, UK, 2020. [Google Scholar]
  80. Evola, G.; Costanzo, V.; Magrì, C.; Margani, G.; Marletta, L.; Naboni, E. A novel comprehensive workflow for modelling outdoor thermal comfort and energy demand in urban canyons: Results and critical issues. Energy Build. 2020, 216, 109946. [Google Scholar] [CrossRef]
  81. Elnabawi, M.H.; Hamza, N.; Dudek, S. Use and Evaluation of the ENVI-Met Model for Two Different Urban Forms in Cairo, Egypt: Measurements and Model Simulations. In Proceedings of the 13th Conference of International Building Performance Simulation Association, Chambéry, France, 26–28 August 2013; pp. 2800–2806. [Google Scholar]
  82. Ibrahim, Y.; Kershaw, T.; Shepherd, P. A methodology For Modelling Microclimate: A Ladybug-tools and ENVI-met Verification Study. In Proceedings of the 35th PLEA Conference Sustainable Architecture and Urban Design: Planning Post Carbon Cities, A Coruña, Spain, 1–3 September 2020. [Google Scholar]
  83. Bröde, P.; Fiala, D.; Błażejczyk, K.; Holmér, I.; Jendritzky, G.; Kampmann, B.; Tinz, B.; Havenith, G. Deriving the operational procedure for the Universal Thermal Climate Index (UTCI). Int. J. Biometeorol. 2012, 56, 481–494. [Google Scholar] [CrossRef] [Green Version]
  84. Mahdy, M.M.; Nikolopoulou, M. Evaluation of fenestration specifications in Egypt in terms of energy consumption and long term cost-effectiveness. Energy Build. 2014, 69, 329–343. [Google Scholar] [CrossRef]
  85. Bienvenido-Huertas, D.; Sánchez-García, D.; Pérez-Fargallo, A.; Rubio-Bellido, C. Optimization of energy saving with adaptive setpoint temperatures by calculating the prevailing mean outdoor air temperature. Build. Environ. 2020, 170, 106612. [Google Scholar] [CrossRef]
  86. Natanian, J.; Kastner, P.; Dogan, T.; Auer, T. From energy performative to livable Mediterranean cities: An annual outdoor thermal comfort and energy balance cross-climatic typological study. Energy Build. 2020, 224, 110283. [Google Scholar] [CrossRef]
  87. DoE Weather Data. Available online: https://energyplus.net/weather (accessed on 8 January 2020).
  88. Konis, K.; Gamas, A.; Kensek, K. Passive performance and building form: An optimization framework for early-stage design support. Sol. Energy 2016, 125, 161–179. [Google Scholar] [CrossRef]
  89. Wei, R.; Song, D.; Wong, N.H.; Martin, M. Impact of urban morphology parameters on microclimate. Procedia Eng. 2016, 169, 142–149. [Google Scholar] [CrossRef]
  90. Krüger, E.; Pearlmutter, D.; Rasia, F. Evaluating the impact of canyon geometry and orientation on cooling loads in a high-mass building in a hot dry environment. Appl. Energy 2010, 87, 2068–2078. [Google Scholar] [CrossRef]
  91. CORE Studio. Design Explorer. Available online: http://tt-acm.github.io/DesignExplorer/ (accessed on 20 April 2021).
  92. Ibrahim, Y. Dataset for “On the Optimisation of Urban Form Design, Energy Consumption and Outdoor Thermal Comfort Using a Parametric Workflow in a Hot Arid Zone”. Bath: University of Bath Research Data Archive. 2021. Available online: https://researchdata.bath.ac.uk/1021/ (accessed on 27 May 2021). [CrossRef]
Figure 1. Three archetypes exemplified in this study as a 3D View (top) and Top view showing the points of interest in outdoor comfort studies (Bottom).
Energies 14 04026 g001
Figure 2. Simulation workflow showing the streaming of data between different Grasshopper components.
Energies 14 04026 g002
Figure 3. Average hourly air temperatures and direct normal radiation (lines) plotted against the UTCI comfort range and the monthly cooling and heating degree-days (bars) in Cairo. Calculated and graphically represented by Ladybug [32].
Energies 14 04026 g003
Figure 4. Frequency distribution of (a) Av.UTCI, (b) max UTCI, (c) EUI, and (d) combined fitness, over the three typologies.
Energies 14 04026 g004
Figure 5. Performance evaluation of the three typologies in different orientations in terms of (a) AV.UTCI, (b) EUI, and (c) combined fitness.
Energies 14 04026 g005
Figure 6. Distances between buildings/blocks on the East–West axis across different orientations (shown as deviation from starting position) plotted against the performance indicators, (a) AV.UTCI, (b) EUI, and (c) combined fitness. A single EW distance comprises the average of all other North–South distances.
Energies 14 04026 g006
Figure 7. Trendlines of heights-based performance for the three typologies in terms of (a) AV.UTCI, (b) EUI, and (c) combined fitness.
Energies 14 04026 g007
Figure 8. Relationship between FAR and (a) Av.UTCI, and (b) EUI.
Energies 14 04026 g008
Figure 9. Relationship between FAR, BCR and performance indicators, (a) Av.UTCI, (b) EUI, and (c) combined fitness.
Energies 14 04026 g009
Figure 10. Parallel coordinates showing the selective cases for the minimum Av.UTCI.
Energies 14 04026 g010
Figure 11. Parallel coordinates showing the selective cases for the minimum EUI.
Energies 14 04026 g011
Figure 12. Selective cases for moderate heat stress Av.UTCI and the lowest 40% EUI.
Energies 14 04026 g012
Table 1. Minimum, maximum and step size of each dynamic parameter simulated.
Design ParameterMin.Step SizeMax.Iterations
Distance between building (X-axis (EW))6 m3 m24 m7
Distance between building (Y-axis (NS))6 m3 m24 m7
Building heights9 m3 m36 m10
Orientation (CCW from North)15°90°7
Table 2. Fixed simulation parameters used in the study.
Parameter Value
HVACCooling setpoint29°, otherwise natural ventilation is used
ScheduleAll day
Zone LoadsEquipment4 W/m2
People0.04 People/m2
ScheduleWeekdays: 00:00 (50%)–06:00 (75%)–08:00 (25%)–16:00 (75%)–18:00 (100%)–23:00 (75%)
Weekends: 00:00 (50%)–11:00 (75%)–21:00 (100%)–23:00 (75%)
Lighting3 W/m2
ScheduleWeekdays: 00:00 (25%)–06:00 (40%)–08:00 (15%)–16:00 (40%)–18:00 (150%)–23:00 (40%)
Weekends: 00:00 (50%)–11:00 (75%)–21:00 (100%)–23:00 (75%)
MaterialsWallsThickness27 cmU-Value1.058 W/m2K
Roofs29 cm0.627 W/m2K
Floors20 cm3.785 W/m2K
Windows (6 mm Clear)SHGC0.71U-Value5.76 W/m2K
Infiltration 0.003 m3/s-m2
Table 3. Correlation coefficients (R) between design parameters and performance criteria. The strongest correlations are highlighted.
CriterionDist. Blocks (EW)Dist. Blocks (NS)HeightsOrientation
Av.UTCI0.22820.2103−0.79900.0079
EUI−0.0156−0.01660.98740.0079
Comb. fitness−0.2580−0.2341−0.5875−0.0092
Table 4. Correlation coefficients (R) between density parameters and performance Criteria. The strongest correlations are highlighted.
CriterionBCRFAR
Av.UTCI−0.3058−0.8385
EUI−0.13290.8434
Combined fitness0.5918−0.3084
Table 5. Design recommendations for the optimum design thresholds in each typology.
TypologyConfiguration
St. WidthsHeightsOrientationBCRFAR
Courtyard<10 m<15 m30–60°≥60%2–4
LinearNS 12–18 m
EW 6–9 m
<15 m0–30°≥60%2–3
Scattered6–8 m<9 m45°≥50%1–2
Publisher’s Note: MDPI stays neutral with regard to jurisdictional claims in published maps and institutional affiliations.

