Article

Robust Multi-Layer Energy Management and Control Methodologies for Reefer Container Park in Port Terminal

School of Electrical Engineering, Southeast University, Nanjing 210096, China
*
Author to whom correspondence should be addressed.
Energies 2021, 14(15), 4456; https://doi.org/10.3390/en14154456
Submission received: 6 May 2021 / Revised: 18 June 2021 / Accepted: 19 July 2021 / Published: 23 July 2021

Abstract

:
The full electrification of ports is a promising prospect for saving energy and reducing greenhouse gas emissions. The control scheme of the reefer container is particularly important for the energy management of the port, as the operation of the reefer container is one of the main energy consumers of ports. This paper proposes a reefer container hierarchical control scheme that contains a day-ahead module and intra-day module which is used to generate a rough scheduling strategy based on forecast data and fine-tuning the strategy, respectively. The final strategy should realize the economical operation while ensuring that each reefer container does not exceed the temperature limit during operation. Numerical analysis on the reefer container park with 200 and 850 containers using the Time of Use (TOU) tariff and super-peak tariff is fully analyzed. In the case of 200 containers, the proposed method helps reduce operating costs by about 14.7%, and 18% in the scenario of 850 containers. The proposed method can effectively save container operating costs and ensure that the internal temperature of the container does not exceed the limit while changing the distribution of energy which could help alleviate the peak load problem of the port electric system.

Graphical Abstract

1. Introduction

Port terminals are crucial transportation hubs and typically accommodate a massive volume of merchant ships every day [1,2]. Increasing electricity demands are consumed by the port facilities including cranes, pumps, and compressors. However, many port terminals are located in relatively isolated areas, of which the power supply from the external grid is usually limited. Diesel generators, energy storage devices, and other backup power supply facilities are necessary nowadays on port terminals to secure the power supply of terminal ports. Nonetheless, it is difficult to ignore the high cost of running such backup power supply facilities to maintain the terminal operation. In addition, the external power grid is sometimes not strong enough to maintain the power supply of port terminals, and therefore the time of use (TOU) and super-peak tariffs are usually adopted due to the limited capacity of the power supply circuit and the transformers.
The reefer container park usually stores the reefer containers temporarily and is required to ensure that the inside temperature of reefer containers is maintained in a certain range. In addition, the arrival time of the reefer containers is random, which could cause a power surge to the power grid of the port terminal. This is because the reefer containers are not powered during the time in which they wait to get access to the reefer container park, and the compressor will be turned on once the container arrives at the park. Such scenarios could severely impact the stability and security of the power system of the port. Therefore, it is important to manage the operation of the reefer container park to avoid a power surge. Moreover, the cooling power of the containers is provided by compressed refrigerators, which could waste a great deal of electricity if not managed properly. Considering the heat storage characteristics of containers, the reefer container park has great potential in shifting fridge loads to reduce the peak power consumption to support the power network stability. In this view, the exploitation of port flexible loads will prove as a vital benchmark for the roadmap towards efficient and green harbors [3]. As a result, the reefer container park hopes to reduce energy costs based on the reasonable schedule of the reefer compressor.
Along with the development of low-cost communication technology such as the Long-Range Radio (LORA) and Narrow Band Internet of Things (NB-IoT), the capability for the monitoring and control of the refrigerated containers, also known as reefer containers, at the reefer container park are becoming increasingly mature. Some companies, such as ABB and Identec (Figure 1 shows two different container energy management methods), have already established monitoring systems that can monitor the operation states of every reefer container at the reefer container park. Such systems can significantly reduce the labor cost of manually monitoring the reefer containers. However, the centralized and distributed control and management schemes that were widely chosen are still lagging, which is potentially caused by a lack of a reliable and robust control scheme specially designed for the reefer container park.
Previous studies carried out on the management of flexible loads (i.e., storage, building, electrical vehicles (EVs), etc.) have confirmed the active impact on network operation and the reduction of energy cost. The core technology that supports a flexible loads schedule is the variety of energy management models. Containers are similar to buildings in terms of heat storage characteristics. The author of Reference [4] presents a critical review of the potential of an internet of energy (IOE)-based building energy management system for enhancing the performance of future generation building energy utilization, which emphasizes the importance of data transmission for energy management. Electrified ports can also be regarded as small microgrids composed of a large number of electrical equipment (i.e., refrigerated container, crane, etc.). References [5,6] presents a literature review of energy management in microgrid systems. Moreover, Reference [5] focuses on different energy management architectures: hierarchical control, centralized management, and multi-agent systems. Meanwhile, Reference [6] introduced the optimization model and solution method for energy management. Among the three control architectures, the hierarchical control architecture has been proposed and widely accepted as a standardized solution for efficient energy management [7,8,9]. Because energy management is a complex multi-objective control system that deals with issues from different technical areas, it is necessary to design different modules in hierarchical schemes to achieve different optimization control purposes. In these control schemes, different layers are implemented with different methods: centralized or distributed. Traditional centralized management methodologies are proposed in [10,11]. Reference [12] proposed a distributed autonomous building energy management architecture. In this architecture, multiple building clusters are considered. Reference [13] presented the distributed demand management approaches which managed EV charging based on the broadcasted Demand Side Response (DSR) signals sent by the network operators or aggregators.
As a flexible and schedulable resource, research specifically focusing on port terminal energy management is still scarce. Most research on the energy management system of the port aims to save energy costs and reduce greenhouse gas emissions. Reference [14] pointed out that the smart-port holistic concept particularly emphasizes operational and energy efficiency, competitiveness, and environmental aspects. Reference [15] discussed the feasibility of implementing an energy management system in the port from the perspectives of cost and benefit. Authors in Reference [2] indicated that energy management principles and electrical distribution architecture have a great effect on the performance of a port system. Reference [1] evaluated the potential of adopting the energy management system in a terminal port and indicated that the energy management system has great potential in facilitating the energy-saving and green energy consumption of a terminal port.
Some studies have focused on the more efficient use of port facilities. Reference [16] proposed two solutions aimed at a reduction in CO2 emissions, which are modifications of rubber-tyred gantry (RTG) cranes and the replacement of fuel-driven terminal tractors with new liquefied natural gas (LNG) tractors. Reference [17] introduced an innovative yard crane scheduling method that takes into consideration both efficiency and energy consumption, minimizing the total completion delay of all task groups and the total energy consumption of all yard cranes. Reference [18] addressed the problem of integrated quay cranes scheduling, internal trucks scheduling, and yard cranes scheduling, which is described as a mixed-integer programming model. The authors developed an integrated simulation-based optimization method for solving this problem. The energy consumption of the reefer containers accounts for a considerable part of the total energy consumption of the port. Reference [19] investigated the effect of solar radiation on the energy consumption of the reefer containers and found that the power consumption reached a peak of 7.5 kW during noon. Reference [20] studied the effect of the azimuth angle on the energy consumption of reefer containers and drew a conclusion that the location and direction of the container terminal have an impact on energy savings. Reference [21] pointed out that many factors have led to an increase in the peak power demand of the terminal; for example, the growth of the reefer trade, the seasonality of the food trade, and the special demand for reefers. An energy consumption simulation model was developed, aiming to study the opportunity for container terminals to reduce peak demand. Reference [22] discussed the design criteria of electrical systems for reefer container parks in port terminals, and the authors suggested the adoption of the main MV distribution together with a modular LV distribution. Reference [23] presents a special Model Predictive Control (MPC) to efficiently regulate heating, ventilation, and air conditioning (HVAC) systems which could be used in reefer container parks.
The existing research on port terminal energy management mostly explores the energy scheduling or saving methodologies for the whole port terminal. The reefer container park or reefer clusters are usually considered as a single part of the whole system, of which the reefer clusters are modeled as a whole to facilitate energy operation. Such optimization approaches are difficult to maintain each reefer operated in a certain range, which could bring profit loss to the terminal port operator if the goods inside are spoiled due to the temperate out-range. However, in the shipping logistics industry, the terminal port has the responsibility to ensure the reefer container is operated within a certain temperature range. If not, the terminal port operator will face the risk of encountering the claims by logistic agents or consignors. To mitigate such risk, terminal port operator employees usually check and record the operation of the reefers every 1–2 h or install the remote monitoring system to record the information.
In this paper, a hierarchical control scheme fully considering the day-ahead scheduling, intra-day control, and emergency control is proposed for electrification of the ports. Such a control scheme is specifically designed for the reefer container part that aims to achieve economic operation and at the same time ensure every single reefer will not exceed the temperature limits during the operation. The main contributions are summarized below.
  • A hierarchical control approach specially designed for the reefer container park is proposed, of which the day-ahead scheduling and emergency control can balance both the economical and reliable operation of the reefer container park.
  • An Intra-day control module is designed to adjust the data prediction error and handle the changes of the container arrival time.
  • Numerical analysis on the reefer container park with 200 and 850 containers using the TOU and super-peak tariffs are fully analyzed.
The remainder of this paper is organized as follows. Section 2 describes the framework of the proposed reefer container park, including the mathematical modeling of the reefer and compressors. The control approaches and the solved methodologies are presented in Section 2 and Section 3. In Section 4, the proposed methodology is implemented in the reefer container park with 200 and 850 containers. In Section 5, conclusions are presented and discussed.

2. Reefer Container Hierarchical Control Scheme System Overview

As mentioned in the introduction, refrigerated containers are the major flexible loads of future ports. The proposed method enables real-time control of port flexible loads and effectively reduces their operation cost.
The hierarchical control scheme shown in Figure 2 was developed to achieve the different goals offered by the reefer container park manager (i.e., accurate temperature control, operating cost reduction, etc.) The proposed hierarchical control architecture can be divided into three modules in chronological order: (a) the day-ahead dispatch module is responsible for generating a rough scheduling strategy for refrigerated containers. (b) The intra-day adjustment module could fine-tune scheduling strategies based on real-time environmental information. (c) In order to deal with communication failures, the reefer container park must also be equipped with emergency control modules, to ensure the stability of the internal temperature of the container even when real-time information cannot be obtained, or control signals cannot be transmitted.

Introduction of Day-Ahead Module and Intra-Day Module

Apart from the emergency control module, the other two modules require energy management methods to support the realization of module functions. Specifically, the day-ahead dispatch module aggregates all prediction information (i.e., arrivals and departures, electricity price, etc.), and then inputs it into the strategy generation algorithm, and feeds back the scheduling strategy, and stores it in the central scheduling platform. For the second module, its main function is to read the rough scheduling strategy in the central scheduling platform and fine-tune the rough dispatch strategy based on the real-time signals gathered by the reefer container sensor.
Day-ahead module (DA) is assigned to the power control center in the port. The DA uses an optimization model to estimate all the forecast information over the next time interval (a day) and then calculate the dispatch strategy with the best economic performance. Afterward, the DA will send the rough strategy to the Intra-day module.
Intra-day module (ID) is assigned to every single container. Firstly, it will receive real-time data gathered by container sensors and calculate if the dispatch strategy released by the central console is reasonable. Afterward, the model in the ID will fine-tune the strategy and generate a control signal to the current container.
The coordination between each module and the specific model inside each module will become obvious in next section.

3. Generic Modeling of the Containers for Engineering

3.1. Heat Transfer Model of Container

3.1.1. Thermal Model of Container

In a steady state, when the air temperature on the external and internal sides of the thermal insulation panel is different, the heat will be transferred from the high-temperature side to the low-temperature side through the panel. The formula that can represent the heat transfer process on a flat panel is expressed in Equation (1).
Q = K F ( T o u t T i n )
where Q indicates the amount of heat going through container panel in a unit time. T o u t and T i n denote the external and internal temperature of the container, respectively. The area of the insulation panel is represented by F , whilst the heat transfer coefficient of the thermal insulation panel material is K .

3.1.2. Heat Transfer Model of Solar Radiation

After a certain amount of solar radiation energy is absorbed by the external surface of the thermal insulation panel, the heat transferred into the container will increase. To facilitate the study of the thermal effect of solar radiation on the container thermal insulation panel, the amount of absorbed solar radiation energy can be expressed in the form of temperature. Due to the thermal effect of the solar radiation, the amount of heat transferred from the air to the external side of the insulation panel is deemed as the heat that is obtained by the container surface from the solar radiation, which can be represented by Equation (2).
Q s = I F S c
where Q s is the solar radiation energy absorbed by the insulation panel and I is the solar radiation power S c denotes the absorption coefficient of the container external surface for the solar radiation energy.

3.1.3. Heat Balance Model of Container

The primary factors that can affect the internal temperature of the refrigerated container are the heat transfer on the container Q , the heat from solar radiation Q s , and the cooling energy generated from the refrigeration equipment Q C F . The relationship is described by Equation (3).
T i n m T i n m 1 Δ m ρ c V = j { b o t , a r r } K j F j ( T o u t m 1 T i n m 1 ) + I F t o p S c Q C F m 1    
where ρ represents the air density, c denotes the Specific Heat Capacity, and V is the internal volume of the container. m indicates the index of the current time slot and m 1 is the last time slot index. Δ m represents the control time interval. Various subscripts depict different parts of the container: b o t is the bottom of the container, a r r represents the sides (four vertical surfaces) of the container, and t o p is the top of the container.

3.1.4. Model of Compression

A refrigerated container should be capable of freezing, refrigerating, dehumidifying, defrosting, and heating for a long period and a refrigeration system must be employed in the container. The core equipment of the refrigeration system is the compression refrigerator which inhales the low temperature and low-pressure refrigerant gas through the suction pipe. Subsequently, the piston is driven by the electric motor to compress the refrigerant gas which will become high temperature and high pressure. The gas will be pumped into the exhaust pipe to provide the power for completing the refrigeration cycle. More specifically, a refrigeration cycle consists of compression, condensation, expansion and evaporation, and heat absorption. The amount of cooling energy produced by the refrigeration unit within the container can be calculated using Equation (4).
Q C F = P C F η
where P C F is the input electrical power of the refrigerator and η is the efficiency of producing the cooling energy.

3.2. Modelling of Energy Management

From the perspective of the port operator, the aim of the optimal control of the container temperature is to effectively schedule the output power of the container refrigerator so that the operating costs of the container business can be minimized and a good level of refrigeration within the container can be maintained. Therefore, the objective function is up made of the parts: the cost of the electricity, utilization, and maintenance of the compression refrigerator used in the container, as shown in Equation (5).
J = m i n m = 0 M α m P m + γ P m
where α m is the electricity price at time m , P m denotes the power consumption of the refrigerator, and γ marks the refrigerator maintenance cost per unit power consumption.
In addition, the temperature control system deployed in the refrigerated container needs to satisfy other constraints such as the energy balance constraint, container temperature constraint, and refrigerator power constraint.

3.2.1. Constraint for Refrigeration Load Balance

Equation (6) represents the energy balance constraint of all containers. Particularly, the refrigerated containers in the market are generally categorized as high-temperature containers, medium-temperature containers, low-temperature containers, and ultra-low-temperature containers, and the combination of the refrigeration supply power of all containers equals the total amount of refrigeration load. Here, we use numbers 1 to 4 to indicate different container types (high, medium, low, extra-low), respectively.   N i represents the total number of the i - th type containers.
Q C F = i 1 = 0 N 1 Q C F 1 + i 2 = 0 N 2 Q C F 2 + i 3 = 0 N 3 Q C F 3 + i 4 = 0 N 4 Q C F 4

3.2.2. Constraint for Container Temperature

Equation (7) indicates the temperature balance in the containers, where T i n k depicts the actual temperature in the container and T i n ,   s e t k indicates the pre-set temperature in the container. The permitted temperature error is represented by Δ T k .
| T i n , s e t k T i n k | Δ T k , k { 1 , 2 , 3 , 4 }

4. Operations of the Modules

4.1. Day-Ahead Dispatch Module

4.1.1. Emergency Control Strategies

The emergency control algorithm is commonly used in ports to manage the power of containers if the port does not have an energy management module. More specifically, if the temperature of the container does not exceed the threshold after arriving at the port, it is unnecessary to control the power of the container. Otherwise, the temperature of the container will be maintained at the permissible upper limit. The algorithm flow charts are shown in Figure 3.

4.1.2. Day-Ahead Module

Due to varying real-time electricity prices and different daily schedules for container entry and exit, the cost of the cooling energy for containers can be enormous if there is only an emergency control being applied. As a result, the DA module is designed to generate a more reasonable container energy management module to reduce the high electricity costs caused by the emergency control strategy. The operation flow chart of the DA module is presented in Figure 4.
(a) Firstly, the total amount of energy required by all containers is calculated using the emergency control algorithm (This algorithm will be introduced in the next part). Note that the day-ahead optimized scheduling algorithm is not used in this step. The specific process is that the temperature of a container will be checked whether it exceeds the limit when the container enters the port. No control action will be considered if there is no violation of the temperature limit. On the contrary, when the container temperature exceeds the threshold, it will be controlled at the lower boundary to ensure there is no violation of the temperature limit while consuming the least energy. The emergency control will be applied before the DA module to obtain the basis of the DA module calculation.
(b) Then, the DA module will re-allocate the total energy demand to different time slots when the container is still parked in the port based on the forecasted information in the next time slot. Furthermore, if the energy re-allocation is not carried out, the local power network may be overloaded for a period due to the uncertainty in the kick-in time of the containers, which could bring negative impacts to the power network stability. The detailed optimization strategy is modeled in Equation (8).
J = m i n m = 0 M i = 0 N ( α m p m i + γ p m i ) s . t . { m = 0 M i = 0 N p m i = Q e m e i i = 0 N p m i p l i
where N is the total number of the containers, whilst p l i . is the maximum allowed power distribution for reefer containers at time t.
(c) The optimization results of the power control strategy will be fed back to the port control center to verify whether the container temperature exceeds the limit. Then, the generated dispatch strategy will be temporarily stored in the control center database for the use of the ID module.

4.1.3. Day-Ahead Module for ON/OFF-Control Containers

For containers widely used in the market, there are two temperature control methods: frequency variation control (FVC) and ON/OFF control (ON/OFF). The biggest difference between FVC and ON/OFF is the control flexibility. For FVC, its controller can adjust the output power at any time and can smoothly change within the allowable range. On the contrary, the ON/OFF controller has only two states: on and off, which means that its output power has only two states: maximum and minimum. In addition, for the ON/OFF controller, the allowable switching frequency needs to be considered when generating the scheduling strategy to ensure long service life. Thus, the ON/OFF control scheme was proposed in this paper based on the frequency variation control. For containers with a non-adjustable controller, the rated power is configured considering that the temperature change in 1 h will not exceed 0.5 °C even when the container is not controlled. This is a reasonable temperature deviation according to engineering practice and thus the optimization time interval of the braking control strategy is set as 1 h which is consistent with the frequency variation control. In this way, the hourly frequency variation control strategy can be mapped to the hourly ON/OFF control. For example, container A works with a p kw output power between t0 and t1 under the frequency variation control. If the ON/OFF control is used instead, container A runs at the rated power of 2 p kW between t0 and t0 + 1/2(t1t0). Besides, the power supply will be turned off from t0 + 1/2(t1t0) till t1. The temperature change of the container in the latter half time slot is deemed to be within a reasonable range. The ON/OFF control strategy derived from the frequency variation control ensures the economic port operation as well as the robustness and safety of VFC.

4.2. Intra-Day Module

Considering that during the intra-day optimization, the arrival timeslot of the container may deviate from the scheduled one, for instance, an ultra-low temperature refrigerated container is scheduled to arrive at t0, but it is reached at t1. Assumed that the control timeslot is T, then in the time period from t0 + T(t1t0), it is necessary to adopt a control strategy different from the one generated by the DA module. In addition, if there is only DA control, it may cause peak loads at the time when the electricity price is low, which will affect the stability of the grid, so further adjustment of the control strategy is required.
This project proposes to use a distributed control strategy to fine-tune the day-ahead strategy. Assume that the control timeslot for real-time optimization is T. When the delayed container arrives at the port, the centralized control unit is connected and offers separate emergency control for it in the first control time slot. Next, the control strategy would be switched to a day-head control strategy at the beginning of the next control time slot, and the ID module will check whether the scheduling strategy is in line with the current real operation information and revise it.

5. Case Study

The proposed demand response method was applied to a case study of a medium commercial port hosting 1000 reefers. As shown in Table 1, four types of containers are considered in the case study, including the high-temperature containers, medium-temperature containers, low-temperature containers, and ultra-low-temperature containers and the detailed parameters of each type of container are shown in Table 2 and Table 3. The container data (e.g., size, entry time, exit time, and entry temperature) are produced from computer simulations and are listed in Table 4.
A 24 h simulation period was used in this case study and divided into time intervals of 15-min duration. Hence, the total port power demand is regulated every 15 min by the developed hierarchical control system. To evaluate the performance of the proposed management and control methodology, a case of 200 containers and 850 containers are used as the testbed, respectively.

5.1. Case of 200 Containers

The first case is the operation scenario with 200 containers with a random arrival time. Figure 5 compares the temperature change trends inside the container, respectively, under emergency control and under DA control. Due to the different types of storing goods, different containers have different internal temperature ranges, so there are multiple clusters of curves in the figure, and a cluster of curves represents containers with the same allowable temperature range. Figure 5a is the temperature change under the emergency control strategy. According to the introduction of the emergency control strategy, the internal temperature of the container will quickly reach the upper limit of the allowable range and then remain on the boundary. From the changing trend in the figure, the temperature rise has a large slope and a high proportion of the horizontal curve. Because this control method does not consider real-time electricity prices and load conditions, it may cause a lot of energy costs and increase load demand during the temperature-maintaining phase (horizontal curve).
Differently, The DA module will reallocate the total energy demand of each container based on the emergency control strategy according to electricity prices and load conditions. From the temperature change curve, the slope is relatively gentle under DA control, which indicates that the DA module will choose the time period with a lower electricity price to execute the control signal. This result is in line with the DA logic mentioned above.
To better illustrate the simulation results, Figure 6 depicts the control strategy of the 10 containers generated by the emergency control, including the control signal for 24 h in a day and when the timeslot is 15 min. Due to the different times of arrival and departure, the control strategies of different containers are different. But all of them follow the logic of emergency control: when the container enters the port, no control is applied to the container. The control will start when the internal temperature exceeds the limit. The reason for the different scheduling strategies at different times is the outdoor temperature, which affects the total energy required to maintain the stability of the internal temperature of the container.
To compare the performance of the proposed DA module, Figure 7 shows the control strategy of the same container under the control of the DA module. Different from Figure 6, the control strategy generated by DA is no longer a control strategy that is solely affected by temperature, but also considers the internal temperature constraints of the container and real-time electricity prices. Take container 4 as an example, the strategy generated by the emergency control is to allow its internal temperature to rise until it exceeds the limit before controlling it. Therefore, it can be seen from Figure 6 that the electrical energy required to control the container is the highest at noon, and then continues to decrease as the temperature drops. On the contrary, the control strategy of the DA module is to reallocate the total electrical energy required to maintain the stability of the internal temperature of the container according to the electricity price. It can be seen from Figure 7 that due to the abundant solar energy resources and low load levels at noon, the electricity price is low. As a result, the container compressor is running at full capacity. In certain periods in the morning and evening, the external grid load level is relatively higher, and the electricity price is also high, so the refrigeration compressor output is less at this time.
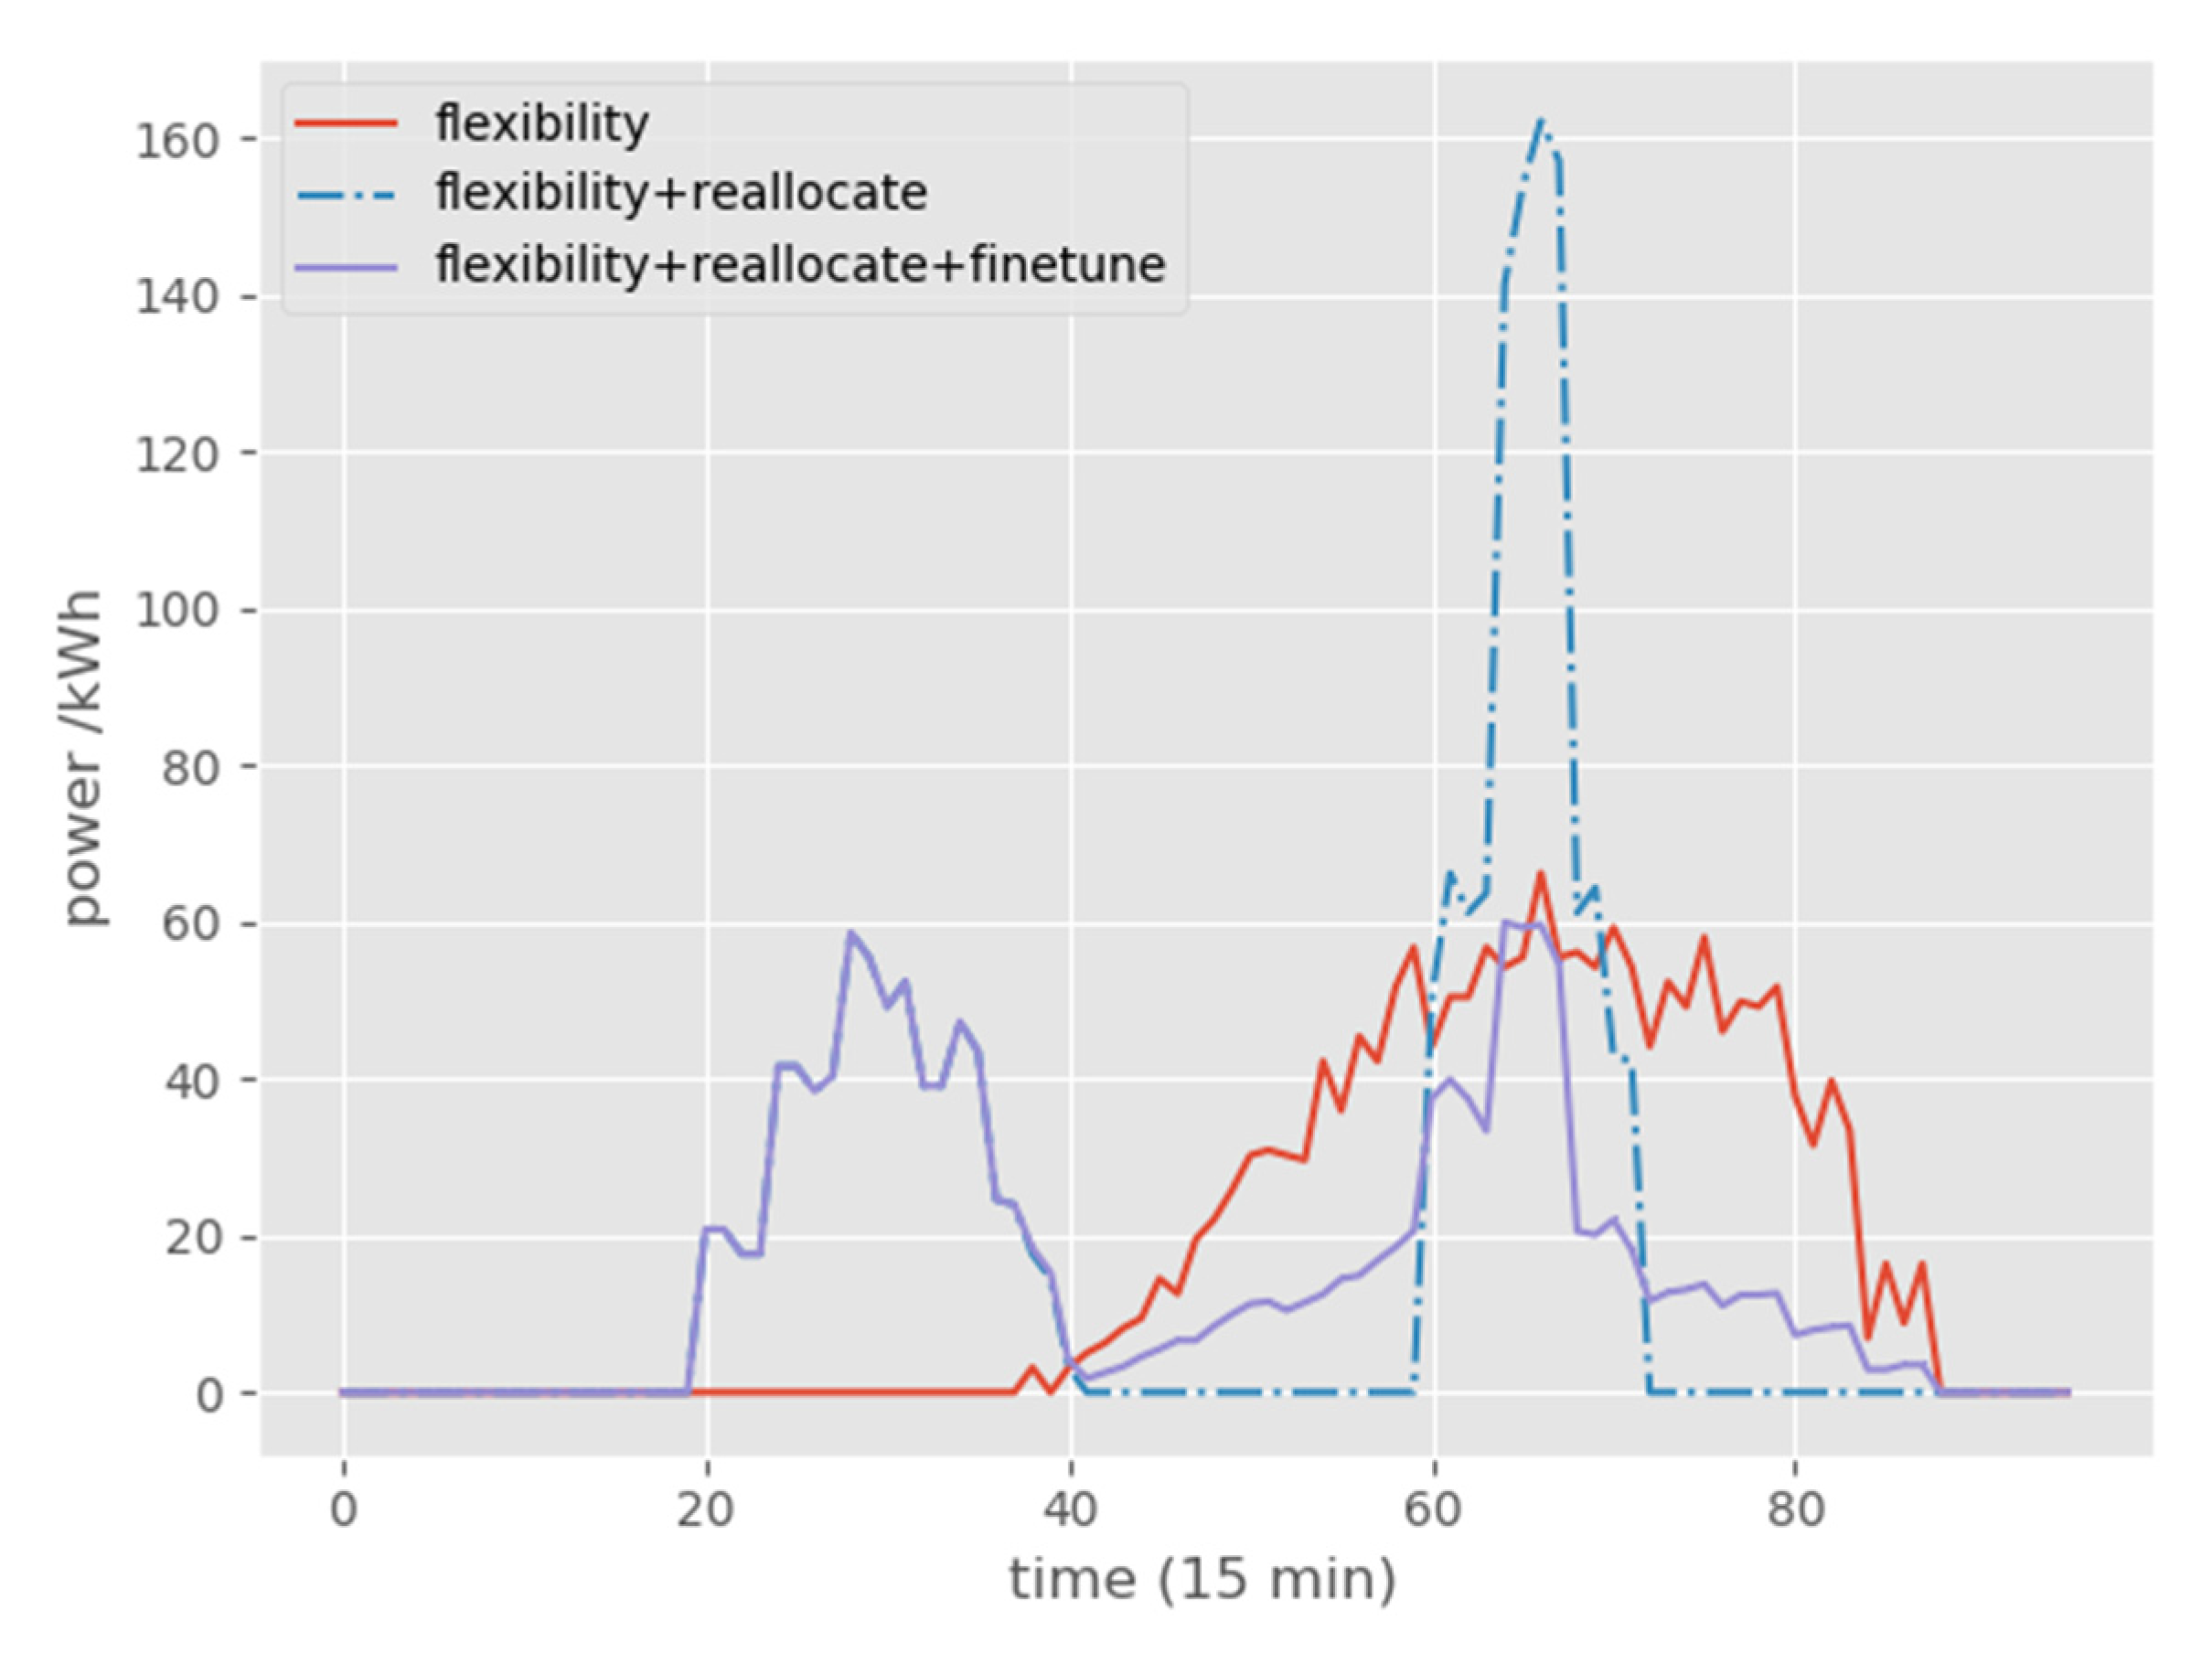
Figure 8 is the result of aggregating the energy consumed by all containers in all timeslots. In the legend in Figure 8, flexibility represents emergency control, reallocate represents the DA module and finetune is the ID module. From the aggregated load curve, it can be seen that the energy consumption of the port used to control the internal temperature of the container under emergency has no time-series distribution law, and it changes completely according to the outdoor temperature change and the time of container entry. Therefore, this method cannot help the port save energy costs.
After the DA module is added, the original peak load is distributed to other periods, and the load will be allocated as far as possible in the period of low electricity prices. However, this control module will form a peak load which will undermine the stability of the power grid. Due to the difference between forecast information and real-time operation information, the ID module is further adjusted based on the control strategy generated by the DA module to ensure that the container operation does not exceed the limit and does not exceed the load limit assigned to the port by the external power grid. The result shows that the ID module helps alleviate the peak load problem and limits the total power consumption of the port per hour not to exceed 60 kWh successfully.
Table 4 compares the port operating costs between the emergency control and proposed hierarchical control scheme. The DA and ID module takes into consideration the impact of real-time electricity prices and the total power limit of port containers, which helps the regulator of the port reduce the operating costs by approximately 14.7% per day compared to the emergency control. The results prove that the proposed module could help reduce the energy cost and peak load.
Since there are types that only allow ON/OFF control in the container, we also observed the ON/OFF control strategy generated by the DA module. Here, still taking container 4 as an example, it can be seen that at 10 am and 8–9 pm when the electricity price is highest, the generated control strategy is to turn off the chiller in the containers, thereby helping to reduce the cost of electricity, as Figure 9 shows. These results prove that the proposed strategy is also applicable to ON/OFF control.

5.2. Case of 850 Containers

To evaluate the scalability of the proposed method, we tested our methods on the condition of 850 containers. Figure 10 presents the total power distribution of 850 containers within 24 h. In the figure, the load curve under emergency control has not changed with the fluctuation of the electricity price, and at the same time, it has crossed the load limit of 200 kWh per hour. After the DA and ID modules are added, the required total load is allocated to the remaining period under the premise of meeting the container temperature constraints. In addition, it limits the peak load and helps increase the stability of the grid.
Table 5 compares the port operating costs between the emergency control and proposed hierarchical control scheme. The DA and ID modules consider the impact of real-time electricity prices and the total power limit of port containers, which help the regulator of the port to reduce the operating costs by approximately 400 m.u. (normalized value) and 18% compared to the emergency control each day. Compared with the scenario of 200 containers, the larger the container capacity of the port, the more significant the energy costs that can be saved. This proves the scalability of the proposed method.

6. Conclusions

In this paper, a hierarchical container-load management system employing the container temperature limitation and effective reduction of operation costs is proposed for large port electric systems. At the same time, the total operation load constraints were satisfied by the proposed control system. The hierarchical structure of the proposed system, the objectives of each module, and the way they interact to achieve their goals were presented in detail. The efficiency of the proposed method was evaluated by the case study of 200 containers and 850 containers, and the proposed hierarchical system can effectively save the operating costs of the containers while changing the distribution of energy. In the case of 200 containers, the proposed method helps reduce operating costs by about 14.7%, and 18% in the scenario of 850 containers. Meanwhile, this method ensures that the internal temperature of the container does not exceed the limit. Moreover, the proposed structure helps alleviate the peak load problem. In future research, we think more factors could be taken into consideration for the port electric system management, such as other dispatchable power loads of the port, renewable energy, and greenhouse gas emission indicators, etc. Together, these could be combined to form a complete energy management system for the port electric system.

Author Contributions

Conceptualization, J.X. and Z.W.; methodology, R.P. and J.X.; software, H.Z. and K.S.; validation, R.P. and H.Z.; formal analysis, K.S. and S.Z.; investigation, R.P. and Z.W.; writing—original draft preparation, R.P. and H.Z.; writing—review and editing, J.X. and K.S.; visualization, R.P. and J.X.; supervision, S.Z.; funding acquisition, Z.W. and S.Z. All authors have read and agreed to the published version of the manuscript.

Funding

This work was supported by the Science and Technology Project of Headquarters of State Grid Corporation of China “Research on Key Technologies of multi heterogeneous real time simulation of urban energy interconnection network” under the grant number 5400-202018114A-0-0-00.

Acknowledgments

The authors would like to thank the sponsorship of the Science and Technology Project of Headquarters of State Grid Corporation of China “Research on Key Technologies of multi heterogeneous real time simulation of urban energy interconnection network” under the grand number 5400-202018114A-0-0-00.

Conflicts of Interest

The authors declare no conflict of interest.

References

  1. Acciaro, M.; Ghiara, H.; Cusano, M.I. Energy management in seaports: A new role for port authorities. Energy Policy 2014, 71, 4–12. [Google Scholar] [CrossRef]
  2. Parise, G.; Parise, L.; Martirano, L.; Ben Chavdarian, P.; Su, C.-L.; Ferrante, A. Wise Port and Business Energy Management: Port Facilities, Electrical Power Distribution. IEEE Trans. Ind. Appl. 2016, 52, 18–24. [Google Scholar] [CrossRef]
  3. Verbeeck, J.; Kuijper, F.; Wellbrock, P.; Gray, D.; Skog, D.; Kooistra, S. The e-Harbours Journey: Point of Arrival: Smart Energy Networks in the North Sea region. E-Harbours Project. February 2014. Available online: http://eharbours.eu/wp-content/uploads/e-harbours-report-Point-ofArrival-Final.pdf (accessed on 28 February 2014).
  4. Hannan, M.A.; Faisal, M.; Ker, P.J.; Mun, L.H.; Parvin, K.; Mahlia, T.M.I.; Blaabjerg, F. A Review of Internet of Energy Based Building Energy Management Systems: Issues and Recommendations. IEEE Access 2018, 6, 38997–39014. [Google Scholar] [CrossRef]
  5. Meng, L.; Sanseverino, E.R.; Luna, A.; Dragicevic, T.; Vasquez, J.C.; Guerrero, J.M. Microgrid supervisory controllers and energy management systems: A literature review. Renew. Sustain. Energy Rev. 2016, 60, 1263–1273. [Google Scholar] [CrossRef]
  6. Vera, Y.E.G.; Dufo-López, R.; Bernal-Agustín, J.L. Energy Management in Microgrids with Renewable Energy Sources: A Literature Review. Appl. Sci. 2019, 9, 3854. [Google Scholar] [CrossRef] [Green Version]
  7. Bidram, A.; Davoudi, A. Hierarchical Structure of Microgrids Control System. IEEE Trans. Smart Grid 2012, 3, 1963–1976. [Google Scholar] [CrossRef]
  8. Guerrero, J.; Vasquez, J.C.; Matas, J.; de Vicuña, L.G.; Castilla, M. Hierarchical Control of Droop-Controlled AC and DC Microgrids—A General Approach Toward Standardization. IEEE Trans. Ind. Electron. 2011, 58, 158–172. [Google Scholar] [CrossRef]
  9. Olivares, D.E.; Mehrizi-Sani, A.; Etemadi, A.H.; Canizares, C.A.; Iravani, R.; Kazerani, M.; Hajimiragha, A.H.; Gomis-Bellmunt, O.; Saeedifard, M.; Palma-Behnke, R.; et al. Trends in Microgrid Control. IEEE Trans. Smart Grid 2014, 5, 1905–1919. [Google Scholar] [CrossRef]
  10. Bashash, S.; Moura, S.J.; Forman, J.C.; Fathy, H.K. Plug-in hybrid electric vehicle charge pattern optimization for energy cost and battery longevity. J. Power Sources 2011, 196, 541–549. [Google Scholar] [CrossRef]
  11. Chen, S.; Ji, Y.; Tong, L. Large scale charging of electric vehicles. In Power and Energy Society General Meeting; IEEE: Piscataway, NJ, USA, 2012; pp. 1–9. [Google Scholar]
  12. Mohsenian-Rad, A.-H.; Wong, V.W.S.; Jatskevich, J.; Schober, R.; Leon-Garcia, A. Autonomous Demand-Side Management Based on Game-Theoretic Energy Consumption Scheduling for the Future Smart Grid. IEEE Trans. Smart Grid 2010, 1, 320–331. [Google Scholar] [CrossRef] [Green Version]
  13. Stüdli, S.; Crisostomi, E.; Middleton, R.; Shorten, R. A flexible distributed framework for realising electric and plug-in hybrid vehicle charging policies. Int. J. Control. 2012, 85, 1130–1145. [Google Scholar] [CrossRef]
  14. Buiza, G.; Cepolina, S.; Dobrijevic, A.; del Mar Cerbán, M.; Djordjevic, O.; González, C. Current situation of the Mediterranean container ports regarding the operational, energy and environment areas. In Proceedings of the 2015 International Conference on Industrial Engineering and Systems Management (IESM), Seville, Spain, 21–23 October 2015; pp. 530–536. [Google Scholar]
  15. Lam JS, L.; Ko, M.J.; Sim, J.R.; Tee, Y. Feasibility of implementing energy management system in ports. In Proceedings of the 2017 IEEE International Conference on Industrial Engineering and Engineering Management (IEEM), Singapore, 10–13 December 2017; pp. 1621–1625. [Google Scholar]
  16. Martínez-Moya, J.; Vazquez-Paja, B.; Maldonado, J.A.G. Energy efficiency and CO2 emissions of port container terminal equipment: Evidence from the Port of Valencia. Energy Policy 2019, 131, 312–319. [Google Scholar] [CrossRef]
  17. He, J.; Huang, Y.; Yan, W. Yard crane scheduling in a container terminal for the trade-off between efficiency and energy consumption. Adv. Eng. Informatics 2015, 29, 59–75. [Google Scholar] [CrossRef]
  18. He, J.; Huang, Y.; Yan, W.; Wang, S. Integrated internal truck, yard crane and quay crane scheduling in a container terminal considering energy consumption. Expert Syst. Appl. 2015, 42, 2464–2487. [Google Scholar] [CrossRef]
  19. Kanellos, F.D.; Volanis, E.M.; Hatziargyriou, N.D. Power Management Method for Large Ports with Multi-Agent Systems. IEEE Trans. Smart Grid 2019, 10, 1259–1268. [Google Scholar] [CrossRef]
  20. Gennitsaris, S.G.; Kanellos, F.D. Emission-Aware and Cost-Effective Distributed Demand Response System for Extensively Electrified Large Ports. IEEE Trans. Power Syst. 2019, 34, 4341–4351. [Google Scholar] [CrossRef]
  21. Kanellos, F.D. Real-Time Control Based on Multi-Agent Systems for the Operation of Large Ports as Prosumer Microgrids. IEEE Access 2017, 5, 9439–9452. [Google Scholar] [CrossRef]
  22. Dulebenets, M.A.; Moses, R.; Ozguven, E.E.; Vanli, A. Minimizing Carbon Dioxide Emissions Due to Container Handling at Marine Container Terminals via Hybrid Evolutionary Algorithms. IEEE Access 2017, 5, 8131–8147. [Google Scholar] [CrossRef]
  23. Carli, R.; Cavone, G.; Dotoli, M.; Epicoco, N.; Scarabaggio, P. Model predictive control for thermal comfort optimization in building energy management systems. In Proceedings of the 2019 IEEE International Conference on Systems, Man and Cybernetics (SMC), Bari, Italy, 6–9 October 2019. [Google Scholar]
Figure 1. Daily Reefer Container Park Maintenance.
Energies 14 04456 g001
Figure 2. Reefer container hierarchical scheme.
Energies 14 04456 g002
Figure 3. Flow chart of emergency control.
Energies 14 04456 g003
Figure 4. Flow chart of the day-ahead energy optimisation and scheduling.
Energies 14 04456 g004
Figure 5. Temperature change of containers.
Energies 14 04456 g005
Figure 6. Emergency control strategy of containers.
Energies 14 04456 g006
Figure 7. Frequency variation control strategy of containers with day-ahead optimization and control.
Energies 14 04456 g007
Figure 8. Total power distribution of containers.
Energies 14 04456 g008
Figure 9. ON/OFF control strategy of containers with day-ahead optimization and control.
Energies 14 04456 g009
Figure 10. Total power distribution of the containers.
Energies 14 04456 g010
Table 1. Types of Containers.
Container TypeTemperature Range (°C)Entry TemperatureHourly Temperature Rise under Ambient Condition 25 °C/500 (w/m2)
High Temperature[−1, 1]00.31
Medium Temperature[−6, −4]−50.34
Low Temperature[−16, −14]−150.37
Ultra-Low-Temperature[−31, −29]−200.42
Table 2. Container Parameter.
Size   ( ft ) Surface   Area   ( m 2 ) Thermal Conductivity k (W/m2·K) Heat   Capacity c p   ( kJ / kg · K ) Weight ( kg )
2073.560.4[1.71, 4.09][18,000, 26,000]
40135.260.4[1.71, 4.09][18,000, 26,000]
Table 3. Data of Containers.
Container NumberContainer TypeSizeEntry TimeExit TimeEntry Temperature
0Randomly generated from range (0, 3)40 feetRandomRandomDepending on the container type
1Randomly generated from range (0, 3)20 feetRandomRandomDepending on the container type
Randomly generated from range (0, 3)20 feetRandomRandomDepending on the container type
200Randomly generated from range (0, 3)40 feetRandomRandomDepending on the container type
Table 4. Port operating cost comparison.
Control StrategyDaily Operating Cost/m.u.Temperature Limit Violation (Y/N)Cost Saving
Emergency Control2120.5052N0%
DA + ID module1808.52N14.7%
Table 5. Port operating cost comparison.
Control StrategyDaily Operating Cost/m.u.Temperature Limit Violation (Y/N)Cost Saving
Emergency Control8081N0%
DA + ID module6605N18%
Publisher’s Note: MDPI stays neutral with regard to jurisdictional claims in published maps and institutional affiliations.

