Article

Lithium Battery SOH Monitoring and an SOC Estimation Algorithm Based on the SOH Result

School of Electronic and Electrical Engineering, Kyungpook National University, Daegu 41566, Korea
*
Author to whom correspondence should be addressed.
Energies 2021, 14(15), 4506; https://doi.org/10.3390/en14154506
Submission received: 5 June 2021 / Revised: 16 July 2021 / Accepted: 22 July 2021 / Published: 26 July 2021

Abstract

:
Lithium batteries are the most common energy storage devices in items such as electric vehicles, portable devices, and energy storage systems. However, if lithium batteries are not continuously monitored, their performance could degrade, their lifetime become shortened, or severe damage or explosion could be induced. To prevent such accidents, we propose a lithium battery state of health monitoring method and state of charge estimation algorithm based on the state of health results. The proposed method uses four neural network models. A neural network model was used for the state of health diagnosis using a multilayer neural network model. The other three neural network models were configured as neural network model banks, and the state of charge was estimated using a multilayer neural network or long short-term memory. The three neural network model banks were defined as normal, caution, and fault neural network models. Experimental results showed that the proposed method using the long short-term memory model based on the state of health diagnosis results outperformed the counterpart methods.

1. Introduction

Lithium batteries are secondary batteries recognized as a core future technology for renewable energy. Their advantages include having high power density, low self-discharge rate, and they are lightweight, so they are used in various items, such as electric vehicles, portable devices, and energy storage systems [1,2,3,4]. However, if lithium batteries are not continuously monitored, their performance could degrade, their lifetime become shortened, or severe damage or explosion could be induced [5]. Therefore, it is crucial to monitor the internal parameters, such as the state of charge (SOC) and state of health (SOH) to optimize lithium battery performance and extend their lifetime. Thus, the internal parameters of lithium batteries must be continuously monitored through a battery management system while the battery is operating to ensure their reliability and efficiency [6,7].
The SOC refers to the remaining capacity of the battery. SOC estimation for a battery can predict the remaining capacity in the battery, which prevents over-discharging and overcharging of the battery. It also provides reliability by enabling stable battery use. The SOH refers to the state of aging of a battery. Knowing a battery’s SOH can determine its replacement cycle. Therefore, it is an efficient operating system because it prevents accidents, such as fire and explosion due to the progress of battery aging. A battery’s voltage, current, temperature, and operating environment affect the SOC and SOH; therefore, an algorithm that can model the characteristics of batteries is required.
Recently, many researchers have studied SOC estimation or SOH monitoring methods for batteries. SOC estimation and SOH monitoring methods can be categorized into the following types: model-based, data-driven, and coulomb-counting methods [8]. The model-based methods can be powerful and accurate because they rely on a deep understanding of the system. However, there are practical and theoretical problems in obtaining a perfect model of any system. The data-driven methods rely extensively on data analysis of a process, which eliminates the need for practitioners to develop an in-depth, domain-specific understanding of the background process. However, a large amount of data is required. The coulomb-counter methods measure the discharge current of a battery and integrate it over time to obtain the current capacity of the battery. Table 1 summarizes the three methods.
Among the example models, for the equivalent circuit model, a lithium battery is modeled abstractly by combining the parameters of resistance, capacitor, and inductor. However, since the model is based on electrical characteristics, the internal reaction of the battery cannot be explained [21]. In the case of the open-circuit voltage (OCV)-SOC model, SOC estimation is performed by modeling the SOC relationship according to the OCV of a battery. It is simple to implement and accurate; however, it is vulnerable to uncertain factors such as temperature, aging, and driving cycle [22]. For the coulomb-counter model, the current capacity of a battery is estimated using a red current integration method. It can be implemented simply, but if it is used for a long time, measurement errors will accumulate, and accuracy will deteriorate [23]. For the Kalman filter, the nonlinear characteristics of a battery can be learned and estimated in real time; however, as the predicted state variable increases, the calculation becomes more complex, and the calculation time increases [24]. For the neural network (NN) and deep learning models, the relationship between the capacity and parameters of a battery is learned on the basis of the parameters measured in the battery. The main challenge of these models is to accurately model the aging of a battery by extracting useful characteristics from the measured signals [25].
In this article, we propose a lithium battery SOH monitoring method and SOC estimation algorithm based on the SOH results. The main contributions of this paper are highlighted as follows. First, the proposed method with an MNN model was used to diagnose the SOH. Second, the battery’s SOC was estimated using the outputted SOH results. This allowed us to obtain both SOH and SOC simultaneously, and we estimated SOC using the SOH results. The proposed method also obtained more accurate SOC estimation results using information from the current state of the battery when estimating the SOC. Third, the multilayer NN and long short-term memory models were used to learn the nonlinear characteristics of the lithium battery.
The proposed algorithm uses one multilayer NN (MNN) model for SOH diagnosis and three NN model banks for SOC estimation. Each NN model bank comprises a normal model, a caution model, and a fault model according to the learned data. The proposed algorithm estimates SOC by selecting one of three NN model banks according to the SOH results and outputs the SOC and SOH results simultaneously. For example, if the output of the SOH diagnostic model is normal, the SOC estimation result of the normal model is the output. To verify the performance of the proposed algorithm, we compared it with the general MNN and long short-term memory (LSTM) models. This is discussed in more detail in Section 3.2.3.

2. Proposed SOC Estimation and SOH Diagnosis Method

2.1. Definition of SOC and SOH

The SOC refers to a battery’s remaining current capacity and is a critical parameter to consider when monitoring a battery. It is a percentage of the current releasable capacity from a battery’s rated capacity, defined as follows [26]:
SOC = C R e m a i n i n g C I n i t i a l × 100   % ,
where C R e m a i n i n g is the measured usable remaining capacity and C I n i t i a l is the measured capacity of the battery at the beginning.
The SOC can be calculated in the coulomb counter. However, this method has the disadvantage that the correct SOC value cannot be calculated if the initial SOC setting is incorrect or a sensor error is accumulated. This study estimated the SOC using an NN that can model battery characteristics.
The SOH is an indicator of performance degradation because of the battery, and the battery state can be measured on the basis of the SOH. The SOH refers to the current battery capacity as a percentage of the initial capacity, defined as follows [27]:
SOH = C C u r r e n t C F r e s h × 100   % ,  
where C C u r r e n t is the measured capacity after one cycle is over and C F r e s h is the measured capacity of the battery at the beginning of its life.
If the capacity of a battery decreases to lower than 80% of its initial capacity, it is a failure [28]. In this study, when the SOH was in the range of 100–90%, 90–80%, or <80%, the battery was, respectively, in a normal, caution, or fault state.

2.2. Proposed SOH Monitoring and the SOC Estimation Algorithm Based on the SOH Results

2.2.1. Proposed SOH Diagnosis Method

The proposed method uses the SOH diagnosis and SOC estimation NN models simultaneously. In addition, the SOH results are used for the SOC estimation. The SOH diagnosis model is shown in Figure 1.
The SOH diagnosis model is used in the MNN model. The SOH model outputs three results, normal, caution, or fault, which are defined in the interval of the capacity decrease due to aging of a battery, as of Section 2.1. Afterward, the SOH result is input into the NN model bank, which outputs the SOC estimation result by selecting one of the three models according to the SOH result.

2.2.2. Proposed SOC Estimation Based on the SOH

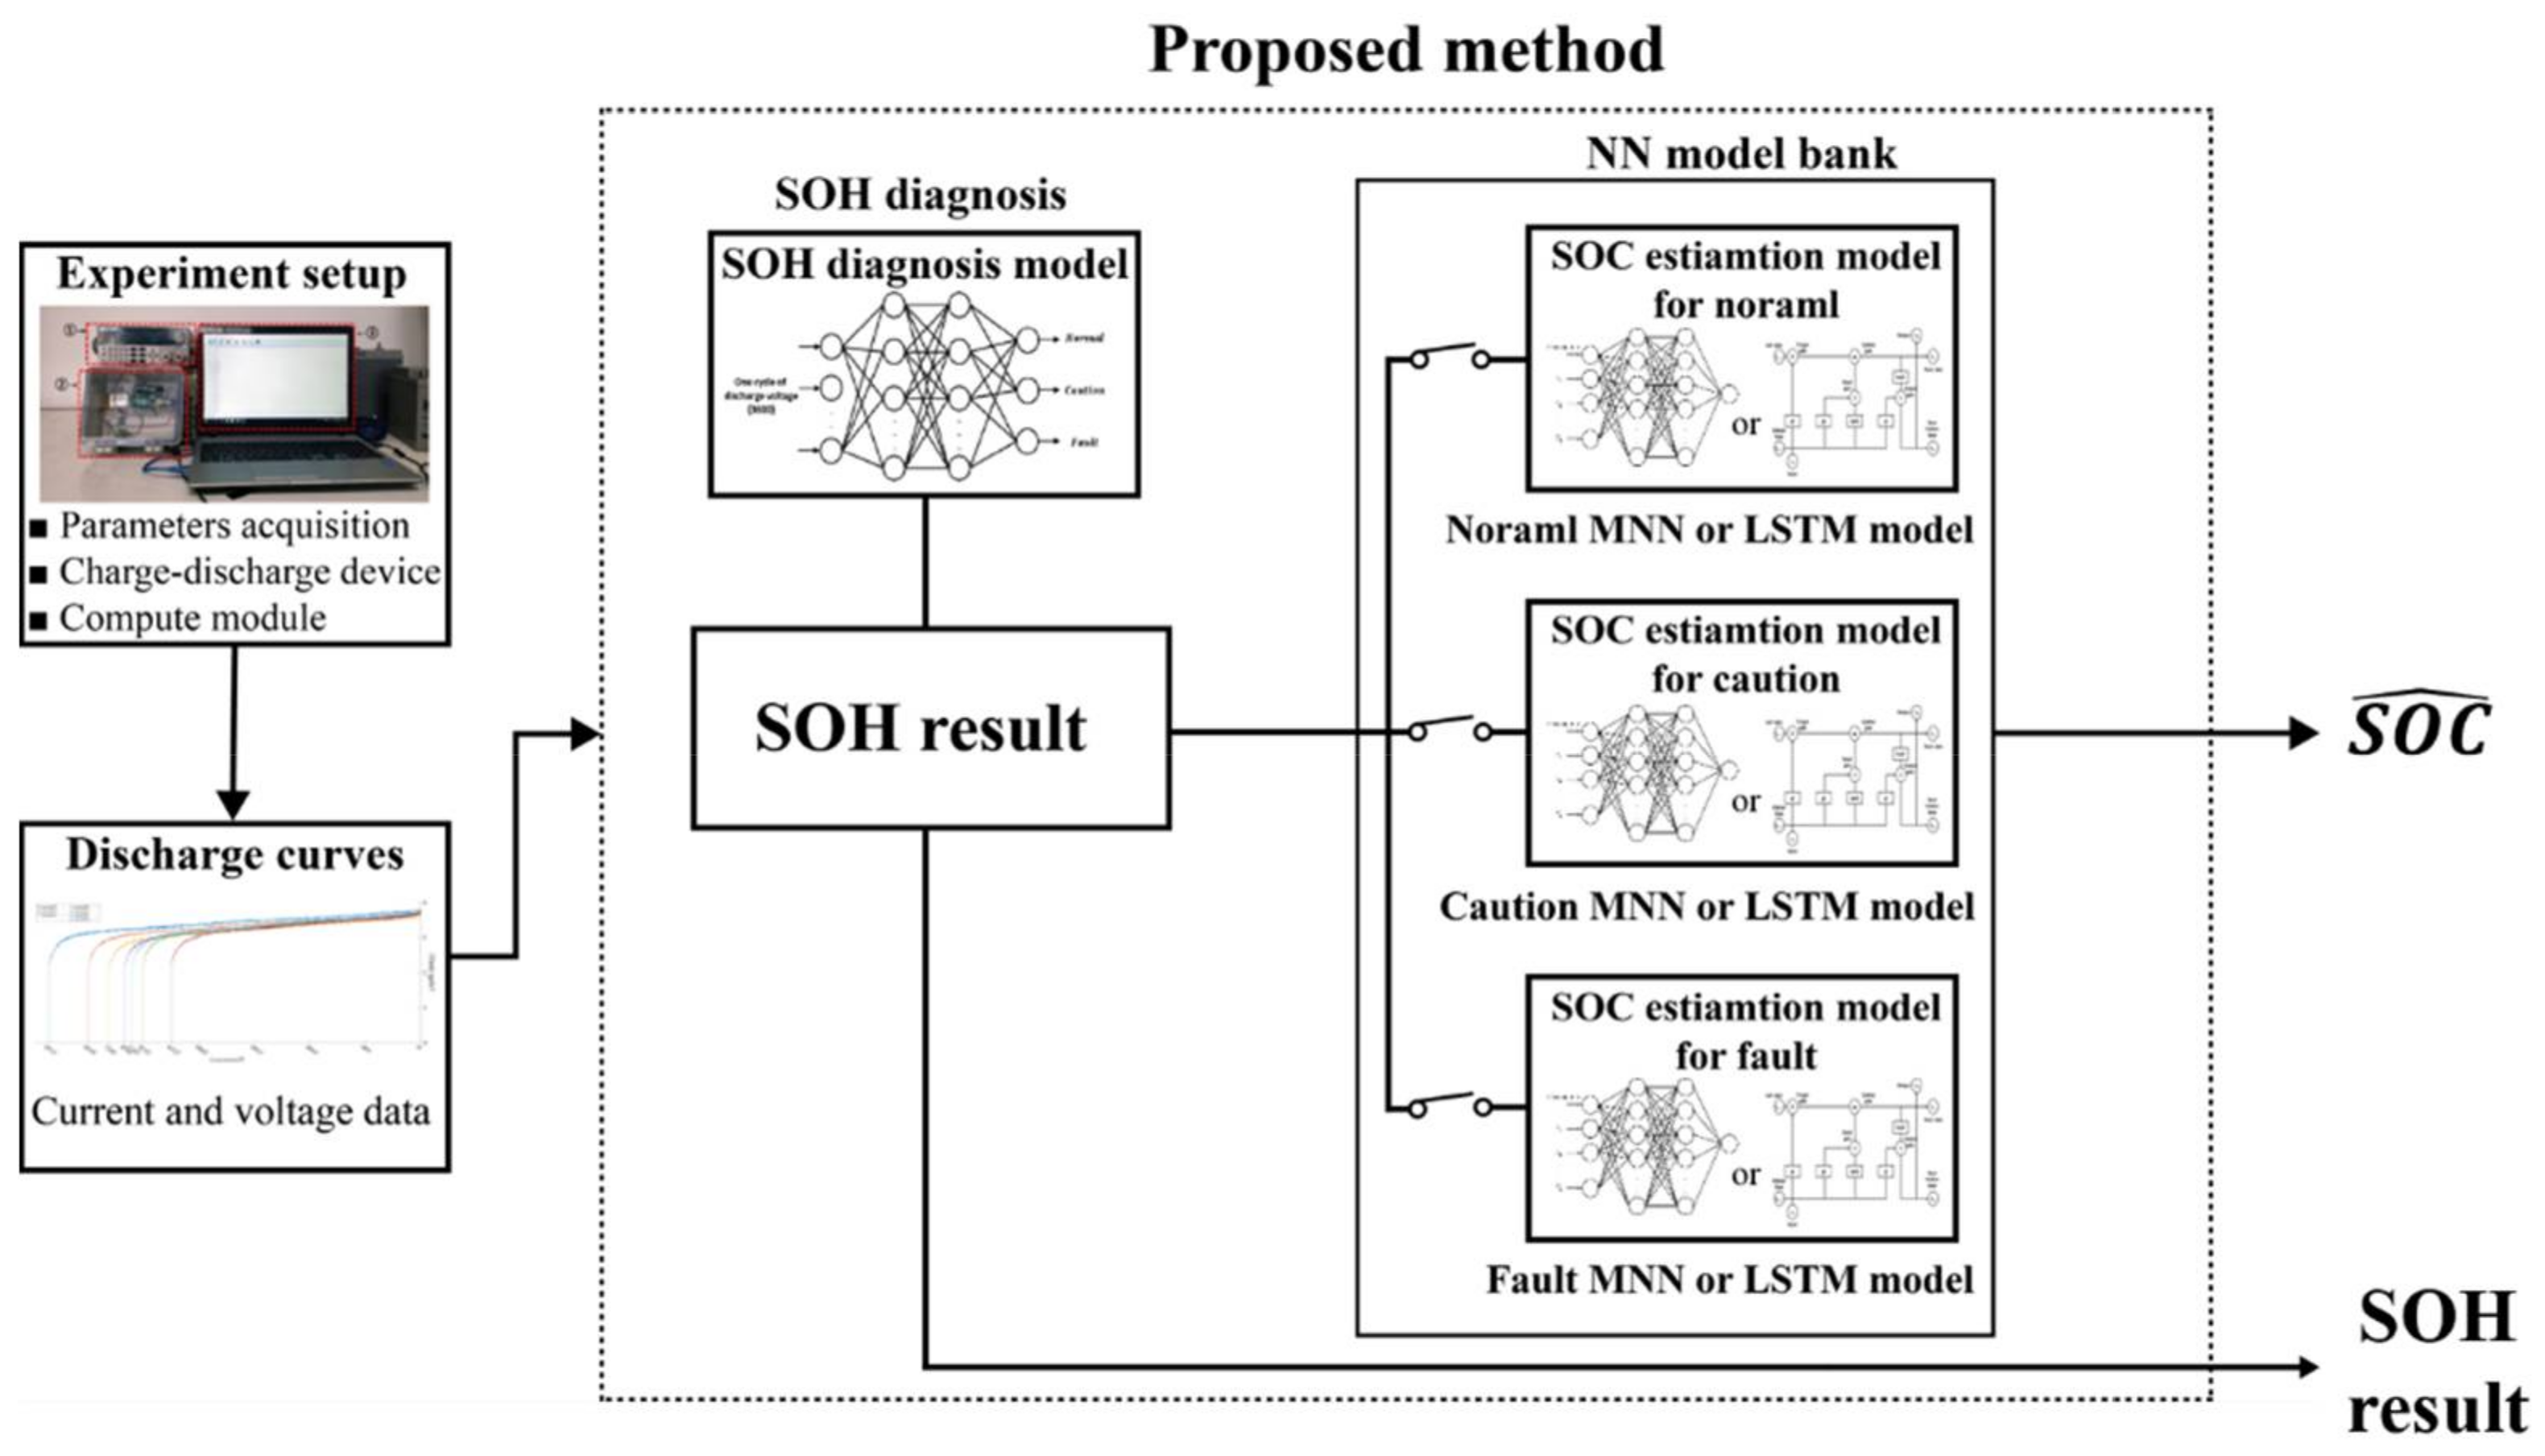
Existing SOC estimation methods use parameters such as voltage, current, temperature, and internal resistance to model the deterioration characteristics of a battery to estimate the SOC [29,30]. The proposed method works in three key steps. Step 1: The acquired battery data is input into the SOH model and the SOC NN model bank simultaneously. Step 2: The SOC is estimated and diagnosed in the SOH model and SOC NN model bank. Step 3: According to the SOH result, one of the three SOC NN model banks is selected, and the SOH and SOC results are output. The structure of the proposed method is shown in Figure 2.
The NN model bank consists of three models: normal, caution, and fault. Each model was defined as normal, caution, or fault according to the learned data group. In addition, the models of the NN model bank used MNN or LSTM to compare which NN performs better when using MNN or LSTM.
The proposed method process is described below. First, the battery voltage data are acquired from the experimental device. The acquired data are transformed so that they can be input into each SOH and SOC NN. The battery voltage data are transformed into one cycle of discharge and a voltage dataset with a different number of inputs, respectively. Next, the one cycle of discharge dataset is input into the SOH diagnostic model and classified as normal, cautious, or faulty. Then, one of the normal, cautious, or faulty NN models in the selected NN model bank receives the voltage dataset. Afterward, the NN model bank estimates the SOC. Finally, the SOC estimation and SOH diagnostic results are output together. Figure 3 shows this method in detail via a flowchart.

2.3. MNN

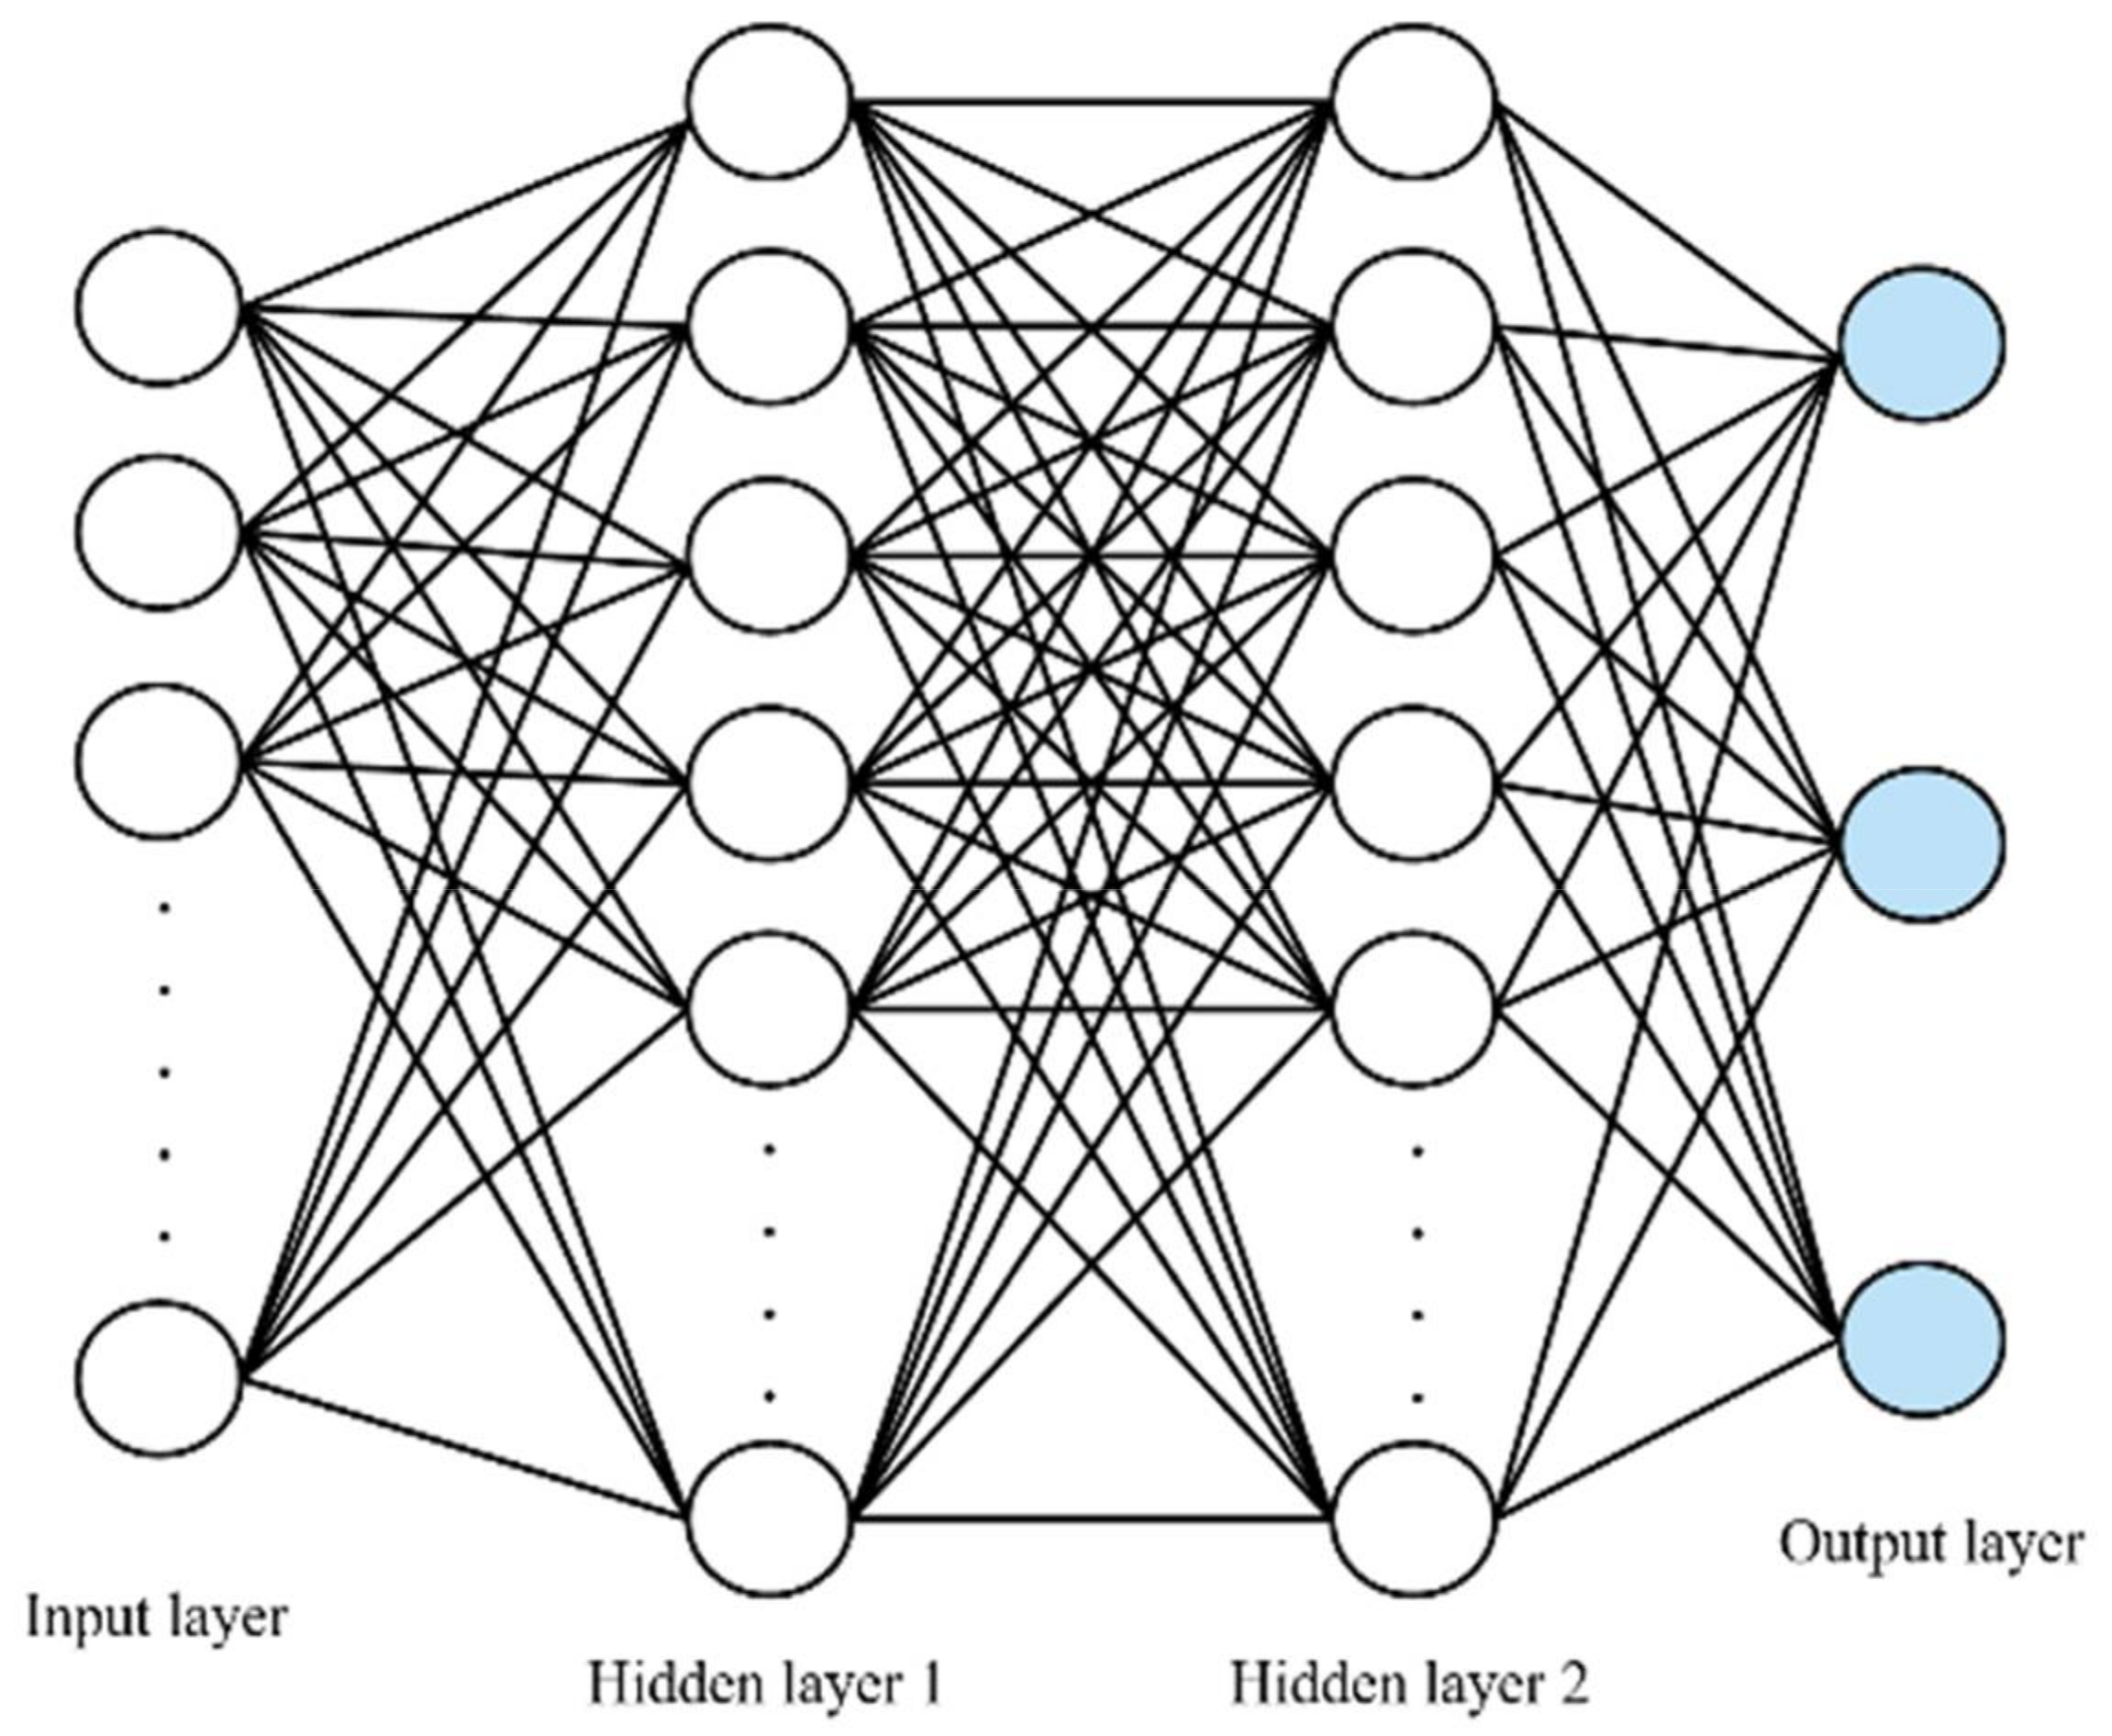
The structure of an MNN consists of two or more hidden layers (Figure 4). For the SOC estimation model, the input layer takes the operating time and voltage values, and the output layer outputs SOC values. For the SOH diagnosis model, the input layer takes the voltage values, and the output layer outputs three values: normal, caution, or faulty. By teaching the MNNs with input–output pairs, it is possible to form a nonlinear map that accurately models input–output relationships without prior knowledge of the internal structure of the battery [31].
The Adam method is used as a learning method for the SOC and SOH models. The Adam method is a first-order gradient-based optimization algorithm of a stochastic objective function based on adaptive estimation of low-order moments. This method is simple to implement, has high computational efficiency, rescales the diagonal of the gradient, and is suitable for large problems in terms of data or parameters [32]. The Adam equation is as follows:
m t = β 1 m t + 1 β 1 θ f θ
v t = β 2 v t 1 + 1 β 2 θ f θ 2
In the above equation, since m and v are initialized as 0, a bias close to 0 is expected at the start of learning, and they go through the following process to make them unbiased. The equations are as follows:
m t ^ = m t 1 β 1 t
v t ^ = v t 1 β 2 t
θ = θ η v t ^ + ϵ m t ^
where m t is the exponential moving averages of the gradient, v t is the squared gradient, and θ f θ is the gradient of the network; β 1 and β 2 are exponential decay rates for the moment estimates, the value of β 1   is 0.9 and β 2   is 0.999; t is the time step initialization, θ is the initial parameter vector, and ϵ is 10 8 .
The rectified linear unit (ReLU) is used as the activation function for each hidden layer. The ReLU outputs 0 when x < 0, and conversely, it outputs a linear function when x ≥ 0. Therefore, it can converge as fast as possible [33]. The ReLU is as follows:
f x =   x ,   f o r   x > 0     0 ,   f o r   x 0

2.4. LSTM

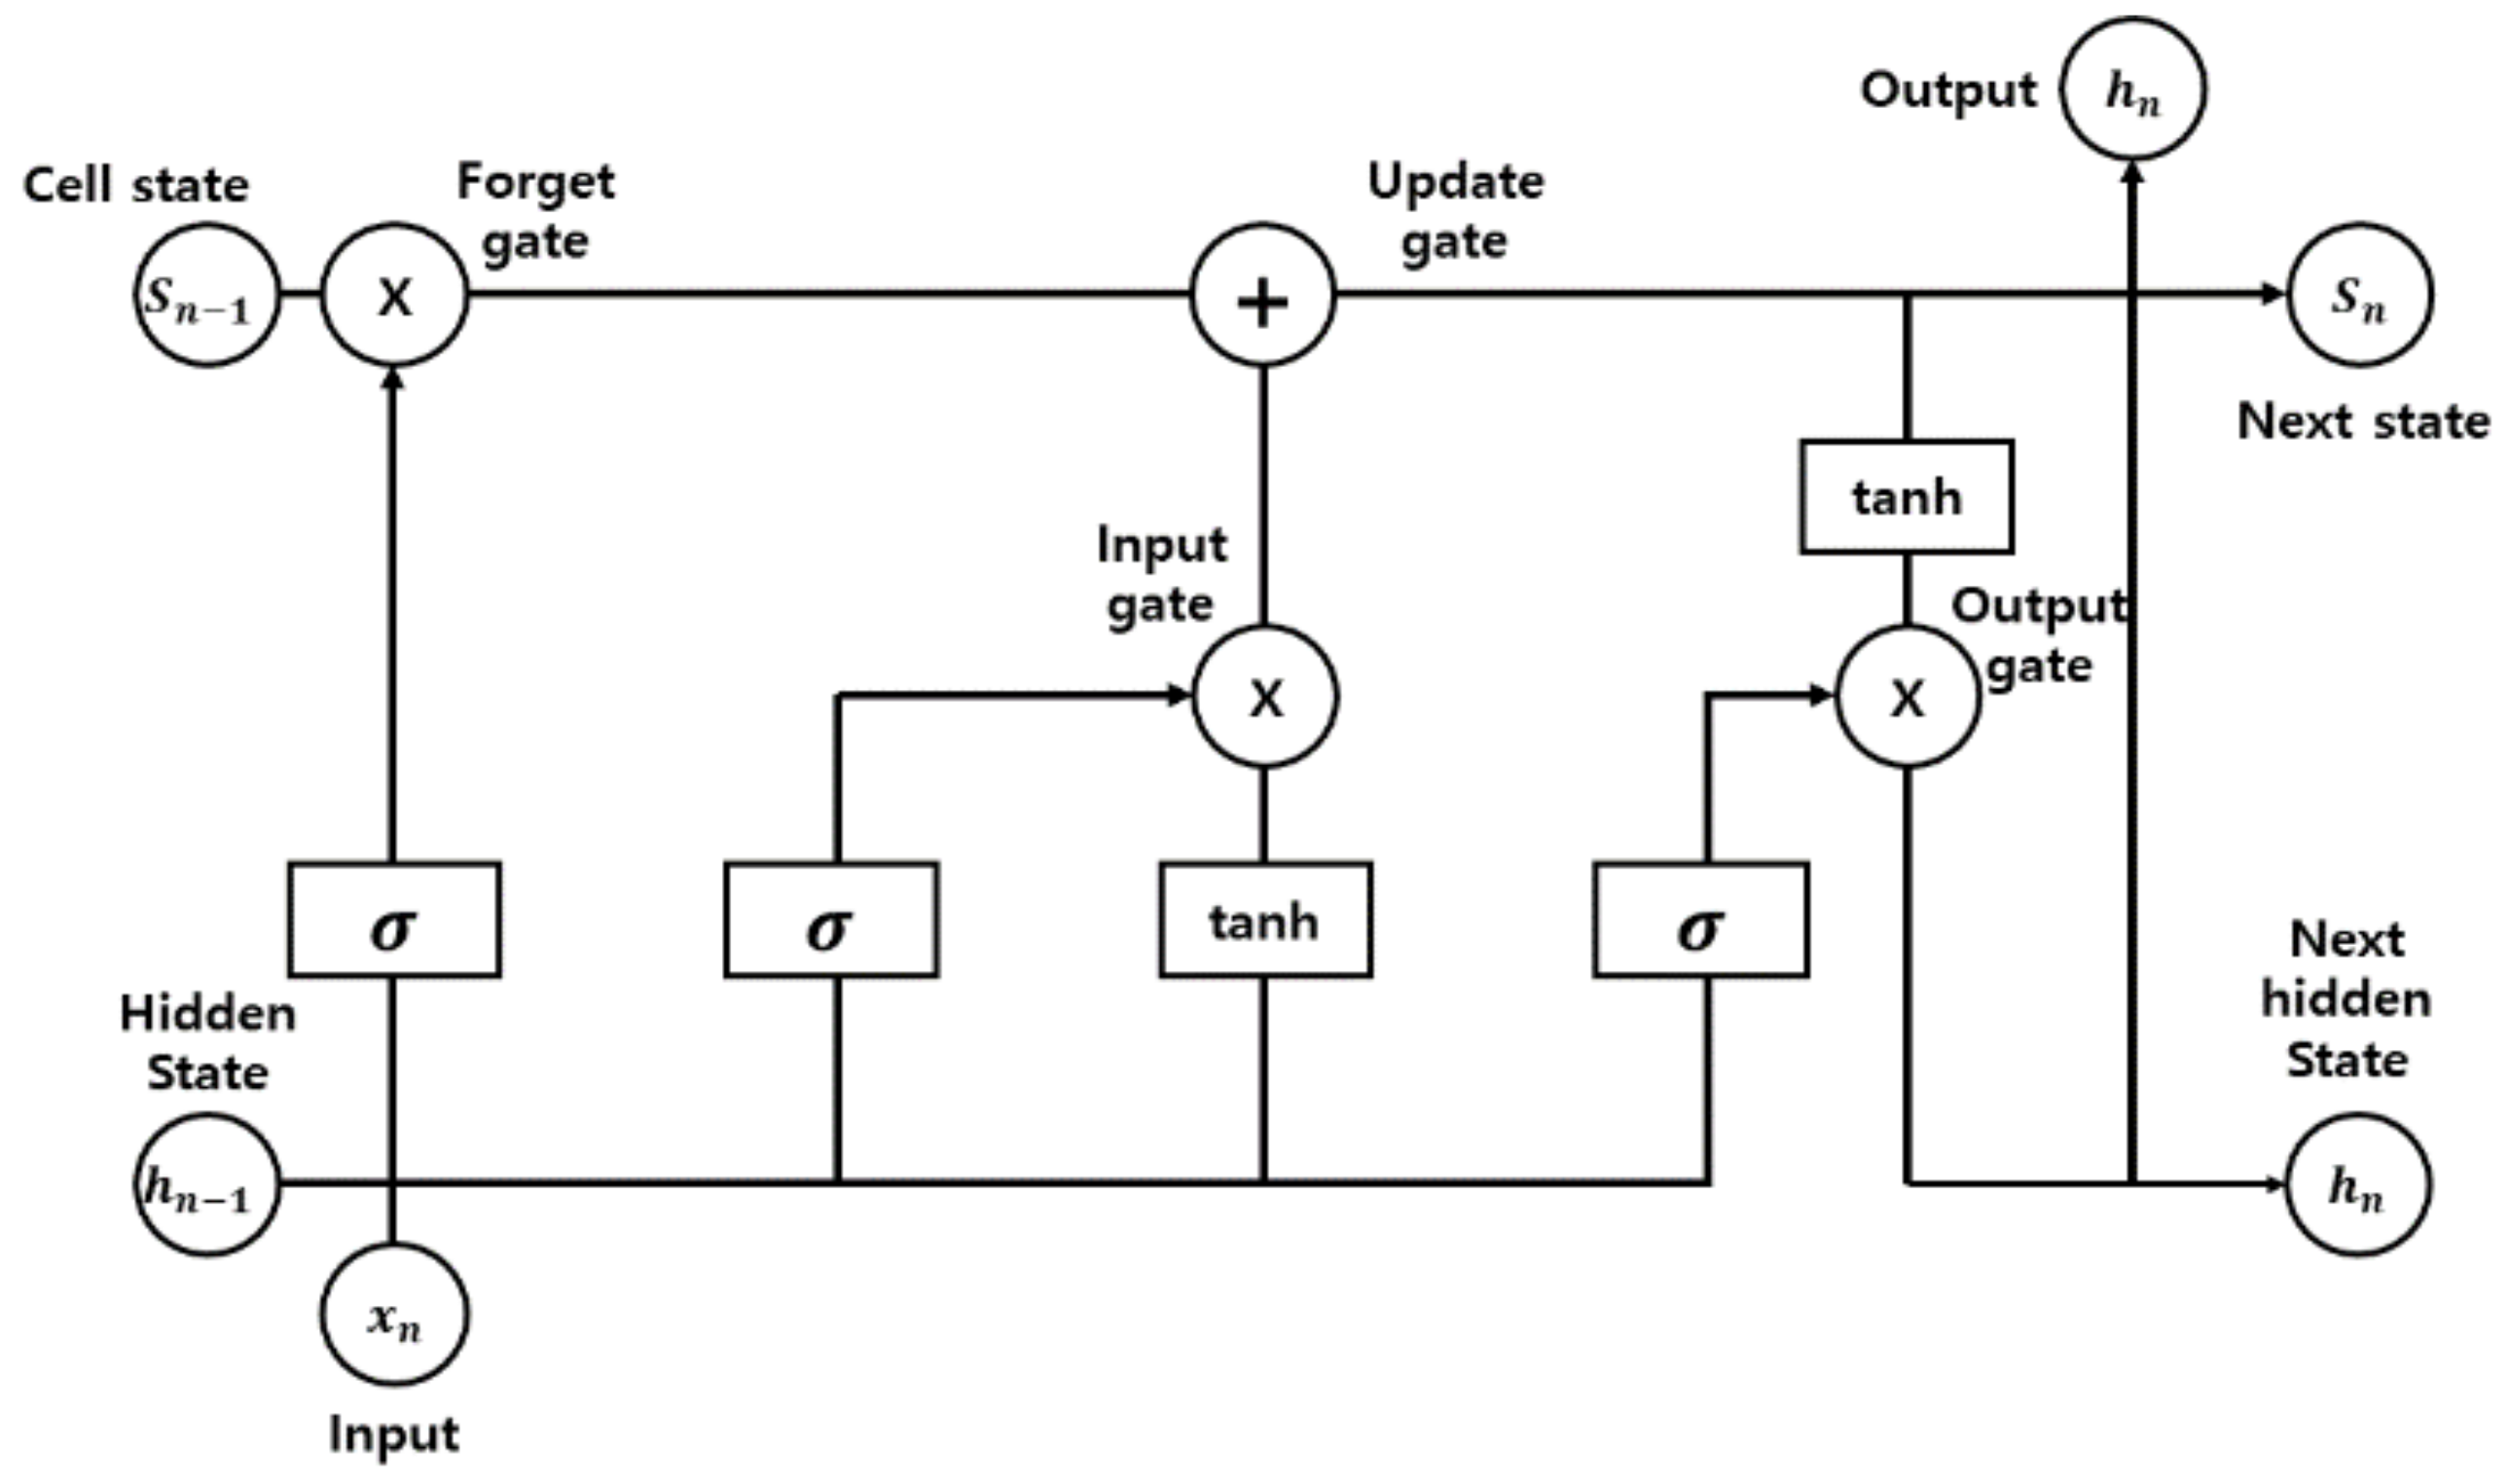
In a recurrent NN (RNN), the recurrent or hidden layer consists of a recurrent cell whose state is affected by both the past state and current input. RNNs are used to learn sequential time series data with temporal dependencies. Moreover, RNNs have a problem with learning long-term dependencies. LSTM models were devised to solve this problem. LSTM is a structure in which a cell state is added to the hidden layer of an RNN. LSTM stores past and current information through a cell and controls the weight of information by adding three gates: input, output, and forget [34]. The LSTM structure is shown in Figure 5.
An LSTM is a computed mapping between the input and output sequences, calculated by the following equations:
Step 1. Forget gate
f t = σ W f h t 1 , x t + b f
Step 2. Input gate
i t = σ W i h t 1 , x t + b i
C ˜ t = t a n h W C h t 1 , x t + b C
Step 3. Cell state update
C t = f t C t 1 + i t   C ˜ t
Step 4. Output gate
o t = σ W o h t 1 , x t + b o
h t = o t tanh C t ,
where h t 1 is the past parameter, x t   is the current input parameter, W is weight, b is the bias, f t is the value of the forget gate, i t and C ˜ t are the values calculated using the sigmoid function and the activation function, respectively, C t is the value updated in the cell state, o t is the value of the output gate, and h t is the output.

3. Experiment and Results

3.1. Experiment Setup

Experiments were conducted using lithium polymer batteries of the specifications shown in Table 2. The experiment process was as follows. First, a battery charged to 2.4 V was discharged using a power supply until it reached 0 A with a voltage of 4.2 V. The SOC of the battery at that time was defined as 100%. After charging was complete, we let the battery rest at room temperature for 1 h. Afterward, the battery was placed in a 40 °C chamber and exposed to high temperatures for 8 h. Then, the battery was completely discharged with a 1.3 A constant current. This state was defined as SOC 0%, and this process was defined as 1 cycle of the experiment. The battery data used for learning were used for a total of 10 cycles of data. The test used 6 cycles of battery data.
The experimental environment for the lithium battery simulation is shown in Figure 6. Figure 6-① shows the electronic load (replaced with the power supply when charging), Figure 6-② shows the battery system (battery, current and voltage sensor, and microcontroller unit to communicate with the PC), and Figure 6-③ shows the PC and serial communication with a battery system to receive battery voltage and current data and monitor the battery SOH.
When the capacity of the battery reached 80% of the rated capacity, the battery was defined as faulty. Therefore, we assumed that the state of the battery changed when the current capacity of the battery decreased by 10% from the original rated capacity. When the capacity reached 100–90% of the rated capacity, it was defined as a normal state. When the capacity reached 90–80%, it was defined as a warning state. When the capacity was less than 80%, it was defined as a fault state. If the SOH is an estimate of the current capacity, the remaining useful life (RUL) is an assessment of the remaining life. The RUL prediction provides reliability and safety for long-term use of systems [35].
Figure 7a shows the battery discharge voltage data used for learning. In Figure 7a, patterns 1–5 were learned in a normal state, patterns 6 and 7 were learned in a warning state, and patterns 8–10 were learned in a fault state.
Figure 7b shows the RUL of the battery. The RUL of the battery was obtained by calculating the current obtained from the current sensor in the experimental equipment. The ampere counting method has the advantage of being able to calculate the battery’s capacity easily; however, it can output incorrect results depending on the battery operating time owing to an error in the ADC offset of the current sensor. Therefore, in the proposed method, the SOH was diagnosed using a model that learned the patterns of the discharge voltage and the battery RUL was used to label one of the normal, warning, and fault states according to the defined criteria of each pattern.
In Figure 8, patterns 1 and 2 depict the normal state with an SOH of 90% or more, patterns 3 and 4 depict the warning state with an SOH close to 80%, and patterns 5 and 6 are for the fault state with an SOH less than 80%.

3.2. SOC Estimation Based on the SOH Result

3.2.1. Structure of SOH Diagnosis Using MNN

To proceed with the proposed method, first, we diagnosed the SOH of a lithium battery. An MNN model was used as an NN model for the SOH diagnosis of the lithium battery; Figure 9 shows the structure of the MNN model used for SOH diagnosis. The MNN model for the SOH diagnosis was in a 3600-256-256-3 MNN structure. The network used Adam as the learning method, each hidden layer used ReLU as the activation function, and the output layer used softmax.

3.2.2. Structure of SOC Estimation Using a NN Model Bank

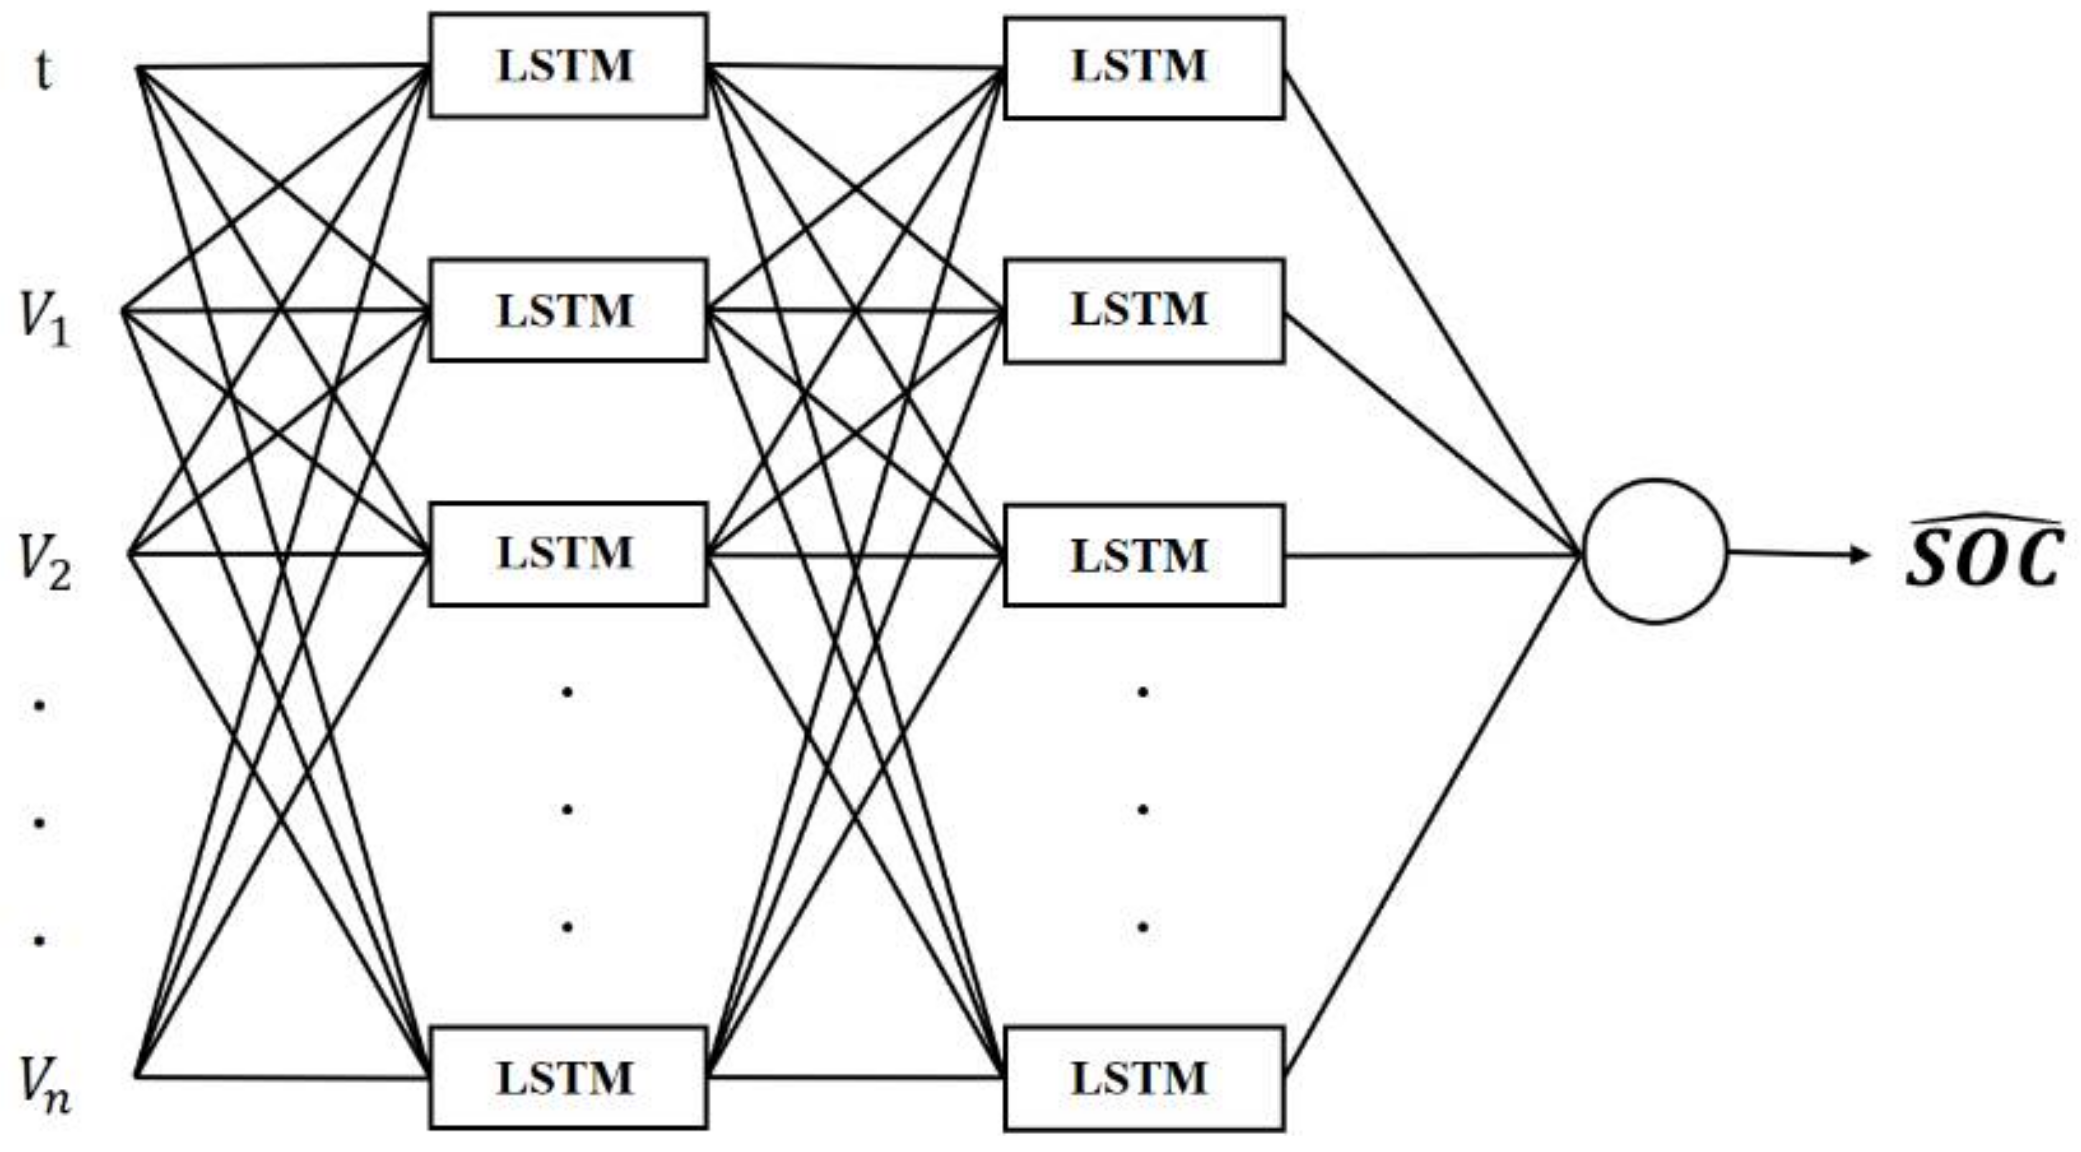
MNN and LSTM were used to estimate the SOC. In addition, to compare the SOC estimation performance according to the difference in the number of input parameters, the number of inputs of voltage parameters was changed to one, two, four, and six. The operating time t and voltage were used as input parameters. The MNN and LSTM used for estimation are shown in Figure 10 and Figure 11, respectively.
The MNN models for SOC estimation were in an N (number of set voltage parameters) + 1-150-100-1 MNN structure. The network used Adam as the learning method, and each hidden layer used ReLU as the activation function.
The LSTM models for the SOC estimation are in an N (number of set voltage parameters) + 1-100-50-1 LSTM structure. The network used Adam as the learning method, and each hidden layer used the sigmoid function as the activation function.
Each error rate was calculated using the mean absolute error (MAE), given by
M A E = 1 n i = 1 n y i y ^ ,
where n is the total number of parameters, y is the target value, and y ^ is the estimated value.

3.2.3. Comparison of the Proposed and General Methods

The experimental results are as follows. Table 3 shows the results of the SOH diagnostic model. Table 4, Table 5, Table 6 and Table 7 show the SOC estimation results of the MNN or LSTM model using the proposed method according to the SOH diagnosis result and the SOC estimation results using only the MNN or LSTM model. In addition, Table 4, Table 5, Table 6 and Table 7 show the results for one, two, four, and six voltage input parameters.
Table 3 shows the SOH diagnostic results of testing. The proposed system classified patterns 1 and 2 as normal states, patterns 3 and 4 as caution states, and patterns 5 and 6 as fault states. From the results, the proposed SOH system diagnosed the battery status using its SOH data very well.
Table 4 shows the SOC estimation result of testing when one voltage parameter was input. As a result of the estimation, the average errors were 1.18% and 2.1% in the proposed method using LSTM and the proposed method using MNN, respectively. The SOC estimation results using only LSTM and only MNN showed average errors of 3.96% and 4.07%, respectively, indicating that the SOC estimation performance of the proposed method using LSTM was the best with one the voltage parameter.
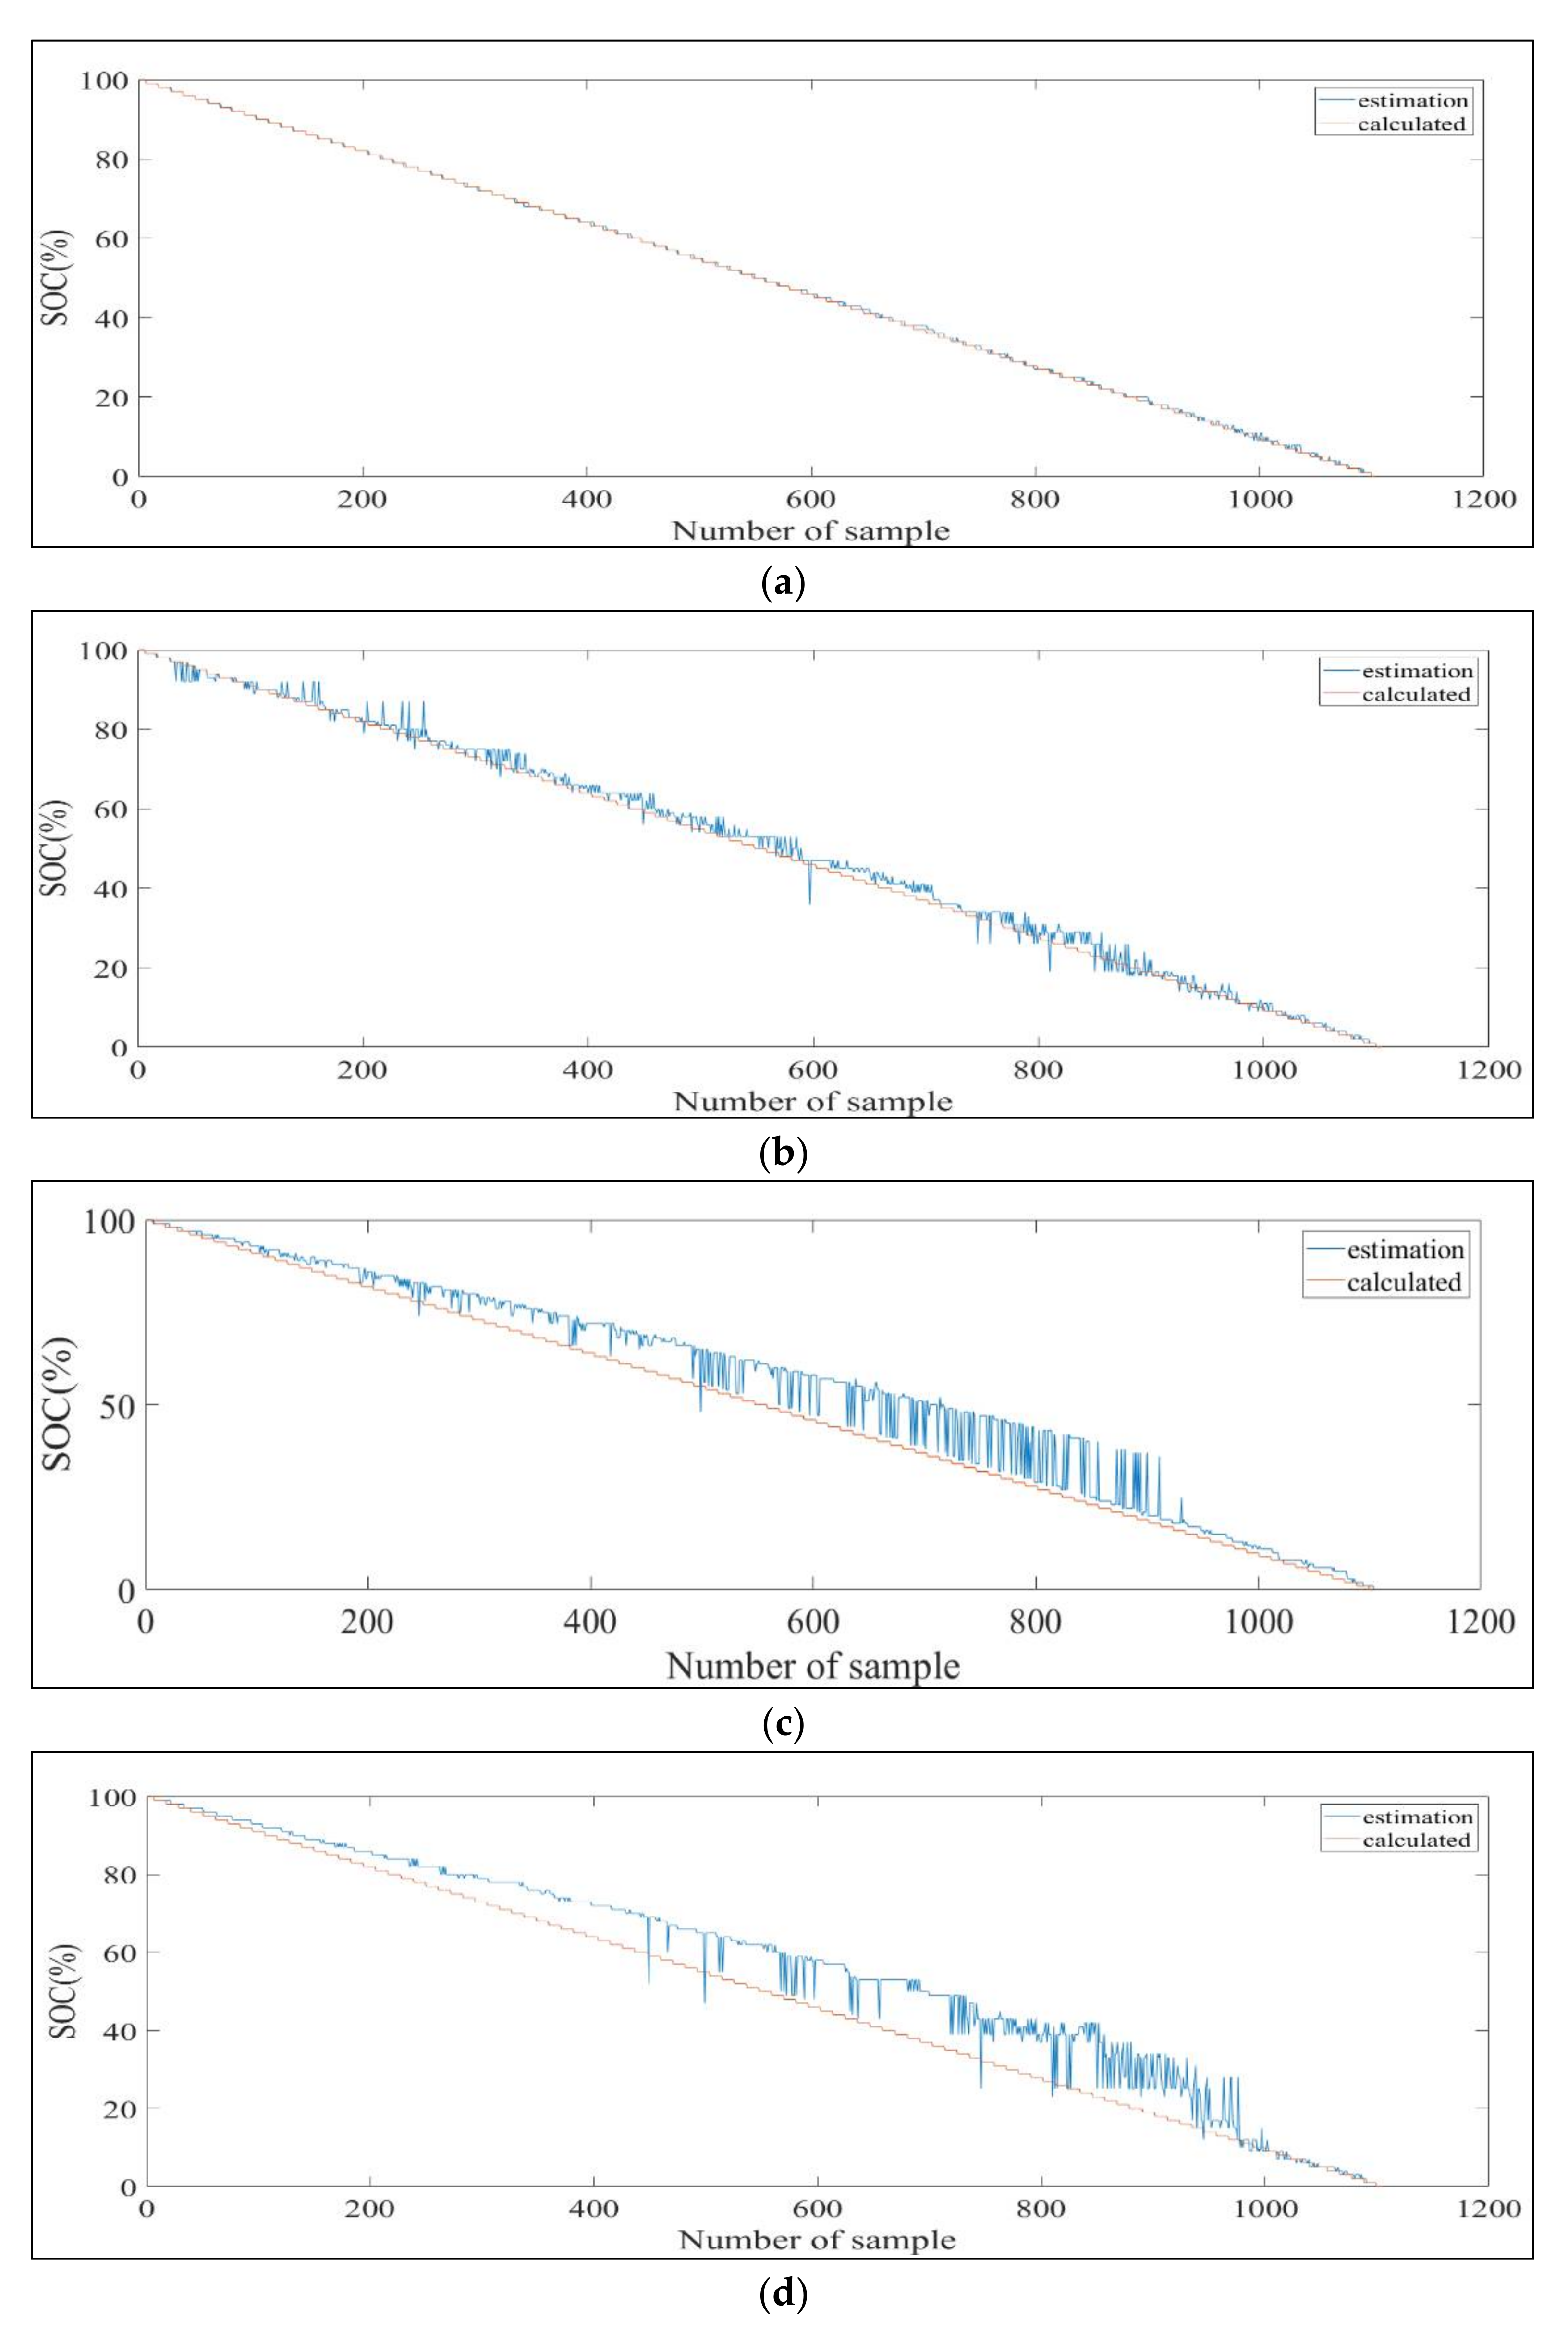
Table 5 shows the SOC estimation result when two voltage parameters were input. The proposed method using LSTM and the proposed method using MNN showed average errors of 0.58% and 1.12%, respectively, and only LSTM and only MNN showed average errors of 3.88% and 4.11%, respectively. Even when there were two voltage parameters, the proposed method using LSTM showed the best SOC estimation performance, and the error of the other patterns except for pattern 4 was less than 1%, showing the best performance.
Table 6 shows the SOC estimation result when four voltage parameters were input. The proposed method using LSTM and the proposed method using MNN showed average errors of 0.92% and 0.973%, respectively, and only LSTM and only MNN showed average errors of 3.98% and 4.01%, respectively. Even when there were four voltage parameters, the proposed method using LSTM showed the best SOC estimation performance, but it can be seen that the performance was worse than when two voltage parameters were used.
Table 7 shows the SOC estimation result when six voltage parameters were input. The proposed method using LSTM and the proposed method using MNN showed average errors of 0.975% and 1.09%, respectively, and only LSTM and only MNN showed average errors of 4.02% and 4.03%, respectively. Even when there were six voltage parameters, the proposed method using LSTM showed the best SOC estimation performance, but the performance was worse than when two voltage parameters were used.
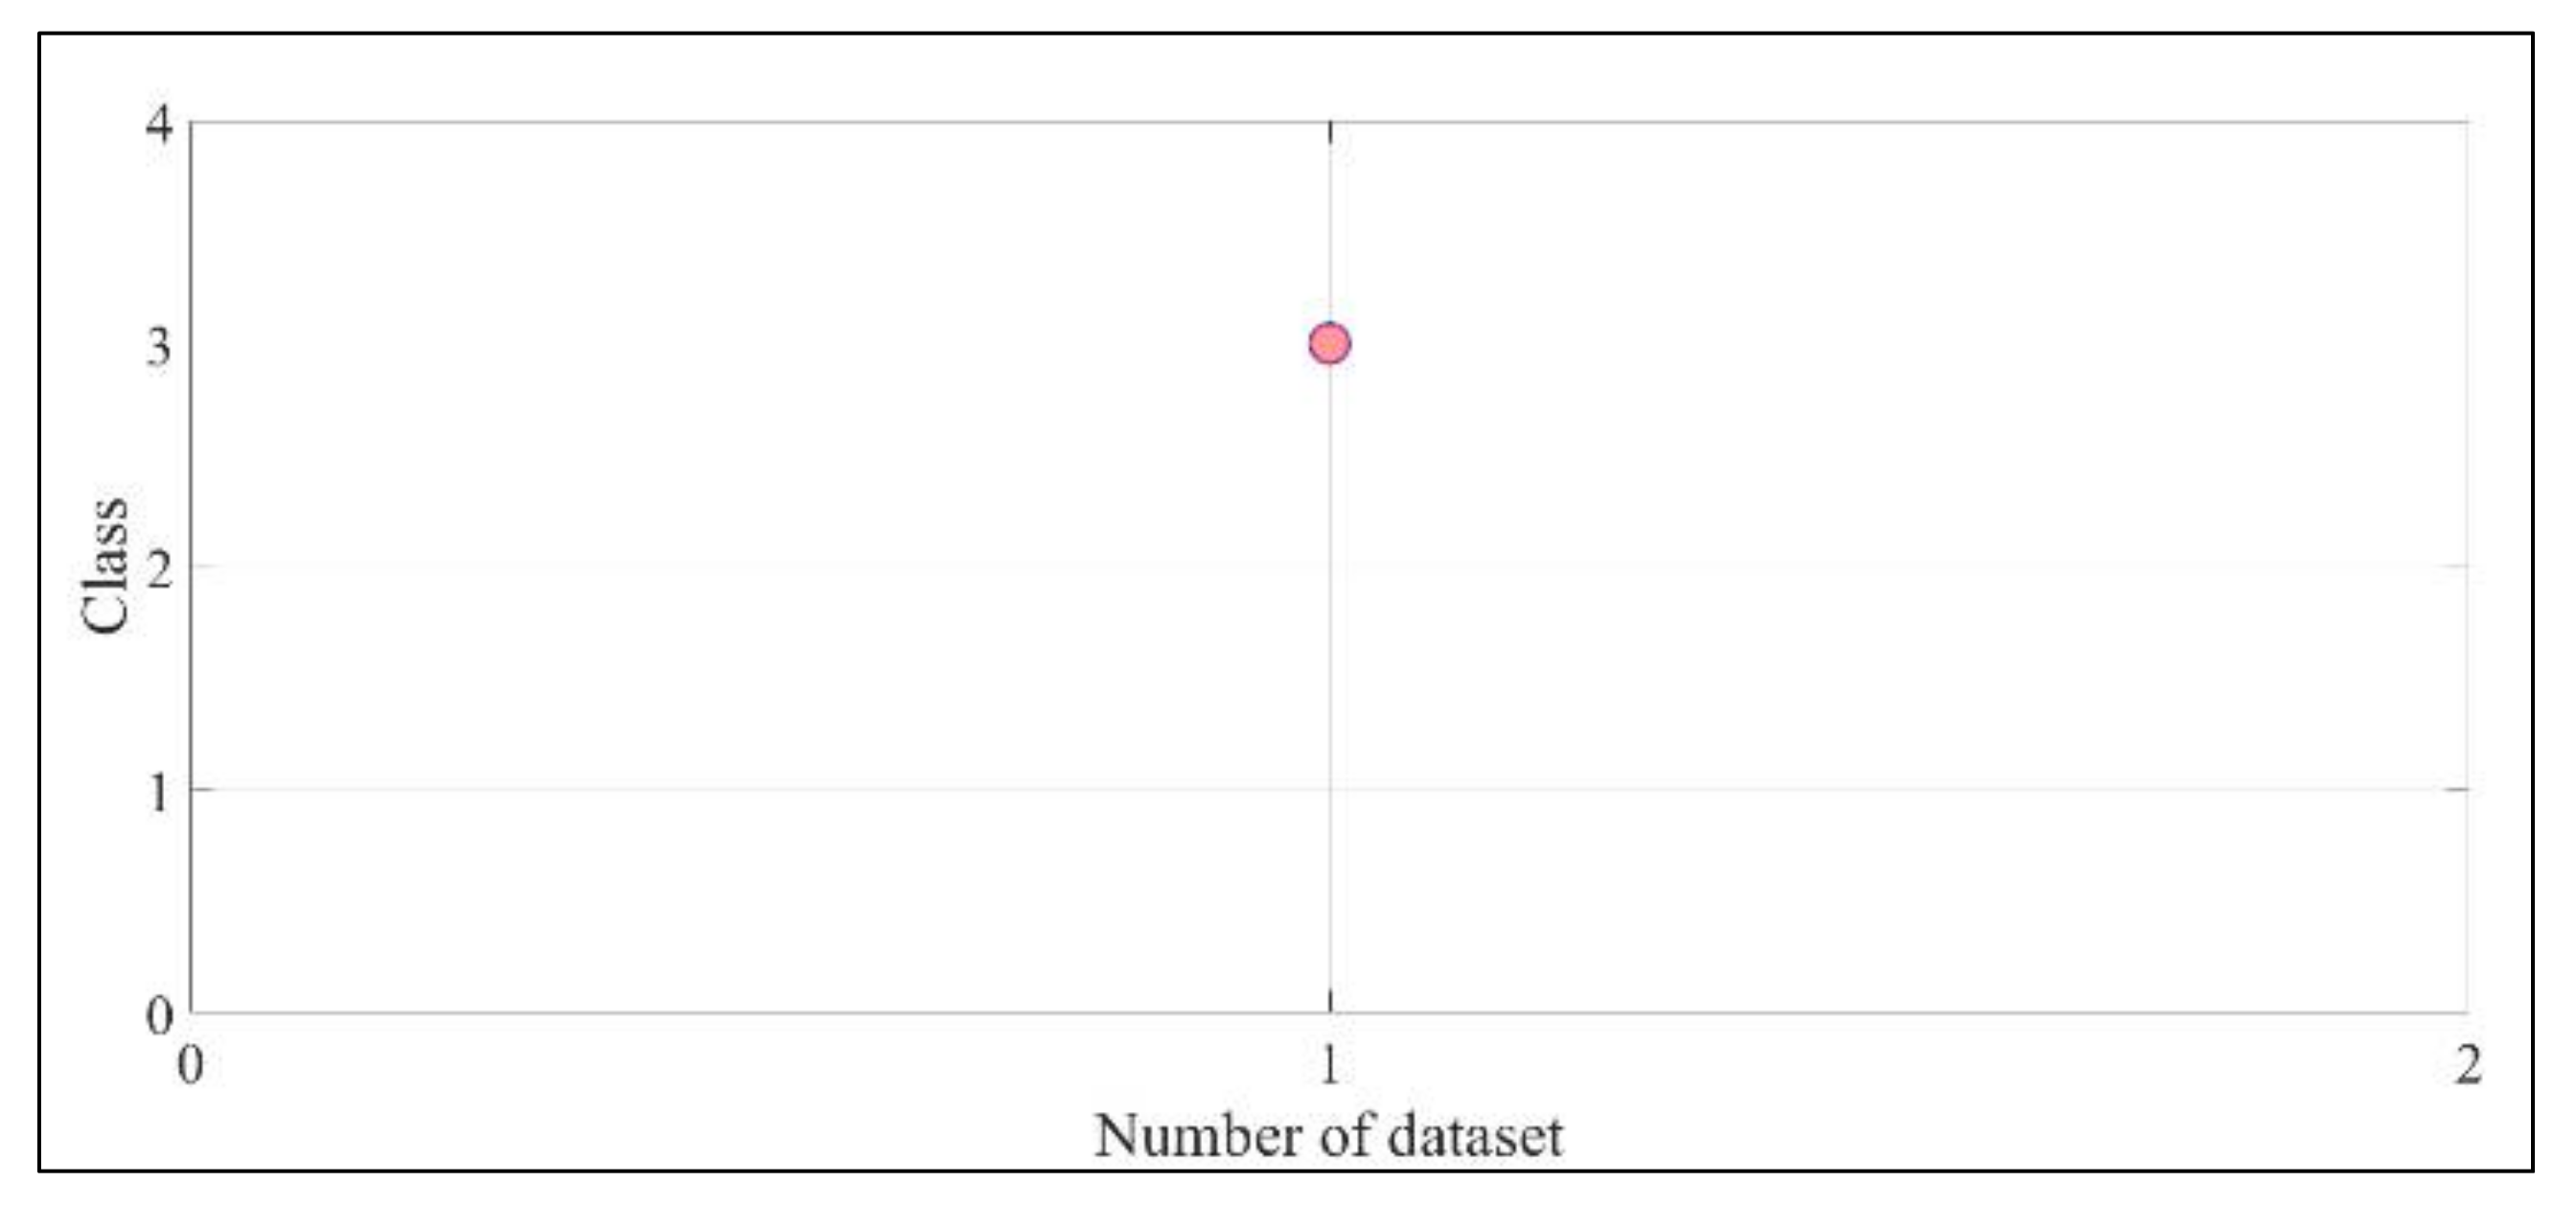
Figure 12 and Figure 13 show graphs of the SOH diagnosis and SOC estimation results of pattern 6, those from the test datain Table 3 and Table 5, respectively. Through this, it was shown that the proposed method using the LSTM model using two voltage parameters performed the most accurate diagnosis and estimation.
According to Chemali et al. [13], the SOC of a lithium battery was estimated using the LSTM model and obtained the SOC estimation MAE of 0.6%. From these results, the best performance of our proposed method’s MAE is 0.58%. So, our proposed method was better than that of the presented study.
According to Alejandro Gismero et al. [23], the SOC of a lithium battery was estimated using coulomb counting and OCV and obtained the SOC estimation MAE within 3%. These results show that the performance of our proposed method is better than that of the presented study.
We compared the performance of our proposed model with two studies [13,23]. The comparison confirms that the proposed model performs well.

4. Conclusions

In this study, we proposed an SOC estimation method based on the SOH diagnosis using NNs. The proposed method used four NNs. One NN was used for SOH diagnosis using MNN. The remaining three NNs were configured as NN model banks, and the SOC was estimated using MNN or LSTM. Each of the three NN model banks was defined as a normal NN model, a caution NN model, or a fault NN model according to the learned data after learning the normal, caution, and fault data groups of the lithium battery. Then, one of the three NN models was selected according to the result of the SOH diagnosis model and the SOC estimation result was output. Moreover, full cycle battery discharge data were needed for the SOH.
To verify the proposed method, data from a lithium battery tested at a high temperature were used. The acquired data were used as input for the SOH diagnosis, and a dataset with one, two, four, and six voltage parameters was used to verify the estimation performance according to the number of input parameters when estimating the SOC.
As a result of the experiment, the proposed method using the LSTM model based on the SOH diagnosis result had the lowest average error of 0.58% when two voltage parameters were used, and the proposed method using the MNN model had the lowest average error of 0.973% when four voltage parameters were used. Using only the LSTM model had the lowest average error of 3.88% when two voltage parameters were used. Using only the MNN models had the lowest average error of 4.01% when four voltage parameters were used. From this result, the highest accuracy was realized when the number of voltage parameters was two or four. In addition, the diagnostic and estimation performance of the proposed method was excellent.
In future research, we plan to apply the proposed method to the real environment to confirm whether it continues to show good performance.

Author Contributions

Formal analysis, J.-H.L. and I.-S.L.; investigation, J.-H.L.; algorithm, J.-H.L. and I.-S.L.; experiment and simulation, J.-H.L.; validation, J.-H.L. and I.-S.L.; writing—original draft preparation, J.-H.L.; writing—review and editing, J.-H.L. and I.-S.L. All authors have read and agreed to the published version of the manuscript.

Funding

This research was funded in part by the BK21 FOUR project funded by the Ministry of Education in Korea, grant number 4199990113966. This research was funded in part by Basic Science Research Program through the National Research Foundation of Korea (NRF) funded by the Ministry of Education, grant number No. 2020R1I1A3A04036615.

Institutional Review Board Statement

Not applicable.

Informed Consent Statement

Not applicable.

Data Availability Statement

Not applicable.

Conflicts of Interest

The authors declare no conflict of interest.

References

  1. Gao, Z.; Chin, C.S.; Chiew, J.H.K.; Jia, J.; Zhang, C. Design and Implementation of a Smart Lithium-Ion Battery System with Real-Time Fault Diagnosis Capability for Electric Vehicles. Energies 2017, 10, 1503. [Google Scholar] [CrossRef]
  2. Cho, T.H.; Hwang, H.R.; Lee, J.H.; Lee, I.S. Comparison of Intelligent Methods of SOC Estimation for Battery of Photovoltaic System. Int. J. Adv. Comput. Sci. Appl. 2018, 9, 49–56. [Google Scholar] [CrossRef]
  3. Park, J.H.; Lee, J.H.; Kim, S.J.; Lee, I.S. Real-Time State of Charge Estimation for Each Cell of Lithium Battery Pack Using Neural Networks. Appl. Sci. 2020, 10, 8644. [Google Scholar] [CrossRef]
  4. Seh, Z.W.; Sun, Y.; Zhang, Q.; Cui, Y. Designing high-energy lithium–sulfur batteries. Chem. Soc. Rev. 2016, 4, 383–391. [Google Scholar] [CrossRef]
  5. Sidhu, A.; Izadian, A.; Anwar, S. Adaptive nonlinear model-based fault diagnosis of Li-ion batteries. IEEE Trans. Ind. Electron. 2014, 62, 1002–1011. [Google Scholar] [CrossRef] [Green Version]
  6. Zhao, Y.; Liu, P.; Wang, Z.; Zhang, L.; Hong, J. Fault and defect diagnosis of battery for electric vehicles based on big data analysis methods. Appl. Energy 2017, 207, 354–362. [Google Scholar] [CrossRef]
  7. Chen, Z.; Xiong, R.; Tian, J.; Shang, X.; Lu, J. Model-based fault diagnosis approach on external short circuit of lithium-ion battery used in electric vehicles. Appl. Energy 2016, 184, 365–374. [Google Scholar] [CrossRef]
  8. How, D.N.; Hannan, M.A.; Lipu, M.H.; Ker, P.J. State of charge estimation for lithium-ion batteries using model-based and data-driven methods: A review. IEEE Access 2019, 7, 136116–136136. [Google Scholar] [CrossRef]
  9. Corno, M.; Bhatt, N.; Savaresi, S.M.; Verhaegen, M. Electrochemical model-based state of charge estimation for Li-ion cells. IEEE Trans. Control Syst. Technol. 2014, 23, 117–127. [Google Scholar] [CrossRef]
  10. He, H.; Xiong, R.; Fan, J. Evaluation of lithium-ion battery equivalent circuit models for state of charge estimation by an experimental approach. Energies 2011, 4, 582–598. [Google Scholar] [CrossRef]
  11. Sun, F.; Hu, X.; Zou, Y.; Li, S. Adaptive unscented Kalman filtering for state of charge estimation of a lithium-ion battery for electric vehicles. Energy 2011, 36, 3531–3540. [Google Scholar] [CrossRef]
  12. Wu, B.; Han, S.; Shin, K.G.; Lu, W. Application of artificial neural networks in design of lithium-ion batteries. J. Power Sources 2018, 395, 128–136. [Google Scholar] [CrossRef]
  13. Chemali, E.; Kollmeyer, P.J.; Preindl, M.; Ahmed, R.; Emadi, A. Long short-term memory networks for accurate state-of-charge estimation of Li-ion batteries. IEEE Trans. Ind. Electron. 2017, 65, 6730–6739. [Google Scholar] [CrossRef]
  14. Shen, P.; Ouyang, M.; Lu, L.; Li, J.; Feng, X. The co-estimation of state of charge, state of health, and state of function for lithium-ion batteries in electric vehicles. IEEE Trans. Veh. Technol. 2017, 67, 92–103. [Google Scholar] [CrossRef]
  15. Barai, A.; Widanage, W.D.; Marco, J.; McGordon, A.; Jennings, P. A study of the open circuit voltage characterization technique and hysteresis assessment of lithium-ion cells. J. Power Sources 2015, 295, 99–107. [Google Scholar] [CrossRef]
  16. Ng, M.F.; Zhao, J.; Yan, Q.; Conduit, G.J.; Seh, Z.W. Predicting the state of charge and health of batteries using data-driven machine learning. Nat. Mach. Intell. 2020, 2, 161–170. [Google Scholar] [CrossRef] [Green Version]
  17. Severson, K.A.; Attia, P.M.; Jin, N.; Perkins, N.; Jiang, B.; Yang, Z.; Chen, M.H.; Aykol, M.; Herring, P.K.; Fraggedakis, D.; et al. Data-driven prediction of battery cycle life before capacity degradation. Nat. Energy 2019, 4, 383–391. [Google Scholar] [CrossRef] [Green Version]
  18. Attia, P.M.; Grover, A.; Jin, N.; Severson, K.A.; Markov, T.M.; Liao, Y.H.; Chen, M.H.; Cheong, B.; Perkins, N.; Yang, Z.; et al. Closed-loop optimization of fast-charging protocols for batteries with machine learning. Nature 2020, 578, 397–402. [Google Scholar] [CrossRef] [Green Version]
  19. Ng, K.S.; Moo, C.S.; Chen, Y.P.; Hsieh, Y.C. Enhanced coulomb counting method for estimating state-of-charge and state-of-health of lithium-ion batteries. Appl. Energy 2009, 89, 1506–1511. [Google Scholar] [CrossRef]
  20. Truchot, C.; Dubarry, M.; Liaw, B.Y. State-of-charge estimation and uncertainty for lithium-ion battery string. Appl. Energy 2014, 119, 218–227. [Google Scholar] [CrossRef]
  21. Hu, X.; Li, S.; Peng, H. A comparative study of equivalent circuit models for Li-ion batteries. J. Power Sources 2012, 198, 359–367. [Google Scholar] [CrossRef]
  22. Lin, C.; Mu, H.; Xiong, R.; Shen, W. A novel multi-model probability battery state of charge estimation approach for electric vehicles using H-infinity algorithm. Appl. Energy 2016, 166, 76–83. [Google Scholar] [CrossRef]
  23. Gismero, A.; Schaltz, E.; Stroe, D.I. Recursive state of charge and state of health estimation method for lithium-ion batteries based on coulomb counting and open circuit voltage. Energies 2020, 13, 1811. [Google Scholar] [CrossRef] [Green Version]
  24. Jang, K.-W.; Chung, G.-B. A SOC Estimation using Kalman Filter for Lithium-Polymer Battery. Trans. Korean Inst. Power Electron. 2012, 17, 222–229. [Google Scholar] [CrossRef] [Green Version]
  25. Chemali, E.; Kollmeyer, P.J.; Preindl, M.; Emadi, A. State-of-charge estimation of Li-ion batteries using deep neural networks: A machine learning approach. J. Power Sources 2018, 400, 242–255. [Google Scholar] [CrossRef]
  26. Zhang, D.; Dey, S.; Perez, H.E.; Moura, S.J. Remaining useful life estimation of lithium-ion batteries based on thermal dynamics. In Proceedings of the 2017 American Control Conference (ACC), Seattle, WA, USA, 24–26 May 2017; pp. 4042–4047. [Google Scholar]
  27. El-Dalahmeh, M.; Al-Greer, M.; El-Dalahmeh, M.A.; Short, M. Time-Frequency Image Analysis and Transfer Learning for Capacity Prediction of Lithium-Ion Batteries. Energies 2020, 13, 5447. [Google Scholar] [CrossRef]
  28. Tang, X.; Wang, Y.; Zou, C.; Yao, K.; Xia, Y.; Gao, F. A novel framework for Lithium-ion battery modeling considering uncertainties of temperature and aging. Energy Convers. Manag. 2019, 180, 162–170. [Google Scholar] [CrossRef]
  29. Wang, D.; Bao, Y.; Shi, J. Online lithium-ion battery internal resistance measurement application in state-of-charge estimation using the extended Kalman filter. Energies 2017, 10, 1284. [Google Scholar] [CrossRef] [Green Version]
  30. Song, C.; Shao, Y.; Song, S.; Peng, S.; Zhou, F.; Chang, C.; Wang, D. Insulation resistance monitoring algorithm for battery pack in electric vehicle based on extended Kalman filtering. Energies 2017, 10, 714. [Google Scholar] [CrossRef]
  31. Hannan, M.A.; Lipu, M.S.H.; Hussain, A.; Saad, M.H.; Ayob, A. Neural network approach for estimating state of charge of lithium-ion battery using backtracking search algorithm. IEEE Access 2018, 6, 10069–10079. [Google Scholar] [CrossRef]
  32. Kingma, D.P.; Ba, J. Adam: A method for stochastic optimization. arXiv 2014, arXiv:1412.6980. [Google Scholar]
  33. Chang, Z.; Zhang, Y.; Chen, W. Electricity price prediction based on hybrid model of adam optimized LSTM neural network and wavelet transform. Energy 2019, 187, 115804. [Google Scholar] [CrossRef]
  34. Yu, Y.; Si, X.; Hu, C.; Zhang, J. A review of recurrent neural networks: LSTM cells and network architectures. Neural Comput. 2019, 31, 1235–1270. [Google Scholar] [CrossRef] [PubMed]
  35. Wu, J.; Zhang, C.; Chen, Z. An online method for lithium-ion battery remaining useful life estimation using importance sampling and neural networks. Appl. Energy 2016, 173, 134–140. [Google Scholar] [CrossRef]
Figure 1. Structure of the SOH diagnosis method.
Energies 14 04506 g001
Figure 2. Structure of the proposed method.
Energies 14 04506 g002
Figure 3. Flowchart of the proposed method.
Energies 14 04506 g003
Figure 4. Structure of an MNN.
Energies 14 04506 g004
Figure 5. Structure of an LSTM.
Energies 14 04506 g005
Figure 6. Experimental environment for lithium battery simulation.
Energies 14 04506 g006
Figure 7. (a): Battery discharge data for learning. (b): Graph of battery’s remaining useful life determined using the current sensor in the experimental equipment.
Energies 14 04506 g007
Figure 8. Battery discharge data for testing.
Energies 14 04506 g008
Figure 9. MNN structure for the SOH diagnostic model.
Energies 14 04506 g009
Figure 10. MNN structure for the SOC estimation model.
Energies 14 04506 g010
Figure 11. LSTM structure for the SOC estimation model.
Energies 14 04506 g011
Figure 12. The SOH diagnosis result of pattern 6.
Energies 14 04506 g012
Figure 13. The SOC estimation result of pattern 6 when there were two input voltage parameters: (a); the proposed method using the LSTM result (b); the proposed method using the MNN result (c); only LSTM result (d); only MNN result.
Energies 14 04506 g013
Table 1. Advantages and disadvantages of model-based, data-driven, and coulomb-counter methods.
MethodAdvantagesDisadvantagesExample Model
Model-based
[9,10]
Reliable and accurate
Has universal validity
Requires extensive domain knowledge
Longer development
time
Equivalent circuit model
Electrochemical model
Kalman filter
Data-driven
[11,12,13,14,15,16,17,18]
Shorter development
time
Does not require very much
specialized knowledge.
Requires a large amount of dataNeural network
Deep learning
Look-up table
Coulomb-counter
[19,20]
Simple to implementErrors accumulate over time.Coulomb-counter
Table 2. Battery internal resistance used in the test.
Battery TypeLi-Po Battery
Capacity1.3 Ah
Voltage range2.4–4.28 V
Nominal voltage3.7 V
Table 3. The SOH diagnosis result for the proposed method.
MethodsPattern 1Pattern 2Pattern 3Pattern 4Pattern 5Pattern 6
SOH diagnosis modelnormalnormalcautioncautionfaultfault
Table 4. The SOC estimation error for each model when one voltage parameter was input.
MethodsPattern 1Pattern 2Pattern 3Pattern 4Pattern 5Pattern 6
Proposed method
using LSTM
1.31%0.18%1.59%1.19%1.13%1.68%
Proposed method
using MNN
1.59%0.33%1.09%1.65%1.23%1.55%
Only LSTM 1.96%4.12%2.65%3.19%5.83%6.05%
Only MNN 1.93%4.45%2.18%2.96%6.23%6.67%
Table 5. The SOC estimation error for each model when two voltage parameters were input.
MethodsPattern 1Pattern 2Pattern 3Pattern 4Pattern 5Pattern 6
Proposed method
using LSTM
0.31%0.3%0.95%1.04%0.63%0.24%
Proposed method
using MNN
1.59%0.28%1.48%1.08%0.76%1.57%
Only LSTM 2.27%4.37%2.52%2.94%5.33%5.88%
Only MNN 1.94%4.65%1.73%2.7%6.68%6.96%
Table 6. The SOC estimation error for each model when four voltage parameters were input.
MethodsPattern 1Pattern 2Pattern 3Pattern 4Pattern 5Pattern 6
Proposed method
using LSTM
1.23%0.2%1.3%1.37%0.29%1.1%
Proposed method
using MNN
1.18%0.39%1.03%1.62%0.34%1.28%
Only LSTM 2.35%5.41%2.91%2.81%4.89%5.55%
Only MNN 2.05%5.15%2.07%2.98%5.86%5.99%
Table 7. The SOC estimation error for each model when six voltage parameters were input.
MethodsPattern 1Pattern 2Pattern 3Pattern 4Pattern 5Pattern 6
Proposed method
using LSTM
1.46%0.19%0.88%1.87%0.47%0.99%
Proposed method
using MNN
1.43%0.32%1.47%0.87%0.81%1.21%
Only LSTM 2.53%5.26%2.4%2.8%5.53%5.64%
Only MNN 2%4.81%1.47%2.66%6.56%6.65%
Publisher’s Note: MDPI stays neutral with regard to jurisdictional claims in published maps and institutional affiliations.