Article

Climate Adaptive Design Index for the Built Environment (CADI-BE): An Assessment System of the Adaptive Capacity to Urban Temperatures Increase

Department of Architecture (DiARC), University of Naples Federico II, Via Toledo 402, 80134 Naples, Italy
*
Author to whom correspondence should be addressed.
Energies 2021, 14(15), 4630; https://doi.org/10.3390/en14154630
Submission received: 16 June 2021 / Revised: 23 July 2021 / Accepted: 27 July 2021 / Published: 30 July 2021
(This article belongs to the Section B1: Energy and Climate Change)

Abstract

:
In a scenario in which the climate changes subject urban centres and large cities to high levels of environmental vulnerability and criticality underway, it is evident the need to define operational and straightforward decision-making tools capable of prefiguring and verifying the effectiveness of urban transformation climate-adaptive regeneration processes. The Climate Adaptive Design Index for the Built Environment (CADI-BE) tool has been developed to assess the adaptive capacity and level of performance of open urban spaces to the stresses due to the increase in global average temperatures. The repercussions of these phenomena cause the occurrence of heatwaves and the urban heat island effect (UHI), bringing out the inability of cities to cope with changes in the climate, making urban open spaces unlivable and no longer the ideal habitat for everyday life and social interactions.

Graphical Abstract

1. Introduction

The evidence relating to the ongoing climate crisis is driving world institutions to adopt effective strategies to ensure the development of mitigation actions and the achievement of adaptation conditions to environmental phenomena related to climate change. Furthermore, the impact of climate change, especially in the urban environment, is one of the central themes in local policies and visions for developing future cities [1].
In particular, heatwaves and extreme rain events have significant implications for life in the city and the environment. Suppose it is considered the increase in their frequency, duration and intensity in the future as expected by the IPCC [2,3,4]. In that case, it is evident that appropriate methodologies need to be developed to support redesign processes of built urban space [5].
Within this framework, the research sector is required to be able to develop tools to support decision-making processes for climate-oriented urban design through the definition of innovative and appropriate methodologies. Hence, climate adaptation and ecological turn, which represent cross-cutting themes to numerous objectives set out in the United Nations Agenda 2030, outline the objectives and actions to define a key strategy to fight climate change and increase environmental sustainability, as set out in Goal 13 [6]. In addition, it is among the priority objectives of the main European plans and programs for the sustainable development of territories, including the Green Deal [7] and the EU Biodiversity Strategy [8], to promote actions concerning the reduction of emissions of greenhouse agents, the fight against the impacts of climate change, the reduction of degradation phenomena and environmental pollution, the improvement of well-being and health conditions, social cohesion and, at the same, time to promote the integration of adaptation criteria into local and sectoral planning processes and instruments.
In February 2021, the EU adopted the new Adaptation Strategy, setting its target for achieving resilience to climate change by 2050, setting as objectives making adaptation smarter, more systemic, swifter, and by stepping up international action, to reduce climate-related risk and close the climate protection gap by improving adaptation strategies and plans, promoting local resilience, integrating climate resilience in national fiscal frameworks [9], issues immediately taken into account by Italy in the drafting of the Piano Nazionale di Ripresa e Resilienza (PNRR), which provides the allocation of 59.47 billion euro for the green revolution and ecological transition, the circular economy, sustainable agriculture, renewable energy, sustainable mobility, ecological efficiency, upgrading of buildings and protection of the territory [10], and which recalls the previous provisions of the Strategia Nazionale di Adattamento ai Cambiamenti Climatici [11].
Indeed, the definition of design actions at the local scale becomes relevant, which can lead to a significant update of technical policies, also through the search for new tools suitable for the development of climate oriented urban design, to support local authorities and designers through interdisciplinary approaches to integrate knowledge, methods and instruments from the different disciplinary sectors of research [12,13,14,15,16].
For local institutions, the challenge is represented by the concrete possibility of adopting site-specific actions on local territories to guarantee the desired improvement in response to the different phenomena that can arise in the urban environment, such as extreme rainfall and pluvial flooding and, in particular, the increase in temperatures in urban contexts where the intensification of summer heatwaves and the occurrence of the “urban heat island” effect is more noticeable [17,18,19,20,21,22,23,24].
Currently, thanks to the growing development of technological innovation processes, the expert use of dedicated ICT tools guarantees the dissemination of techniques and instruments aimed at investigating the phenomena and environmental interaction factors capable of contributing to the variation of the urban microclimate and, at the same time, to the definition of strategic actions suitable for improving well-being conditions in urban open spaces, with particular attention to ongoing climate changes [25,26,27].
In this perspective, this study proposes the definition of a multi-criteria evaluation system capable of assessing the adaptive capacity of urban open spaces to rising temperatures. The proposal, entitled “Climate Adaptive Design Index for the Built Environment -CADI-BE”, is based on an experimental procedure for urban open spaces’ technical and performance control and climate-adaptive design actions in rising urban temperature conditions. The CADI-BE approach has been developed taking into account the methodologies defined during two research experiences carried out within the Department of Architecture (DiARC) of the University of Naples Federico II: the applied research agreement with the Municipality of Naples for the “Sustainable redevelopment of public spaces as part of the Great Project of the Historic Centre of Naples, UNESCO site” [28,29,30] and the Project “METROPOLIS-MEtodologie e Tecnologie integRate e sOstenibili Per l’adattamento e La sIcurezza di Sistemi urbani” [14,31,32], implemented within the company STRESS S.c.a.r.l. on research funding program “PON Ricerca e Competitività 2007–2013”, which focused its application case on the East area of Naples, aimed at defining strategies and design solutions capable of ensuring the improvement of the environmental performance of the urban open space.
The paper in Section 2 describes the articulation of the methodological approach; Section 3 and its sub-sections present the application to the case study selected as an experimental area in the city of Naples; Section 4 describes the discussion of the results and the conclusions.

2. Materials and Methods

The definition of the reliability of the CADI-BE assessment system of the adaptive capacity of urban open spaces to rising temperatures has been structured through the identification of a workflow of phases and actions, to carry out a technical-performance verification on urban open spaces, identify urban regeneration design actions able to respond adequately to the rise of temperatures, and planning appropriate strategies to climate change adaptation [33,34,35]. In particular, the workflow has been articulated into the following main steps (Figure 1):
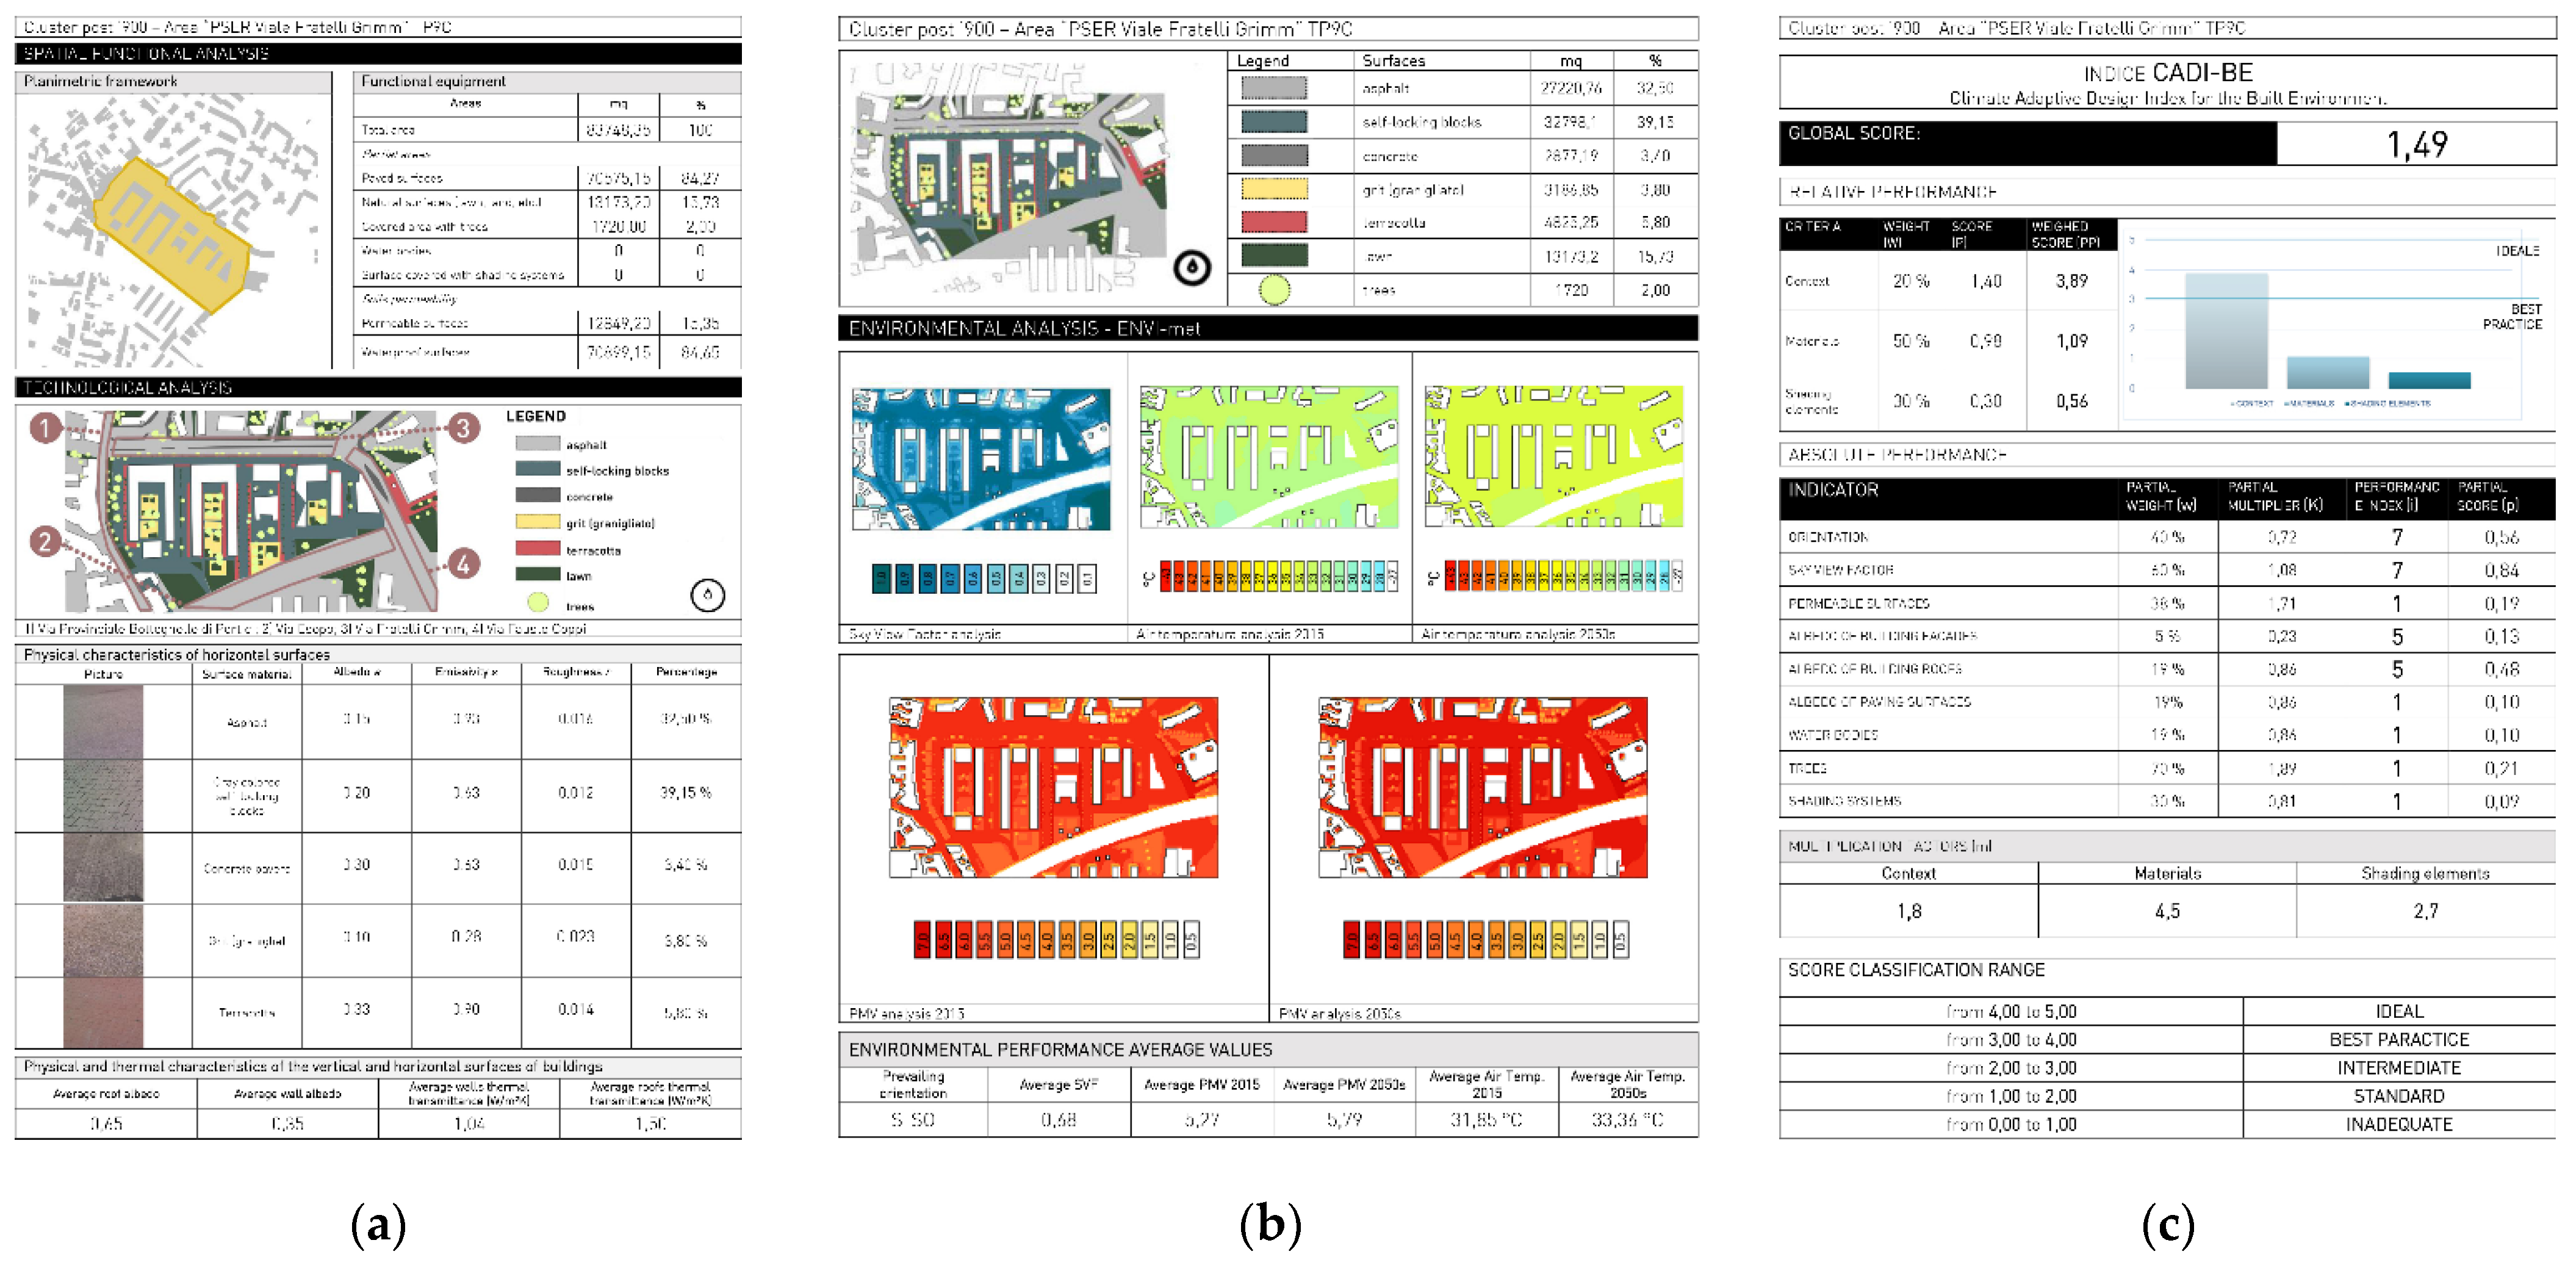
  • Step 1—Knowledge, Data collection and Criticality Analysis: the knowledge and data collection of the urban, environmental and technological systems of open spaces and technical-performance criticalities, through the acquisition of information by the direct and indirect survey for the definition of spatial characteristics, the technical analysis of materials and stratifications of horizontal surfaces of urban space and the classification of physical and thermal characteristics (albedo, emissivity, roughness, thermal conductivity), technological analysis of the horizontal and vertical surfaces of context buildings (albedo, thermal conductivity), the survey of plant elements (green areas, trees, etc.), the acquisition of data on technological and environmental performance by the survey of specific parameters (air temperature, wind speed, surface temperatures, etc.), and the acquisition of climate data [26,36,37];
  • Step 2—Analysis and Data Processing: the analysis of environmental and microclimatic performance, through simulation with ICT tools used to analyse the environmental conditions of air temperatures, relative humidity, surface temperatures, natural ventilation, Sky View Factor-SVF [38] and the analysis of comfort perception through the Predicted Mean Vote-PMV index [39], both about the detection period, July and August 2015, as the current climate scenario about the 2000s thirty years (1990–2019) [40] and for medium-term scenarios of climate projections compared to the 2050s thirty years (2040–2069), obtained by climate file morphing operations [41,42,43,44];
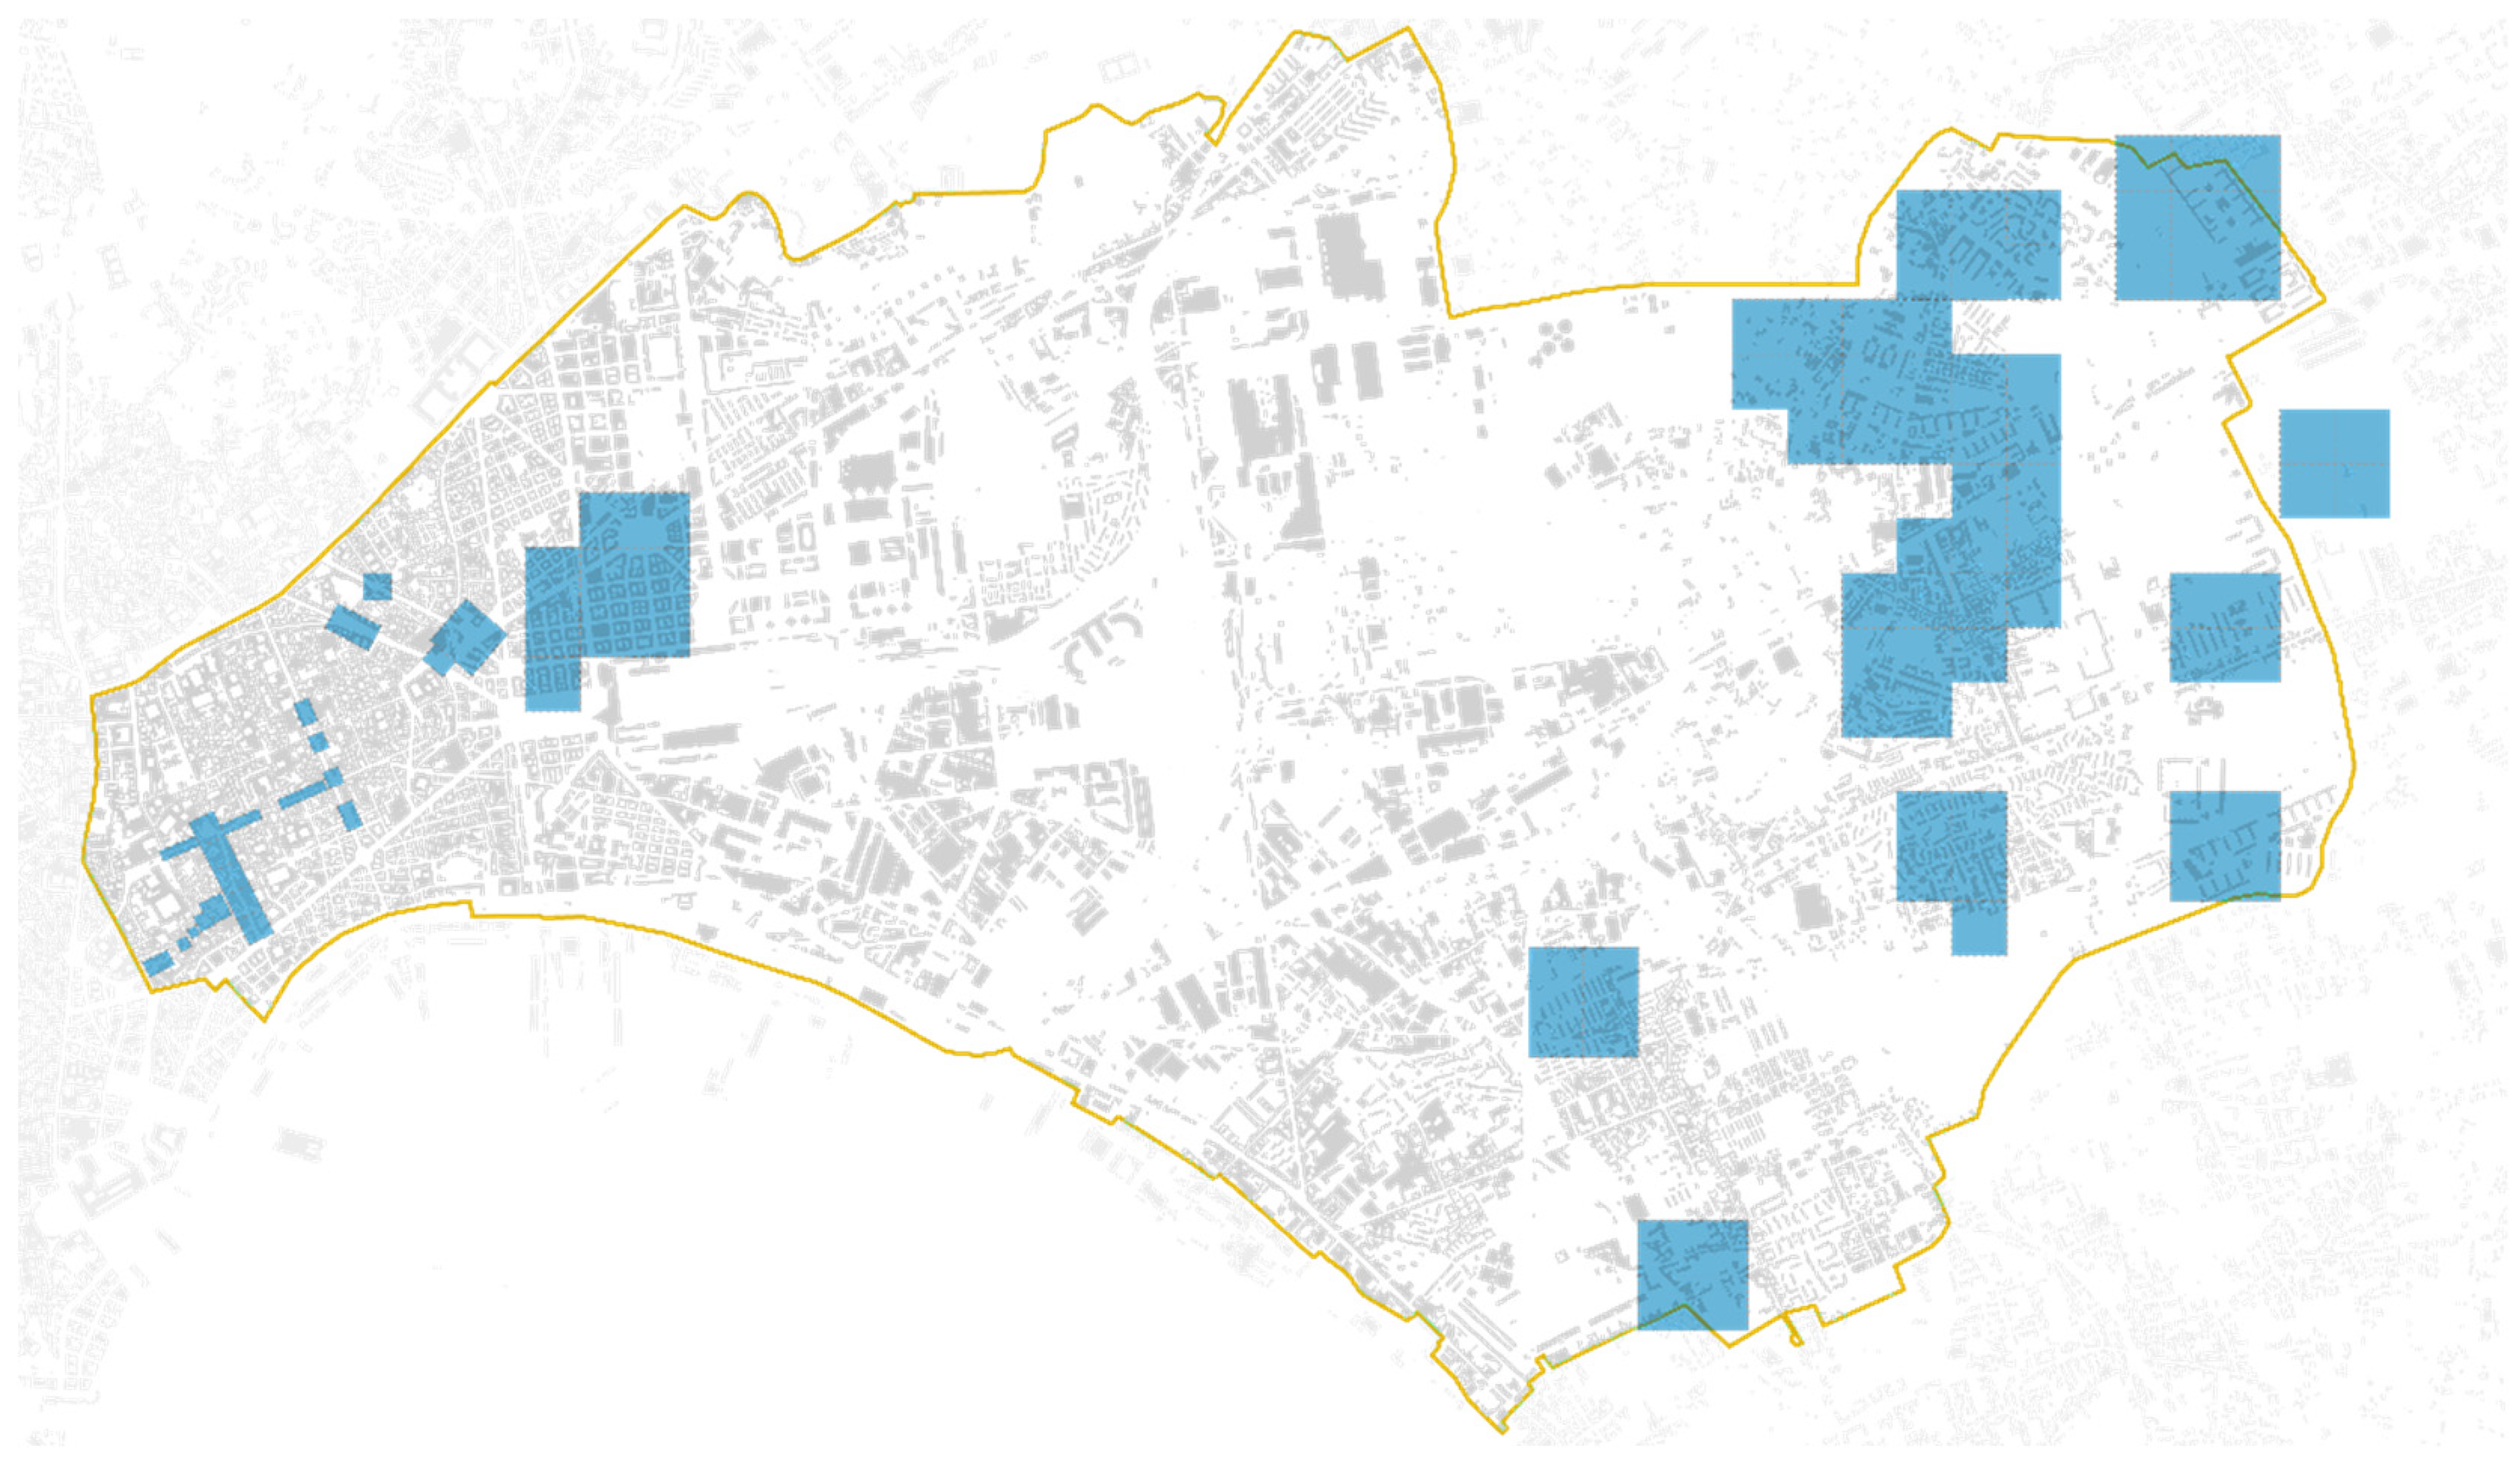
  • Step 3—Sampling, Classification and Comparison: the sampling, classification and comparison of the components of the urban, environmental and technological systems of open spaces, through the determination of homogeneous urban patterns [45], for the classification of recurrent and representative urban elements such as public spaces (streets, squares and open spaces), collective and relevance space (courtyards, courtyards, relevance spaces), the sampling of types of recurring urban elements for the comparison of thermal well-being performance and the selection of areas to operate software simulation testing;
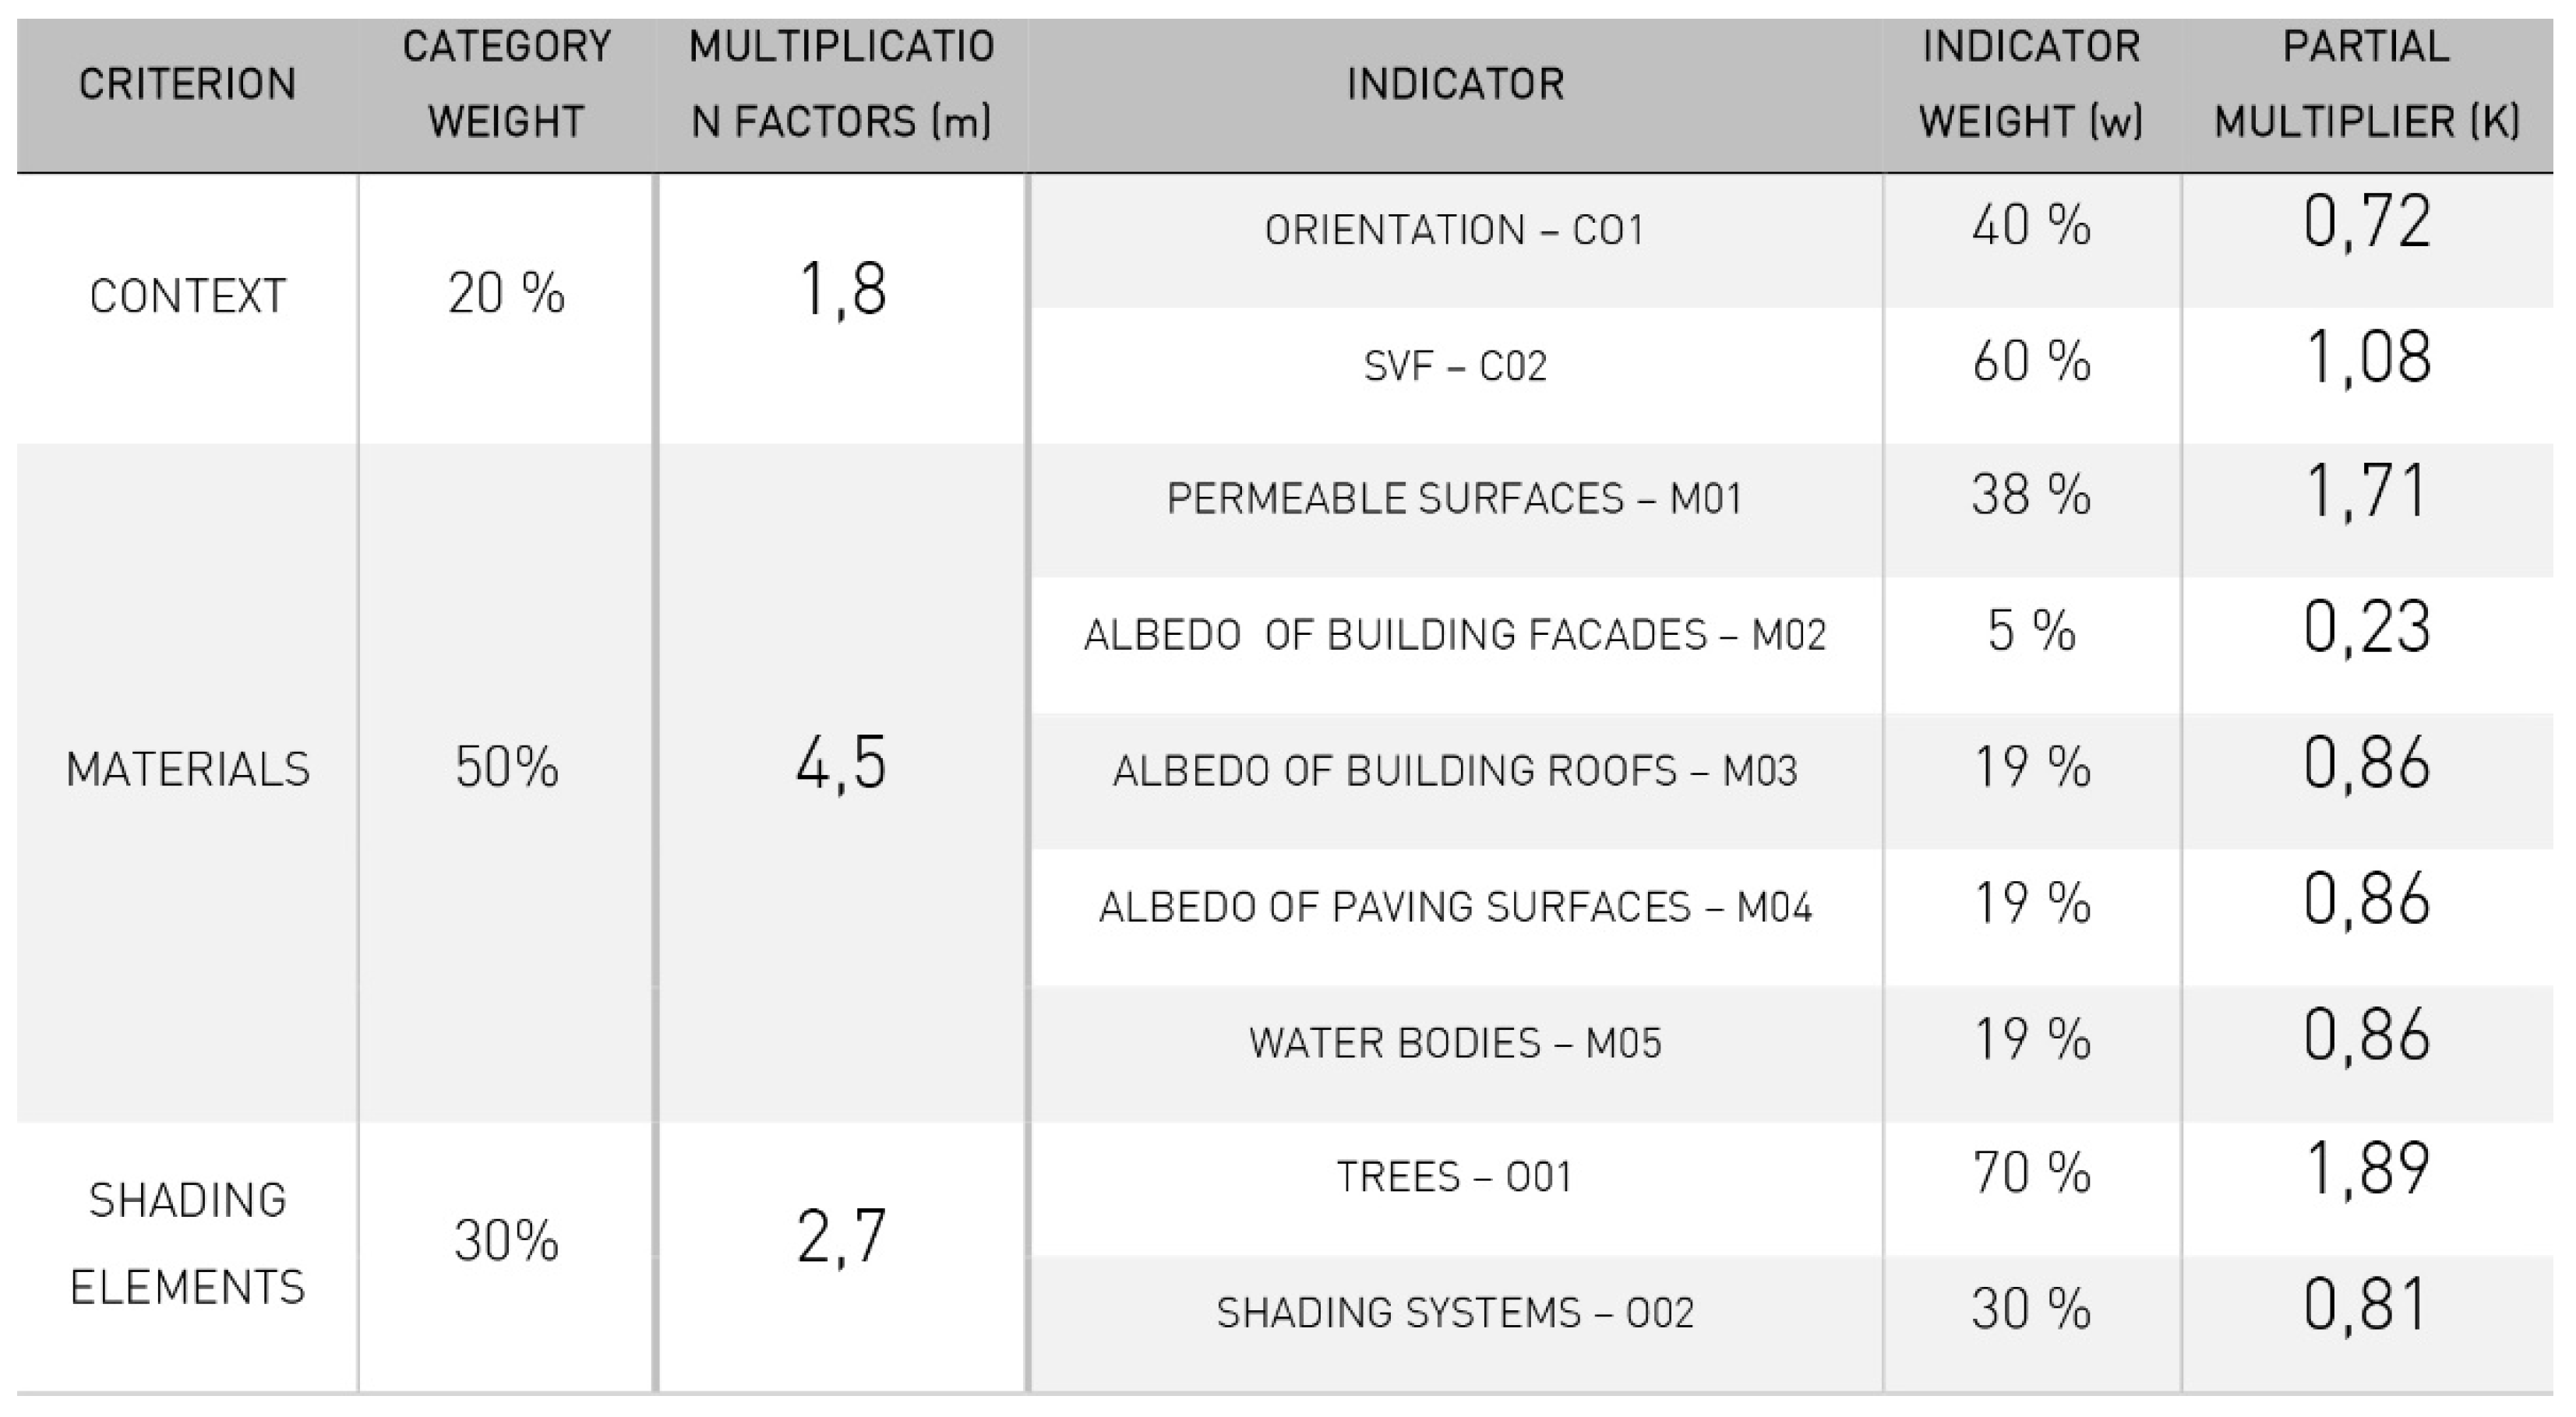
  • Step 4—Multi-Criteria Assessment: the multi-criteria evaluation of the adaptive capacity of urban open spaces to rising temperatures, starting from the parameterisation of the morphological and physical characteristics of open space about environmental comfort for the definition of morphological-environmental indicators; the multi-criteria analysis applied to sample areas allows to understand the significance of the characteristics that affect the urban microclimate, to verify the attribution of weights to the analysis criteria, to structure the simulation of the performance of the and climate-adaptive design solutions, to identify a ranking of technical-design solutions;
  • Step 5—Design Verification: design verification, which includes testing, meta-design and decision-making processing to determine the contribution that each technical-design solution can guarantee to improve outdoor thermal comfort in different application urban patterns and open space, identifying climate-adaptive design solutions that can be considered site-specific best practices [35,46,47,48,49,50].
The methodological phases allow acquiring the data and elements necessary for the evaluation of microclimatic, environmental and morphological context conditions to undertake an analytical-cognitive process that, through the use of ICT tools, allow to define the performance of urban open spaces and assess the relative adaptive response, both in the current and future scenarios as a response to climate changes.
The workflow application allows identifying the characteristics that make the use of open spaces critical during the summer season and to determine a site-specific intervention strategy by introducing new components within the physical system of open spaces to guarantee better performance in terms of perceived environmental comfort users.

3. The Case Study and the Application of the Workflow

The workflow has been applied in the area of the city of Naples, Italy, defined by the union of the study areas of the Great UNESCO Project for the Historic Centre of Naples and the Eastern Area of Naples established in METROPOLIS—MEtodologie e Tecnologie integRate e sOstenibili Per l’adattamentO e La sIcurezza di Sistemi urbani.
The study area, of ca. 24.45 sq. km (Figure 2), identifies the opportunity of obtaining a sample a comprehensive case study of types of urban open spaces, representative of the typological and morphological variation of the different urban patterns present within the city of Naples, such as the Ancient Centre and the Historical Centre, characterised by narrow streets and terrace-courts or pavilion-courts building types built before the 20th century; the city of expansion, characterised by medium-sized streets and terrace-courts buildings; the completion city characterised by large-sized streets and terrace, tower or pavilion buildings built during the 1970s and 1980s.

3.1. Knowledge of the Urban System

Based on the assumptions and similar requirements that emerged within the METROPOLIS Project [14,31,32,51], a classification of morphologically homogeneous urban patterns has been carried out for the study [45], which made it possible to divide the territory into:
  • pre-nineteenth century pattern, which includes a substantial part of the Historic Centre of Naples and is characterised by buildings built mainly until the end of the 18th century and consisting of narrow streets, squares and small open spaces;
  • nineteenth-century pattern, which includes a part in the north of the Historic Centre of Naples and is characterised by buildings built mainly in the 19th century, whose streets and squares are larger sized than those of the Ancient Centre;
  • twentieth-century pattern, which includes a part to the south and east of the Historic Centre of Naples and is characterised by buildings built mainly in the 19th and 20th centuries, whose streets and squares are equal in size and/or greater than those of nineteenth-century pattern;
  • modern pattern, which includes construction interventions until the middle of the 20th century which consists of the districts of Barra, San Giovanni a Teduccio and Ponticelli, characterised by the presence of medium-sized streets, private spaces and small collective spaces;
  • contemporary pattern, which includes construction interventions from the middle of the 20th century to the present, which includes the area of the Centro Direzionale, the residential construction of the neighbourhoods of Poggioreale, Gianturco, Barra, San Giovanni a Teduccio and Ponticelli, with a prevalence of streets and collective spaces wide.
The classification excluded tertiary and productive areas, focusing on those city patterns at prevalent residential use. The chosen patterns are characterised by different morphological, environmental and technological characteristics for open spaces and buildings, with heterogeneous microclimatic characteristics in terms of environmental performance compared to the increase in urban temperatures (Figure 3).
Following the acquisition of cartography and photographic analysis procedures, in addition to the comparison with satellite images, a campaign was conducted for the detection of environmental conditions within the study area (Appendix A, Figure A1 and Figure A2), by using a FLIR E40 BX thermal camera (Appendix A, Figure A3, Figure A4 and Figure A5), an EXTECH AN200 thermo-anemometer and a FLIR MR77 IR thermometer, to obtain data on the physical and thermal properties and the performance of the materials that cover the horizontal and vertical surfaces of the analysed open spaces. These operations were conducted during particularly hot days of the summer season and defined both based on an assessment of the trend of temperature peaks relative to the previous days and concerning the temperature data recorded in earlier years. The points taken into account for the survey were identified within homogeneous urban areas as representative of heterogeneity of morphological characteristics, used materials, and vegetation presence.
The collected data for the Historic Centre, of which an extract is in Table 1, describe how in a context where there is a reduced variation of urban materials, the performance of the spaces is mainly influenced by the dimensional characteristics of the ratios between the width of the roads and the height of the buildings (H/W) [52], then by the SVF [38] and the orientation. For the Eastern Area of Naples (Table 2), where the spaces are more dilated and where the dimensional relationships between the height and width are wider for open spaces or roads, and the presence of trees and shaded areas are reduced, along with poorly reflective and waterproof surfaces, the overall environmental performance is inadequate to cope with the extreme conditions that occur during the summer season.
The data collected made it possible to carry out an accurate survey of the materials used such as those covers the horizontal surfaces within the studied areas, to associate the relative physical and thermal properties, such as albedo, emissivity, roughness and thermal conductivity, as well as to identify the stratigraphies of the soil profiles of the city of Naples pavings.
The database of information and properties of materials, together with the survey of microclimatic factors, constitute the information to be included as input in the ENVI-met 3.1 microclimatic simulation software [53]. Collected data will be used to verify the reliability of the software’s response to give back environmental data similar to the real ones. The database also includes information on the environmental conditions of the squares, streets, open spaces, courts and pertinence spaces within the study area, describing a significant sample of the Neapolitan urban complexity, and allowing to define a first relational characterisation between the morphological-environmental factors and the technological characteristics of the surfaces of the urban spaces of the study area which extends, east to west, from the Ancient Centre to the Ponticelli district (Figure 4).

3.2. ICT Tools Environmental Analyses

The knowledge phase of the study areas has been followed by a simulation phase of environmental and microclimatic conditions, carried out by the use of ENVI-met 3.1 [44], through a process developed in different steps aimed at finding the critical issues of the built urban space, which includes:
  • three-dimensional modelling of all study areas (buildings, paving, vegetation, etc.);
  • software configuration with input data (climate data, buildings characteristics, etc.);
  • the execution of simulations at the 2000s and 2050s scenarios;
  • reading and extracting the results of air temperature, surface temperature, relative humidity, ventilation and people perceived comfort (PMV).
These operations allowed obtaining comparable results between the different study areas, which will be used to evaluate the performance and adaptability degree of open spaces to the increase in urban temperatures.
To obtain simulations that were closer to real conditions, it was necessary to customise the basic libraries of ENVI-met 3.1, through the input of the materials and soil profiles detected within the urban patterns of the study area, as well as information related to the detected plant elements (3/5/7/12 m trees and 6/10/15 cm grass).
Following the three-dimensional restitution of the areas identified for the simulation and the configuration of the climatic and environmental parameters of a representative day of the temperatures summer trend for the city of Naples, simulations were carried out starting from 6:00 am until 12:00 pm, the peak time of solar radiation. In addition, it was necessary to set the parameters for the definition of the degree of perceived environmental comfort (PMV) [54,55], through the input of the physical characteristics of an individual considered standard (man, height 175 cm, 75 kg, 35 years old) and in the action of walking (walking at a speed of 0.83 m/s, energy exchange with the environment of 116 W/m2, clothing conforming to the summer season with corresponding clothing factor of 0.5).
A similar process was conducted for the 2050s future scenario simulations, for which only air temperature, relative humidity and specific humidity data were modified. The data for the future scenarios were obtained through the comparison with the climate data acquired through morphing operations of the EPW files of the city of Naples [40,41,56], with the “CCWorldWeatherGen” tool, which is based on the HadCM3 A2 model of climate change of the IPCC Third Assessment Report [41,42].

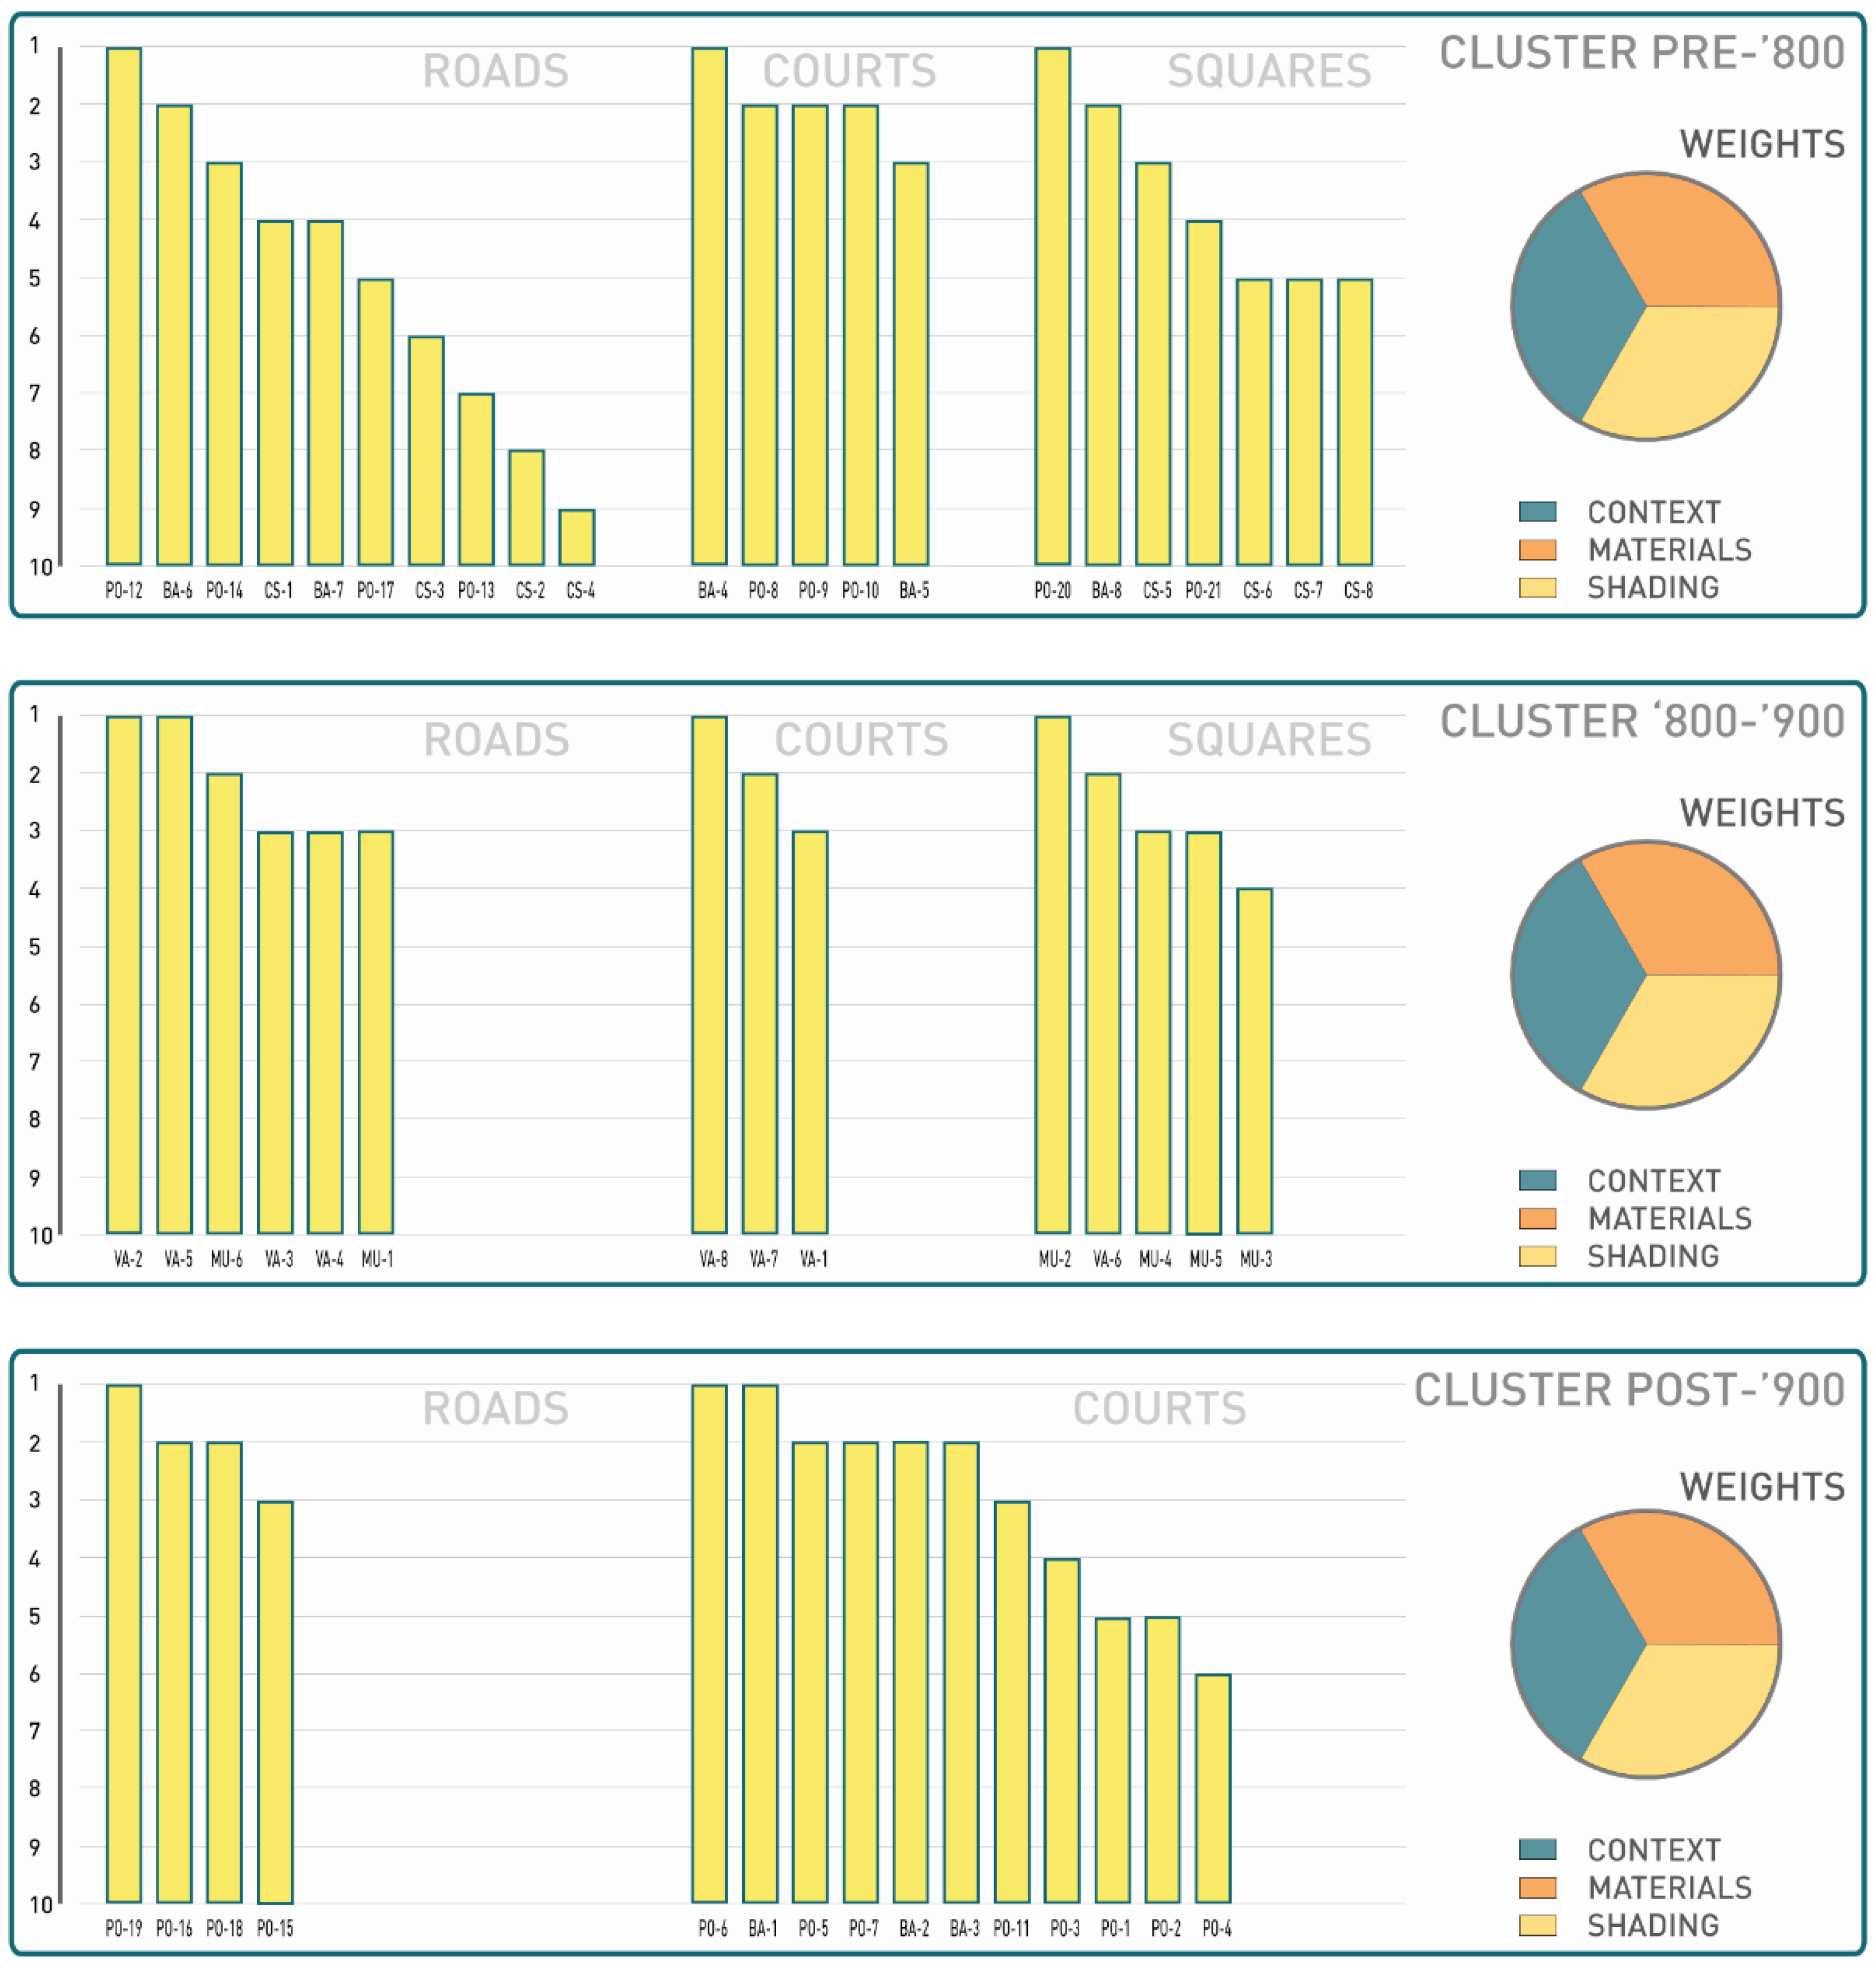
3.3. Sampling, Classification and Comparison of Urban Elements

At the end of the microclimatic simulation phases, it was chosen to extract and compare only PMV values as a reference parameter to determine those factors that most affect the performance behaviour of physical elements and define urban open spaces.
The result of this operation is the typological classification of the behaviour of the open spaces of the urban patterns of the study area through the aggregation of a representative number of urban open spaces classifiable in streets, squares and open spaces, courts, courtyards and spaces of relevance (Figure 5).
For each open space identified and analysed, the corresponding average values of PMV for the 2000s and 2050s were extracted. The values obtained show that the performance differences can be read using as comparison parameters the total area expressed in square meters, the orientation of the urban space concerning the direction of the prevailing winds in the summer season [57], the average SVF value of the analysed urban space, the average albedo of the paved surfaces, the ratio of waterproof-permeable surfaces, the average albedo of the surrounding building’s facade, the average roofs albedo of the open space surrounding buildings, the percentage of trees relative to the entire considered area, the percentage of water bodies compared to the entire considered area, the percentage of shading systems concerning the entire considered area (Appendix A, Figure A6).
For each sampled area, a unique code has been assigned, useful to recognise the area of the city in which it is located: CS for the areas of the Historic Centre, MU for the areas beyond the old walls of the centre, VA for the Vasto district, BA for the Barra district, PO for the Ponticelli district.
The comparison and reading of the results of thermal well-being performance (PMV) in the summer season to the 2000s and 2050s revealed differences and similarities to the performance of the spaces in the different patterns. In this way, it was possible to further group in clusters the analysed open spaces, based on the similarities related to microclimatic performance found:
  • the cluster of post ’900 patterns, consisting of contemporary and modern patterns;
  • the cluster of ’800–’900 patterns, consisting of 19th-century and 18th-century patterns;
  • the cluster of pre ’800 patterns, composed of the pre-nineteenth-century patterns of the Historic Centre, the Barra district, the Ponticelli district and the San Giovanni a Teduccio district.
The three clusters make it possible to describe the characteristics of the urban pattern and to classify them, taking into account the specificities detected.

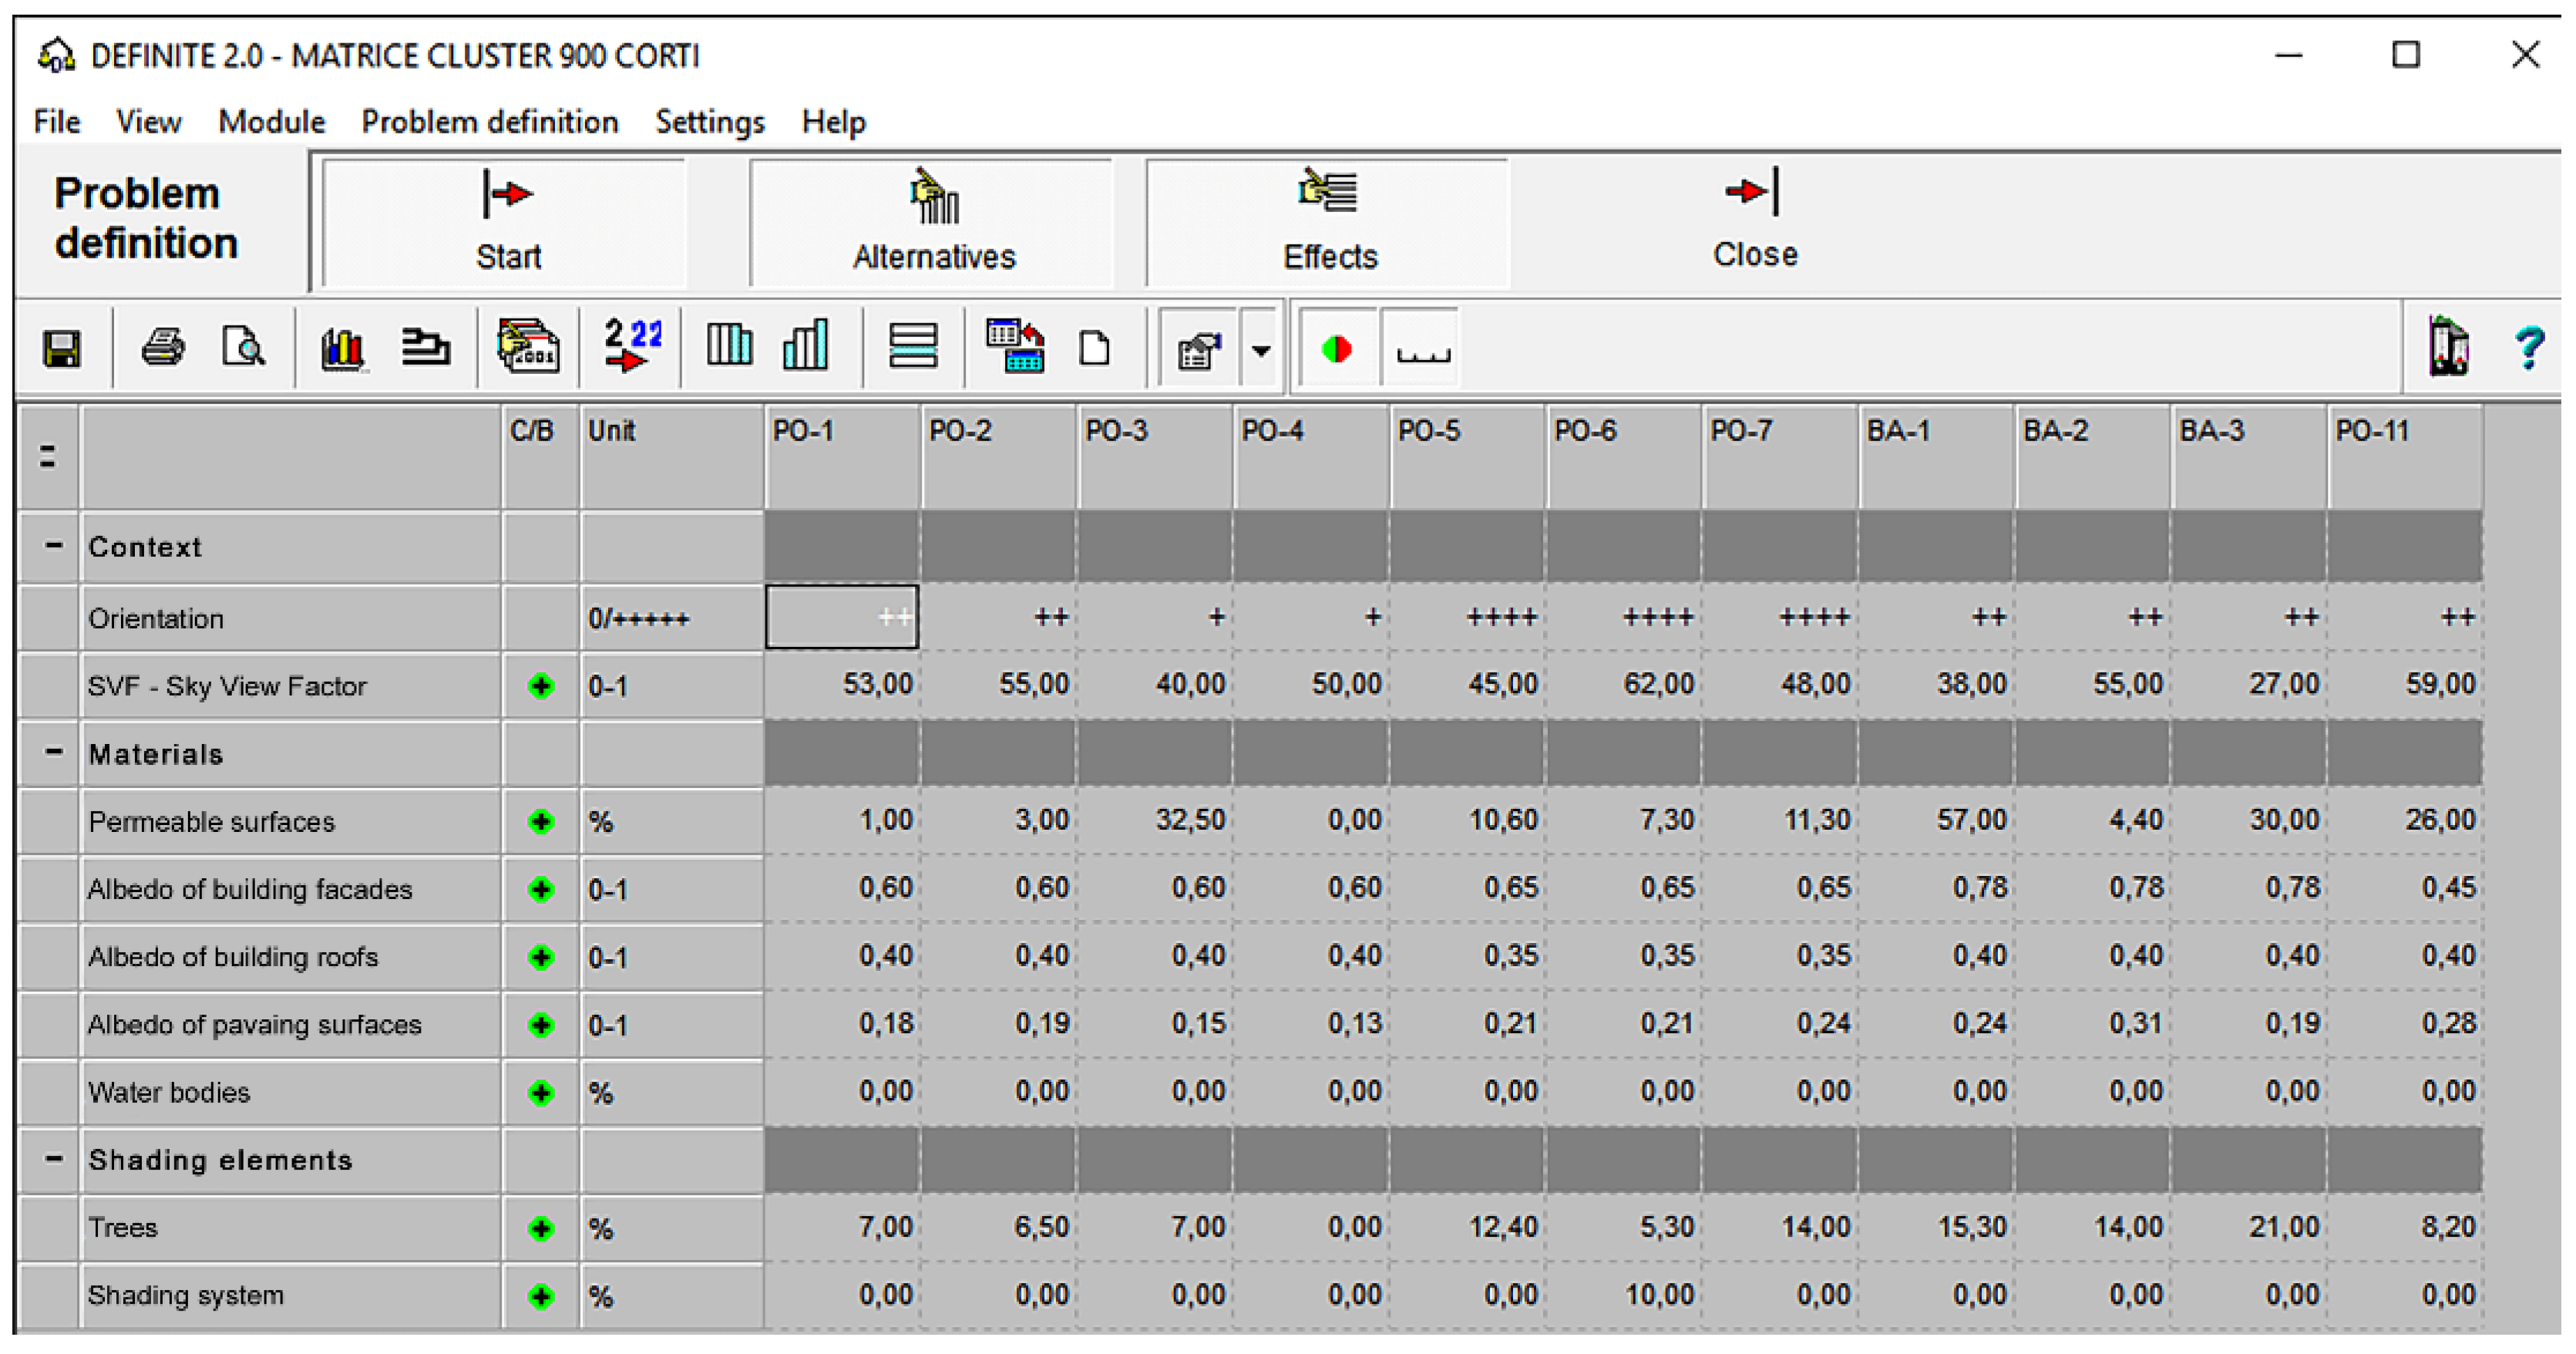
3.4. Multi-Criteria Evaluation and Meta-Design Verification

Based on the subdivision of patterns into clusters and the articulation of classified open spaces, it was possible to carry out a structured multi-criteria assessment considering the selected parameters that affect the perceived degree of outdoor comfort in open spaces. The evaluation was carried out by defining a system of indicators useful to compare the characteristics of the environmental performance of typologically homogeneous open spaces and support a decision-making process [58,59] aimed at the selection of spaces able to admit specific transformations (Figure 6).
The developed indicators system has been divided into three main criteria:
  • the context, which collects descriptive indicators of orientation, concerning prevailing winds—OR [18], and the average value of Sky View Factor—SVF [18,38];
  • materials, which includes indicators of permeable surfaces—SP [29,60], building facades albedo—AF [61], building roofs albedo—AT [60,62], open space pavings—AP [63], water bodies percentage –AQ [53,63];
  • shading elements, which consider indicators of the percentage of trees—AL [60,62], and the percentage of shading systems—SS [60,62].
Subsequently, a “Matrix of technological and morphological knowledge of the sample areas of urban pattern clusters” was developed, the data of which were imputed within the decision support software Defined 2.0 [64] to make a comparison between the types of homogeneous open spaces and determine their criticalities and performance deficiencies. Nine matrices were built, divided according to the clusters of urban patterns (Cluster pre ’800, Cluster ’800–’900, Cluster post ’900) and types of urban elements (Figure 7).
Afterwards, a multi-criteria analysis was carried out for each matrix using the ELECTRE II evaluation method [65,66]. By determining the most appropriate type of utility function, the standardisation of each indicator has been defined. Afterwards, two assessments were carried out: the first, giving the same weight to the criteria to understand which of the open spaces examined was preferable concerning the selected criteria (Figure 8); the second, giving a different weight to the criteria for each of the urban pattern clusters, taking into account the morphological and environmental characteristics of the patterns analysed (Figure 9).
By the obtained results, the areas in the last positions of the ranking are those that, with the same criteria attributed weight, present the most critical issues. Following the analysis of the results, it was decided to assign different weights to the criteria, referring to what emerged from the interpretation of the morphological and environmental characteristics of analysed patterns (Table 3). In this way, it was possible to assign each indicator a different order of preferability from 1 to 9, different for each of the urban pattern clusters, expressing the adaptive capacity of morphological and environmental characteristics.
From the comparison between the results of the two evaluations (the one with equal weights and the other with differentiated weights), it is possible to find that the obtained systems are similar and allow to identify the same areas with the most critical issues. From the multi-criteria evaluation, it was possible to select open spaces suitable for meta-design verification. The choice fell on those spaces within each cluster that had recorded intermediate values of PMV, excluding negative and positive extremes, and not considering those categories of spaces whose sample was not significantly relevant (Figure 10).
The chosen test areas (identified with the letter T), selected from the open spaces in clusters are the following: the TP8S area, as the representative street of the pre ’800 pattern; the TP8P area, as a representative square of the pre ’800 pattern; the T89S area, as a representative street of the ’800–’900 pattern; the T89P area, as a representative square of the ’800–’900 pattern; the TP9S area, as a representative street of the post ’900 pattern; the TP9C area, as an example of a collective space representative of the post ’900 pattern.
To evaluate the improvement of the well-being conditions of climate-adaptive design solutions and strategies, each open space has been subjected to a recursive microclimatic simulation process of testing in ENVI-met to verifying the conditions of perceived peoples outdoor comfort through the application of the following meta-design technical solutions of climate-adaptive design, both to 2000s and to 2050s:
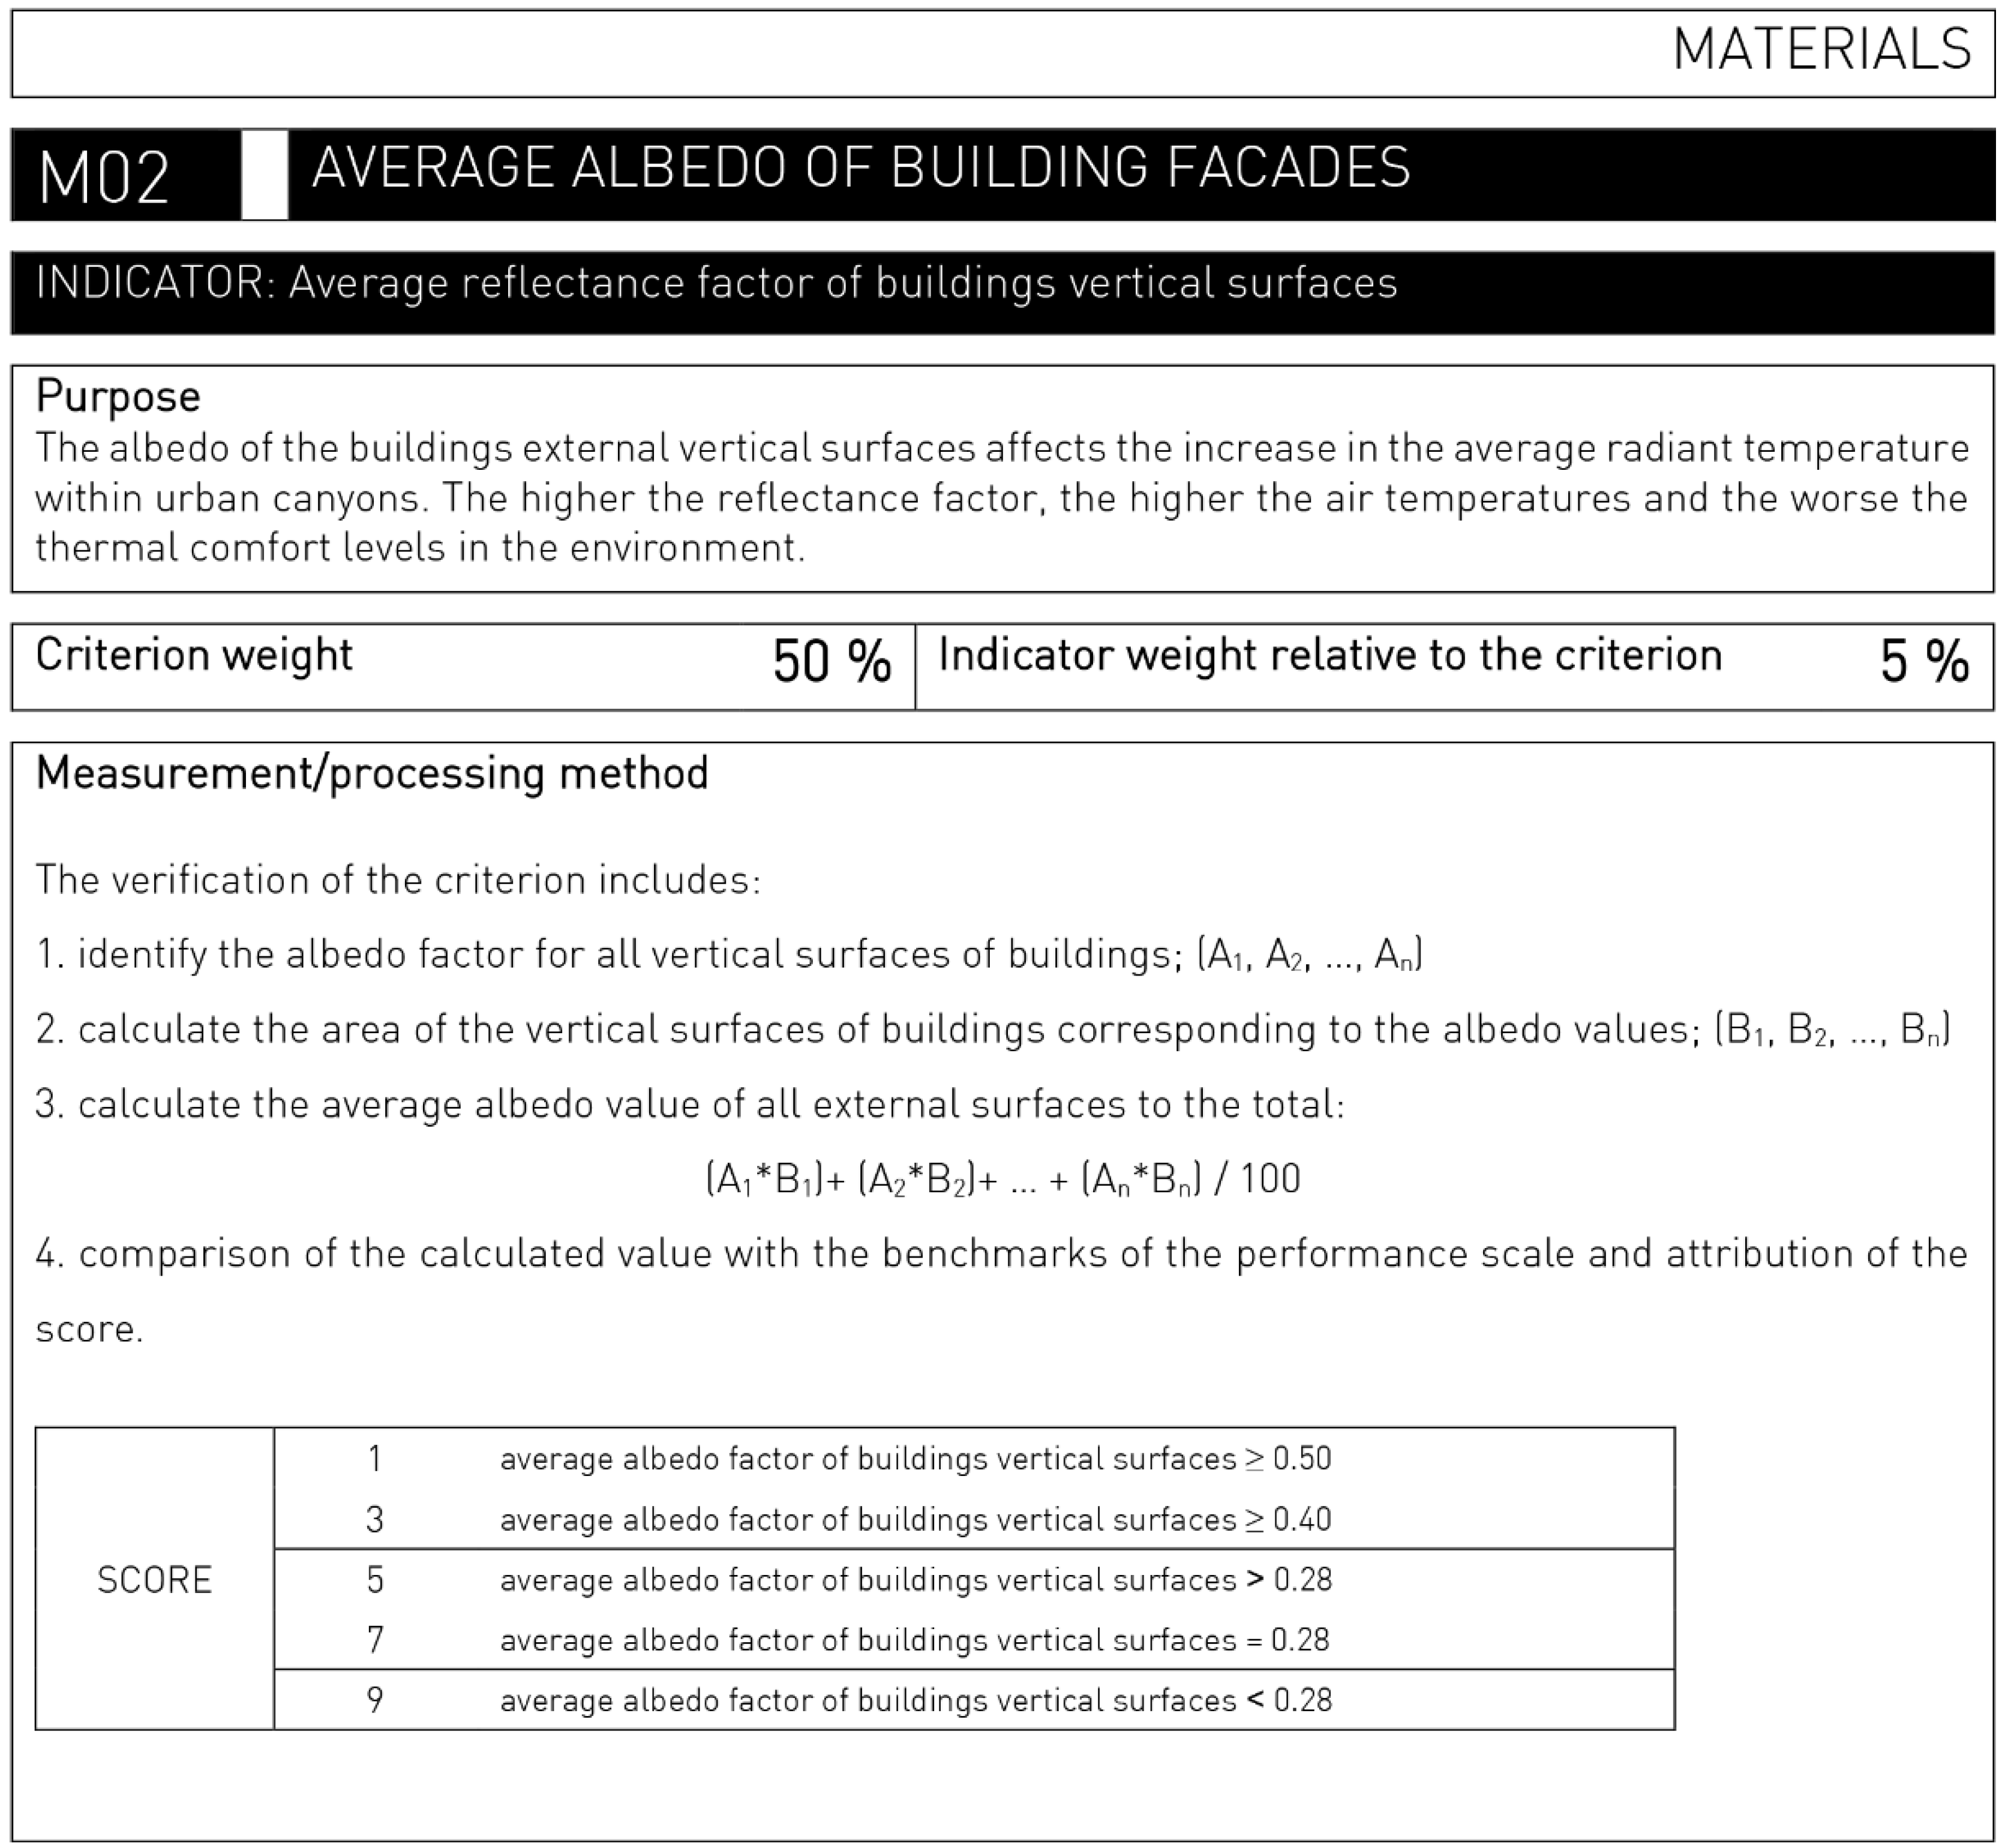
  • AF 0.28-albedo of building facades = 0.28;
  • AF 0.40-albedo of building facades = 0.40;
  • AF 0.50-albedo of building facades = 0.50;
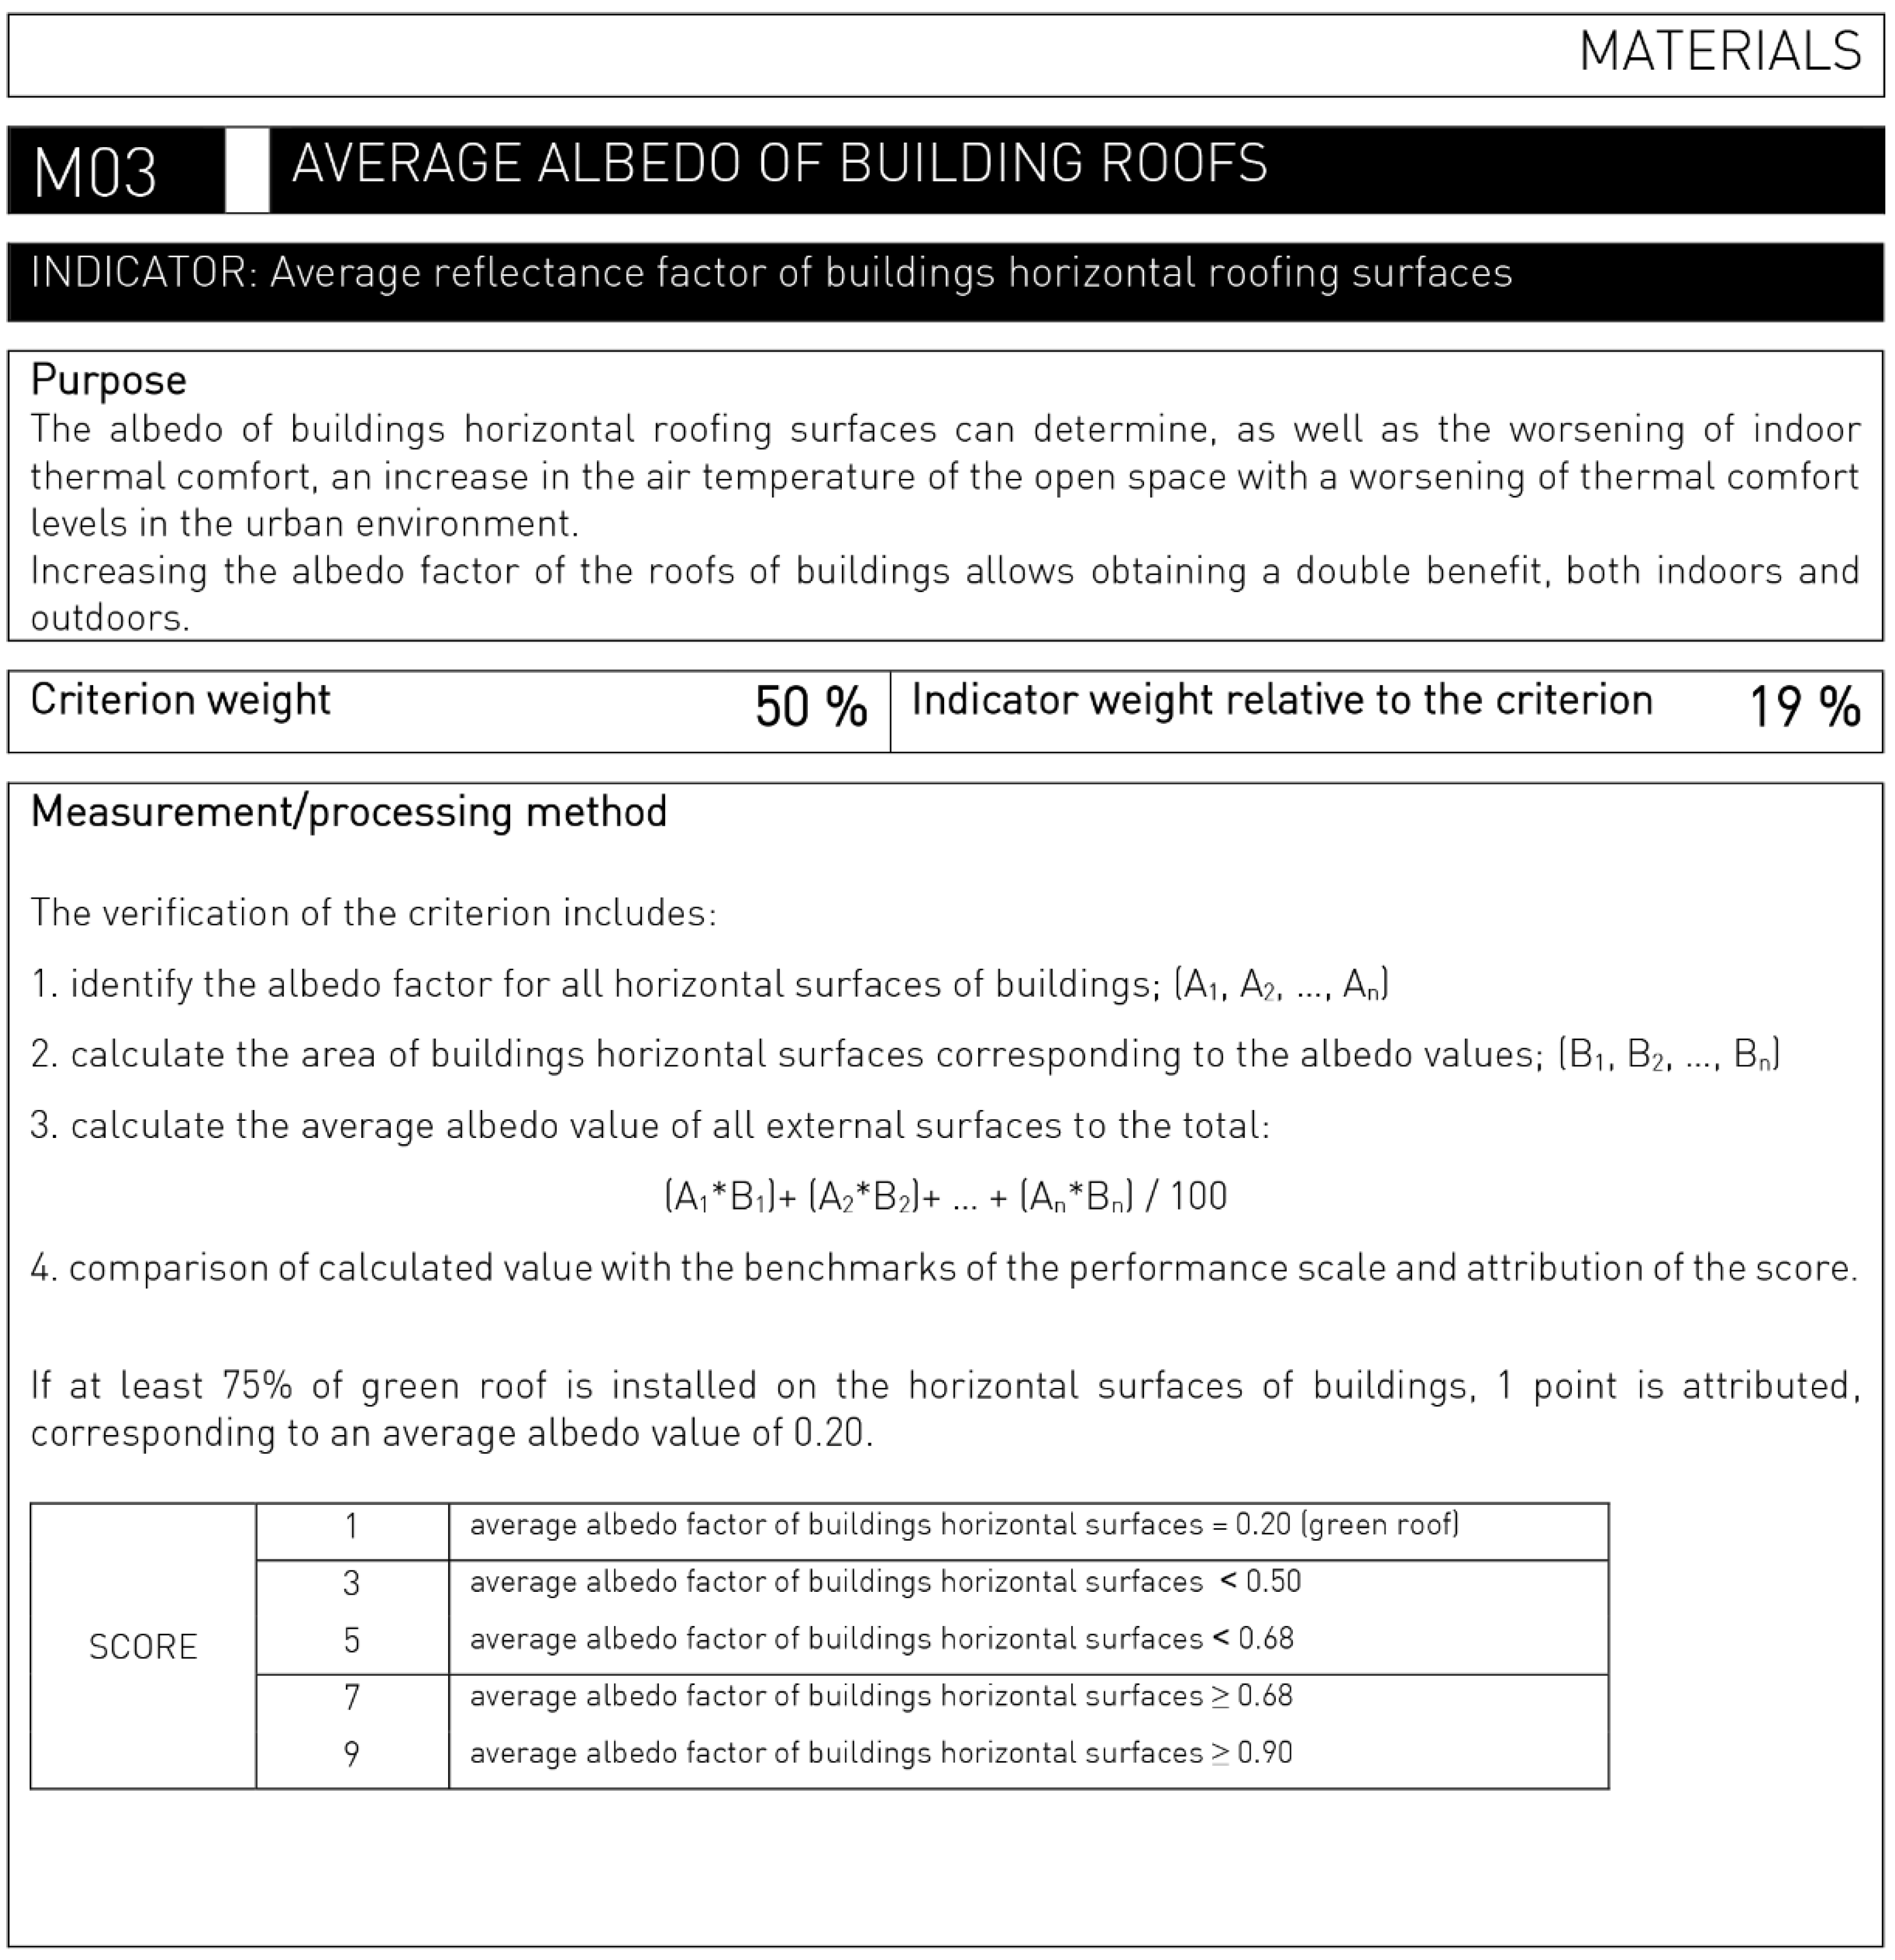
  • AT 0.68-albedo of building roofs = 0.68;
  • AT 0.90-albedo of building roofs = 0.90;
  • TV-application of green roofs on buildings;
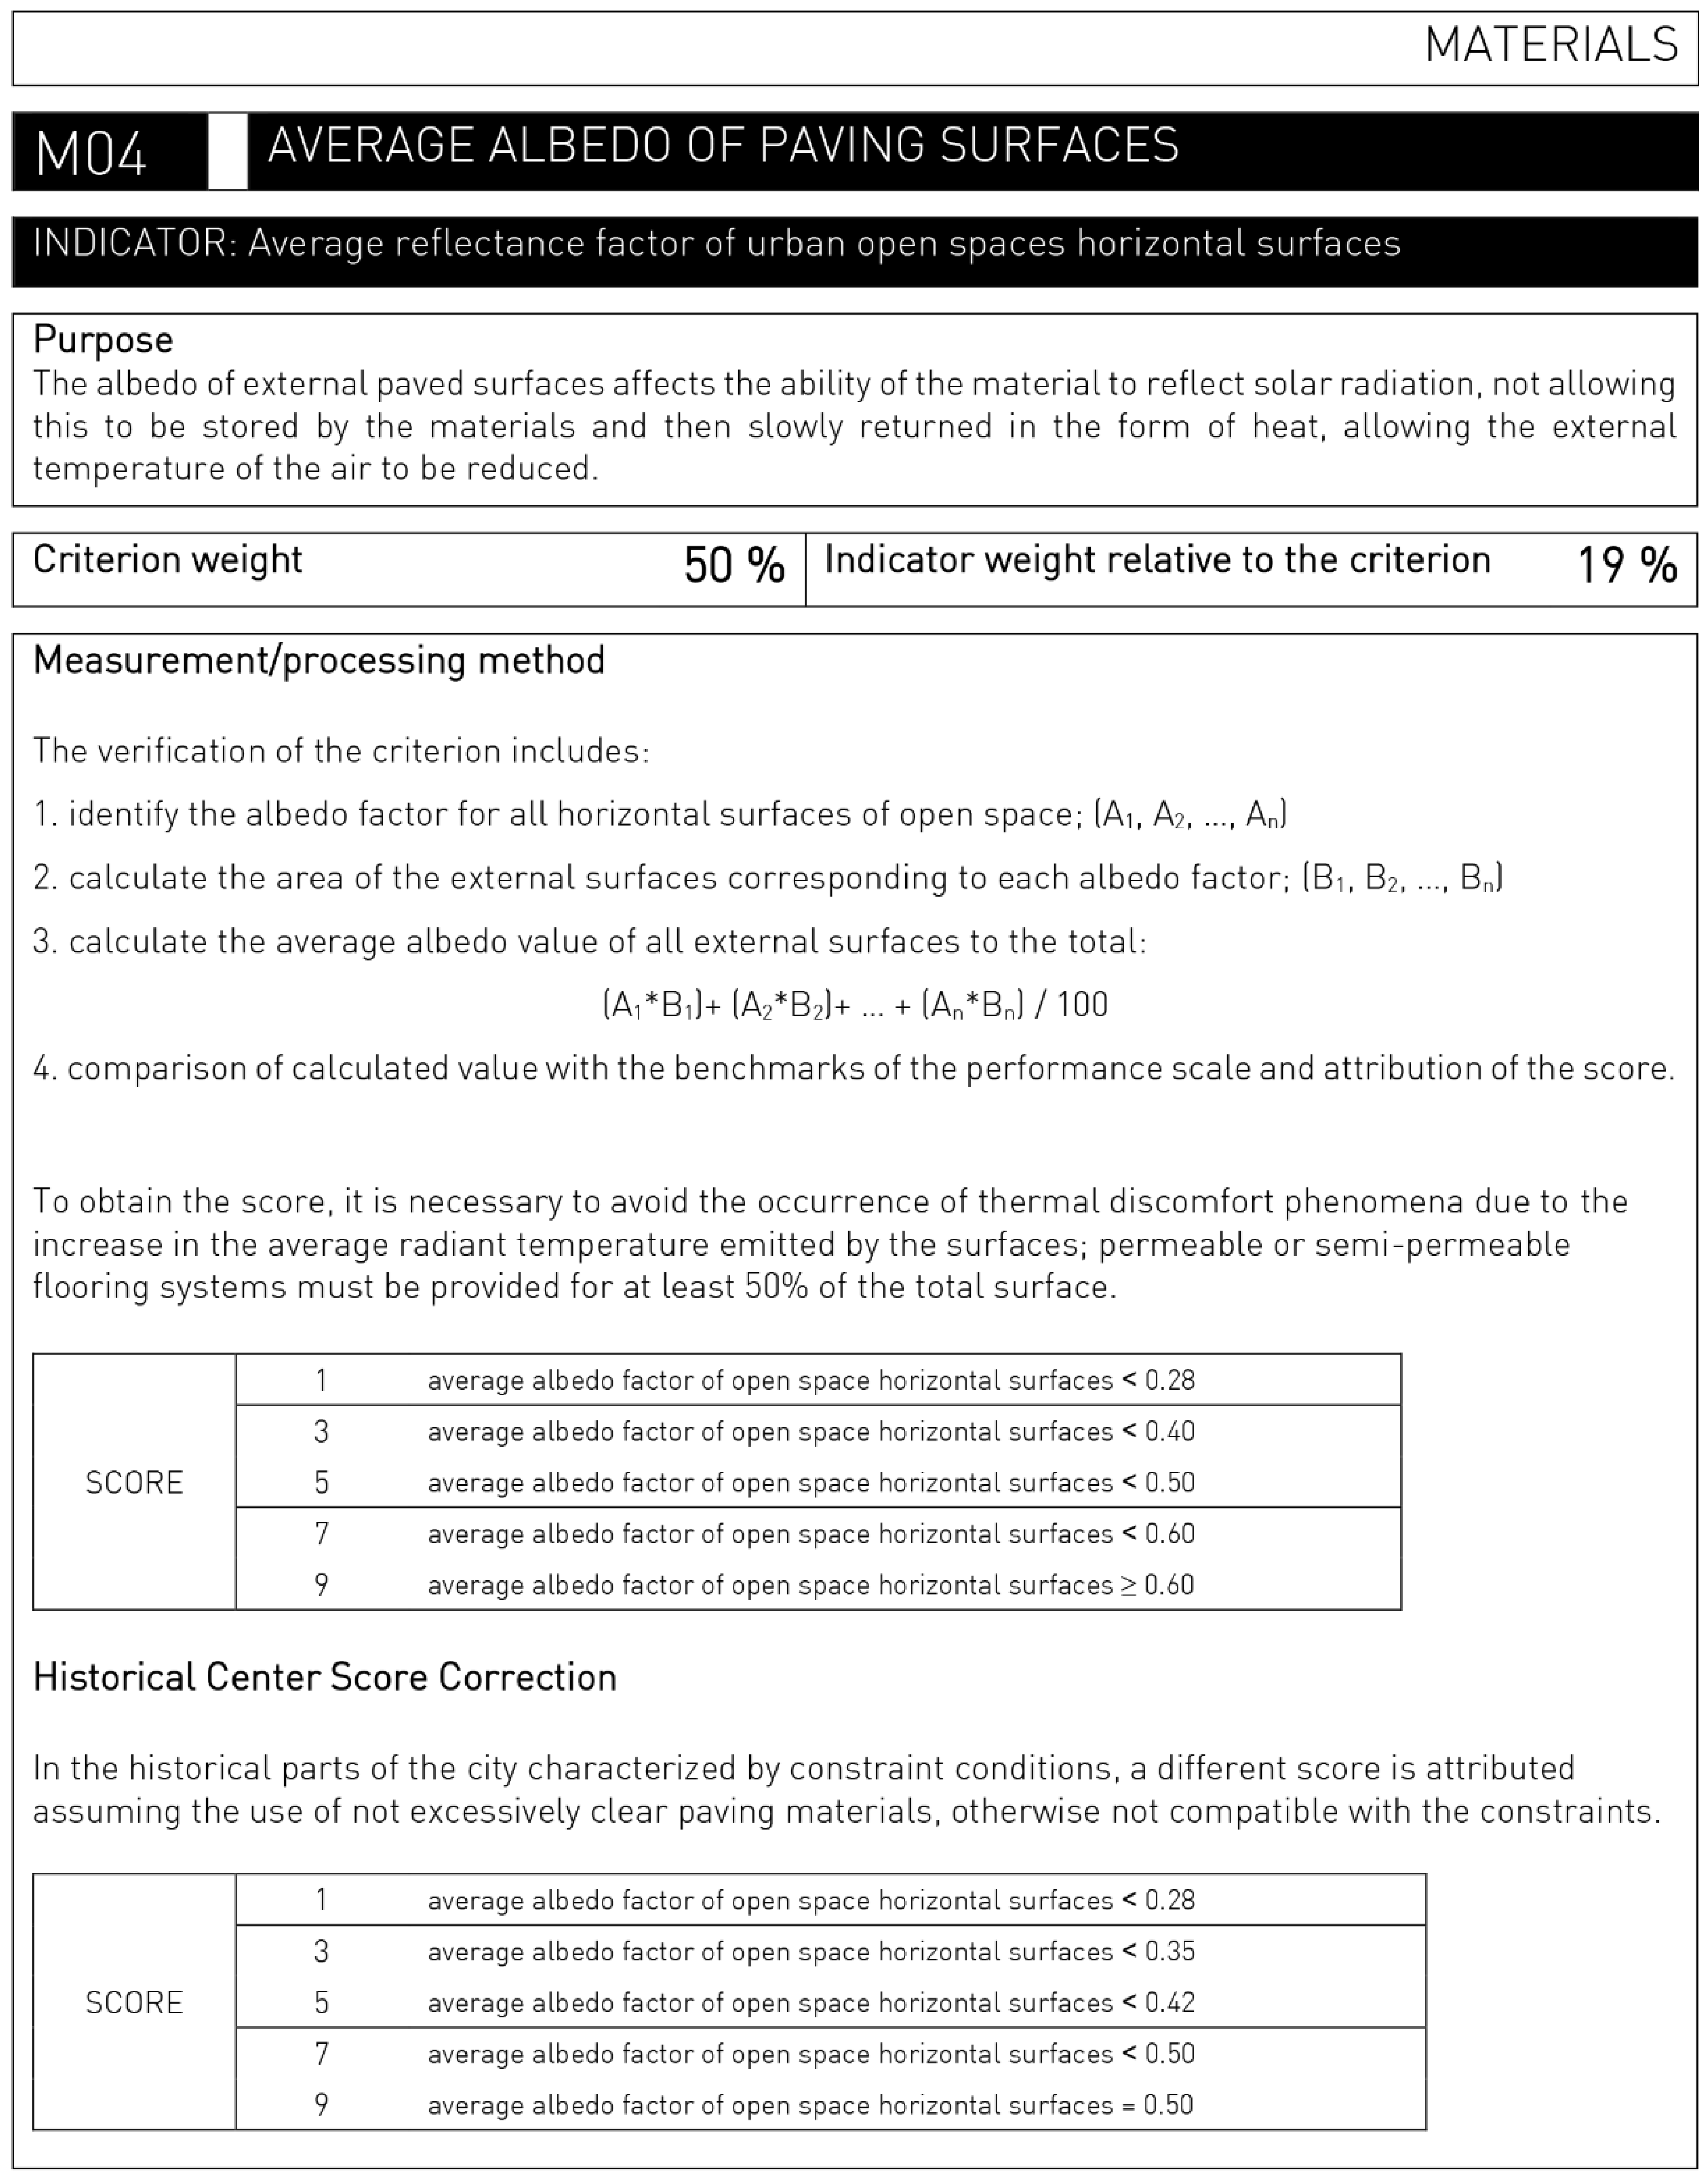
  • AP 0.28-outdoor paving albedo = 0.28;
  • AP 0.40-outdoor paving albedo = 0.40;
  • AP 0.50-outdoor paving albedo = 0.50;
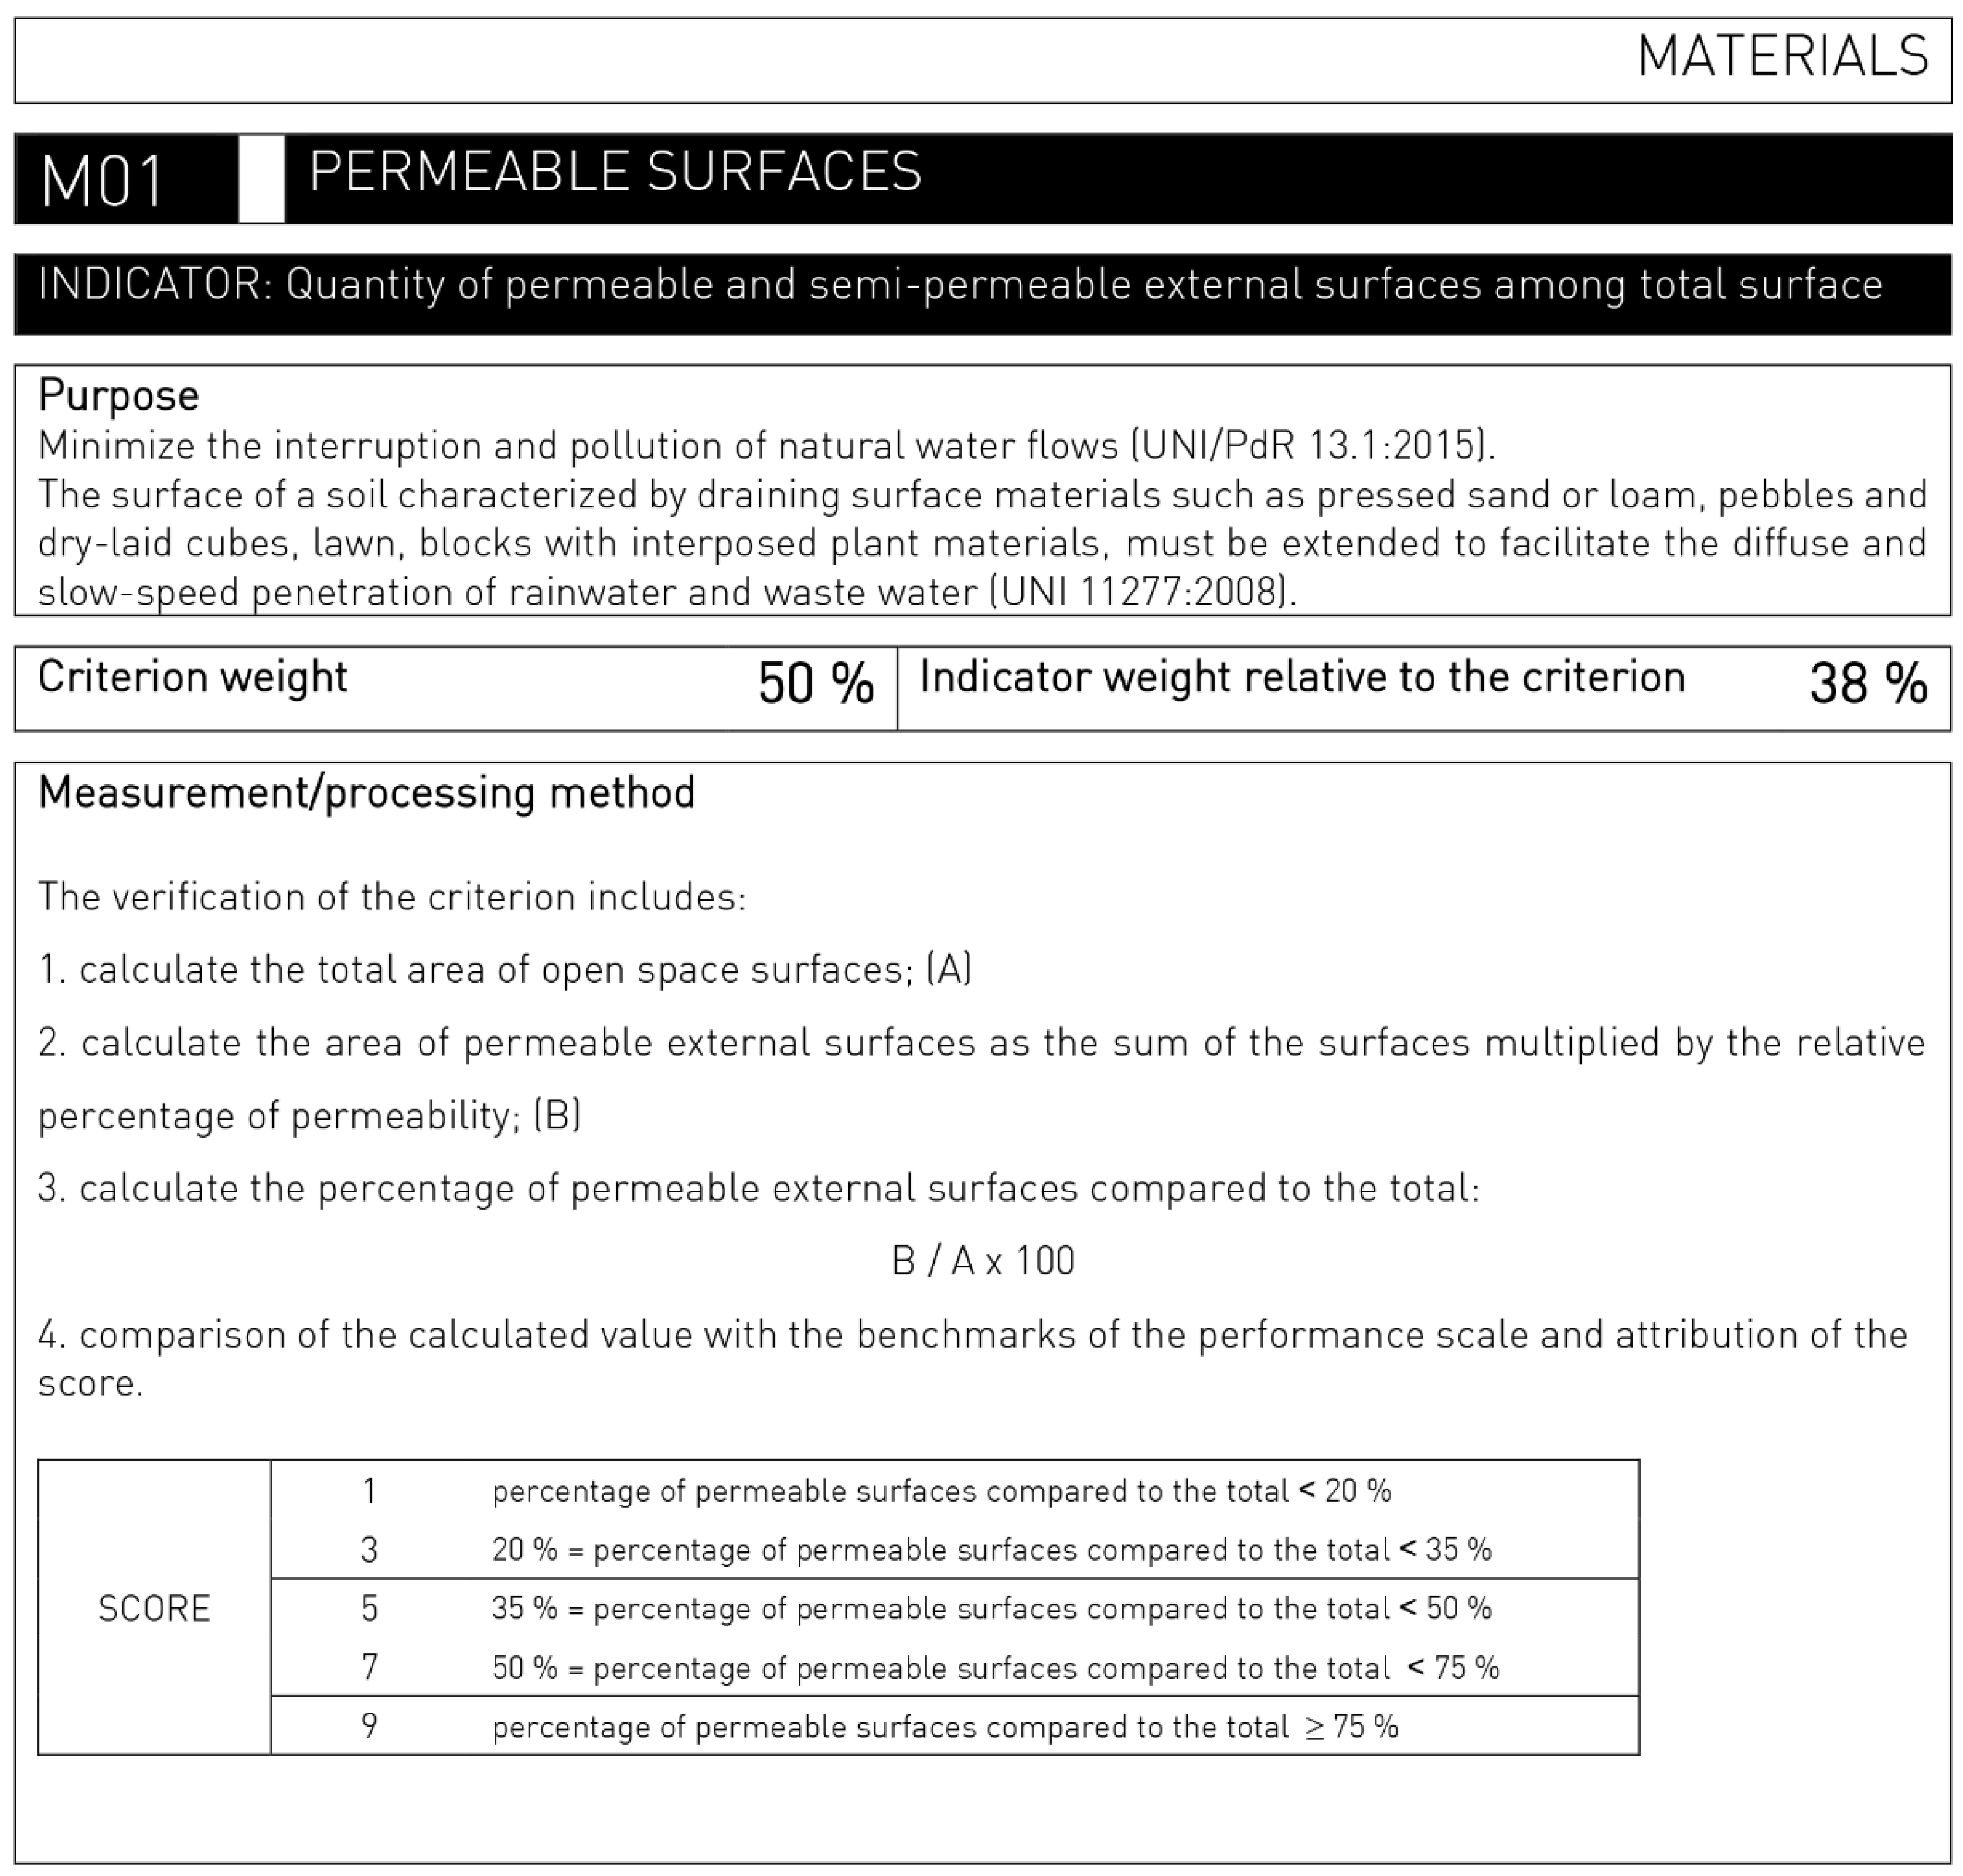
  • PP-increase of permeable area;
  • AQ-application of water bodies;
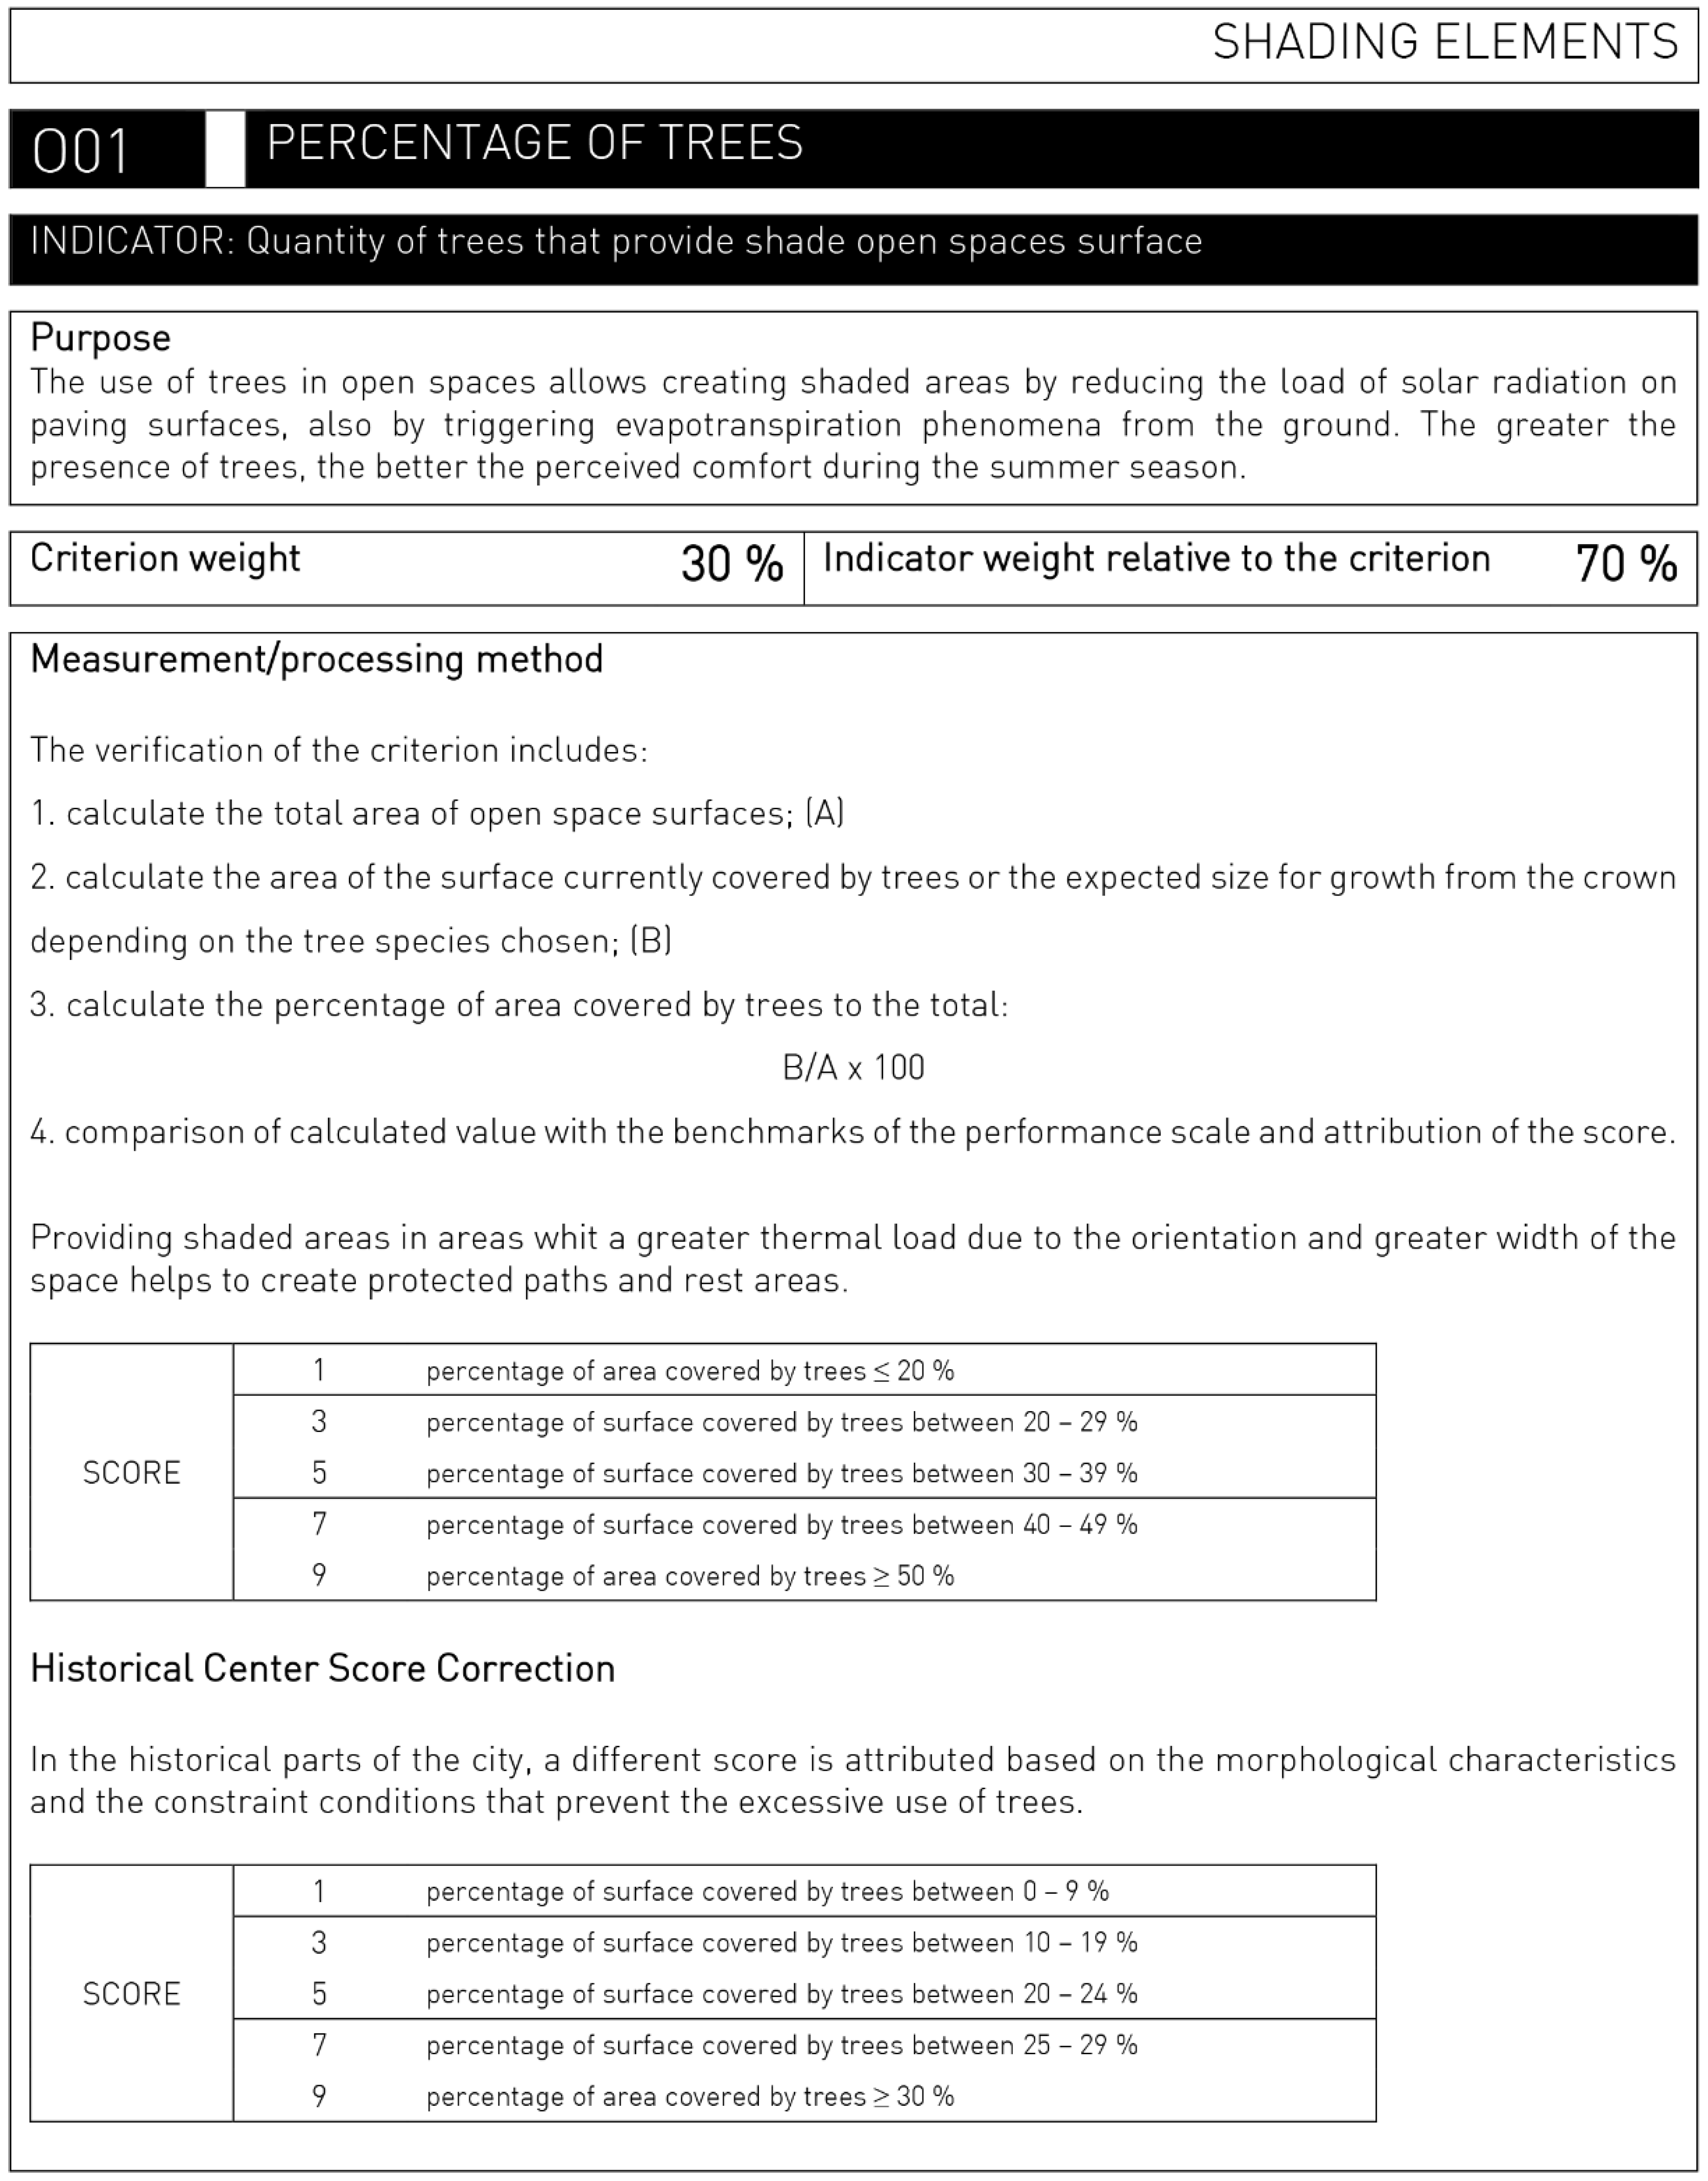
  • AL-increased presence of tree-lined;
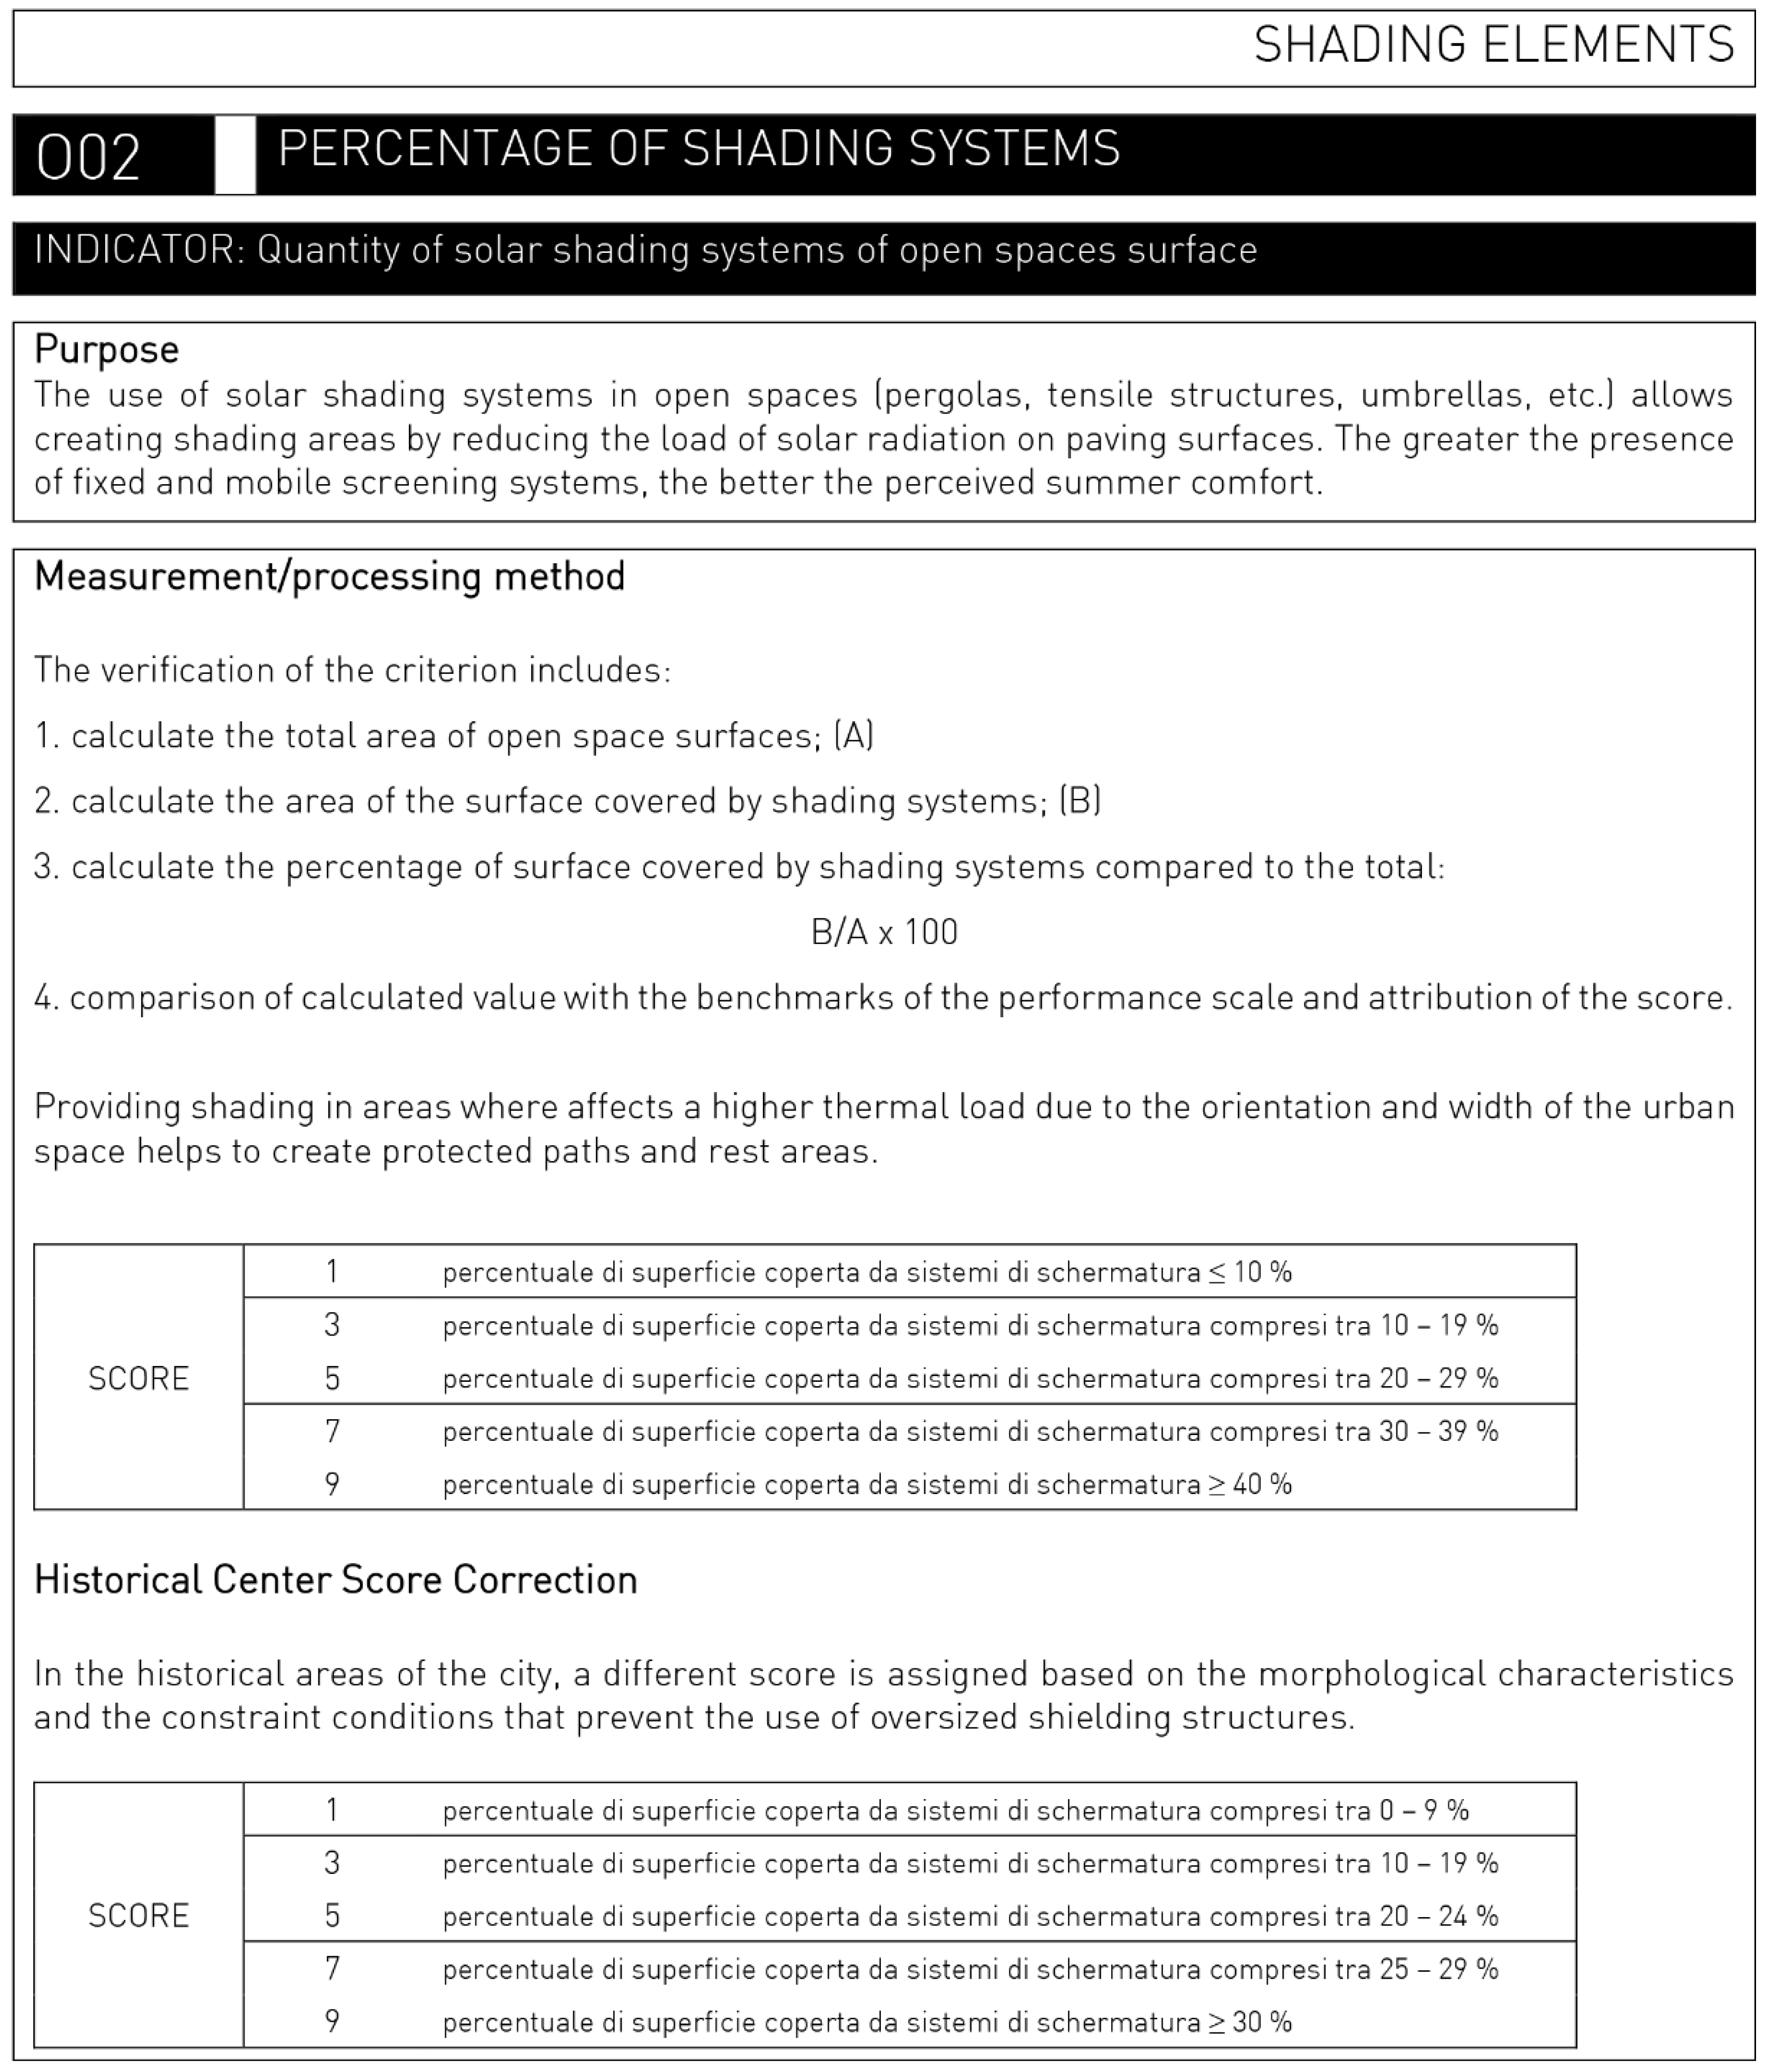
  • OM-application of shading systems.
The facade and roof buildings albedo and external paving were simulated with different thermal reflectance values to understand in which direction, negative or positive, the change in performance took place. Different percentages of solutions application have been adopted for each pattern and urban element, with a different acceptance degree of the transformation and the actual feasibility of the interventions (green roof, trees, water bodies and shading systems). In addition, a different roughness factor of the building has been set up for test spaces, which allows the software to identify the context, city centre or periphery. In Figure 11, simulated solutions are shown and in what percentage they have been applied in the six test spaces.
The tests carried out made it possible to determine the improvement extent in microclimatic performance levels that can be achieved and which climate-adaptive design solutions it is preferable to adopt within the different pattern clusters to define site-specific adaptation strategies.
Figure 12 describes the preferability of the adopted solutions in test spaces, expressing as a percentage the positive increase or negative decrease in thermal comfort values (PMV). From observing the data obtained, the best results were found in the solutions that involve the increase of trees and the use of permeable paving. In contrast, the solutions that involve the growth of the albedo factors of the paving are ineffective. Among the introduced strategies, the implementation of water bodies, although limited (between 10% and 15% of the total surface of the test spaces), can ensure a good improvement in comfort conditions. At the same time, the insertion of temporary shading structures, such as tensile structures, shading systems along the walls of buildings and fixed elements such as pergolas, has a positive effect. On the other hand, actions on building roofs, such as the use of cool materials or green roofs, ensure a reduced benefit on open space. However, a negative response emerged from the application of solutions that aim to increase albedo values for building facades.

3.5. Definition of the CADI-BE, an Adaptive Capacity Assessment System to Rising Urban Temperatures

Completed the meta-design phase, the Climate Adaptive Design Index for the Built Environment-CADI-BE evaluation system was developed, intended as a tool to be applied as a monitoring and verifying device for the environmental performance of open space concerning the increase in summer temperatures, but also as a decision support system to design choices.
Based on the indicators selected for the multi-criteria evaluation process and following the reading and interpretation of the results emerging from the first meta-design phase on the six test open spaces, it was possible to identify the extent to which the improvement of microclimatic performance levels can be achieved. At the same time, it was understood which climate-adaptive design solutions it is preferable to adopt within the different pattern clusters to define site-specific adaptation strategies to reduce the negative effects of high temperatures and improvement of perceived microclimatic outdoor comfort.
The ranking of preferably obtained from the evaluation of adaptive design solutions for test areas has allowed defining benchmark conditions (Figure 13) to be taken into account in the choice of actions to be implemented to mitigate the negative effects due to the increase in summer temperatures in the eastern area of Naples.
For each of the criteria and indicators, the weight expressed in percentage terms has been identified, which makes it possible to explain the level of influence it can have on the assessment of the open space performance in the summer period, and on the final assessment of the open spaces adaptive capacity to the increase in urban temperatures due to climate change. Five benchmarks are associated with each indicator, which assigns a performance index expressed in values 1, 3, 5, 7 and 9, which identify the degree of preferably with other conditions and contribute to determining open spaces’ adaptive capacity to the increase in summer temperatures.
In addition, concerning historical study areas with constraint conditions, specific benchmarks have been defined for the indicators of pavings average albedo—M04, percentage of trees—O01 and percentage of shading systems—O02.
The core set of indicators provides a calculation system for the attribution of a global performance score. After having assigned a performance index (i), on a scale from 1 to 9 concerning the corresponding benchmark, a product operation is performed for a partial multiplier (K) identified for each indicator:
K = w × m
where:
w: weight of the indicator; m: influence criterion factor.
The result is a partial score (p) that defines the performance level concerning the indicator:
p = (i/9) × K
where:
K: partial multiplier; i: performance index from 1 to 9.
The next step is to sum the obtained partial scores for each criterion to obtain the total score of the indicator category (P). The score obtained is normalised to get a weighted score (PP), with a maximum achievable value of 5:
PP = (5 × P)/m
where:
P: total score of the indicator category; m: influence criterion factor.
The system provides that, after obtaining the weighted score (PP) for each of the three categories of indicators (context, materials, shading elements), and having performed a weighted average of the individual scores, a global score from 0 (inadequate) to 5 (ideal) defines the obtained performance level, where 3 (good practice) represents the minimum threshold to be reached so that the performance of open space can adapt and resist the increase in summer temperatures compared to the most extreme future scenarios [67] (Supplementary Materials Spreadsheet S1).
The obtained results are summarised in a performance assessment sheet of the open space concerning the increase in summer temperatures (Figure 14), which shows the overall score achieved, the partial scores of absolute and relative performance, a graph indicating the partial performance achieved for each category of indicators, the partial multiplication factors, the criteria, and benchmarks for the classification of the overall result obtained within the performance ranges.
In addition, an explanatory sheet has been prepared for each indicator, describing the reference criterion group, a brief description, the purpose of the indicator, the weight of the criterion and the relative weight of the indicator concerning the reference criterion, the process or method of calculation, the scores that can be assigned under standard conditions or specific conditions for historical context areas characterised by constraint conditions, literature references [67] (Figure 14, Appendix A, Figure A7, Figure A8, Figure A9, Figure A10, Figure A11, Figure A12, Figure A13, Figure A14, Figure A15 and Figure A16 and Supplementary Materials Document S1).

3.6. CADI-BE Reliability Verification

Following the definition of the indicators core set, it was carried out the test of the reliability of the CADI-BE evaluation system for the analysis of performance and perceived environmental comfort through the comparison of the obtained results through software simulations of meta-design actions conducted on three of the six test areas (TP8S, T89P, TP9C).
For the three areas, two application scenarios have been hypothesised, one light and one hard, in which different types and application quantities of climate-adaptive design actions have been applied, such as cool materials, urban greening, shading systems, water bodies (Figure 15, Figure 16 and Figure 17).
A comparison of the average PMV values recorded in the actual condition of the three examined open spaces and in the light and hard meta-design proposals show how climate-adaptive design actions can contribute to the improvement of urban micro-climatic conditions until the achievement of adequate comfort conditions during the current climate scenario and medium-term future scenarios (Table 4).
The CADI-BE system has made it possible to define a preferable order (Table 5) concerning the adaptive capacity of the three selected space areas. The results show that the obtained ranking follows the trend of performance improvement compared to the achieved PMV average values, confirming the reliability of the developed evaluation system.
In addition, further verification was carried out through the application of the Analytic Hierarchy Process (AHP) multi-criteria method [68,69], and Expert Choice software [70] (Figure 18). The verification process was structured through the proposition within the evaluation software of the indicator system and the meta-design alternatives applied to the three verification areas, making the same attribution of weights to the indicators and criteria. The purpose of this verification is to analyse the degree of consistency between the weights attributed to the criteria and indicators and to validate the evaluation approach of alternative climate-adaptive design solutions.
After setting the decision problem, the AHP method allows obtaining a ranking of preferably between the open spaces examined and the analysed solutions (Figure 19).
A comparison of the ranking of adaptive capacity preferably through the proposed solutions defined by applying the AHP method and that achieved through the CADI-BE index shows that the same order has been obtained. This verification establishes a high degree of consistency between the weighting of the selected criteria and indicators, validating the significance of the process through the overall inconsistency level of 0.01, below the 0.10 limit recognised by the AHP method. In addition, the Expert Choice software allows generating a sensitivity analysis that shows how the priorities between meta-design alternatives are explicit concerning each criterion (Figure 20).

4. Discussion

The purpose that has led to the definition of a core set of indicators as a tool for evaluating the environmental performance of open spaces to the increase in urban temperatures, is to obtain a simple tool in its use and capable of indirectly defining guidelines or actions as a designers protocol for the development of climate-adaptive urban redevelopment design actions.
The developed and tested methodology has allowed defining the CADI-BE, based on the definition of strategic interventions capable of increasing the environmental performance of public open spaces, as places for collective living and not inaccessible and unlivable places in specific extreme conditions.
The expected performance response to the different degrees of redevelopment, the less invasive (light) and the more extreme (hard), manages to guarantee significant improvements in both cases, which translate on average into an increase in well-being conditions in the different contexts and climatic scenarios, which is around 20–30% for light interventions and 40–50% for the hard one (Table 4).
In general, the application of a widespread intervention strategy over the entire study area, in those open spaces that may be more significant and where the combined adoption of climate-adaptive design solutions are capable of ensuring microclimatic benefits is expected, can guarantee advantages even where it is not possible to intervene. Areas, where higher comfort levels can be achieved, will have a positive influence on both buildings and other immediately circumstantial areas [71,72,73,74,75,76].
The Eastern Area and the Historical Centre of Naples describe exemplified urban patterns regarding the morphology and microclimatic behaviour of the entire Neapolitan territory. Through the proposed methodological path, the solutions identified and the verifications carried out are possible to achieve the definition and control of the performative response of strategic adaptation actions identified starting from the specific needs of the different urban patterns. Climate adaptive design solutions, defined and tested through the use of ICT tools simulations, can be valid and replicable even for those urban open spaces that have morphological and performance characteristics similar to those of the areas subject to in-depth study, to achieve a similar performance improvement.
Quick verification of the performative response can be carried out through the CADI-BE, to speed up the choice of solutions and monitoring operations. The aim is to quickly manage the process of verifying the degree of reception and performance of climate-adaptive design solutions within the different patterns of the city, as well as to provide the start of a process of widespread redevelopment and improvement of the environmental and architectural quality of urban open spaces, which allow reducing the negative effects of urban temperatures through the creation of places with high adaptive capacity.

5. Conclusions

The objective that led to the definition of a set of indicators as a tool to assess the environmental performance of open spaces concerning the increase of urban temperatures is to obtain a tool simple in its use and able to indirectly define guidelines or actions in the form of a protocol for designers for the development of climate-adaptive urban regeneration projects.
CADI-BE is thus a valuable tool for assessing the characteristics of open space, which adversely affect the perception of comfort in terms of environmental stimuli due to the increase in summer temperatures.
If the methodological process developed is transferred, applied and calibrated for the different climatic and morphological conditions of the capital cities of the Italian provinces, in analogy to what happened for the definition of the Italian climate record database for UNI 10349:1994 [77] that allows to carry out thermo-physical analyses to determine the energy performance of buildings, and for major European cities, CADI-BE could be a tool to support decisions for designers and public administrations in the definition of climate-adaptive environmental redevelopment interventions.
In Italy, in addition to what is happening with the strong incentivisation of actions for the energy requalification of buildings, and therefore mitigation, with state incentives at 110%, 90% and 65%, with the National Recovery and Resilience Plan-PNRR, which will be financed by Recovery Plan funds allocated by the European Union, 15.06 billion euros have been earmarked for adaptation actions capable of preventing and contrasting the effects of climate change on the national territory [10]. These actions envisage the implementation of measures for integrated risk management, interventions aimed at resilience, valorisation and better energy management within Italian municipalities, also through the protection and valorisation of urban and suburban green areas, but also foreseeing the strengthening of the forecasting capacity of the effects of climate change with advanced and integrated monitoring and forecasting systems.
It is expected that the proposed actions will be able to increase the resilience of the Italian territory to the negative effects of climate change through a heterogeneous set of actions able to improve the quality of life and the well-being of citizens through the protection of existing green areas, but also with the creation of new ones, to be understood also as actions of urban greening and the creation of green infrastructures, with the ultimate aim of preserving and enhancing biodiversity and ecological processes related to the full functionality of ecosystems, with a careful eye to the human habitat.
It is clear, however, that the funds allocated to the PNRR alone will not be able to cover the investments on the entire national territory and that some actions will be aimed mainly at the 14 metropolitan cities, those that are currently most exposed to different environmental and climate risks. In this perspective, the main Italian cities will have to become a permanent laboratory for experimenting with climate mitigation and adaptation actions, to be calibrated and transferred to the whole national territory and, at the same time, trying to anticipate and exploit some of the advantages deriving from climate change, such as the increase in global average temperatures in the winter season, to reduce primary energy consumption and consequently CO2 emissions.
Adopting an expeditious survey tool for the definition of climate adaptation interventions at the urban scale would be a supra-portal decision-making practice adaptable to any Italian and European urban context, provided that the reference environmental conditions are defined. From this point of view, the CADI-BE approach, in addition to being integrated into the tools for managing the forecasting of phenomena linked to climate change in the urban environment, would represent a tool capable of facilitating designers and decision-makers in control and verification of the adequacy and compliance with changing environmental needs in the implementation of interventions for the redevelopment of public and private space, through the introduction of new characteristics and performance of reducing the negative effects of urban temperatures, guaranteeing widespread benefits determined by adequate levels of perceived comfort during the summer season and the occurrence of heatwaves.

Supplementary Materials

The following are available online https://sites.google.com/view/cadi-be/home and https://www.mdpi.com/article/10.3390/en14154630/s1, Spreadsheet S1: CADI-BE_Spreadsheet, Document S1: CADI-BE_Indicator Core Set.

Author Contributions

Conceptualisation, E.B. and M.C.; methodology, E.B. and M.C.; software, E.B.; validation, E.B. and M.C.; formal analysis, E.B.; investigation, E.B.; resources, E.B.; data curation, E.B.; writing—original draft preparation, E.B. and M.C.; writing—review and editing, E.B. and M.C.; visualisation, E.B.; supervision, E.B. and M.C.; project administration, E.B.; funding acquisition, E.B. and M.C. Both authors have read and agreed to the published version of the manuscript.

Funding

This research received no external funding.

Institutional Review Board Statement

Not applicable.

Informed Consent Statement

Not applicable.

Data Availability Statement

Not applicable.

Conflicts of Interest

The authors declare no conflict of interest.

Appendix A

Figure A1. Location of the detected points during the survey of the environmental conditions of the Historic Centre of Naples: (a) 5 August 2014, h. 10:00–13:00 (b) 6 August 2014, h. 10:00–13:00.
Energies 14 04630 g0a1
Figure A2. Location of the detected points during the survey of the environmental conditions of the Ponticelli district: (a) 3 July 2015, h. 11:00–12:00; (b) 3 July 2015, h. 12:30–15:00.
Energies 14 04630 g0a2
Figure A3. Thermographic surveys of the 5 August 2014 of Duomo Street (P9), Largo San Giovanni Maggiore (P5), Banchi Nuovi Square (P4).
Energies 14 04630 g0a3
Figure A4. Thermographic surveys of the 6 August 2014 of San Francesco di Paola Square (P13), Foria Street (P17), Largo Porta Capuana (P15).
Energies 14 04630 g0a4
Figure A5. Thermographic surveys of the 3 July 2015 of “Lotto PSER” in Fratelli Grimm Avenue (P19), Vincenzo Aprea Square (P29), Margherita Avenue (P31).
Energies 14 04630 g0a5
Figure A6. Extract from the matrix of technological and morphological knowledge of sample urban elements.
Energies 14 04630 g0a6
Figure A7. Descriptive sheet of the indicator of “Orientation”.
Energies 14 04630 g0a7
Figure A8. Descriptive sheet of the indicator of “Sky View Factor”.
Energies 14 04630 g0a8
Figure A9. Descriptive sheet of the indicator of “Permeable surfaces”.
Energies 14 04630 g0a9
Figure A10. Descriptive sheet of the indicator of “Average albedo of building facades”.
Energies 14 04630 g0a10
Figure A11. Descriptive sheet of the indicator of “Average albedo of building roofs”.
Energies 14 04630 g0a11
Figure A12. Descriptive sheet of the indicator of “Average albedo of paving surfaces”.
Energies 14 04630 g0a12
Figure A13. Descriptive sheet of the indicator of “Water bodies”.
Energies 14 04630 g0a13
Figure A14. Descriptive sheet of the indicator of “Trees”.
Energies 14 04630 g0a14
Figure A15. Descriptive sheet of the indicator of “Shading systems”.
Energies 14 04630 g0a15
Figure A16. Summary of CADI-BE indicators.
Energies 14 04630 g0a16

References

  1. EEA-European Environment Agency. Climate Change, Impacts and Vulnerability in Europe 2016. An Indicator Based Report; EEA Report no. 1/2017; EEA: Copenhagen, Denmark, 2017; Available online: https://climate-adapt.eea.europa.eu/metadata/publications/climate-change-impacts-and-vulnerability-in-europe-2016/climate-change-impacts-and-vulnerabilities-2016-thal17001enn.pdf (accessed on 1 April 2021).
  2. Zuo, J.; Pullen, S.; Palmer, J.; Bennetts, H.; Chileshe, N.; Ma, T. Impacts of heat waves and corresponding measures: A review. J. Clean. Prod. 2015, 92, 1–12. [Google Scholar] [CrossRef]
  3. IPCC. Climate Change 2014—Synthesis Report. 2015. Available online: https://www.ipcc.ch/site/assets/uploads/2018/05/SYR_AR5_FINAL_full_wcover.pdf (accessed on 1 April 2021).
  4. IPCC. Global Warming of 1.5 °C—Summary for Policymakers. 2018. Available online: https://www.ipcc.ch/site/assets/uploads/sites/2/2019/05/SR15_SPM_version_stand_alone_HR.pdf (accessed on 1 April 2021).
  5. Urban Adaptation Support Tool (UAST)—EEA, Climate Adapt. Available online: https://climate-adapt.eea.europa.eu/knowledge/tools/urban-ast/step-0-0 (accessed on 1 April 2021).
  6. United Nations. Transforming our World: The 2030 Agenda for Sustainable Development, A/RES/70/1; United Nations: New York, NY, USA, 2015; Available online: https://www.un.org/en/development/desa/population/migration/generalassembly/docs/globalcompact/A_RES_70_1_E.pdf (accessed on 1 April 2021).
  7. European Commission. The European Green Deal. Communication from the Commission to the European Parliament, the European Council, the Council, the European Economic and Social Committee and the Committee of the Regions, COM (2019) 640 Final; European Commission: Bruxelles, Belgium, 2019; Available online: https://eur-lex.europa.eu/legal-content/EN/TXT/?uri=CELEX:52019DC0640 (accessed on 1 April 2021).
  8. European Commission. EU Biodiversity Strategy for 2030. Communication from the Commission to the European Parliament, the European Council, the Council, the European Economic and Social Committee and the Committee of the Regions, COM (2020) 380 Final; European Commission: Bruxelles, Belgium, 2020; Available online: https://ec.europa.eu/info/sites/info/files/communication-annex-eu-biodiversity-strategy-2030_en.pdf (accessed on 1 April 2021).
  9. European Commission. Communication from the Commission to the European Parliament, the Council, the European Economic and Social Committee and the Committee of the Regions. Forging a Climate-Resilient Europe—The New EU Strategy on Adaptation to Climate Change; European Commission: Bruxelles, Belgium, 2021; Available online: https://eur-lex.europa.eu/legal-content/EN/TXT/PDF/?uri=CELEX:52021DC0082&from=EN (accessed on 19 July 2021).
  10. Governo Italiano. Piano Nazionale di Ripresa e Resilienza; Governo Italiano: Rome, Italy, 2021. Available online: https://www.governo.it/sites/governo.it/files/PNRR.pdf (accessed on 19 July 2021).
  11. MATTM—Ministero dell’Ambiente e della Tutela del Territorio e del Mare. In Strategia Nazionale di Adattamento ai Cambiamenti Climatici; MATTM: Rome, Italy, 2015. Available online: https://www.minambiente.it/sites/default/files/archivio/allegati/clima/strategia_adattamentoCC.pdf (accessed on 19 July 2021).
  12. Shaw, R.; Colley, M.; Connell, R. Climate Change Adaptation by Design: A Guide for Sustainable Communities; TCPA: London, UK, 2007. Available online: https://www.preventionweb.net/files/7780_20070523CCAlowres1.pdf (accessed on 1 April 2021).
  13. Van de Ven, F.H.M.; Snep, R.P.H.; Koole, S.; Brolsma, R.; van der Brugge, R.; Spijker, J.; Vergroesen, T. Adaptation Planning Support Toolbox: Measurable performance information based tools for co-creation of resilient, ecosystem-based urban plans with urban designers, decision-makers and stakeholders. Environ. Sci. Policy 2016, 66, 427–436. [Google Scholar] [CrossRef] [Green Version]
  14. D’Ambrosio, V.; Leone, M.F. Progettazione Ambientale per l’Adattamento al Climate Change. 2. Strumenti e Indirizzi per la Riduzione dei Rischi Climatici/Environmental Design for Climate Change Adaptation. 2. Tools and Guidelines for Climate Risk Reduction; Clean Edizioni: Napoles, Italy, 2017; Available online: http://www.sitda.net/downloads/biblioteca/Environmental%20Design%20for%20Climate%20Change%20adaptation.%202.%20Tools%20and%20Guidelines%20for%20Climate%20Risk%20Reduction.pdf (accessed on 1 April 2021).
  15. Losasso, M.; Leone, M.F.; Tersigni, E. Computational design based approaches for public space resilient regeneration. TECHNE J. Technol. Archit. Environ. 2020, 19, 232–241. [Google Scholar] [CrossRef]
  16. Grafakos, S.; Trigg, K.; Landauer, M.; Chelleri, L.; Dhakal, S. Analytical framework to evaluate the level of integration of climate adaptation and mitigation in cities. Clim. Chang. 2019, 154, 87–106. [Google Scholar] [CrossRef] [Green Version]
  17. Frich, A.; Alexander, L.V.; Della-Marta, P.; Gleason, B.; Haylock, M.; Tank, A.M.G.K.; Peterson, T. Observed coherent changes in climatic extremes during the second half of the twentieth century. Clim. Res. 2020, 19, 193–212. [Google Scholar] [CrossRef] [Green Version]
  18. Oke, T.R. The Energetic Basis of the Urban Heat Island. Q. J. R. Meteorol. Soc. 1982, 108, 1–24. [Google Scholar] [CrossRef]
  19. Księżopolski, K.; Drygas, M.; Pronińska, K.; Nurzyńska, I. The Economic Effects of New Patterns of Energy Efficiency and Heat Sources in Rural Single-Family Houses in Poland. Energies 2020, 13, 6358. [Google Scholar] [CrossRef]
  20. Bjrneboe, M.G.; Svendsen, S.; Heller, A. Initiatives for the energy renovation of single-family houses in Denmark evaluated on the basis of barriers and motivators. Energy Build. 2018, 167, 347–358. [Google Scholar] [CrossRef]
  21. Azizi, S.; Nair, G.; Olofsson, T. Analysing the house-owners’ perceptions on benefits and barriers of energy renovation in Swedish single-family houses. Energy Build. 2019, 198, 187–196. [Google Scholar] [CrossRef]
  22. Testa, F.; Todaro, N.M.; Iraldo, F.; Gasbarro, F.; Ianna, F. Assessing Climate Change Mitigation and Adaptation Efforts in the Italian Industry: The Results of an Explorative Study; Italian Ministry of Environment and Protection of Land and Sea; MATTM: Rome, Italy, 2017. Available online: https://www.mite.gov.it/sites/default/files/archivio/allegati/sviluppo_sostenibile/report_ministero_MasterFile_FinalDraft_novembre2017.pdf (accessed on 19 July 2021).
  23. Peng, Y.; Peng, Z.; Feng, T.; Zhong, C.; Wang, W. Assessing Comfort in Urban Public Spaces: A Structural Equation Model Involving Environmental Attitude and Perception. Int. J. Environ. Res. Public Health 2021, 18, 1287. [Google Scholar] [CrossRef] [PubMed]
  24. IPCC. Special Report on Climate Change and Land. 2019. Available online: https://www.ipcc.ch/site/assets/uploads/2019/11/SRCCL-Full-Report-Compiled-191128.pdf (accessed on 19 July 2021).
  25. Detommaso, M.; Gagliano, A.; Marlatta, L.; Nocera, F. Sustainable Urban Greening and Cooling Strategies for Thermal Comfort at Pedestrian Level. Sustainability 2021, 13, 3138. [Google Scholar] [CrossRef]
  26. Bassolino, E.; Ambrosini, L.; Scarpati, F. Thermal-Perception-Driven Adaptive Design for Wellbeing in Outdoor Public Spaces: Case Studies in Naples. In Handbook of Research on Perception-Driven Approaches to Urban Assessment and Design; Aletta, F., Xiao, J., Eds.; IGI Global: Pennsylvania, PA, USA, 2018; pp. 207–239. [Google Scholar] [CrossRef] [Green Version]
  27. Bassolino, E.; Palma Iannotti, F. Processi di parametric e computational design per la definizione di strategie di regenerative climate adaptive design per il distretto di Secondigliano. BDC Boll. Cent. Calza Bini 2020, 20, 393–415. Available online: http://www.serena.unina.it/index.php/bdc/article/view/7562/8428 (accessed on 1 April 2021).
  28. Comune di Napoli—Grande Progetto Centro Storico di Napoli. Available online: https://www.comune.napoli.it/flex/cm/pages/ServeBLOB.php/L/IT/IDPagina/33637 (accessed on 1 April 2021).
  29. Losasso, M.; D’Ambrosio, V. Environmental project and public space rehabilitation: The great project for the historic center of Naples UNESCO World Heritage Site. TECHNE J. Technol. Archit. Environ. 2014, 7, 64–74. [Google Scholar] [CrossRef]
  30. Losasso, M. Riqualificazione Sostenibile Degli Spazi Vuoti della Città Storica. Sperimentazioni Progettuali nell’Area del Grande Progetto UNESCO a Napoli; Clean Edizioni: Naples, Italy, 2018. [Google Scholar]
  31. Progetto METROPOLIS. Available online: http://www.progetto-metropolis.it (accessed on 1 April 2021).
  32. D’Ambrosio, V.; Leone, M.F. Progettazione Ambientale per l’Adattamento al Climate Change. 1. Modelli Innovativi per la Produzione di Conoscenza/Environmental Design for Climate Change adaptation. 1. Innovative Models for the Production of Knowledge; Clean Edizioni: Napoles, Italy, 2016; Available online: http://www.sitda.net/downloads/biblioteca/Environmental%20Design%20for%20Climate%20Change%20adaptation.%201.%20Innovative%20models%20for%20the%20production%20of%20knowledge.pdf (accessed on 1 April 2021).
  33. US Environmental Protection Agency. Reducing Urban Heat Islands: Compendium of Strategies. Trees and Vegetation; US EPA: Washington, DC, USA, 2008. Available online: https://www.epa.gov/sites/production/files/2017-05/documents/reducing_urban_heat_islands_ch_2.pdf (accessed on 1 April 2021).
  34. US Environmental Protection Agency. Reducing Urban Heat Islands: Compendium of Strategies. Cool Pavements; US EPA: Washington, DC, USA, 2008. Available online: https://www.epa.gov/sites/production/files/2017-05/documents/reducing_urban_heat_islands_ch_5.pdf (accessed on 1 April 2021).
  35. Nouri, A.S. A Framework of Thermal Sensitive Urban Design Benchmarks: Potentiating the Longevity of Auckland’s Public Realm. Buildings 2015, 5, 252–281. [Google Scholar] [CrossRef] [Green Version]
  36. Bassolino, E. Il controllo ambientale negli interventi di riqualificazione degli spazi urbani del Centro Storico di Napoli: Monitoraggio, simulazione e verifica con l’utilizzo di strumenti IT. In Proceedings of the International Conference Abitare Insieme/Living Together, 3rd Edition of Inhabiting the Future, Naples, Italy, 1–2 October 2015; Falotico, A., Flora, N., Moccia, F.D., Palestino, M.F., Pone, S., Rispoli, F., Russo, M., Russo Ermolli, S., Scala, P., Eds.; Clean Edizioni: Naples, Italy, 2015. [Google Scholar] [CrossRef]
  37. Bassolino, E. Strategie di adaptive design per il comfrot urbano outdoor in regime di climate change. In Progettare il Verde. Prestazioni e Tecnologie per l’Ambiente Costruito; De Joanna, P., Francese, D., Passaro, A., Eds.; Luciano Editore: Naples, Italy, 2018; pp. 91–112. [Google Scholar]
  38. Watson, I.; Johnson, G. Graphical estimation of sky view-factors in urban environments. J. Climatol. 1987, 7, 193–197. [Google Scholar] [CrossRef]
  39. UNI—Ente Nazionale Italiano di Unificazione. UNI EN ISO 7730:2006—Ergonomia Degli Ambienti Termici—Determinazione Analitica e Interpretazione del Benessere Termico Mediante il Calcolo degli Indici PMV e PPD e dei Criteri di Benessere Termico Locale; UNI: Milano, Italy, 2006. [Google Scholar]
  40. Mazzarella, L. Dati climatici G.DE GIORGIO. In Proceedings of the Giornata di studio Giovanni De Giorgio, Milan, Italy, 1997; Available online: https://energyplus.net/sites/all/modules/custom/weather/weather_files/italia_dati_climatici_g_de_giorgio.pdf (accessed on 1 April 2021).
  41. EnergyPlus. Available online: https://energyplus.net/weather (accessed on 1 April 2021).
  42. CCWorldWeatherGen. Available online: https://energy.soton.ac.uk/climate-change-world-weather-file-generator-for-world-wide-weather-data-ccworldweathergen/ (accessed on 1 April 2021).
  43. IPCC—Data Distribution Center, HadCM3 Climate Scenario Data. Available online: https://www.ipcc-data.org/sim/gcm_clim/SRES_TAR/hadcm3_download.html (accessed on 1 April 2021).
  44. Troup, L.; Fannon, D. Morphing Climate Data to Simulate Building Energy Consumption. In Proceedings of the ASHRAE and IBPSA-USA SimBuild 2016: Building Performance Modeling Conference, Salt Lake City, UT, USA, 8–12 August 2016; ASHRAE and IBPSA-USA: Peachtree Corners, GA, USA, 2016. Available online: https://ibpsa-usa.org/index.php/ibpusa/article/view/390/376 (accessed on 1 April 2021).
  45. Moccia, F.D.; Sgobbo, A. Resilienza urbana e pluvial flooding: Lo studio predittivo del comportamento idraulico urbano Francesco. In Progettazione Ambientale per l’Adattamento al Climate Change. 1. Modelli Innovativi per la Produzione di Conoscenza/Environmental Design for Climate Change Adaptation. 1. Innovative Models for the Production of Knowledge; D’Ambrosio, V., Leone, M.F., Eds.; Clean Edizioni: Naples, Italy, 2016; pp. 136–145. [Google Scholar]
  46. Bouyer, J.; Musy, M.; Huang, Y.; Athamena, K. Mitigating Urban Heat Island Effect by Urban Design: Forms and Materials, in Cities and Climate Change: Responding to an Urgent Agenda. In Proceedings of the Fifth Urban Research Symposium 2009, World Bank: Cities and Climate Change: Responding to an Urgent Agenda, Marseille, France, 28–30 June 2009; Hoornweg, D., Freire, M., Lee, M.J., Bhada-Tata, P., Yuen, B., Eds.; The World Bank: Washington, DC, USA, 2009; Volume 2. Available online: http://documents1.worldbank.org/curated/en/321111468182335037/pdf/626960PUB0v20B0iesClimateChangeVol2.pdf (accessed on 1 April 2021).
  47. Reven, J. Cooling the Public Realm: Climate-Resilient Urban Design. In Resilient Cities. Local Sustainability; Otto-Zimmermann, K., Ed.; Springer: Dordrecht, The Netherlands, 2011; Volume 1, pp. 451–463. [Google Scholar] [CrossRef]
  48. Li, H.; Harvey, J.T.; Holland, T.J.; Kayhanian, M. The use of reflective and permeable pavements as a potential practice for heat island mitigation and stormwater management. Environ. Res. Lett. 2013, 8, 015023. [Google Scholar] [CrossRef]
  49. Dessì, V. Urban Material for Comfortable Open Spaces. In Proceedings of the World Renewable Energy Congress, Linköping, Sweden, 8–13 May 2011; LiU Electronic Press: Linköping, Sweeden, 2011. [Google Scholar] [CrossRef] [Green Version]
  50. Bassolino, E. The impact of climate change on local water management strategies. Learning from Rotterdam and Copenhagen. UPLanD J. Urban Plan. Landsc. Environ. Des. 2019, 4, 21–40. [Google Scholar] [CrossRef]
  51. Web Platform—Progetto METROPOLIS. Available online: http://webgis.progetto-metropolis.it/ (accessed on 1 April 2021).
  52. Brown, G.Z.; Dekay, M.W. Sun, Wind and Light: Architectural Design Strategies; John Wiley and Sons: New York, NY, USA, 2001. [Google Scholar]
  53. ENIV-MET. A Holistic Microclimate Model. Available online: https://envi-met.info/ (accessed on 1 April 2021).
  54. ISO. ISO 7730:2005. Ergonomics of the Thermal Environment—Analytical Determination and Interpretation of Thermal Comfort Using Calculation of the PMV and PPD Indices and Local Thermal Comfort Criteria; ISO: Geneva, Switzerland, 2005. [Google Scholar]
  55. Fanger, P.O. Thermal Comfort—Analysis and Application in Environmental Engineering; McGraw-Hill Book Company: New York, NY, USA, 1972. [Google Scholar]
  56. ASHRAE. RP-1015. Typical Weather Years for International Locations; ASHRAE: New York, NY, USA, 2001. [Google Scholar]
  57. Ratti, C.; Raydan, D.; Steemers, K. Building form and environmental performance: Archetypes, analysis and an arid climate. Energy Build. 2003, 35, 49–59. Available online: http://senseable.mit.edu/papers/pdf/20030115_Ratti_etal_BuildingForm_EnergyBuildings.pdf (accessed on 1 April 2021). [CrossRef]
  58. Cerreta, M.; Cannatella, D.; Poli, G.; Sposito, S. Climate change and transformability scenario evaluation for Venice (Italy) port-city through ANP method. In Computational Science and Its Applications—ICCSA 2015. ICCSA 2015. Lecture Notes in Computer Science; Gervasi, O., Murgante, B., Misra, S., Gavrilova, M.L., Coutinho Rocha, A.M.A., Torre, C., Taniar, D., Apduhan, B.O., Eds.; Springer: Cham, Switzerland, 2015; Volume 9158, pp. 50–63. [Google Scholar] [CrossRef]
  59. Attardi, R.; Cerreta, M.; Poli, G. A collaborative multi-criteria spatial decision support system for multifunctional landscape evaluation. In Computational Science and Its Applications—ICCSA 2015. ICCSA 2015. Lecture Notes in Computer Science; Gervasi, O., Murgante, B., Misra, S., Gavrilova, M.L., Coutinho Rocha, A.M.A., Torre, C., Taniar, D., Apduhan, B.O., Eds.; Springer: Cham, Switzerland, 2015; Volume 9158, pp. 782–797. [Google Scholar] [CrossRef]
  60. UNI—Ente Nazionale Italiano di Unificazione. UNI/PdR 13.1:2015—Sostenibilità Ambientale nelle Costruzioni—Strumenti Operativi per la Valutazione della Sostenibilità—Edifici Residenziali; UNI: Milan, Italy, 2015. [Google Scholar]
  61. ASHARE. Standard 189.1P, Standard for the Design of High-Performance Green Buildings except Low-Rise Residential Buildings; ASHARE: New York, NY, USA, 2009. [Google Scholar]
  62. GBC Italia. GBC Quartieri; GBC Italia: Rovereto, Italy, 2015; Available online: https://www.gbcitalia.org/documents/20182/22088/Manuale+GBC+QUARTIERI+2015+def.pdf/b6cabb2a-200e-4404-b5d0-dffb9607b36c (accessed on 1 April 2021).
  63. USGBC. LEED v4 Building Design and Construction; USGBC: Washington, DC, USA, 2016; Available online: https://www.usgbc.org/sites/default/files/LEED%20v4%20BDC_07.25.19_current.pdf (accessed on 1 April 2021).
  64. Definite Decision Making software for a Finite Set of Alternatives. Available online: https://spinlab.vu.nl/support/tools/definite-bosda/ (accessed on 1 April 2021).
  65. Roy, B. The Outranking Approach and the Foundations of Electre Methods. Theor. Decis. 1991, 31, 49–73. [Google Scholar] [CrossRef]
  66. Rogers, M.; Bruen, M.; Maystre, L.Y. The Electre Methodology. In ELECTRE and Decision Support; Rogers, M., Bruen, M., Maystre, L.Y., Eds.; Springer: Boston, MA, USA, 2000; pp. 45–85. [Google Scholar] [CrossRef]
  67. CADI-BE_Climate Adaptive Design Index for The Built Environment. Available online: https://sites.google.com/view/cadi-be/home (accessed on 19 July 2021).
  68. Saaty, T.L. Fundamentals of the Analytic Hierarchy Process. In The Analytic Hierarchy Process in Natural Resource and Environmental Decision Making. Managing Forest Ecosystems; Schmoldt, D.L., Kangas, J., Mendoza, G.A., Pesonen, M., Eds.; Springer: Dordrecht, The Netherlands, 2001; Volume 3, pp. 15–35. [Google Scholar] [CrossRef]
  69. Saaty, T.L.; Vargas, L.G. The Seven Pillars of the Analytic Hierarchy Process. In Models, Methods, Concepts & Applications of the Analytic Hierarchy Process; Saaty, T.L., Vargas, L.G., Eds.; Springer: Boston, MA, USA, 2012; Volume 175, pp. 23–40. [Google Scholar] [CrossRef]
  70. ExpertChoice for Collaborative Decision Making. Available online: https://www.expertchoice.com/comparion (accessed on 1 April 2021).
  71. Doick, K.; Hutchings, T. Air Temperature Regulation by Urban Trees and Green Infrastructure; Forestry Commission: Farnham, UK, 2013. Available online: https://www.forestresearch.gov.uk/documents/1708/FCRN012.pdf (accessed on 1 April 2021).
  72. Givoni, B. Climate Considerations in Building and Urban Design; John Wiley & Sons: New York, NY, USA, 1998. [Google Scholar]
  73. Ca, V.T.; Asaeda, T.; Abu, E.M. Reductions in air conditioning energy caused by nearby park. Energy Build. 1998, 29, 83–92. [Google Scholar] [CrossRef]
  74. Jauregui, E. Effects of revegetation and new artificial water bodies on the climate of northeast Mexico City. Energy Build. 1990, 15, 447–455. [Google Scholar] [CrossRef]
  75. Saito, I.; Ishihara, O.; Katayama, T. Study of the effect of green areas on the thermal environment in an urban area. Energy Build. 1990, 15, 493–498. [Google Scholar] [CrossRef]
  76. Honjo, T.; Takakura, T. Simulation of thermal effects of urban green areas on their surrounding areas. Energy Build. 1990, 15, 443–446. [Google Scholar] [CrossRef]
  77. UNI—Ente Nazionale Italiano di Unificazione. UNI 10349:1994—Riscaldamento e Raffrescamento degli Edifici. Dati Climatici; UNI: Milan, Italy, 1994. [Google Scholar]
Figure 1. Workflow for defining the CADI-BE multi-criteria assessment tool.
Energies 14 04630 g001
Figure 2. The perimeter of the study area: (a) Great UNESCO Project; (b) METROPOLIS Project; (c) Study area.
Energies 14 04630 g002
Figure 3. Identification of morphologically homogeneous urban patterns.
Energies 14 04630 g003
Figure 4. The perimeter of chosen areas for microclimatic analysis.
Energies 14 04630 g004
Figure 5. Identification and classification of sample areas.
Energies 14 04630 g005
Figure 6. Definition of the indicators system.
Energies 14 04630 g006
Figure 7. Example of a matrix of technological and morphological knowledge of the sample areas of urban pattern clusters.
Energies 14 04630 g007
Figure 8. Results of multi-criteria analysis with the same weighting to the three criteria.
Energies 14 04630 g008
Figure 9. Multi-criteria analysis with a weighting of the criteria according to the order of preferability assigned to the indicators.
Energies 14 04630 g009
Figure 10. Identification of spaces for testing operations.
Energies 14 04630 g010
Figure 11. Climate adaptive design solutions for each of the test spaces are expressed as a percentage.
Energies 14 04630 g011
Figure 12. Preferable adopted solutions in test spaces and comfort performances (PMV).
Energies 14 04630 g012
Figure 13. Benchmark of the indicators core set: weights and influence factors of criteria and indicators.
Energies 14 04630 g013
Figure 14. CADI-BE evaluation system sheets: (a) compilation sheet; (b) indicator sample sheet.
Energies 14 04630 g014
Figure 15. Registration of the TP9C test area in the actual condition: (a) technological analysis; (b) environmental analysis; (c) CADI-BE output.
Energies 14 04630 g015
Figure 16. Registration of the TP9C test area with a light meta-design proposal: (a) technological analysis; (b) environmental analysis; (c) CADI-BE output.
Energies 14 04630 g016
Figure 17. Registration of the TP9C test area with a hard meta-design proposal: (a) technological analysis; (b) environmental analysis; (c) CADI-BE output.
Energies 14 04630 g017
Figure 18. Definition of the decision-making problem by assigning the weight to criteria and indicators.
Energies 14 04630 g018
Figure 19. Preferable ranking obtained with the AHP method.
Energies 14 04630 g019
Figure 20. Sensitivity analysis of the performance of meta-design alternatives.
Energies 14 04630 g020
Table 1. Environmental data extract from the Historic Centre of Naples (August 2015, 13:00–15:00).
IDOrientationH/W RatioMaterialsSurf. Temp. °CAir
Temp. °C
Relative
Humidity %
Wind Speed m/s
P13E-SE1.20lava
stone basole
57.630.0480.50
P14NE0.60lava
stone cobbles
57.132.0481.20
P15NE1.20lava
stone basole
54.832.0480.60
P16E-SE2.00lava
stone basole
48.031.0480.50
P17NE1.00lava
stone basole
63.1-480.80
P18E-SE2.00lava
stone basole
56.531.0510.50
Table 2. Environmental data extract from the Ponticelli district area (July 2015, 11:00–14:00).
IDOrientationH/W RatioMaterialsSurf. Temp. °CAir
Temp. °C
Relative
Humidity %
Wind Speed m/s
P19SW0.38grey coloured self-licking block58.832.0372.0–2.5
red coloured self-licking block 56.1
lava
stone “basole”
59.5
P20SW-grit (granigliato)49.535.0370.50
P23S-SE1.00uncultivated lawn35.0-350.4–1.5
P25S-SE0.47asphalt54.034.0340.50–1.50
Table 3. Order of indicators preferability of urban pattern clusters.
ClusterSVFORSPAFATAPAQALSS
PRE ’800125463789
’800–’900894563712
POST ’900125786934
Table 4. Comparison of PMV average values: absolute reduction and percentage.
Meta−Design AlternativesAverage PMV
2000s
PMV
Reduction 2000s
Percentage ReductionAverage PMV
2050s
PMV
Reduction 2050s
Percentage Reduction
TP8-Hard2.78−2.21−44.29%3.16−2.32−42.34%
TP8S-Light3.70−1.29−25.85%4.29−1.19−21.72%
TP8S-SDF4.995.48
T89P-Hard3.22−3.11−49.13%3.61−3.27−47.53%
T89P-Light4.17−2.16−34.12%4.63−2.25−32.70%
T89P-SDF6.336.88
TP9C-Hard2.69−2.58−48.96%3.08−2.71−46.80%
TP9C-Light3.83−1.44−27.32%4.29−1.5−25.91%
TP9C-SDF5.275.79
Table 5. Comparison of PMV average values: absolute reduction and percentage.
Meta-Design AlternativesCADI-BE Index
TP8S-Hard2.78
TP8S-Light3.70
TP8S-SDF4.99
T89P-Hard3.22
T89P-Light4.17
T89P-SDF6.33
TP9C-Hard2.69
TP9C-Light3.83
TP9C-SDF5.27
Publisher’s Note: MDPI stays neutral with regard to jurisdictional claims in published maps and institutional affiliations.

