2. Literature Review
Despite the fact that, every year, researchers pay increasing attention to different aspects of competitiveness, some facets are still not widely discussed. The scientific literature examines the concept of competitiveness [
11,
12], identifies the factors determining competitiveness [
13,
14], and analyzes the impact of these factors on overall competitiveness [
15,
16].
There is no consensus on the definition of competitiveness [
17], but in general, it is agreed that the concept of competitiveness is complex. As stated by many researchers, the nature of competitiveness involves trying to be better than other market participants in specific, comparable parameters [
15]. Gries and Hentschel [
18] distinguish two main features of competitive industries: selling and earning profit. Other researchers [
9] share a similar opinion and have stated that international trade and export is closely related to industry competitiveness. Kaušylienė et al. [
19], when analyzing competitiveness in the agricultural sector, indicated that the key indicators of competitiveness are output prices, product quality, labor productivity, changes in exports, and production. Some researchers studying competitiveness emphasize the issue of sustainable economic development and competitiveness [
20]. Capobianco-Uriarte et al. [
21] performed a bibliometric study on competitiveness for the 1983–2017 period and concluded that competitiveness and environmental aspects are increasingly being addressed in the scientific literature. One of the first attempts to combine environmental factors and competitiveness was proposed by the European Commission and has since been incorporated into other research [
17,
22,
23].
As Matuzevičiūtė et al. [
24] stated, the scientific literature focuses mainly on the competitiveness of companies, groups of companies (clusters), regions, countries, or groups of countries. However, the competitiveness of individual industries is still not widely explored. In this paper, industrial competitiveness is understood as the ability of domestic industries to profitably sell, and increase and maintain sales of, their sustainably produced products on local and export markets.
The strategic vision of the European Commission for Climate Change and Energy Policy is to achieve carbon neutrality by 2050, increase energy security, and simultaneously achieve the long-term competitiveness of European industry. The determination of policy leaders to mitigate climate change [
2] has led scientists [
25,
26,
27,
28] to assess the impact of environmental aspects on industrial competitiveness. As shown by several scientists, the best way to achieve the EU’s long-term climate and energy goal is to increase energy efficiency and stimulate the modernization of energy efficiency technology [
29,
30]. As Andrei et al. [
31] mentioned, it will be hard to maintain long-term industry competitiveness and achieve decarbonization without improving energy efficiency in cost-effective ways.
Several researchers [
32,
33,
34] have empirically investigated the relationship between income and carbon emissions, but their conclusions are different and sometimes contradictory. To promote the decarbonization of the economy, the European Commission introduced the European Emission Trading System (ETS) in 2005 [
35]. This system has become one of the mainstays of EU environmental policy [
36]. It established a new tradable commodity—emission allowances (the right to emit a ton of greenhouse gas (GHG) emission (mainly CO
2)). ETS works as follows: for every ton of CO
2 released into the atmosphere, polluters require an allowance. Every participant in the system has a certain amount of freely allocated emission allowances. Every year, the amount allowable of emissions decreases, but every participant can buy or sell allowances according to their needs. Given that the amount of freely allocated emission allowances shrinks with time, the EU Commission expects that allowances will become more expensive, and companies will be forced to switch to a less carbon-intensive energy source or invest in energy-efficient technologies [
35]. Thus far, industry, power plants, and airlines have been involved in the EU’s ETS. Some studies have focused on the impact of the ETS on EU industries and concluded that the price of allowances impacts industry competitiveness [
36,
37]. Bassi et al. [
38] concluded (and other researchers agreed [
39,
40]) that the carbon price could significantly impact the global competitiveness of energy-intensive industries, as well as industry structure, if this price is higher in one country or region. Many researchers have analyzed the link between the company or industry competitiveness and the emission trading system [
36,
37,
41,
42], but a generalized view of competition and a comparison of EU countries is missing. Khastar et al. [
39] also concluded that by introducing a carbon tax, governments can not only address greenhouse gas emission mitigation, but can also pursue other political goals, i.e., a higher tax income, the stimulation of renewable energy deployment, and increases in efficiency. Although this topic remains to be analyzed thoroughly, the tightening of environmental regulations will likely impact industry competitiveness in the future.
As stated by de Macedo the framework for analyzing the interconnectivity of energy efficiency, environmental improvement, and sustainable industrial development remains incomplete [
43].
Several researchers [
44,
45,
46,
47] have stated that competitiveness assessment is a multifaceted, complex process requiring an appropriate assessment methodology and indicator system. In practice, competitiveness analysis models explore and compare several statistical indicators, and combine them into a competitiveness assessment index [
16,
48,
49]. In 2019, the founders of the Competitiveness Industrial Performance index added a new carbon emission dimension to their index. They expect that this supplementation will enable the index to better reflect industry’s negative environmental impact [
26]. Myung et al. [
50] proposed a conceptual model of company competitiveness measurement in relation to climate change. The proposed model can help practitioners to proactively solve climate change issues. Global Reporting Initiative guidelines are often used to judge climate change competitiveness [
51]. The empirical results from the Mexican industry have also shown that optimized energy use increases competitiveness [
52]. However, after reviewing the most popular competitiveness indexes, we noted that the dimensions of energy and emissions are not widely used. This was the main motivation to build an industry competitiveness measure index focusing on industry export performance, carbon emission, and energy efficiency, and to test this index on the European Union’s high-energy-intensity industries.
4. Results of the Research
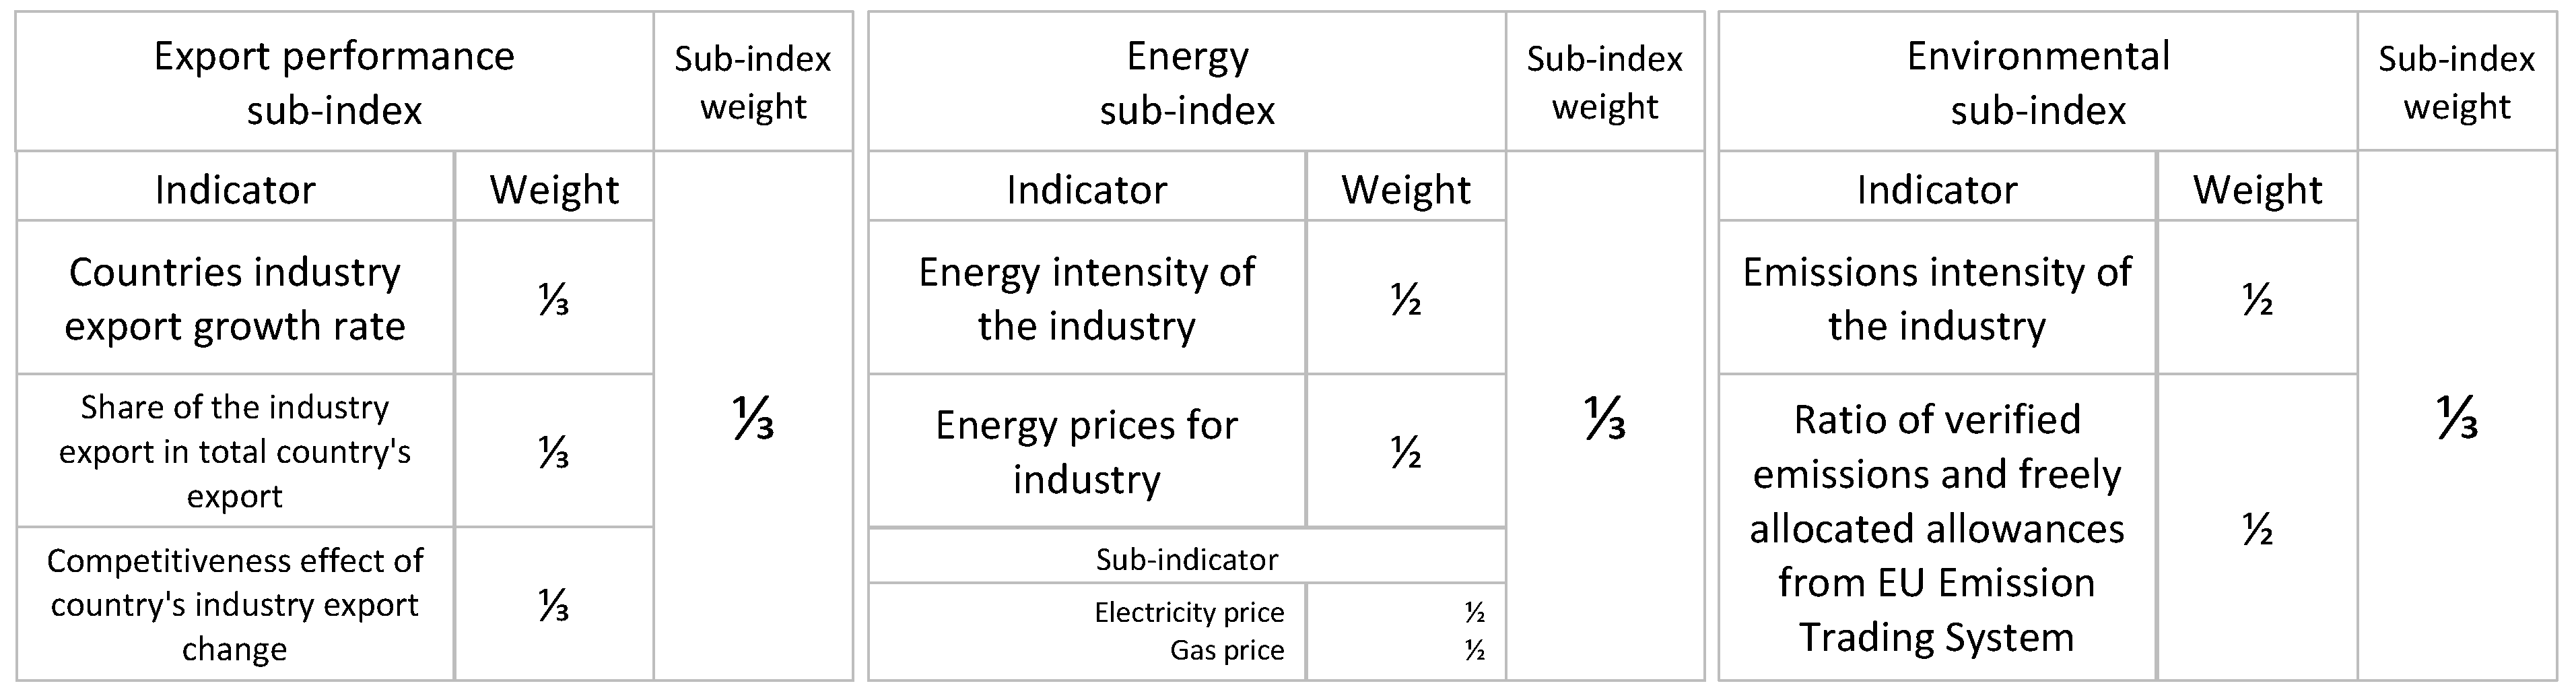
This paper presents our developed index that evaluates industry competitiveness as regards energy efficiency and carbon emission. Based on three sub-indexes (i.e., export performance, energy, and environment), this paper proposes an industry competitiveness evaluation system focusing on energy efficiency and carbon emissions. The index includes seven equally weighted indicators, which are relatively easy to calculate and interpret. The main descriptive statistic of each index value is presented in
Table 1. Attention should be paid to the average index value for each country.
The quantitatively expressed competitiveness estimates for the period of 2009 to 2018 were also calculated for each country. The competitiveness index results for the basic metal (ISIC 24), non-metallic mineral (ISIC 23), chemical and chemical product (ISIC 20–21), paper pulp, and printing (ISIC 17–18) industries for each country in the period 2009–2018 are shown in
Table 2,
Table 3,
Table 4 and
Table 5, and consist of 760 observations.
In the following section, we present our calculated competitiveness index results of the basic metal industry (ISIC 24) in each EU country.
Table 2 below shows the index scores computed during the analyzed period of 2009 to 2018.
The EU’s basic metal industry’s competitiveness index between 2009 and 2018 varies in the range [−1.51; 1.21], with a mean of −0.02 and a standard deviation of 0.46. The mean varied between −0.05 and 0.00, while the standard deviation varied between 0.40 and 0.53, depending on the year, and both tended to decrease. The Pearson’s correlation coefficient was calculated between the basic metal industry’s export value and the lag one of the competitiveness index value. A weak correlation between industry’s export and index value was found (r = 0.15, p = 0.03).
The industry competitiveness index results for the basic metal industry in the analyzed countries show that the basic metal industries of Portugal, the United Kingdom, Lithuania, Austria, Italy, Spain, and Germany were the most competitive during the analyzed period (six or more positive index scores between 2009 and 2018). The only two countries with all negative index scores were the Czech Republic and Ireland. The lowest score (−1.51 in 2009) in the basic metal industry was measured in Ireland, and the highest (1.21 in 2018) was in Sweden. In the last assessed year, the country with the highest (1.21) index score was Sweden, and that with the lowest (−0.83) index score was the Czech Republic.
The highest serial correlation of the index values was found for Poland, the Czech Republic, and Denmark (the autocorrelation coefficients are 0.79, 0.67 and 0.65, respectively). The slopes of index value for these countries are negative and significant (Poland—β0 = −0.06, p = 0.000, add. R2 = 0.77; Denmark—β0 = −0.10, p = 0.01, add. R2 = 0.52; the Czech Republic—β0 = −0.05, p = 0.01, add. R2 = 0.52), which implies that the index value of these countries declined over the research period.
A deeper look into the industry competitiveness index results for Portugal’s basic metal industry (all positive index scores and highest (0.48) average value) shows that the score changed from 0.66 in 2009 to 0.38 in 2018, and manifested a non-significant decreasing trend (slope β0 = −0.02, p = 0.06, add. R2 = 0.12). The energy intensity and carbon emission indicators for Portugal were always positive and between 0.09 and 0.19, but the industry export growth and competitiveness effect indicators reduced from 0.19 and 0.23 to −0.10 and −0.13, respectively. This represents the most significant drop in the basic metal industry group.
Ireland’s (all negative index values and lowest (−0.80) average index value) basic metal industry’s competitiveness index changed from −1.51 in 2009 to −0.46 in 2018. This is a non-statistically significant positive trend (slope β0 = 0.08, p = 0.08).
In the text below, some main observations regarding competitiveness in the EU’s non-metallic minerals industry (ISIC 23) between 2009 and 2018 are discussed.
Table 3 presents all the calculated index scores for this industry.
The EU’s non-metallic minerals industry’s competitiveness index between 2009 and 2018 varied in the range of −1.63 and 1.01, with a mean of −0.02 and a standard deviation of 0.39. Depending on the year, the mean of the calculated index values in this industry varied between −0.06 and 0.00, and the standard deviation varied between 0.28 and 0.55, with a decreasing trend. The Pearson’s correlation coefficient was calculated between the non-metallic minerals industry’s export value and the lag one of the competitiveness index value. A weak correlation between industry’s export and index value was found (r = 0.14, p = 0.04).
The industry competitiveness index results for the non-metallic minerals industry in the analyzed countries show that the industries of Austria, Lithuania, Hungary, the United Kingdom, Germany, Portugal, Poland, and Italy were the most competitive during the analyzed period (at least eight positive index scores between 2009 and 2018). The non-metallic minerals industries of the Czech Republic, Belgium, Denmark, France, and Greece all show the lowest competitiveness index scores (all negative index scores). The lowest index value between 2009 and 2018 was held by Greece (−1.63 in 2010), and the highest by Italy (1.01 in 2017); Greece also showed the lowest average index value (−0.60). The highest average index value was shown by Hungary (0.50). In 2018, the country with the highest (0.56) index score was Finland, and that with the lowest (−0.75) index score was Denmark.
The highest serial correlation of index values was displayed by Hungary and Portugal (first-order autocorrelation coefficients of 0.71 and 0.59, respectively). The slope of the index value for Hungary is negative (β0 = −0.06, p = 0.01, add. R2 = 0.54), and the slope of the index value for Portugal is positive (β0 = 0.04, p = 0.03, add. R2 = 0.38).
Hungary’s non-metallic minerals industry showed all positive competitiveness index scores, which changed from 0.67 in 2009 to 0.20 in 2018. The average value of Hungary’s competitiveness index was 0.50, and this was the highest average value among all countries in this industry. Hungary’s energy intensity and carbon emission indicators were always positive, between 0.08 and 0.20, but the industry’s electricity and gas price indicators dropped from 0.10 and 0.18 to −0.12 and −0.19, respectively.
Lithuania and Austria’s non-metallic minerals industries also had all positive competitiveness index scores. However, their average values (0.38 and 0.20, respectively) were lower, their serial correlations were very weak, and their slopes are non-significant (β0 = −0.03, p = 0.29 and β0 = −0.01, p = 0.66, respectively).
In the subsequent section, the results of the competitiveness index for the chemical and chemical products industries (ISIC 20–21) of the EU countries are discussed.
Table 4 shows the index scores for the analyzed period of 2009 to 2018.
The competitiveness index of the EU’s chemical and chemical products industries between 2009 and 2018 varied in the range of −1.29 and 1.35, with a mean of −0.02 and a standard deviation of 0.47. Depending on the year, the average of the calculated index values in this industry varied between −0.06 and 0.00, and the standard deviation varied between 0.40 and 0.57, with a decreasing trend. The Pearson’s correlation coefficient was calculated between the chemical and chemical products industries export value and the lag one of the competitiveness index value. A weak correlation between an industry’s export and index value was found (r = 0.15, p = 0.04).
The industry competitiveness index results for the chemicals and chemical products industries in the analyzed countries show that the industries of Ireland, the United Kingdom, France, Spain, Hungary, and Italy were the most competitive during the analyzed period (more than eight positive index scores between 2009 and 2018). The chemicals and chemical products industries of the Czech Republic and the Netherland displayed the lowest competitiveness index scores (all negative index scores). The lowest index value between 2009 and 2018 was reached by the Netherlands (−1.29 in 2015), and the highest by Ireland (1.35 in 2018); both countries also had the lowest and highest average index values (the Netherlands −0.87; Ireland 0.79). In 2018, the country with the lowest (−0.94) index score was Slovakia.
The highest serial correlation of the index values was achieved by Greece, Hungary, and Slovakia (first-order autocorrelation coefficients of 0.66, 0.62, and 0.62, respectively). The slopes of index values for Slovakia and Hungary are negative (Slovakia—β0 = −0.14, p = 0.001, add. R2 = 0.73; Hungary—β0 = −0.05, p = 0.001, add. R2 = 0.73), which implies that the index values of these countries declined over the research period. The slope of the index value for Greece is positive (β0 = 0.17, p = 0.02, add. R2 = 0.66), which implies that the index value of this country increased over the research period.
A closer look at the industry competitiveness index results for Ireland’s chemicals and chemical products industry (all positive, and with the highest average (0.79) index score) shows an increase from 1.06 in 2009 to 1.35 in 2018, and this was always one of the best scores in this industry. Ireland’s average score was also the highest among all other industries. However, the serial correlation was very weak (0.16), and the slope is non-significant (β0 = 0.04, p = 0.25). The energy and carbon emission intensities, and the share of industry export indicators, were always positive, between 0.18 and 0.40. After 2013, the industry’s export growth rate and its effect on competitiveness changed from negative to positive. However, the freely allocated allowances and verified emissions indicators were always negative, and the energy prices for the industry were also relatively high.
France and the United Kingdom’s chemicals and chemical products industries’ competitiveness values during the research period were above the EU average (all positive index scores), but their average values (0.19 and 0.43, respectively) and serial correlations were low, and their slopes are non-significant (β0 = 0.01, p = 0.40 and β0 = −0.003, p = 0.85, respectively).
The results from the last studied industry (i.e., EU paper pulp and printing industry (ISIC 17–18)) are described in the section below, and are shown in
Table 5.
The competitiveness index of the EU’s paper pulp and printing industry between 2009 and 2018 varied in the range of −1.09 and 1.08, with a mean of −0.02 and a standard deviation of 0.37. Depending on the year, the average calculated index value varied between −0.07 and 0.00, and the standard deviation varied between 0.30 and 0.46, with a decreasing trend. The Pearson’s correlation coefficient was calculated between the paper pulp and printing industry’s export value and the lag one of the competitiveness index value. A weak correlation between an industry’s export and index value was found (r = 0.32, p < 0.001).
The competitiveness index results show that the paper pulp and printing industries of Lithuania, the United Kingdom, Hungary, Poland, and Spain were the most competitive during the analyzed period (more than eight positive index scores between 2009 and 2018). Austria, Finland, and Germany’s paper pulp and printing industries achieved the lowest competitiveness index scores (all negative index scores). The lowest index value between 2009 and 2018 was shown by Finland (−1.09 in 2009) and the highest by Lithuania (1.08 in 2010); both countries also had the lowest and highest average index values (Finland—−0.68, and Lithuania—0.58). In 2018, the country with the highest (0.56) index score was Denmark, and that with the lowest (−0.60) was Belgium.
Lithuanian had all positive scores and the highest average (0.58) value of competitiveness for its paper pulp and printing industry, but its score decreased from 0.49 in 2009 to 0.26 in 2018; the first-order autocorrelation coefficient was low (0.23), and the slope is negative and non-significant (β0 = −0.08, p = 0.06). The energy intensity, carbon emission, and ratio of freely allocated allowances and verified emissions indicators were always positive, between 0.01 and 0.46. However, the industry’s electricity price indicator was negative, and changed from −0.01 in 2009 to −0.04 in 2018.
The highest serial correlation of index values was found for Greece and Denmark (first-order autocorrelation coefficients of 0.71 and 0.68, respectively). The slopes of index values for both the countries are positive and significant (Greece—β0 = 0.13, p = 0.03, add. R2 = 0.42; Denmark—β0 = 0.11, p = 0.001, add. R2 = 0.70), which implies that the index values of these countries decreased over the research period.
A two-way ANOVA was used to evaluate the effect of industry and country on the competitiveness index score. The ANOVA assumption check flagged 17 outliers (seven in ISIC 17–18, two in ISIC 20–21, three in ISIC23, and five in ISIC24), but the index values are normally distributed between the industries.
Table 6 shows the results of the computation.
The ANOVA results are as follows: (1) the competitiveness index value was statistically significantly different between the investigated countries; (2) the competitiveness index value was statistically non-significantly different between investigated industries; (3) there is a significant interaction between country and industry in terms of the competitiveness index value. The detailed findings can be summarized as follows: the simple main effect analysis showed that there were no differences between industries as regards the index score (F(3, 684) = 0.00, p = 0.99), but there was a significant effect of country on the competitiveness index score (F(18, 684) = 23.28, p < 0.001). Therefore, we failed to reject the H1 hypothesis, but we rejected the H2 hypothesis. We also found a statistically significant interaction between the effects of country and industry on the competitiveness index score (F(54, 684) = 8.74, p < 0.001); consequently, we rejected the H3 hypothesis. Post hoc comparison was not implemented.
These results suggest that the country alone, and industry/country interaction, significantly affect the value of the competitiveness index. However, it should be mentioned that the industry per se does not substantially affect the competitiveness index score.
5. Conclusions and Discussion
To conclude, this article presents an evaluation of industry competitiveness via the effects of energy efficiency and carbon emission. Based on three sub-indexes (i.e., export performance, energy, and environment), this paper has proposed an industry competitiveness evaluation system focusing on energy efficiency and carbon emissions. The presented industry competitiveness evaluation index was tested on the EU basic metal (ISIC 24), non-metallic mineral (ISIC 23), chemical and chemical product (ISIC 20–21), paper pulp, and printing (ISIC 17–18) industries.
Portugal’s basic metal industry achieved the best industry competitiveness index results (all positive index scores and highest (0.48) average value). Its index value varied from 0.90 in 2009 to 0.15 in 2018, and showed a non-significant decreasing trend. Its energy intensity and carbon emission indicators were always positive (above industry average), but the value of industry export growth and its effect on competitiveness indicators was reduced. The country with the highest serial correlation within this industry was Poland (0.79).
Within the non-metallic minerals industry, Hungary achieved the best industry competitiveness index results (all positive index scores and highest (0.50) average value). However, its index score changed from 0.67 in 2009 to 0.20 in 2018, and showed a significant decreasing trend. Its energy intensity and carbon emission indicators were always positive (above industry average), but its industry electricity and gas price indicators decreased over time. The country with the highest serial correlation within this industry was also Hungary (0.71).
As regards the chemical and chemical products industry, Ireland achieved the best industry competitiveness index results (all positive and highest average (0.79) index score), displaying a non-significant increase in the index from 1.06 in 2009 to 1.35 in 2018. Ireland’s average score was also the highest among all other industries. Its energy intensity and carbon emission intensity indicators were always positive (above industry average), but its freely allocated allowances and verified emissions indicators were always negative (below industry average). The country with the highest serial correlation within this industry was Greece (0.66).
Lithuania’s index results were the best in the EU paper pulp and printing industry (all positive and highest average (0.58) index score), showing a non-significant decreasing trend, from 0.49 in 2009 to 0.26 in 2018. The energy intensity, carbon emissions, and ratio of freely allocated allowances and verified emissions indicators were always positive (above industry average). However, its industry electricity price indicator remained mostly negative. The country with the highest serial correlation within this industry was Greece (0.71).
The average index value within each industry eventually dropped to zero, and the standard deviation of the index value showed a diminishing trend through all sectors, which implies that the competitiveness in all sectors was increasing and that all countries were approaching the industry average.
The findings indicate that the countries with the highest index value will also have a positive energy intensity and carbon emission indicator. Still, the causal assumption of this statement should be checked in future research.
It must be stated that the countries with the highest average index value and highest positive index score are not the same as the countries with the highest serial correlation, except for the case of Hungary in the non-metallic minerals industry. This linkage should be investigated further in the future.
The ANOVA results show that (1) the competitiveness index value was statistically significantly different between the investigated countries; (2) the competitiveness index value was statistically non-significantly different between the investigated industries; (3) there is a significant interaction between the effects of country and industry on the competitiveness index value. These results suggest that the country alone, and the industry/country interaction, significantly affect the value of the competitiveness index. However, it should be mentioned that industry per se does not substantially affect the competitiveness index score.
There are many limitations to this paper. First, the countries’ macroeconomic development is not integrated into the index structure. Second, the limited number of countries, and their placement in only one region, limits the applicability of the results. There may be factors specific to other countries that impact industry competitiveness outside of Europe. Third, the authors had no intention to identify the causes of competitiveness.
In the future, this study could be expanded by adding more indicators to the sub-index structure, evaluating additional indicators’ usefulness, and concentrating on the search for the main drivers.


