
Influence of Lightning Current Parameters and Earthing System Designs on Tower Footing Impedance of 500 kV Lines

 , , ,
, , ,  ,
, 
Abstract
:
1. Introduction
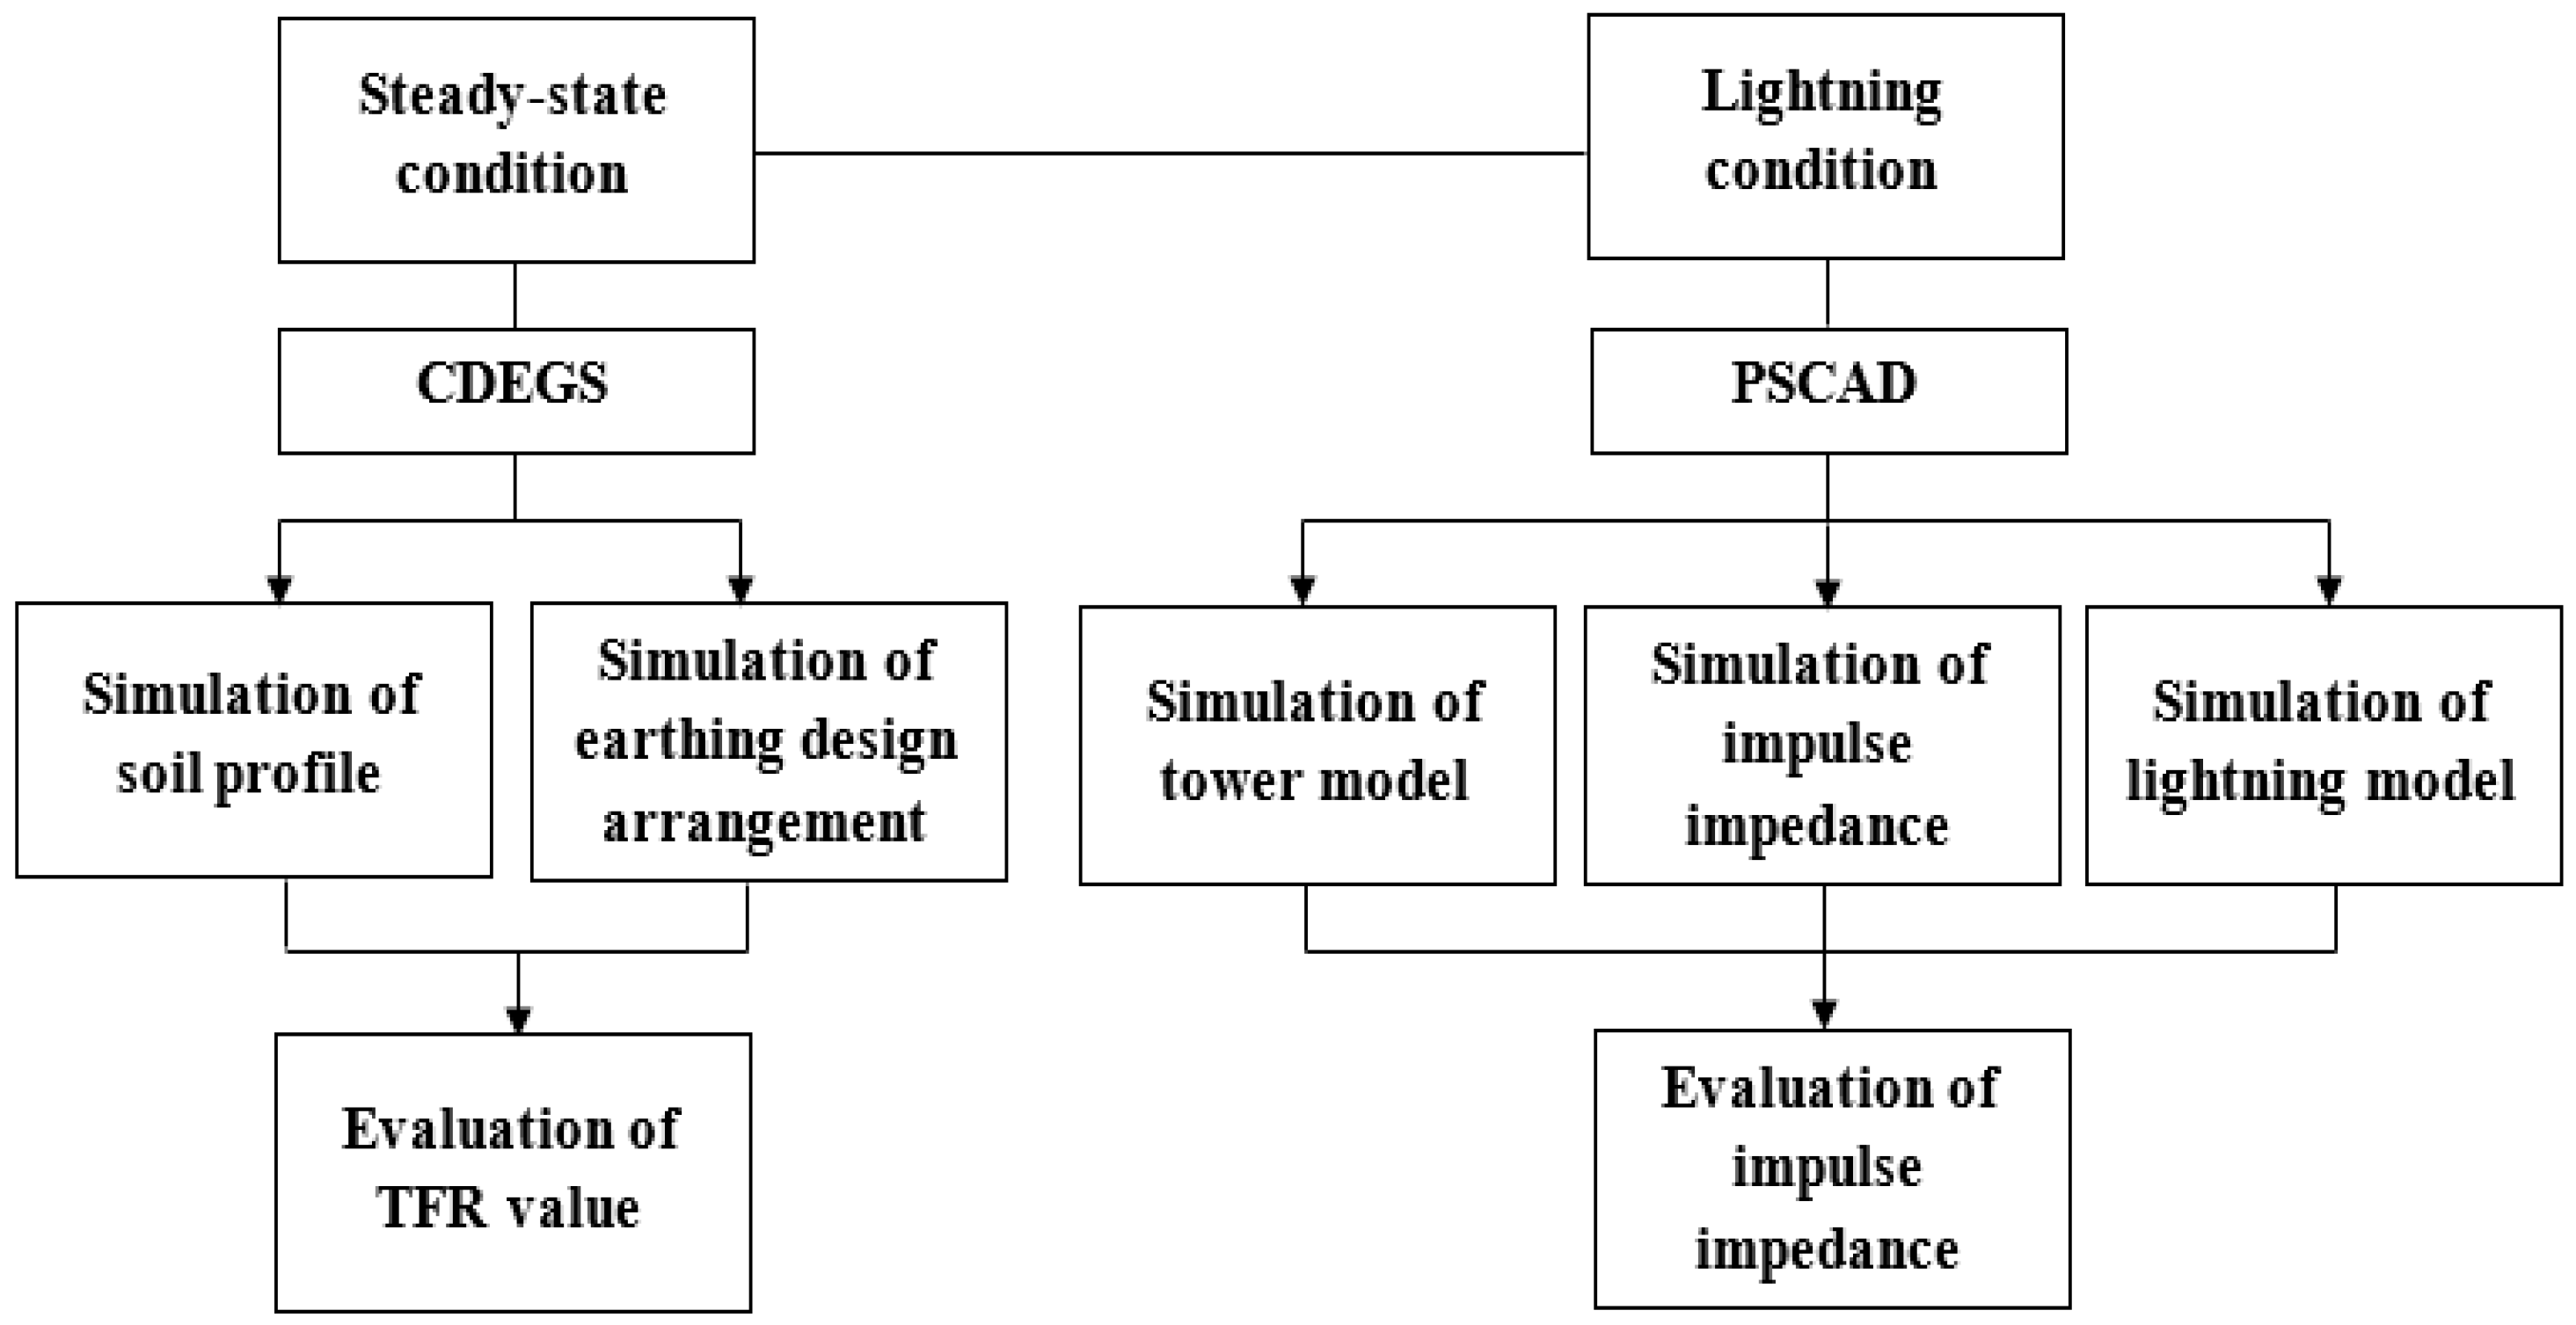
2. Methodology
2.1. Description of The Case Study
- Case study A: Soil profile interpretation
- Case A(1): Soil layer analysis
- Case A(2): Soil resistivity analysis
- Case study B: TFR of different earthing designs under steady-state using CDEGS
- Case B(1): Effect of design analysis
- Case B(2): Effect of soil profile analysis
- Case study C: Impulse impedance under lightning condition using PSCAD/EMTDC
- Case C(1): Effect of soil resistivity under 31 kA (10/350 µs) peak current
- Case C(2): Effect of current amplitude within 10 kA to 200 kA (10/350 µs) range
- Case C(3): Effect of lightning current waveshape of 10/350 µs and 8/20 µs at 31 kA peak current
2.2. Steady-State Condition
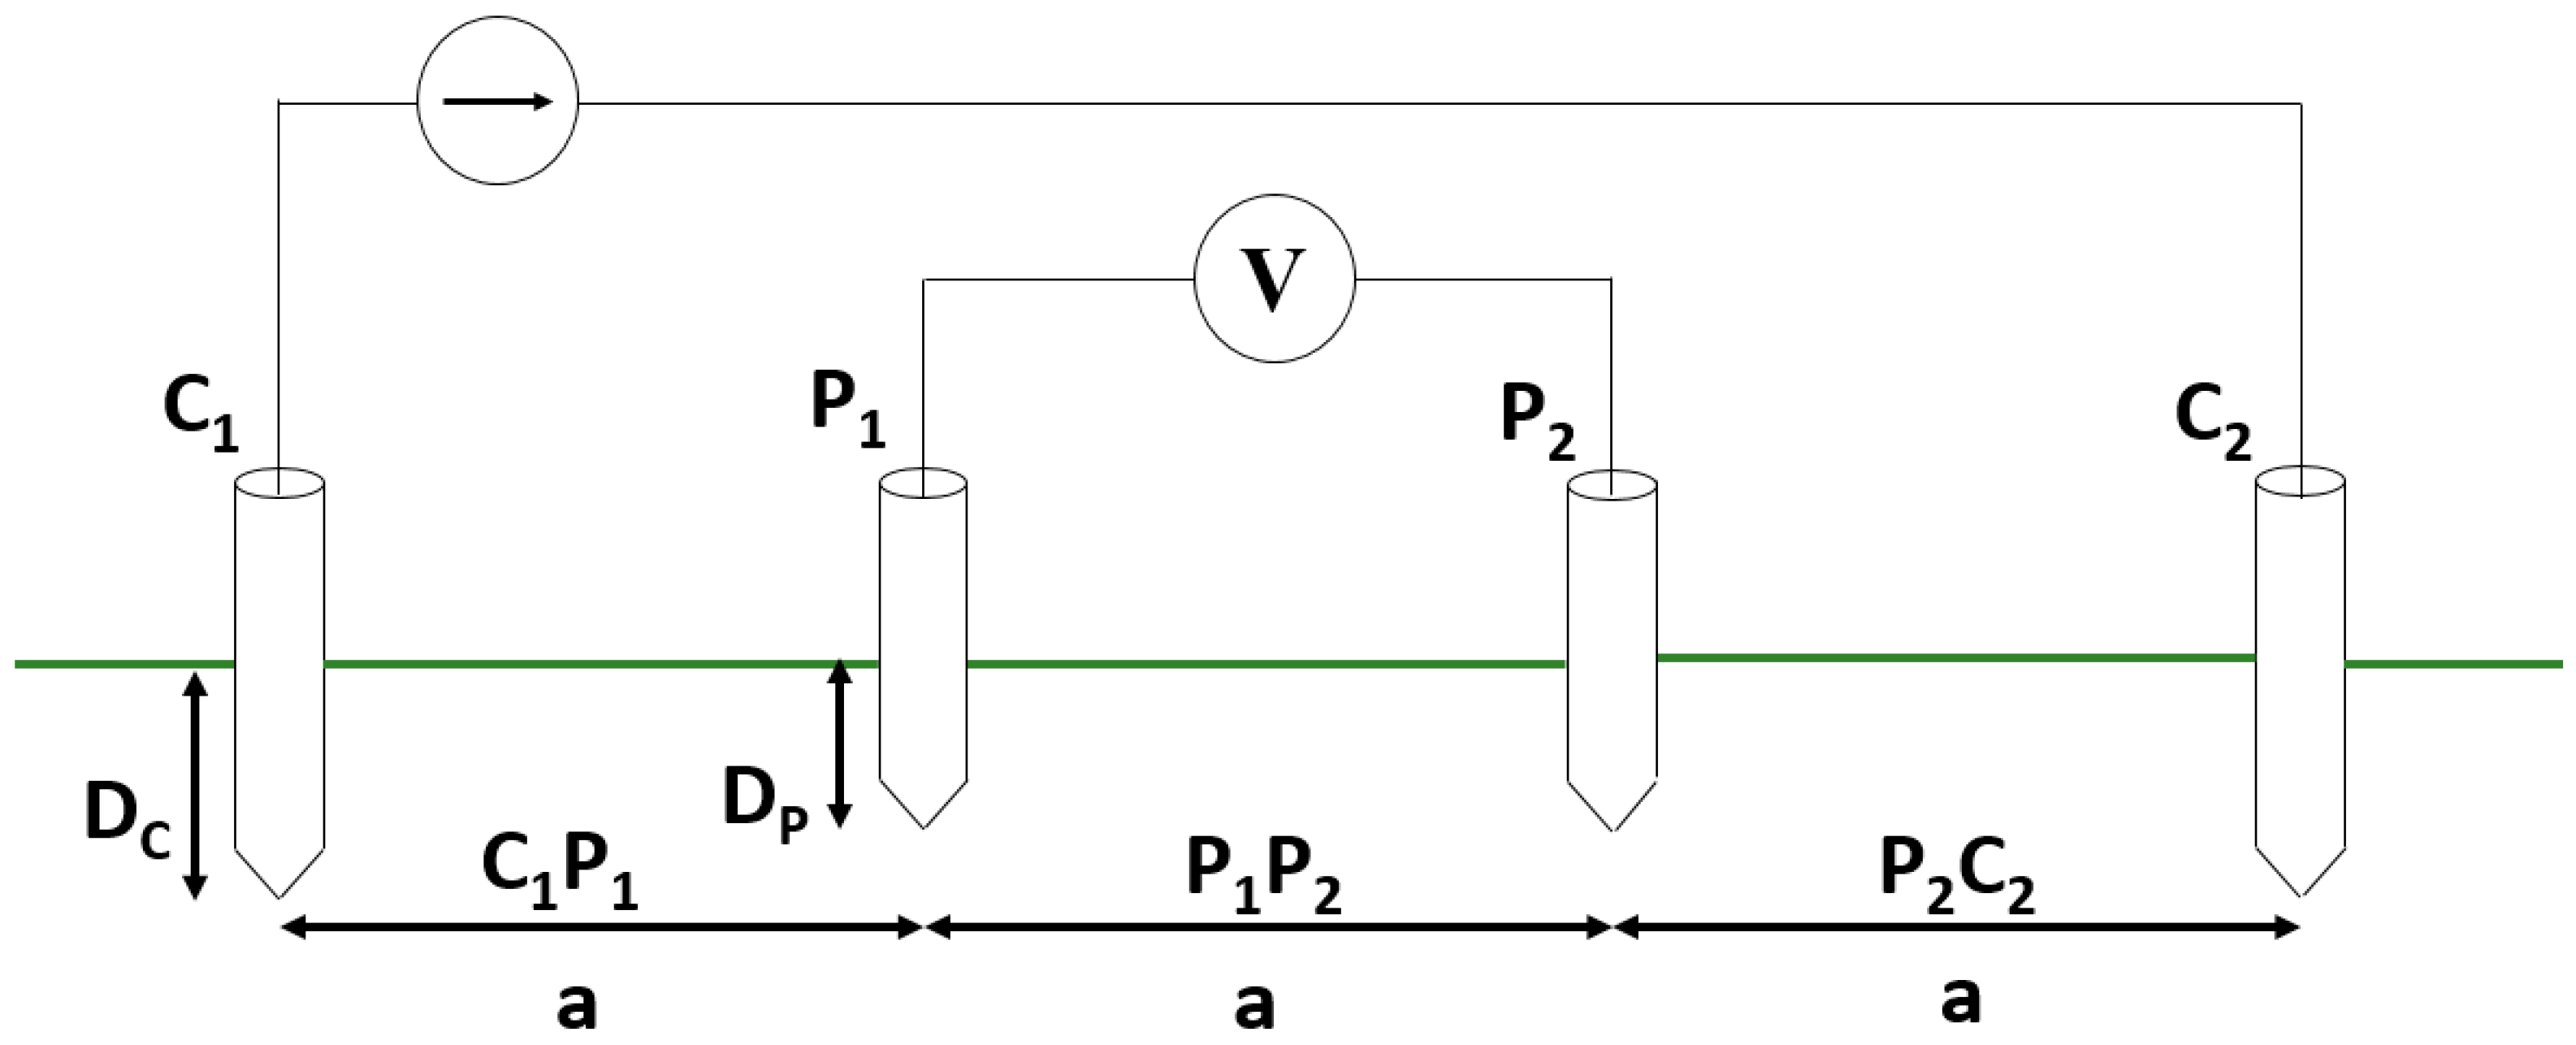
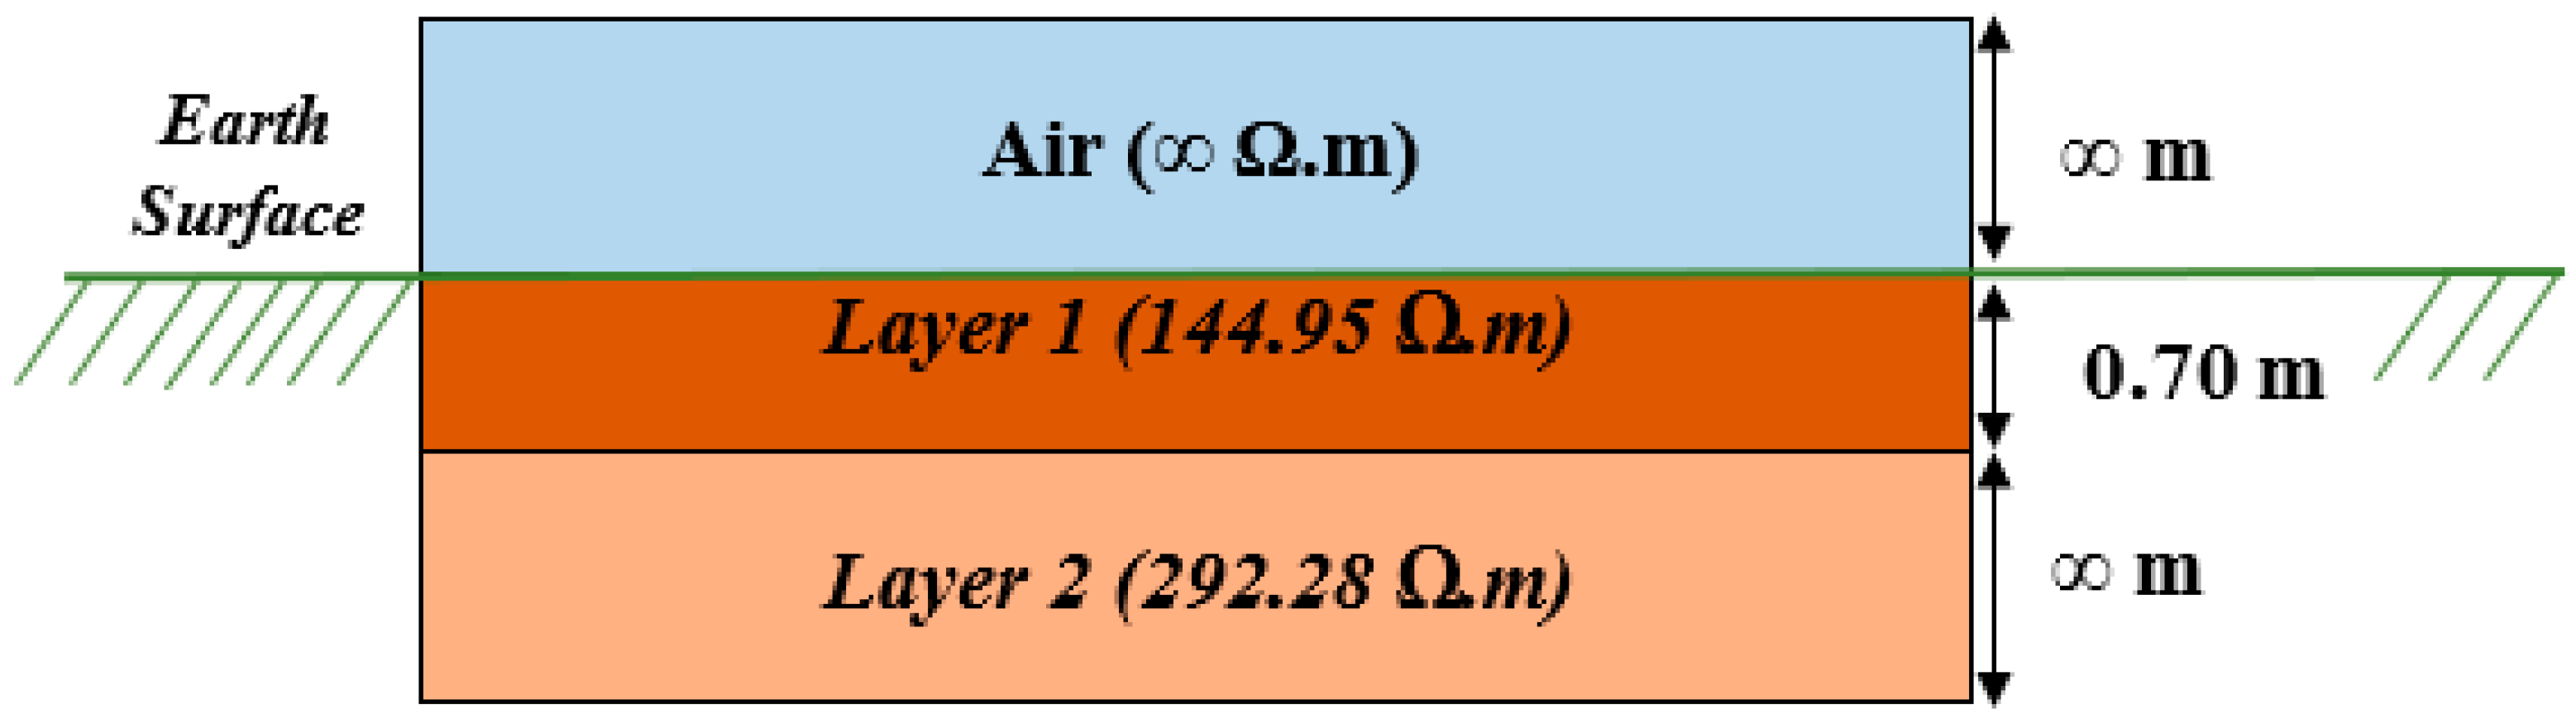
2.2.1. Soil Model
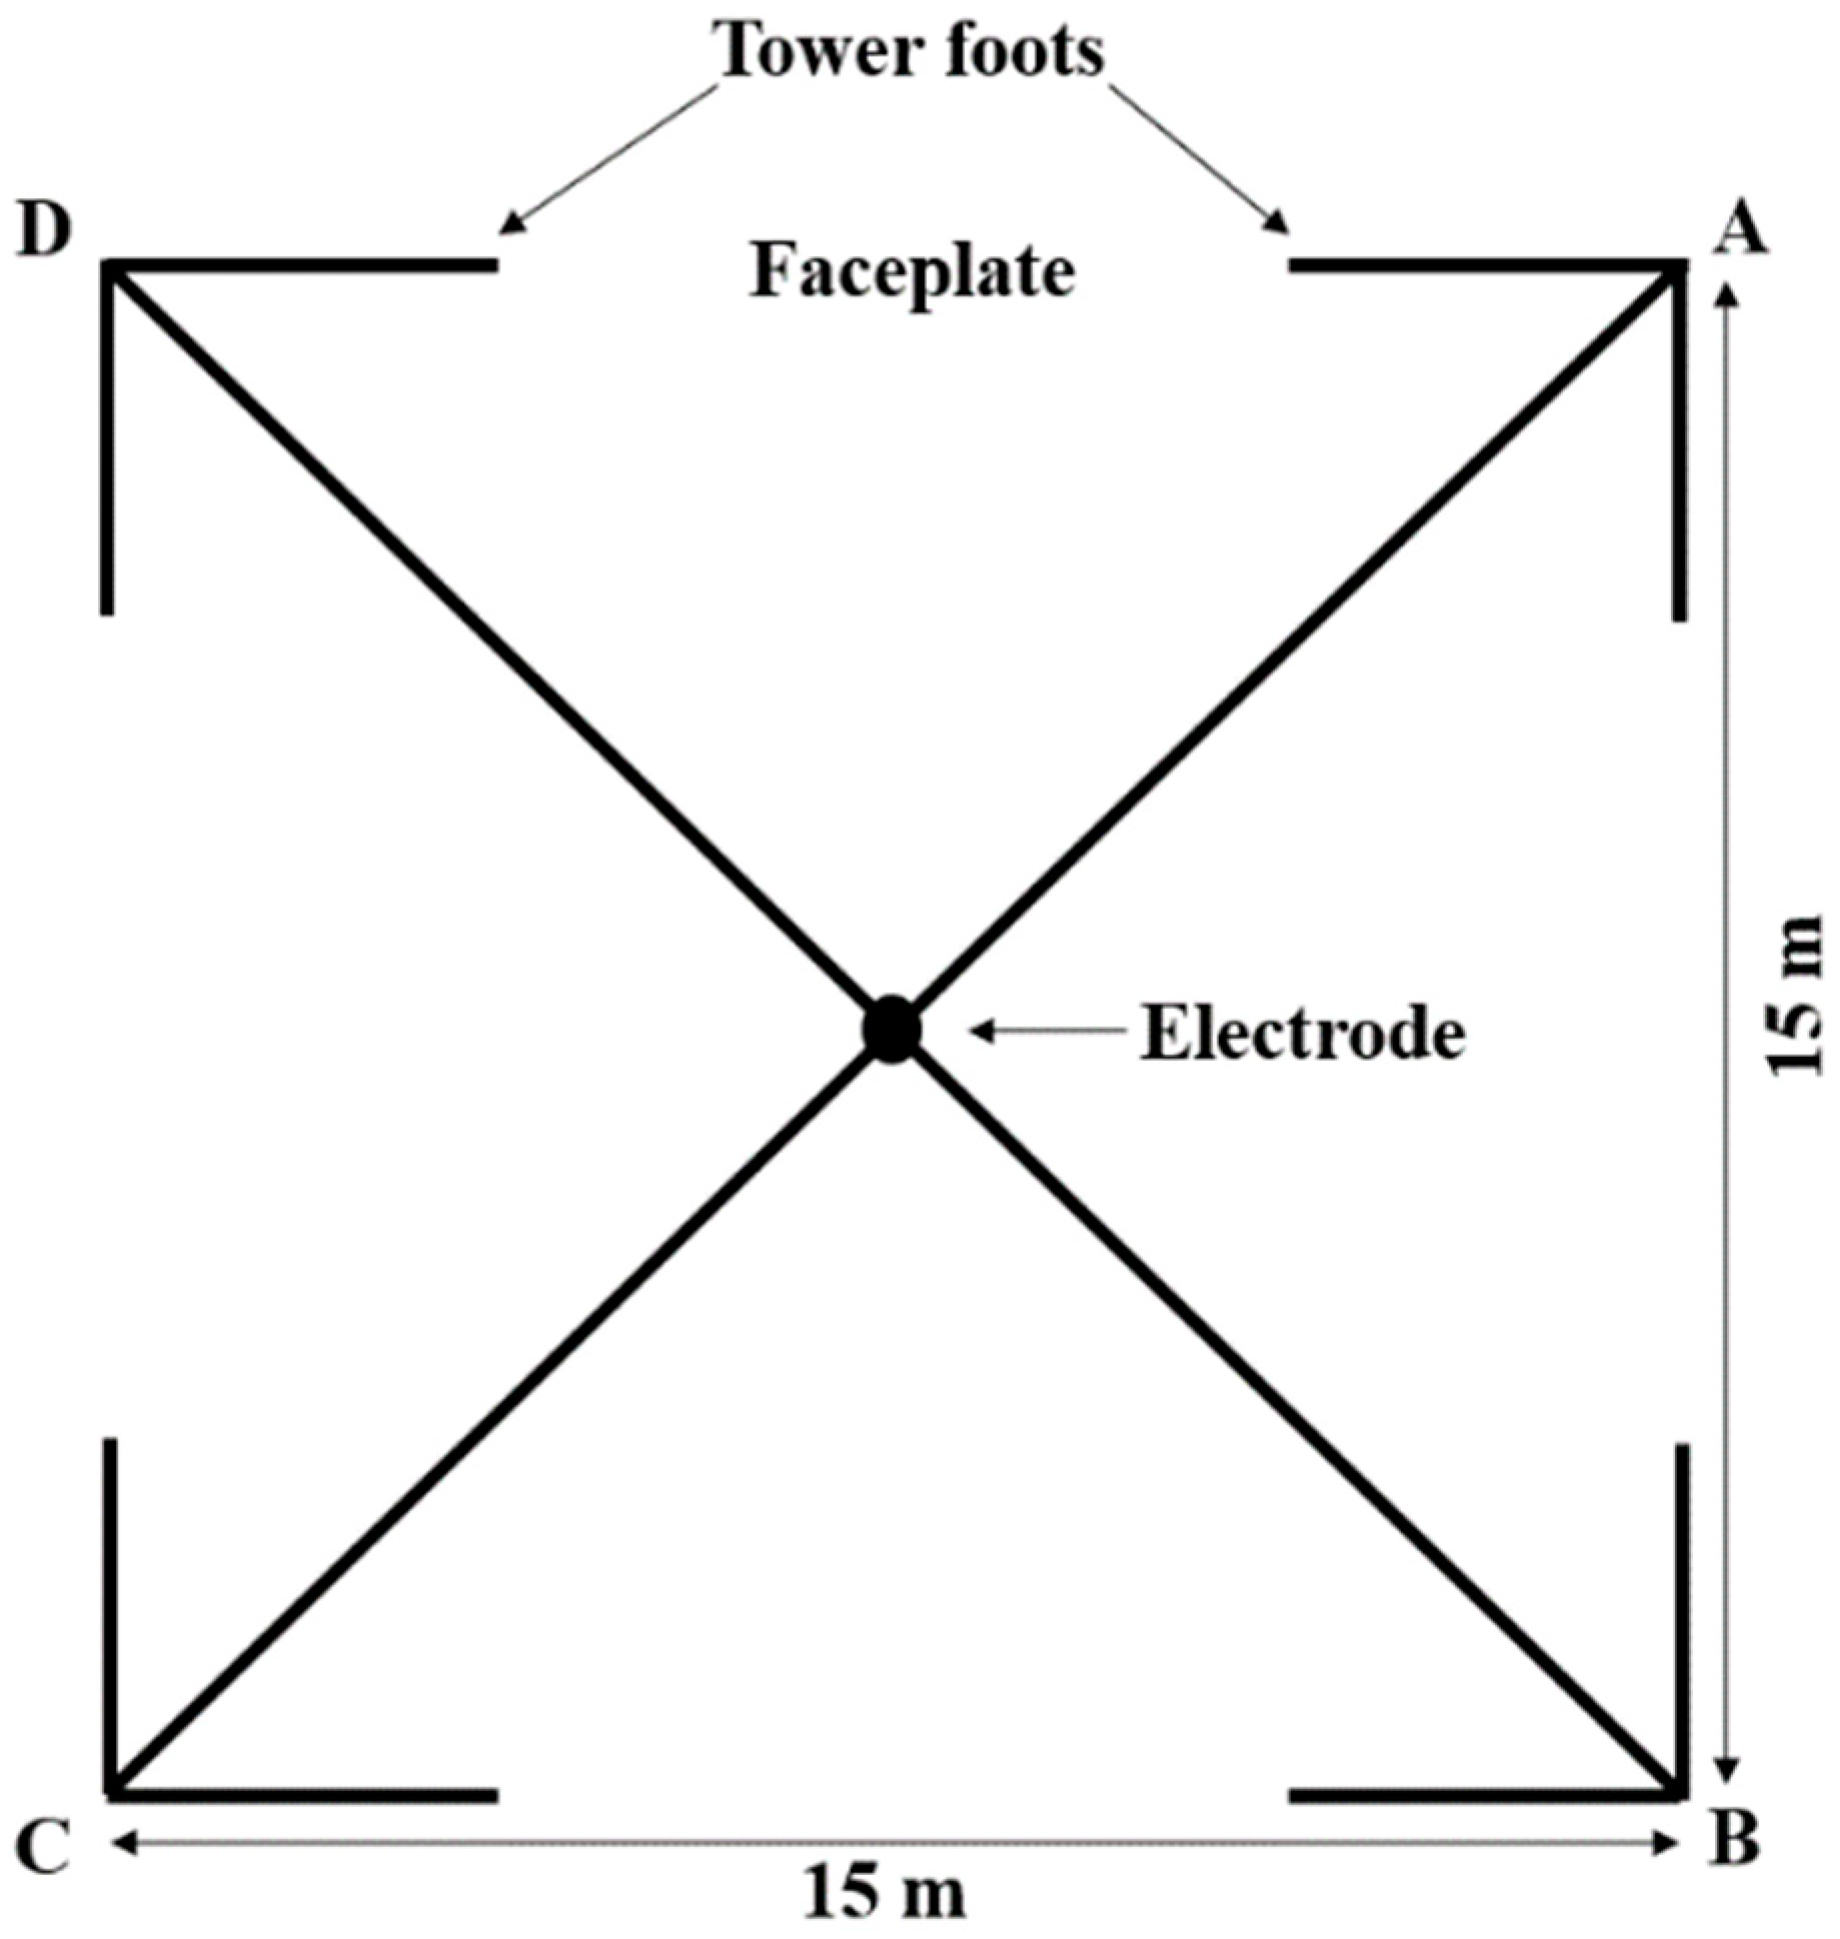
2.2.2. Earthing Model
2.3. Lightning Condition
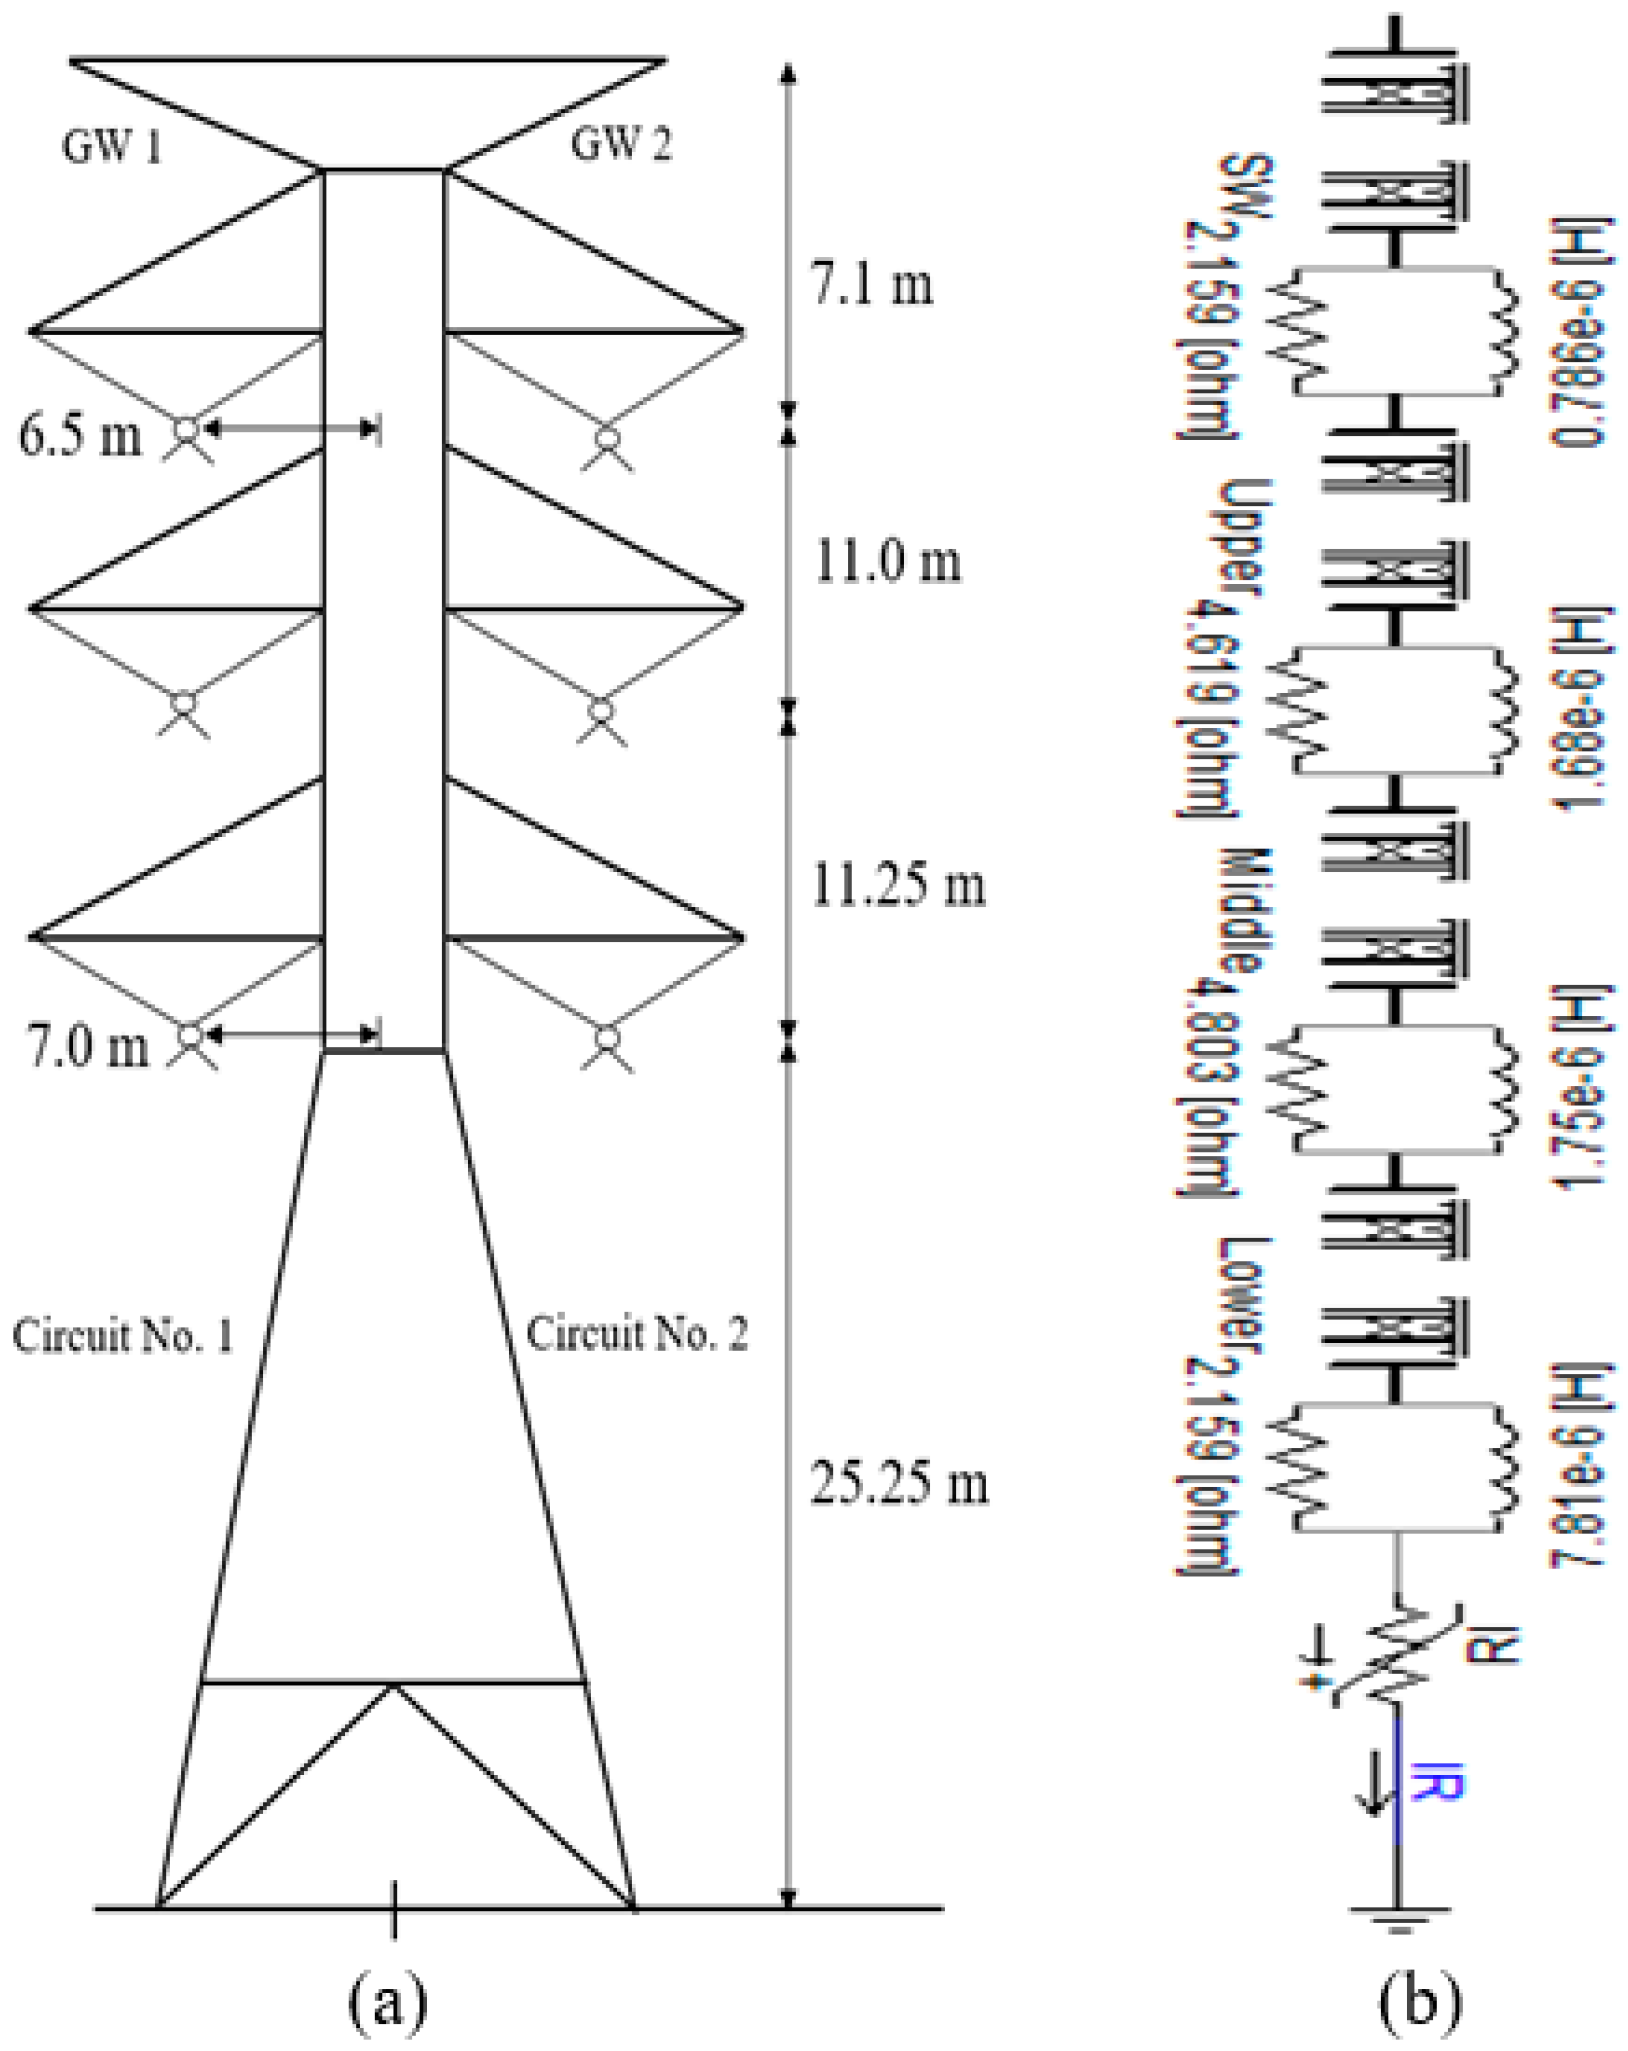
2.3.1. Tower Model
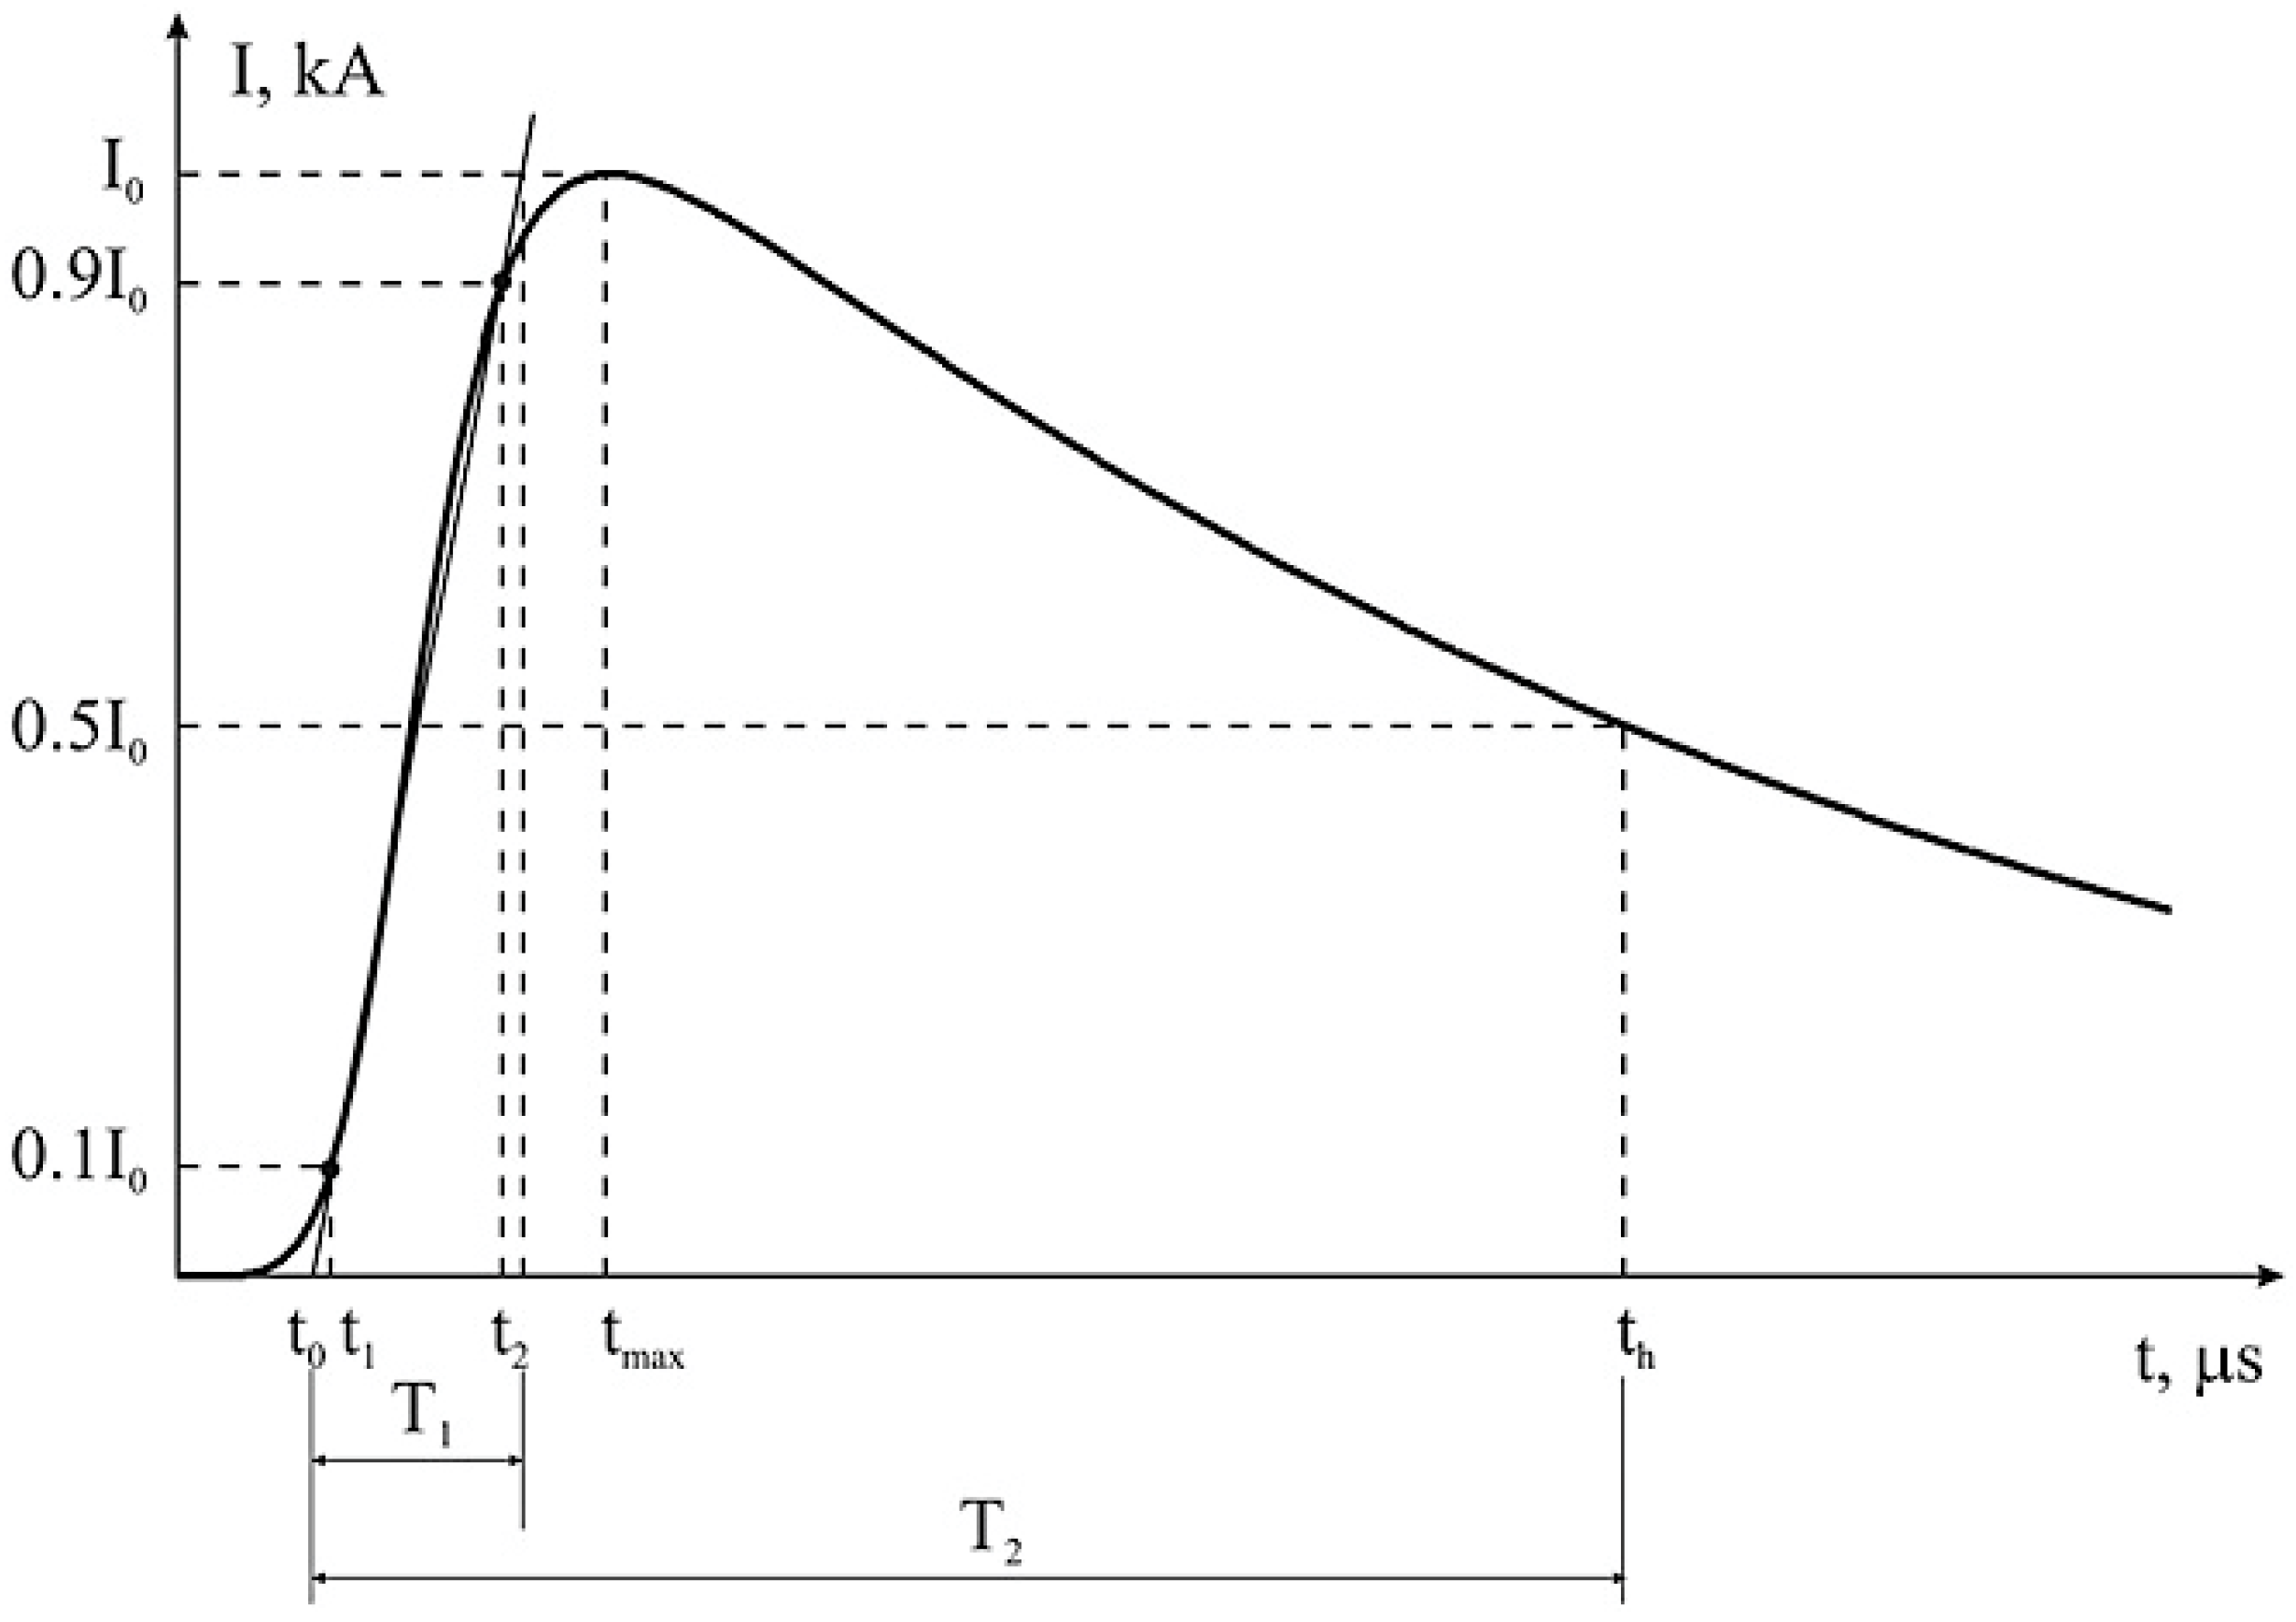
2.3.2. Lightning Current Model
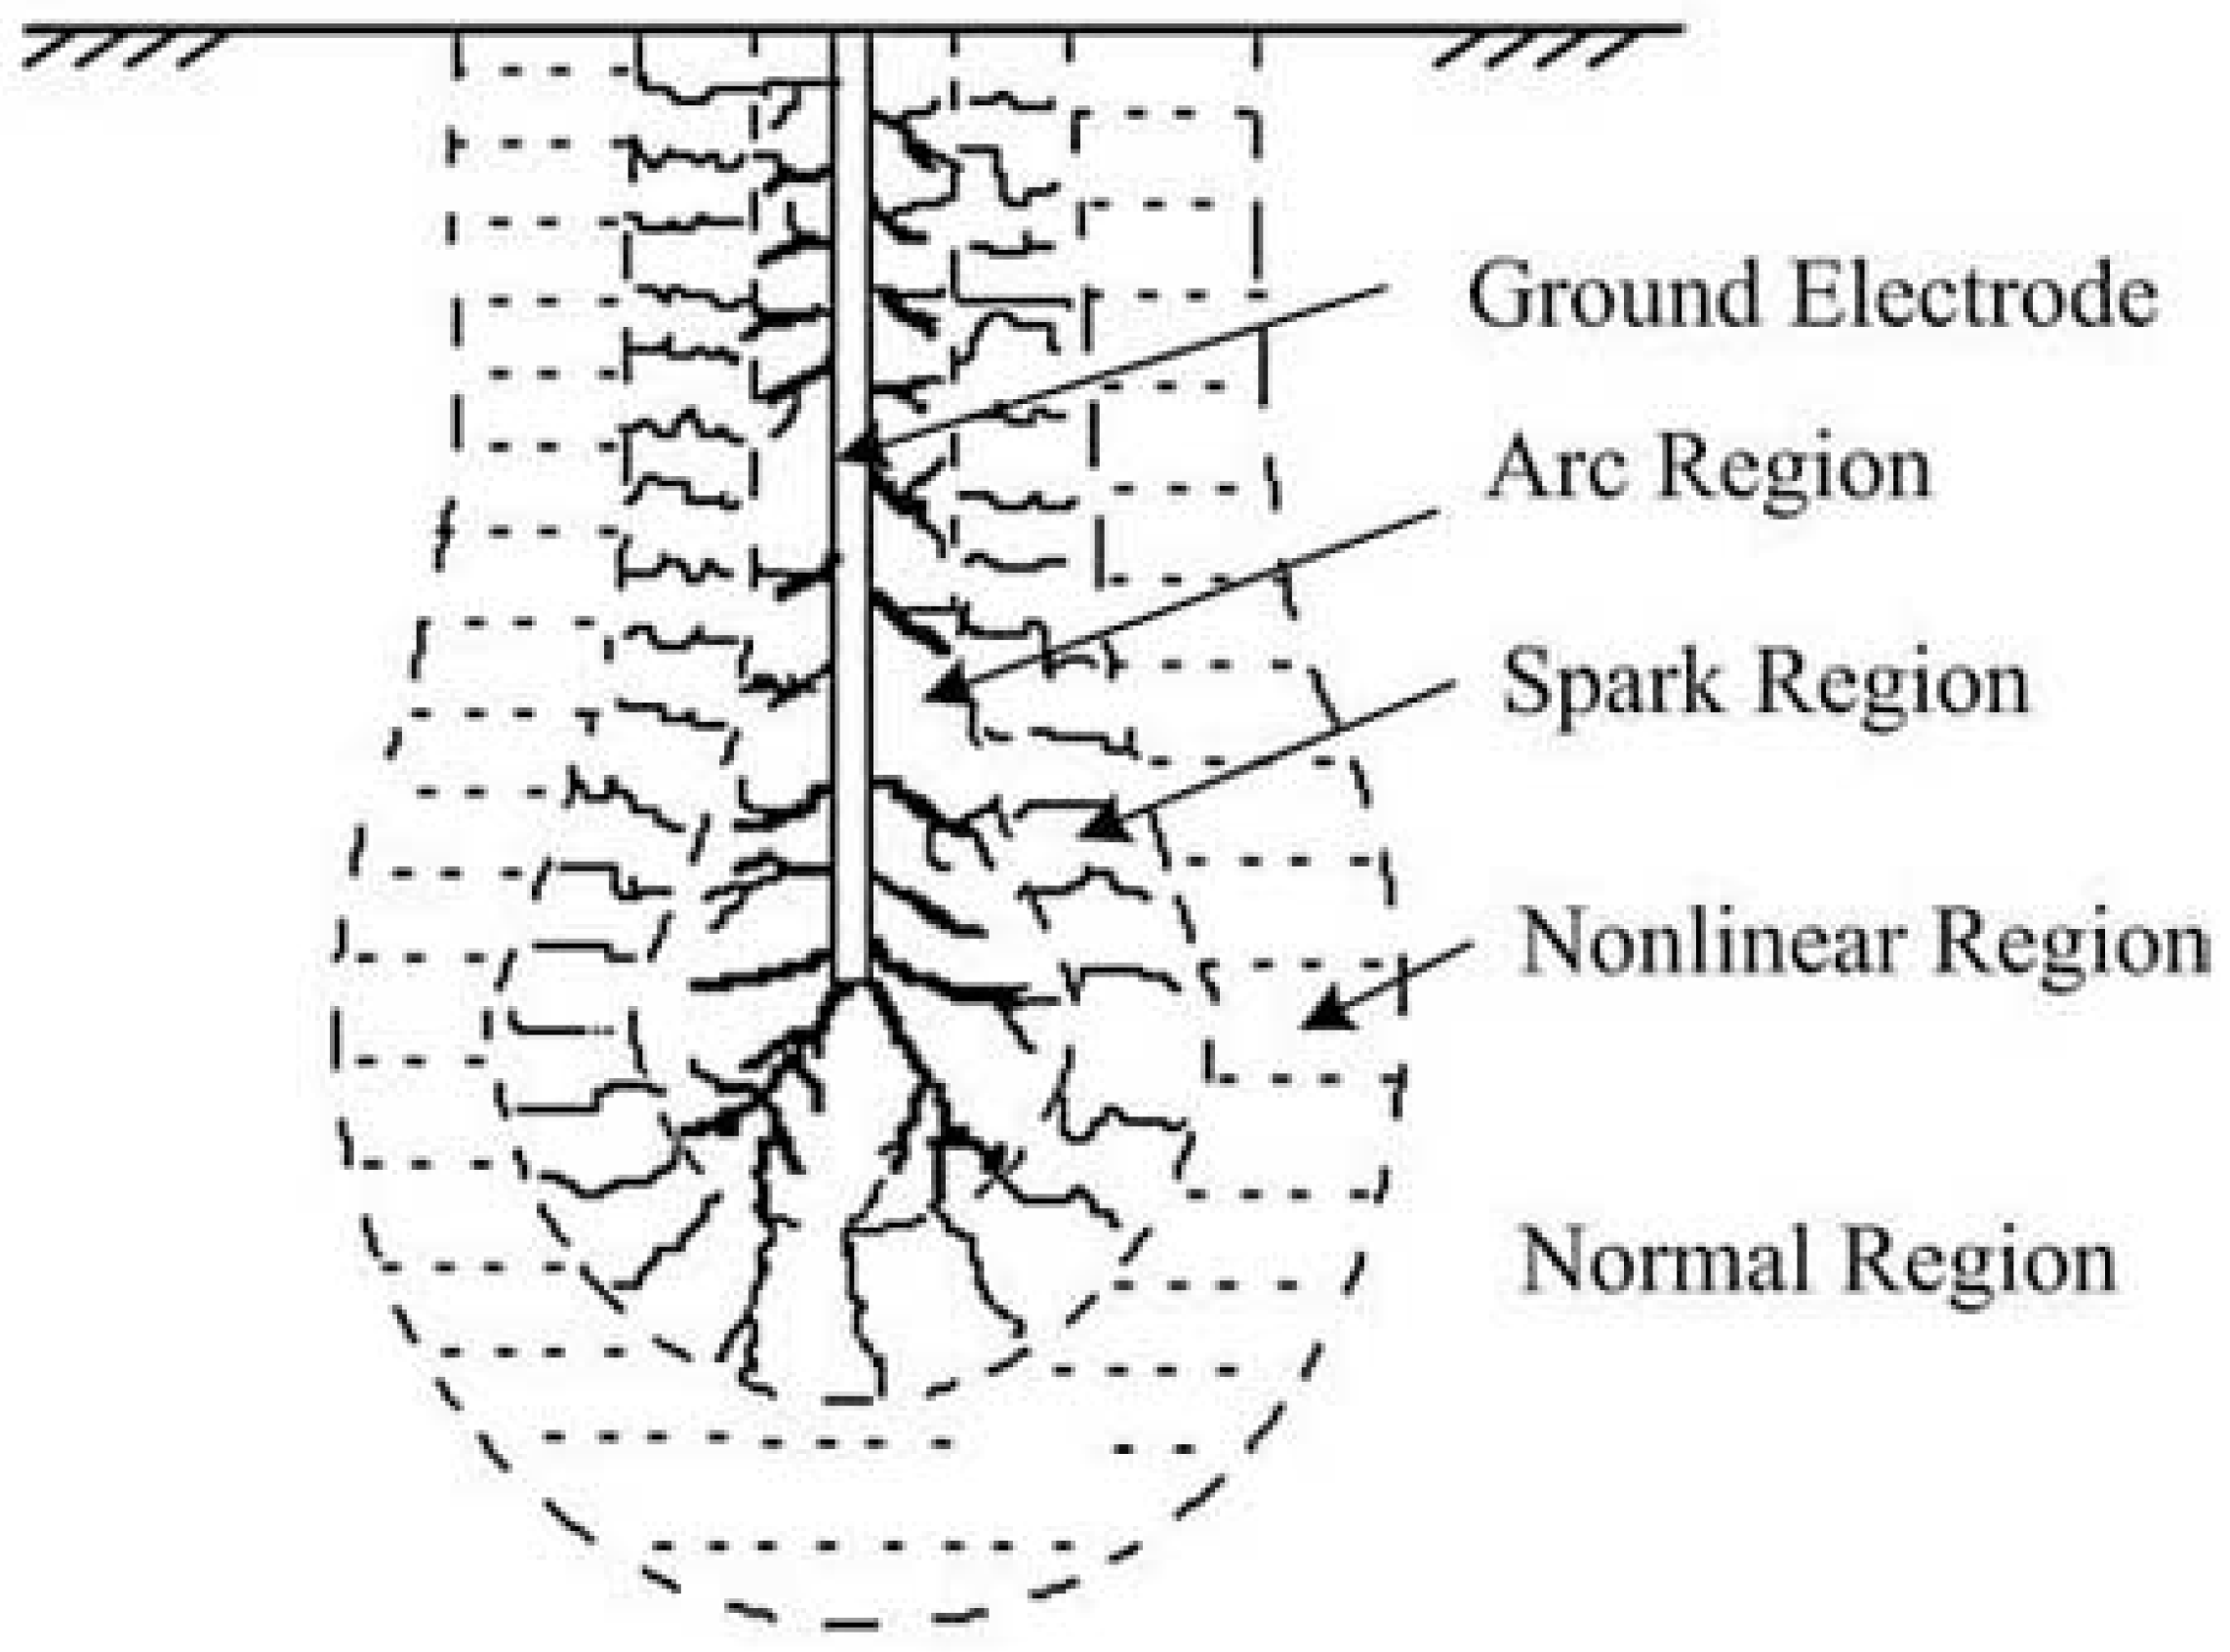
2.3.3. Tower Footing Model
3. Results and Discussion
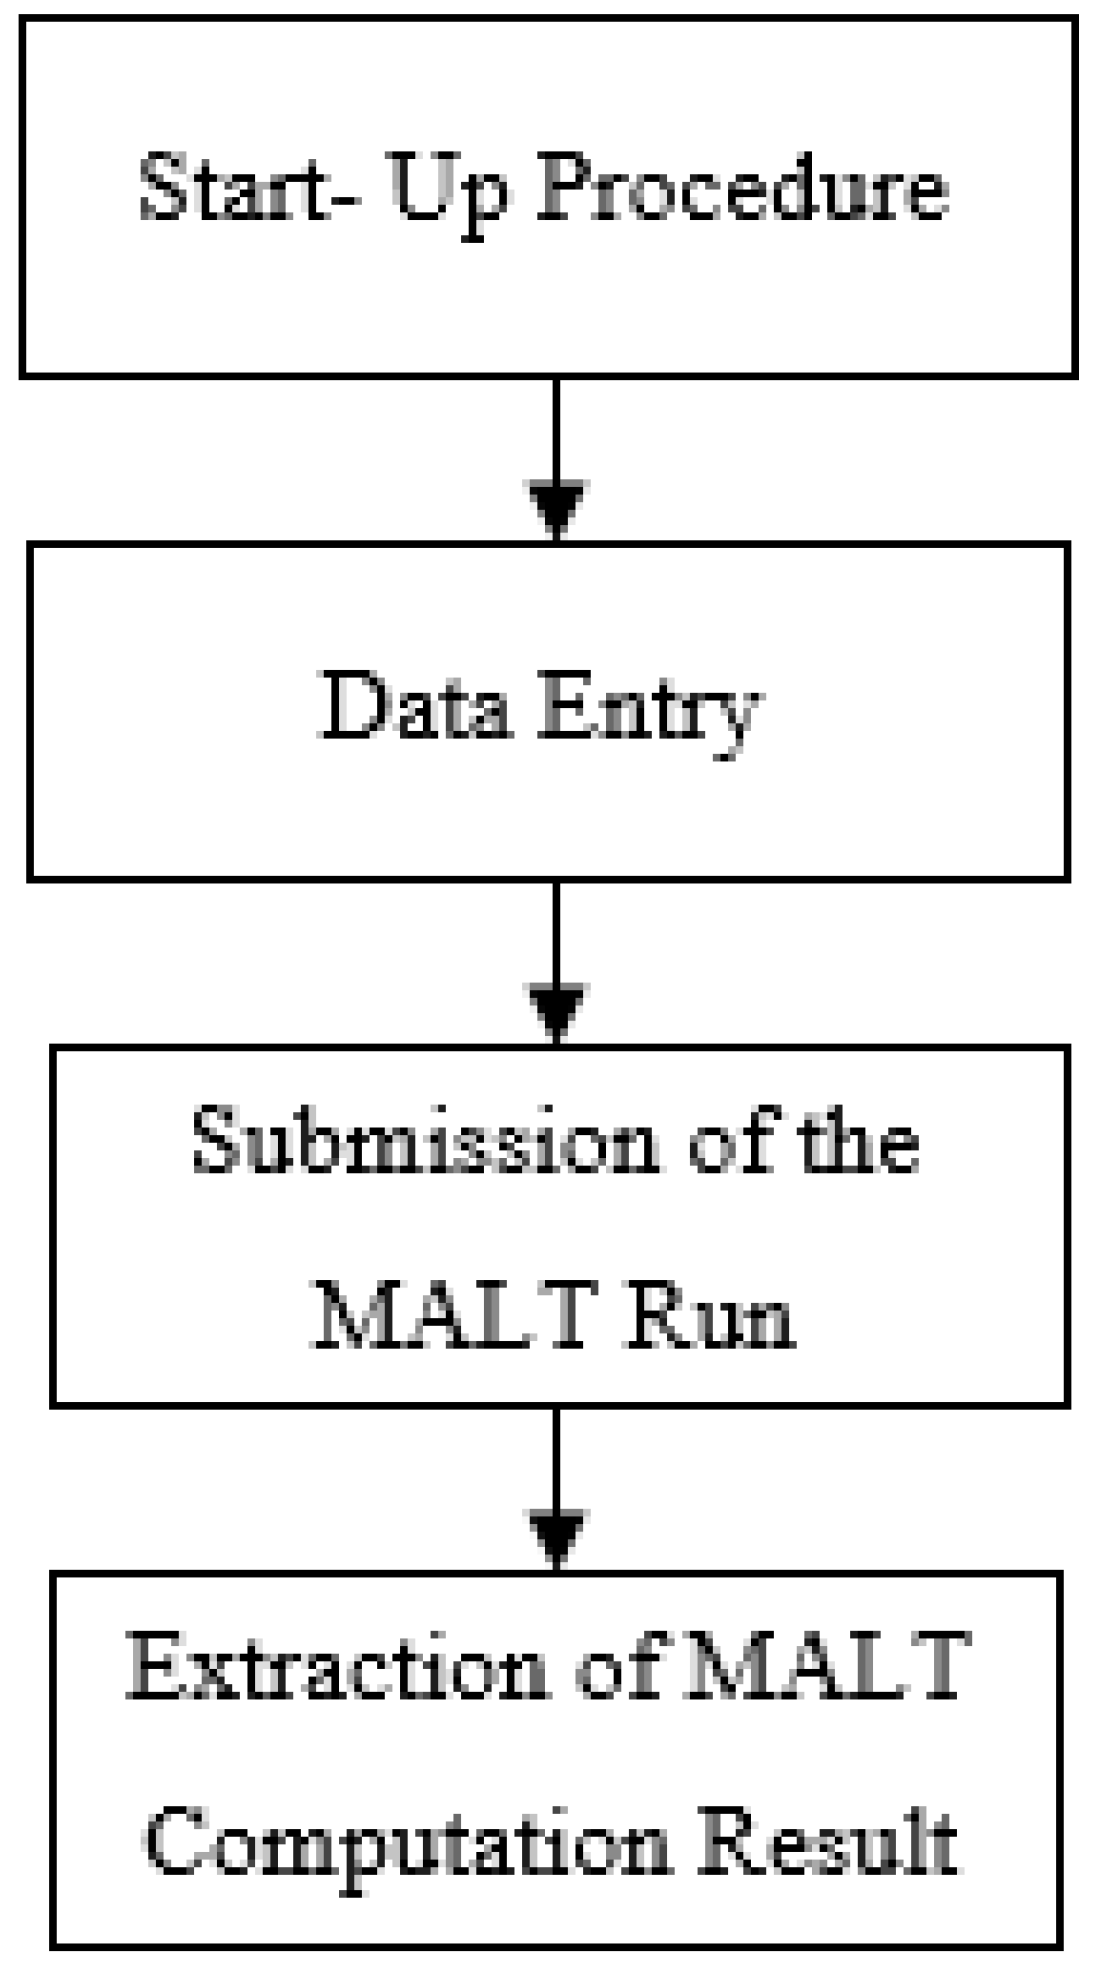
3.1. Computation of Soil Profile Interpretation
3.2. Computation of Tower Footing Resistance (TFR) under Steady-State
3.3. Computation of Tower Footing Impedance (TFI) under Lightning Conditions
3.3.1. Effect of Soil Resistivity
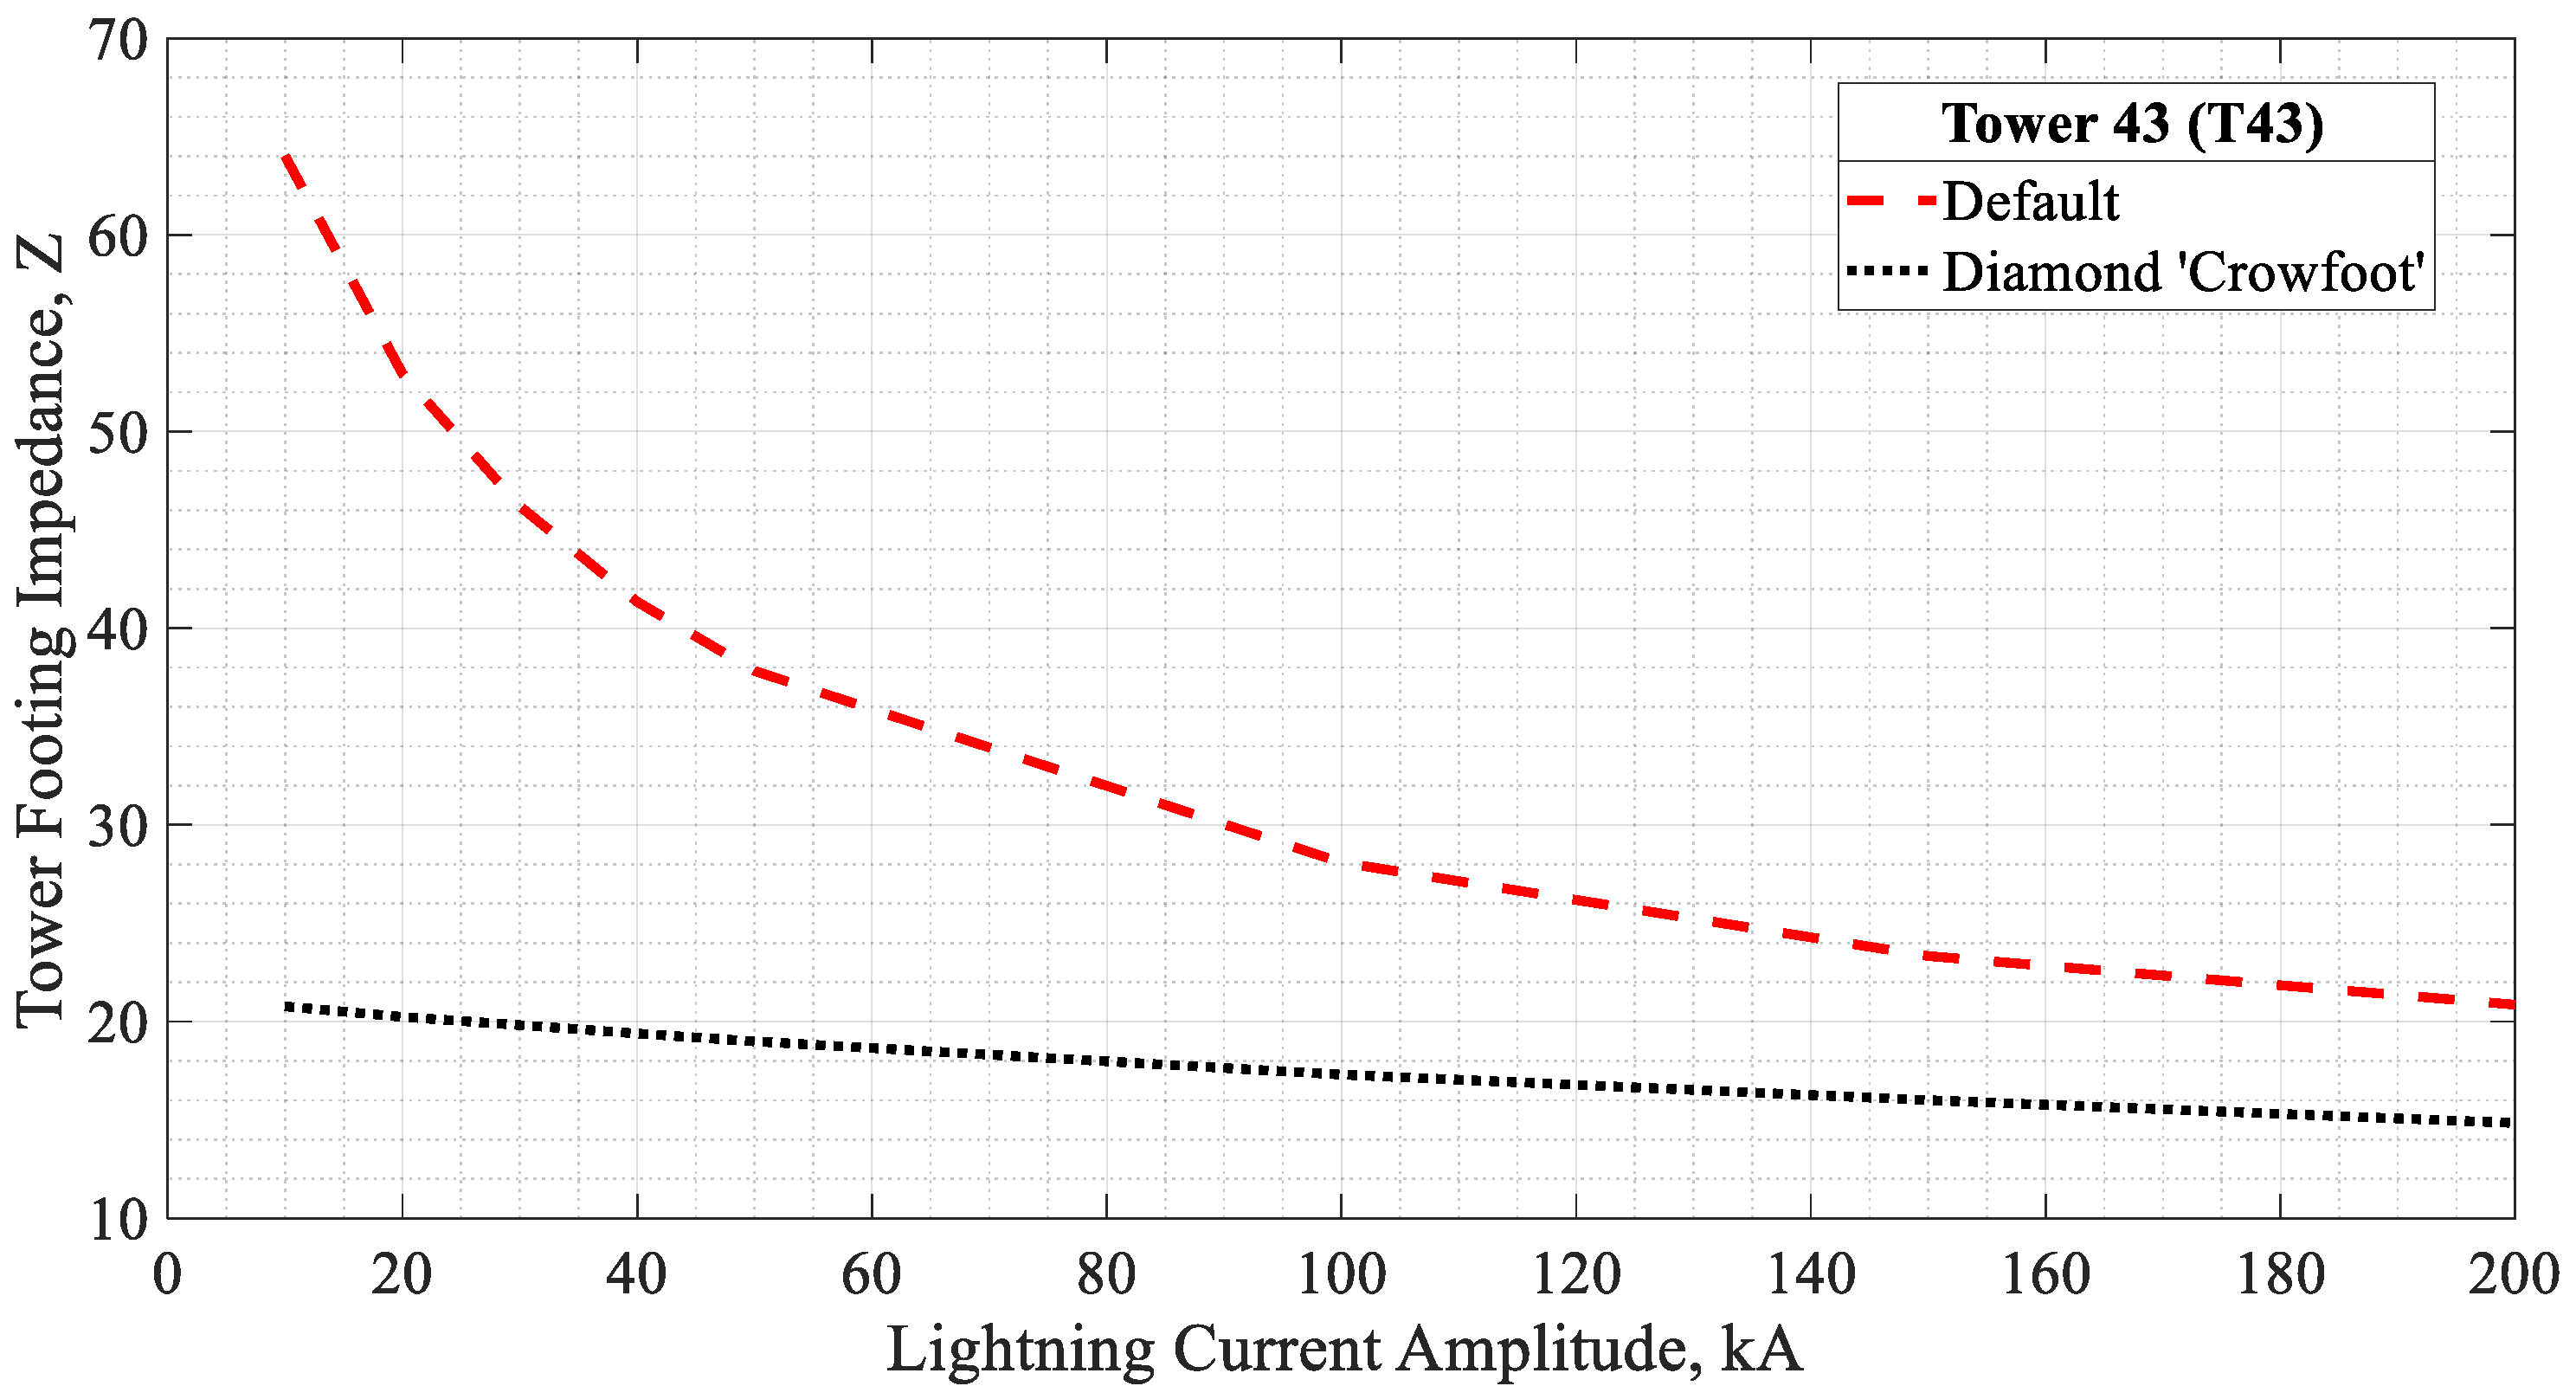
3.3.2. Effect of Current Amplitude
3.3.3. Effect of Lightning Waveshapes
4. Conclusions
Author Contributions
Funding
Institutional Review Board Statement
Informed Consent Statement
Data Availability Statement
Acknowledgments
Conflicts of Interest
References
- Grigsby, L.L. The Electrical Engineering Handbook Series, 2nd ed.; Dorf, R.C., Ed.; IEEE Press: Piscataway, NJ, USA, 2001; ISBN 0849385784. [Google Scholar]
- Wang, C.; Liang, X.; Adajar, E.; Loewen, P. Seasonal Variations of Tower Footing Impedance in Various Transmission Line Grounding Systems. In Proceedings of the IEEE Industry Applications Society Annual Meeting, Detroit, MI, USA, 10–16 October 2020. [Google Scholar]
- Gupta, B.P. Impulse characteristics of grounding electrodes. J. Inst. Eng. 1981, 64, 178–182. [Google Scholar]
- Gonos, I.F.; Stathopulos, I.A. Soil ionisation under lightning impulse voltages. IEE Proc. Sci. Meas. Technol. 2004, 151, 298–304. [Google Scholar] [CrossRef]
- Methods for Measuring the Earth Resistance of Transmission Towers Equipped with Earth Wires; WG. CA. 2.02; CIGRE: Paris, France, 2005.
- Batista, R.; Caetano, C.E.F.; Paulino, J.O.S.; Boaventura, W.C.; Lopes, I.J.S.; Cardoso, E.N. A study of grounding arrangements composed by vertical electrodes for two-layered stratified soil models. Electr. Power Syst. Res. 2020, 180, 106129. [Google Scholar] [CrossRef]
- Tung, C.C.; Lim, S.C. Performance of electrical grounding system in soil at low moisture content condition at various compression levels. J. Eng. Sci. Technol. 2017, 12, 27–47. [Google Scholar]
- Illias, H.A.; Su, C.S.; Bakar, A.H.A. Investigation on soil resistivity of two-layer soil structures using finite element analysis method. IET Sci. Meas. Technol. 2021, 15, 120–129. [Google Scholar] [CrossRef]
- Permal, N.; Osman, M.; Ariffin, A.M.; Kadir, M.Z.A.A. The impact of substation grounding grid design parameters in non-homogenous soil to the grid safety threshold parameters. IEEE Access 2021, 9, 37497–37509. [Google Scholar] [CrossRef]
- TNB. Supplementary Document TTS-LN-TES (-S-): 500/275/132 kV Monopole and Lattice Tower Earthing Design; Tenaga Nasional Berhad: Kuala Lumpur, Malaysia, 2020. [Google Scholar]
- He, J.; Zeng, R.; Zhang, B. Methodology and Technology for Power System Grounding, 1st ed.; John Wiley & Sons Singapore Pte. Ltd.: Singapore, 2012; ISBN 9781118254950. [Google Scholar]
- Arias Velásquez, R.M.; Mejía Lara, J.V. Failures in overhead lines grounding system and a new improve in the IEEE and national standards. Eng. Fail. Anal. 2019, 100, 103–118. [Google Scholar] [CrossRef]
- Koehler, F.; Swingler, J. Unconventional flashover mitigation measures to improve the lightning performance of transmission lines. In Proceedings of the IET International Conference on Resilience of Transmission and Distribution Networks (RTDN 2017), Birmingham, UK, 26–28 September 2017. [Google Scholar]
- Yasuda, Y.; Hirakawa, Y.; The, N.; Electric, K.; Co, P. Flashover analysis 500 kV transmission grounding resistance. IEEJ Trans. Power Energy 2000, 120, 56–62. [Google Scholar] [CrossRef] [Green Version]
- Wong, C.; Yusop, Z.; Ismail, T. Trend of daily rainfall and temperature in Peninsular Malaysia based on gridded data set. Int. J. Geomate 2018, 14, 65–72. [Google Scholar] [CrossRef]
- Kosztaluk, R. Experimental study of transient ground impedances. IEEE Trans. Power Appar. Syst. 1981, PAS–100, 4653–4660. [Google Scholar] [CrossRef]
- Moreno, J.; Simon, P.; Faleiro, E.; Asensio, G.; Fernandez, J.A. Estimation of an upper bound to the value of the step potentials in two-layered soils from grounding resistance measurements. Materials 2020, 13, 290. [Google Scholar] [CrossRef] [PubMed] [Green Version]
- Ali, A.W.A.; Ahmad, N.N.; Mohamad Nor, N.; Idris, N.F.; Hanaffi, F. Investigations on the performance of grounding device with spike rods (GDSR) with the effects of soil resistivity and configurations. Energies 2020, 13, 3538. [Google Scholar] [CrossRef]
- Reffin, M.S.; Ali, A.W.A.; Nor, N.M.; Ahmad, N.N.; Abdullah, S.A.S.; Mahmud, A.; Hanaffi, F. Seasonal influences on the impulse characteristics of grounding systems for tropical countries. Energies 2019, 12, 1334. [Google Scholar] [CrossRef] [Green Version]
- Yang, T. Study of reducing ground resistance for transmission tower on rocky mountain tops with constrained area. IEEJE Trans. Electr. Electron. Eng. 2015, 10, 249–255. [Google Scholar] [CrossRef]
- Rong, Z.; Shuiming, C.; Siyun, L.; Weihan, W.; Jinliang, H. Impulse characteristics of grounding systems of transmission-line towers in the region with high soil resistivity. In Proceedings of the TENCON ’93. IEEE Region 10 International Conference on Computers, Communications and Automation, Beijing, China, 19–21 October 1993; IEEE: Piscataway, NJ, USA, 2002; pp. 454–457. [Google Scholar] [CrossRef]
- Pavel, S.G.; Maier, V.; Ciorca, C.; Beleiu, H.G.; Birou, I. Optimal design of the vertical earthing with electrodes arranged in line. Appl. Sci. 2020, 10, 1177. [Google Scholar] [CrossRef] [Green Version]
- Androvitsaneas, V.P.; Damianaki, K.D.; Christodoulou, C.A.; Gonos, I.F. Effect of soil resistivity measurement on the safe design of grounding systems. Energies 2020, 13, 3170. [Google Scholar] [CrossRef]
- Luo, D.; Cao, Y.; Zhang, Y.; Xie, S.; Zhang, C.; Cao, S. Study on structural parameters and analysis method of soil successive impulse discharge channel. Energies 2021, 14, 877. [Google Scholar] [CrossRef]
- Moradi, M. Analysis of transient performance of grounding system considering frequency-dependent soil parameters and ionization. IEEE Trans. Electromagn. Compat. 2020, 62, 785–797. [Google Scholar] [CrossRef]
- He, J.; Zhang, B. Soil ionization phenomenon around grounding electrode under lightning impulse. In Proceedings of the 2013 Asia-Pacific Symposium on Electromagnetic Compatibility (APEMC), Melbourne, VIC, Australia, 20–23 May 2013; pp. 2–6. [Google Scholar] [CrossRef]
- Sekioka, S.; Lorentzou, M.I.; Philippakou, M.P.; Prousalidis, J.M. Current-dependent grounding resistance model based on energy balance of soil ionization. IEEE Trans. Power Deliv. 2006, 21, 194–201. [Google Scholar] [CrossRef]
- Gazzana, D.S.; Bretas, A.S.; Dias, G.A.D.; Tello, M.; Thomas, D.W.P.; Christopoulos, C. The transmission line modeling method to represent the soil ionization phenomenon in grounding systems. IEEE Trans. Magn. 2014, 50, 505–508. [Google Scholar] [CrossRef]
- Mokhtari, M.; Abdul-malek, Z. The effect of grounding electrode parameters on soil ionization and transient grounding resistance using electromagnetic field approach. Appl. Mech. Mater. 2014, 554, 628–632. [Google Scholar] [CrossRef]
- Elzowawi, A.E. Laboratory Characterisation of Soil Ionisation under Impulse Voltages. Ph.D. Thesis, Cardiff University, Cardiff, UK, 2016. [Google Scholar]
- Gouda, O.E.; El-Saied, T.; Salem, W.A.A.; Khater, A.M.A. Evaluations of the apparent soil resistivity and the reflection factor effects on the grounding grid performance in three-layer soils. IET Sci. Meas. Technol. 2019, 13, 469–477. [Google Scholar] [CrossRef]
- Choi, J.H.; Lee, B.H. An analysis on the Frequency-dependent grounding impedance based on the ground current dissipation of counterpoises in the two-layered soils. J. Electrostat. 2012, 70, 184–191. [Google Scholar] [CrossRef]
- Mokhtari, M.; Abdul-Malek, Z.; Gharehpetian, G.B. A critical review on soil ionisation modelling for grounding electrodes. Arch. Electr. Eng. 2016, 65, 449–461. [Google Scholar] [CrossRef]
- Guide to Procedures for Estimating the Lightning Performance of Transmission Lines; WG 01, Study Committee 33; CIGRE: Paris, France, 1991; Volume 1.
- IEEE std 1410. IEEE Guide for Improving the Lightning Performance of Transmission Lines; IEEE-SA Standards Board: New York, NY, USA, 1997. [Google Scholar]
- EPRI. Handbook for Improving Overhead Transmission Line Lightning Performance; EPRI: Palo Alto, CA, USA, 2004. [Google Scholar]
- Kadir, M.Z.A.A.; Cotton, I. Application of the insulator coordination gap models and effect of line design to backflashover studies. Int. J. Electr. Power Energy Syst. 2010, 32, 443–449. [Google Scholar] [CrossRef]
- Rawi, I.; Kadir, M.Z.A.A.; Izadi, M. Seasonal variation of transmission line outages in Peninsular. Pertanika J. Sci. Technol. 2017, 25, 213–220. [Google Scholar]
- IEEE std 1410. IEEE Guide for Improving the Lightning Performance of Electric Power Overhead Distribution Lines; IEEE-SA Standard Board: New York, NY, USA, 2004. [Google Scholar]
- Rameli, N.; Ab Kadir, M.Z.A.; Izadi, M.; Gomes, C.; Jasni, J. Evaluation of lightning induced voltage due to the effect of design parameters on medium voltage distribution line. J. Teknol. (Sci. Eng.) 2013, 64, 151–155. [Google Scholar] [CrossRef] [Green Version]
- Vita, V.; Maris, T.I. Sensitivity analyses of parameters that affect the lightning performance of distribution networks with distributed generation. J. Multidiscip. Eng. Sci. Stud. 2016, 2, 774–781. [Google Scholar]
- Power System Technical Performance: Procedures for Estimating the Lightning Performance of Transmission Lines-New Aspects; WG C4. 23; CIGRE Technical Brochure 839; CIGRE: Paris, France, 2020.
- SES & Technologies Ltd. A Simple Substation Grounding Grid Analysis; SES: Montreal, QC, Canada, 2017. [Google Scholar]
- Manitoba HVDC Research Centre. A Comprenhensive Resource for EMTDC Users’s Guide: Transient Analysis for PSCAD Power System Simulation; Manitoba Hydro International Ltd.: Winnipeg, MB, Canada, 2010. [Google Scholar]
- Manitoba HVDC Research Centre. Power Systems Computer Aided Design (PSCAD) User’s Guide; Manitoba Hydro International Ltd.: Winnipeg, MB, Canada, 2018. [Google Scholar]
- Rawi, I.M. Establishment of Optimal Externally Gapped Line Arrester Specification for 500 kV Transmission Line in Malaysia; Universiti Putra Malaysia: Seri Kembangan, Malaysia, 2017. [Google Scholar]
- Reffin, M.S.; Nor, N.M.; Ahmad, N.N.; Abdullah, S. Performance of practical grounding systems under high impulse conditions. Energies 2018, 11, 3187. [Google Scholar] [CrossRef] [Green Version]
- Hasan, H.; Hamzehbahmani, H.; Robson, S.; Griffiths, H.; Clark, D.; Haddad, A. Characterization of horizontal earth electrodes: Variable frequency and impulse responses. In Proceedings of the 2015 50th International Universities Power Engineering Conference (UPEC), Stoke on Trent, UK, 1–4 September 2015; pp. 1–5. [Google Scholar] [CrossRef]
- Steinsland, V.; Sivertsen, L.H.; Cimpan, E.; Zhang, S. A new approach to include complex grounding system in lightning transient studies and EMI evaluations. Energies 2019, 12, 3142. [Google Scholar] [CrossRef] [Green Version]
- Yang, J.; Zou, J. Parameter estimation of a horizontally multilayered soil with a fast evaluation of the apparent resistivity and its derivatives. IEEE Access 2020, 8, 52652–52662. [Google Scholar] [CrossRef]
- Southey, R.D.; Siahrang, M.; Fortin, S.; Dawalibi, F.P. Using Fall-of-Potential measurements to improve deep soil resistivity estimates. IEEE Trans. Ind. Appl. 2015, 51, 5023–5029. [Google Scholar] [CrossRef]
- Charvin Anoux Group. Understanding Soil Resistivity Testing Effects of Soil Resistivity on Understanding Soil Resistivity Testing; Application Notes; Charvin Anoux Group: Paris, France, 2019. [Google Scholar]
- Vasantrao, B.M.; Bhaskarrao, P.J.; Mukund, B.A.; Baburao, G.R.; Narayan, P.S. Comparative study of Wenner and Schlumberger electrical resistivity method for groundwater investigation: A case study from Dhule district (M.S.), India. Appl. Water Sci. 2017, 7, 4321–4340. [Google Scholar] [CrossRef] [Green Version]
- Ukar, O.; Zamora, I. Wind farm grounding system design for transient currents. Renew. Energy 2011, 36, 2004–2010. [Google Scholar] [CrossRef]
- Ramos-Leanos, O.; Uribe, F.A.; Valcarcel, L.; Hajiaboli, A.; Franiatte, S.; Dawalibi, F.P. Nonlinear electrode arrangements for multilayer soil resistivity measurements. IEEE Trans. Electromagn. Compat. 2020, 62, 2148–2155. [Google Scholar] [CrossRef]
- Myint, S.M.; Hla, K.T.; Tun, T.T. Effective earthing system of electrical power engineering department using optimal electrodes. Int. J. Adv. Technol. Eng. Explor. 2020, 7, 28–35. [Google Scholar] [CrossRef] [Green Version]
- Texas Instruments. The Bergeron Method: A Graphic Method for Determining Line Reflections in Transient Phenomena; Texas Instruments: Dallas, TX, USA, 1996. [Google Scholar]
- Suyaroj, N.; Premrudeepreechacharn, S.; Watson, N.R. Transient state estimation with the Bergeron transmission line model. Turk. J. Electr. Eng. Comput. Sci. 2017, 25, 806–819. [Google Scholar] [CrossRef]
- Martinez, J.A. Power System Transients: Parameter Determination, 1st ed.; Taylor & Francais Group: Boca Raton, FL, USA, 2010; ISBN 9781420065299. [Google Scholar]
- Sarajčev, I.; Sarajčev, P.; Vujević, S. Mathematical model of lightning stroke development. In Proceedings of the 2008 16th International Conference on Software, Telecommunications and Computer Networks, Split, Croatia, 25–27 September 2008; pp. 37–41. [Google Scholar] [CrossRef]
- IEC 62305-1. Protection against Lightning Part 1: General Principles (IEC 62305-1:2010); IEC: Geneva, Switzerland, 2011. [Google Scholar]
- Rakov, V.A.; Borghetti, A.; Bouquegneau, C.; Chisholm, W.A.; Cooray, V.; Cummins, K.; Diendorfer, G.; Heidler, F.; Hussein, A.; Ishii, M.; et al. Lightning Parameters for Engineering Applications; WG C4.407; CIGRE: Paris, France, 2013. [Google Scholar]
- IEEE Standard 1313.2. IEEE Guide for the Application of Insulation Coordination; IEEE-SA Standards Board: Piscataway, NJ, USA, 2005. [Google Scholar]
- Balasubramanian, A. Characteristics of Soil Profile; University of Mysore: Mysore, India, 2017. [Google Scholar]


| Country | Soil Resistivity, Ω·m | TFR, Ω | Reference | Remarks |
|---|---|---|---|---|
| Peru | - | 25 | [12] | For all line ratings |
| Columbia | - | 20 | [12] | For all line ratings |
| Spain | - | 10 | [12] | For all line ratings |
| China | ≤100 100 to 500 500 to 1000 1000 to 2000 >2000 | 10 15 20 25 30 | [11] | Measured in summer without connecting to the tower. |
| UK | - | 10 | [13] | For all line ratings |
| Japan | - | 10 | [14] | For all line ratings |
| Num. | Line Name | Total Number of Outages | Outage Rate Per 100 km/yr |
|---|---|---|---|
| 1. | 500 kV A–B | 21 | 1.53 |
| 2. | 500 kV A–C | 2 | 0.52 |
| 3. | 500 kV B–D | 9 | 1.25 |
| 4. | 500 kV E–F | 6 | 1.45 |
| Spacing, a (m) | Average Apparent Resistance (Ω) | ||
|---|---|---|---|
| T40 | T43 | T44 | |
| 1 | 28.92 | 256.55 | 232.2 |
| 1.5 | 23.18 | 176.15 | 156.67 |
| 2 | 17.55 | 144.5 | 109.28 |
| 3 | 13.02 | 104 | 56.52 |
| 4.5 | 10.21 | 65.69 | 27.75 |
| 6 | 6.38 | 48.05 | 18.23 |
| 9 | 4.96 | 34.25 | 12 |
| 13.5 | 3.92 | 23.6 | 8.98 |
| 18 | 2.57 | 19.03 | 4.27 |
| Parameter | Value | |
|---|---|---|
| Tower surge impedance | data | |
| Damping coefficient | 1 | |
| Attenuation coefficient | 0.8 | |
| Speed of light | c | 3 × 10⁸ m/s |
| Tower segment height | 7.1 m | |
| 11.0 m | ||
| 11.25 m | ||
| 25.25 m | ||
| Damping resistance | 2.159 Ω | |
| 4.619 Ω | ||
| 4.803 Ω | ||
| 21.459 Ω | ||
| Damping inductance | 0.786 µH | |
| 1.68 µH | ||
| 1.75 µH | ||
| 7.81 µH | ||
| Heidler Function Parameters | |||
|---|---|---|---|
| 8/20 µs | 10/350 µs | ||
| Parameter | Value | Parameter | Value |
| 11.8 × 10⁻⁶ | 3.9 × 10⁻⁶ | ||
| 8.011 × 10⁻⁶ | 459.65 × 10⁻⁶ | ||
| n | 3 | n | 2 |
| Tower (SR) | Tower Footing Resistance (TFR), Ω | % Reduction | |
|---|---|---|---|
| Before (Default) | After (Diamond ‘Crowfoot’) | ||
| T40 | 11.2 | 2.9 | 74.11 |
| T43 | 87.7 | 21.3 | 75.71 |
| T44 | 43.3 | 8.3 | 80.83 |
| Tower | Soil Resistivity, Ω·m | Tower Footing Impedance (TFI), Ω | |
|---|---|---|---|
| Default | Diamond ‘Crowfoot’ | ||
| T40 | 240.22 | 9.7 | 2.9 |
| T43 | 1841.05 | 45.5 | 19.7 |
| T44 | 743.46 | 26.5 | 8.1 |
| Lightning Current Magnitude, kA | Tower Footing Impedance, Ω | |||||
|---|---|---|---|---|---|---|
| Default | Diamond ‘Crowfoot’ | |||||
| T40 | T43 | T44 | T40 | T43 | T44 | |
| 10 | 10.6 | 64 | 35 | 2.9 | 20.8 | 8.2 |
| 20 | 10.1 | 52.9 | 30.2 | 2.9 | 20.2 | 8.1 |
| 30 | 9.7 | 46.2 | 26.9 | 2.9 | 19.8 | 8.1 |
| 40 | 9.3 | 41.3 | 24.5 | 2.8 | 19.4 | 8 |
| 50 | 9 | 37.8 | 22.7 | 2.8 | 19 | 7.9 |
| 100 | 7.7 | 28.1 | 17.3 | 2.8 | 17.3 | 7.6 |
| 150 | 6.9 | 23.3 | 14.5 | 2.8 | 16 | 7.3 |
| 200 | 6.3 | 20.9 | 12 | 2.7 | 14.8 | 7 |
| Tower | Soil Resistivity, Ω·m | Lightning Wave Shape | Tower Footing Impedance, Ω | |
|---|---|---|---|---|
| Default | Diamond ‘Crowfoot’ | |||
| T40 | 240.2249 | 8/20 µs | 9.7 | 2.9 |
| T43 | 1841.0450 | 45.5 | 19.7 | |
| T44 | 743.4558 | 26.5 | 8.1 | |
| T40 | 240.2249 | 10/350 µs | 9.6 | 2.8 |
| T43 | 1841.0450 | 44.4 | 19.7 | |
| T44 | 743.4558 | 25.9 | 8 | |
Publisher’s Note: MDPI stays neutral with regard to jurisdictional claims in published maps and institutional affiliations. |
© 2021 by the authors. Licensee MDPI, Basel, Switzerland. This article is an open access article distributed under the terms and conditions of the Creative Commons Attribution (CC BY) license (https://creativecommons.org/licenses/by/4.0/).
Share and Cite
Mohamad Nasir, N.A.F.; Ab Kadir, M.Z.A.; Osman, M.; Abd Rahman, M.S.; Ungku Amirulddin, U.A.; Mohd Nasir, M.S.; Zaini, N.H.; Nik Ali, N.H. Influence of Lightning Current Parameters and Earthing System Designs on Tower Footing Impedance of 500 kV Lines. Energies 2021, 14, 4736. https://doi.org/10.3390/en14164736
Mohamad Nasir NAF, Ab Kadir MZA, Osman M, Abd Rahman MS, Ungku Amirulddin UA, Mohd Nasir MS, Zaini NH, Nik Ali NH. Influence of Lightning Current Parameters and Earthing System Designs on Tower Footing Impedance of 500 kV Lines. Energies. 2021; 14(16):4736. https://doi.org/10.3390/en14164736
Chicago/Turabian StyleMohamad Nasir, Nur Alia Farina, Mohd Zainal Abidin Ab Kadir, Miszaina Osman, Muhamad Safwan Abd Rahman, Ungku Anisa Ungku Amirulddin, Mohd Solehin Mohd Nasir, Nur Hazirah Zaini, and Nik Hakimi Nik Ali. 2021. "Influence of Lightning Current Parameters and Earthing System Designs on Tower Footing Impedance of 500 kV Lines" Energies 14, no. 16: 4736. https://doi.org/10.3390/en14164736