
Natural Ventilation of Toilet Units in K–12 School Restrooms Using CFD

Department of Creative Design, National Yunlin University of Science and Technology, Yunlin 64002, Taiwan
Energies 2021, 14(16), 4792; https://doi.org/10.3390/en14164792
Submission received: 28 June 2021
/
Revised: 1 August 2021
/
Accepted: 2 August 2021
/
Published: 6 August 2021
Abstract
:In this study, the influence of architectural design parameters (the exterior window area, the wall height at a corridor-side, and the door gap of a toilet unit) on the airflow patterns and malodorous volatile substance (acetic acid) distributions within toilet units were investigated via computational fluid dynamics (CFD), with the restrooms in K–12 public schools (kindergarten through grade 12) of Taiwan as research objects. The results show that when there is a 2 m/s north wind in winter, all the cases exceed the required 12 air changes per hour (ACH), and most are above 43.75 ACH. When there is a 0.5 m/s south wind in summer, nearly half of the cases fail to reach 12 ACH. Maintaining an adequate natural ventilation rate and an acceptable level of odor pollution through passive design and architectural design is difficult. Thinking about how to improve the ventilation efficiency of toilet units with the aid of simple, appropriate, and energy-saving mechanical ventilation approaches is necessary.
1. Introduction
In Taiwan, toilets in K–12 public schools (kindergarten (K) and grades 1–12) are difficult to manage because they are frequently used and open to the public. In particular, those that have been used for years often have problems such as foul odor, poor ventilation, deterioration of building materials, etc. The poor quality of toilets in schools can lead to teachers and students to avoid going to the restroom and can cause acute or chronic diseases and psychological illness. Incorporating ventilation should possibly help achieve an acceptable indoor air environment in school restrooms. For the benefit of energy conservation, natural ventilation is a very promising choice.
There are limited studies in the literature on restroom ventilation, including the overall ventilation performance of restrooms, the efficiency of restroom components (toilet, fan), and indoor air quality (IAQ) measurements. For the overall ventilation performance of restrooms, Tung et al. [1] analyzed a new negative pressure wall-mounted ventilator installed in the restroom of a residential building through a full-scale test. In the process of the experiment, different toilet arrangements and locations were considered. The results showed that negative pressure could be used to prevent odors from drifting to adjacent rooms, and both increasing air exhaust and decreasing the distance between exhaust vents and toilets could improve indoor pollutant removal rate and ventilation rate. From the point of view of energy saving, a ventilation rate of 8.5 h−1 is recommended. Tung et al. [2] analyzed the efficiency of three ventilation strategies used to remove restroom odors in residential buildings, including (1) forced ceiling-supply and wall-exhaust systems, (2) natural window-inlet and forced ceiling-exhaust systems, and (3) forced ceiling-supply and ceiling-exhaust systems. The results showed that the forced ceiling-supply and wall-exhaust systems had the best odor removal effect among these strategies. Yang and Kim [3] applied computational fluid dynamics (CFD) to analyze the influence of changing the shape of the glass partition on the ventilation performance of an apartment restroom. The results indicated that the use of a glass partition design in a restroom with a shower and a toilet could contribute to good household hygiene.
For the efficiency of restroom components, Seo and Park [4] designed a new toilet exhaust system. They provided a circle of air suction ports under the toilet seat to directly absorb odors from the source and to prevent them from drifting to the restroom. Later, they verified the effect of this exhaust system through experiments and CFD simulation. The experimental results were almost the same as the simulation results, i.e., the recommended design included a port size of 4 × 4 mm2 and dual openings behind the toilet, and outdoor air was fed by a ventilation system into the restroom through a gap between the door and the floor. Kim and Yang [5] analyzed the ventilation performance of exhaust fans installed in the restroom of a residential building in South Korea through field measurements. They also provided revised advice on construction and design methods to improve the ventilation performance of restrooms. Yin et al. [6] analyzed the influence of increasing the operating pressure of exhaust fans in restrooms. More than 80 households using alternating current (AC) motors participated in the survey. The results showed that the performance of the exhaust fan was significantly reduced by increasing the external static pressure. Choi et al. [7] provided statistics of restroom ventilation fan tests from 2005 to 2013 and interpreted these statistics according to residential ventilation standards and guidelines.
Chung et al. [8] researched the restrooms in public schools (including senior high schools, junior high schools, and elementary schools) in Taiwan. They analyzed the influence of different numbers of awning windows and their installation position on the indoor airflow patterns and air contaminant distributions in a restroom. The results showed that an adequate number of awning windows and appropriate installation positions helped achieve the best ventilation effect. They also offered advice on where awning windows should be installed.
In terms of IAQ measurements in restrooms, Sato et al. [9] analyzed the amounts of volatile substances associated with human waste (feces and urine) odors. The substances were collected using Tenax-TA, and their concentrations were determined using thermal-desorption cold-trap injector/gas chromatography/mass spectrometry (TCT/GC/MS). Approximately 90% of the odor-causing substances were fatty acids: acetic acid (65%), propionic acid (15%), butyric acid (6.5%), i-valeric acid, and n-valeric acid. Approximately 8% of the substances were N-containing compounds: ammonia (6.5%), pyridine, pyrrole, indole, skatole, and trimethylamine. Sato et al. [10] analyzed the malodorous substances generated from the feces of 50 human subjects. Hydrogen sulfide was detected at concentrations of 5–26 ppb; methyl mercaptan was detected at 2–15 ppb; ammonia was detected at less than 100 ppb; propyl aldehyde, fatty acids, and pyridine were detected at approximately 10 ppb; and trimethylamine was detected at trace levels. These two studies clearly present the category and concentration of gaseous pollutants from human feces and urine, and contribute to subsequent experimental studies and simulation settings.
Many studies have focused on the natural or mechanical ventilation of buildings, but limited studies have considered the natural ventilation of restrooms, especially those in public schools. Therefore, with the restrooms in the K–12 public schools of Taiwan as research objects, the influence of design parameters (the exterior window area, the height of the side wall on a corridor side, and the door gap of a toilet unit) on the natural ventilation performance and malodorous volatile substance (acetic acid) distributions within school toilet units were analyzed via CFD.
2. Material and Methods
2.1. Research Objects
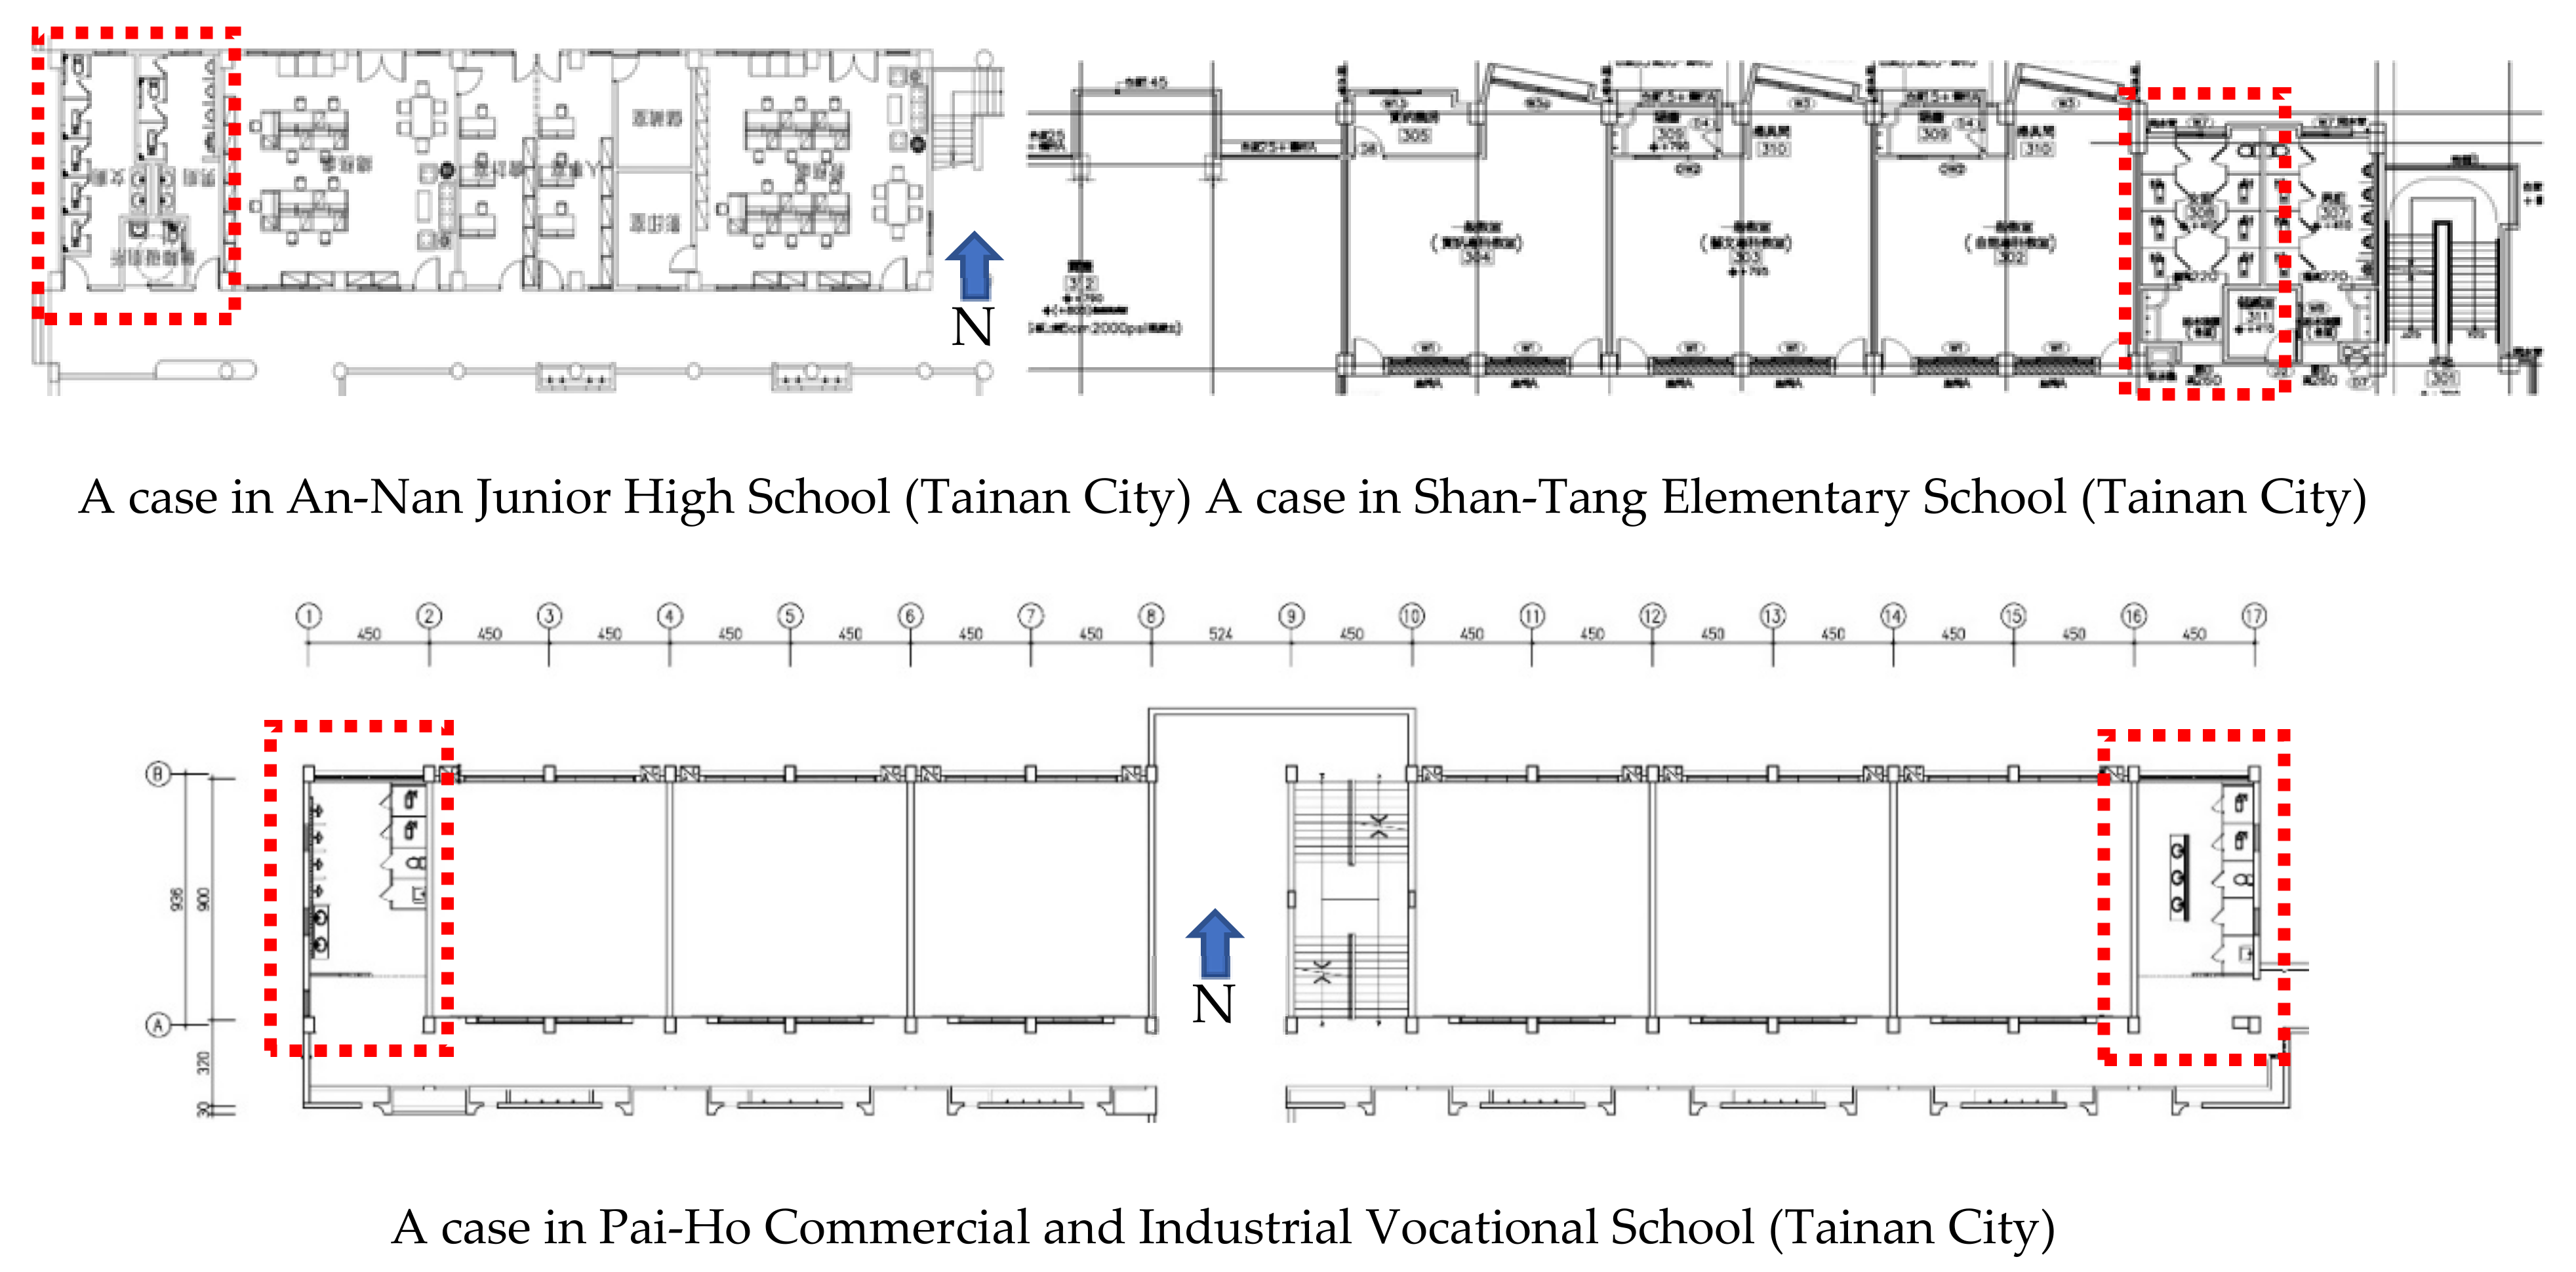
In Taiwan, the weather and climate are greatly affected by the monsoon. In summer, the prevailing wind is southwest or monsoon, while in winter, it is northeast or north wind. To reduce the solar heat gain of buildings and to improve the indoor natural ventilation performance, the long axis of most public school buildings in Taiwan is usually in the east to west long direction, with restrooms at both sides, as illustrated below (Figure 1). After analyzing the restrooms in 140 K–12 public schools in Taiwan, a representative school building was chosen as our study subject, as shown in Figure 2. This building includes a classroom (green block marked with ❶), a restroom ❷, and a corridor ❸ and has a total length of 69.6 m (including the toilets, with a length of 9.6 m on both sides), a width of 11 m, and a height of 3.2 m.
The representative school building, in Figure 2a, is in the east to west long direction and symmetrical; the long-term wind direction is north to south; in Taiwan, almost all classrooms include an air conditioner and windows are closed during class, so outdoor air cannot flow through the classrooms. Therefore, by utilizing this symmetrical feature, half of the representative school building was chosen as the research object, as shown by the red dotted line in Figure 2b. In the process of CFD modeling, Y = 0 plane (plane ❹ in Figure 2b, i.e., plane ❶ in Figure 5a) in the computational domain was set as the wall with the no-slip condition to realize symmetry of the outdoor flow field.
Figure 3a is the floor plan of the CFD model, the volume of which is 11 × 30 × 3.2 m (H). The classroom (green block) has dimensions of 8.25 × 25.2 × 3.2 m (H), the restroom (yellow block) has dimensions of 6.75 × 4.8 × 3.2 m (H), and the remaining parts include the corridor and the washbasin. The floor and wall both have a thickness of 0.2 m, and both the partition wall and the door have a thickness of 0.1 m. The interior spatial layout of the restroom varies with its location, site size, orientation, and architectural design style. Upon analysis of the restrooms in 140 K–12 public schools in Taiwan, a common interior spatial layout was selected as the research target, as shown in Figure 3b. There is a window on the north facade, the flow area of which is 1 m × Hw m (H); the corridor is located in the south of the building as a route for pedestrians or a sunshade for the classroom on the next floor. The nine toilet units are numbered toilet Unit 1, toilet Unit 2, …, and toilet Unit 9. Their spatial layout is checkered and applicable to general women’s restrooms, unisex restrooms, and the closet pan of men’s restrooms. Each toilet unit has a pedestal toilet. For the convenience of simulation, we used a cylinder with a diameter and height of 0.4 m as the toilet and set a source of odor pollution (0.1 × 0.1 m) on the upper surface of the cylinder. There is a small fan (flow area = 0.2 × 0.2 m) blowing downwards at a height of 2.7 m in each toilet unit. Whether or not the fan is opened depends on the topic to be discussed. For details, see the content below. The geometric data of the investigated model are shown in Table 1.
The outdoor wind environment is set as the south monsoon (at 0.5 m/s) in summer and the north monsoon (at 2 m/s) in winter. There is no heat source in the restroom. The variables (i.e., the architectural design parameters) shown in Figure 4b–d include the following:
For the convenience of description and the presentation of the results, humans may appear in the figure. These visual representations (humans) were not incorporated in the CFD calculation. The poor air quality in the restroom is mainly caused by the smell of feces and urine, which contain many chemical substances, such as ammonia, acetic acid, hydrogen sulfide, methyl mercaptan, trimethylamine, dimethyl disulfide, indole, and methyl indole. Sato et al. [9] stated that acetic acid (vapor density = 2.71 kg/m3) accounted for 65% of the gaseous pollutants. Therefore, acetic acid was considered to be the index pollutant of defecation in the present study. Sato et al. [10] collected the gaseous pollutants of 80 (L) discharged in 30 s after defecation for analysis and found that the average concentration of acetic acid was 549 ppm. On this basis, the discharge rate of acetic acid was calculated to be 1.5 × 10⁻⁶ m3/s. Therefore, the odor discharge rate (acetic acid) of each toilet was set to be 5.0 × 10⁻⁶ m3/s.
With the building orientation and monsoon wind directions, it is not unusual for the model restroom to have a perpendicular flow direction at the air inlet boundary. Wind is a complicated natural phenomenon. To preliminarily investigate the ventilation performance in a representative K–12 restroom, steady wind was assumed. The surroundings greatly affect the magnitude and direction of the approaching wind. Although this theme (the effect of the surroundings) was not the focus of this study, it is worthy of further consideration.
2.2. Numerical Methods
Numerical simulations were performed; a finite volume method was used to solve the governing equations with the boundary conditions shown in Table 2. The commercial CFD code PHOENICS was used to simulate the airflow and temperature distribution. The governing equations solved by PHOENICS include a three-dimensional incompressible Navier–Stokes equation, a time-independent convection diffusion equation, and the LVEL turbulence model. The formulations of these equations can be found in the PHOENICS manual [11]. To bridge the steep gradients of the dependent variables near a solid surface, a general wall function was employed. The iterative calculations continued until a prescribed relative convergence of 10−3 was satisfied by all the field variables of this problem.
The size of the computational domain, shown in Figure 5a, was set by referring to the rules recommended by Franke et al. [12], Tominaga et al. [13], and Blocken [14]. At the upstream, the distance between the physical model and the computational domain is 3 Lx to reduce any unnecessary wind gradient [14]; the physical model is 5 Ly from the lateral boundary, 15 Lx from the downstream boundary, and 0 from the upper boundary (direction Z). When there is north wind, the upstream boundary is located at the plane X = 0; when there is south wind, the upstream boundary is located at the plane X = 19 Lx. The downstream boundary, side boundary (Y = 6 Ly), and top end boundary (Z = 3.2 m) were set according to the Neumann condition to allow fluid to freely move through the computational domain. The power law index (0.15) of wind velocity profile is used to simulate conditions of empty space. The wind velocity set means the speed at the height of 3.2 m.
The model in this case is a single one-story building on the ground, but because positions other than the roof on the plane Z = 3.2 m were set according to the Neumann condition, the air, guided by the external wall, may flow out of/into the computational domain along the +Z direction. Therefore, this model can also represent a restroom on certain floor of a school building (which generally has 2–5 stories in Taiwan).
For the grid point system, to increase that the simulation correctness, the number of grids close to the model boundary and indoor components must be increased. When testing the grid independence of the mesh, the air velocity at the aisle center in the restroom based on different grid points was used to calculate the deviation percentages and to determine a suitable grid point system for our calculations, as shown in Figure 5c. The target point is (X = 13.5 m, Y = 27.5 m, and Z = 0.5–2.5 m) as indicated by the point V in Figure 3b and the parameters used in the test include a north wind of 2 m/s, Hw = 1 m, Lower wall, and Gap = 0.1 m. The numerical simulation accuracy depends on the resolution of the computational mesh, and a finer grid leads to solutions that are more accurate. An increase in the number of cells will provide better information; however, it will be accompanied by a significant increase in computational resources. The air velocity deviations (Dev) at the target position caused by different grid numbers have been added onto Figure 5c. A grid system, with approximately 265 × 148 × 61 (2,392,420) cells, was used for the numerical simulations in this study.
To validate the present prediction calculations, simulations were performed for the selected case of the similar configuration and parameters and compared with the experimental results from a previous study [8]. A reduced-scale model of the investigated restroom was constructed, as shown in Figure 5d. There are seven measurement locations in the model: at the two entrances (two locations), the window opening centers (two locations), the aisle centers (two locations), and the central toilet (one point). The measuring heights of each location are: 1 cm, 3 cm, and 5 cm. The results, as shown in Figure 5d, show that the predicted value in the validation work is qualitatively consistent with the results in the literature. Therefore, the simulation works were reliable.
2.3. Data Deduction
- (1)
- The ventilation rate, (ACH, air exchanges per hour), of a toilet unit is calculated by:whereis outward velocity at position (i, j) at an opening (m/s) ((opening is located above the toilet unit (❶ in Figure 4a) and at the door gap (if any) (❷ in Figure 4a));is the unit cross-section area at an opening (m2);is the air volume of the toilet unit (units 1–8, 1.2 × 1.2 × 2 m (H) and unit 9, 1.2 × 1.55 × 2 m (H)).
- (2)
- When someone sits on the toilet unit for defecation, the average concentration of acetic acid within the respiratory zone is:whereis the local concentration of acetic acid at position (i, j) within the respiratory zone (m3/s);is the unit cross-section area within the respiratory zone (m2);is the range of the respiratory zone (m2) (units 1–8, 0.6 × 1.2 m and unit 9, 0.6 × 1.55 m, ❸ in Figure 4a).
3. Results and Discussion
3.1. Main Airflow Streams
The outdoor wind environment directly influences the indoor natural ventilation effect, and in Taiwan, south wind predominates in summer and north wind in winter; therefore, this section considers the two cases with the maximum and minimum airflow resistance among the design parameters and introduces the structure of the indoor flow field under the winter monsoon (outdoor wind velocity 2 m/s).
The design parameters in Figure 6 (maximum flow resistance) include the window height (Hw) = 0.6 m, the top-to-ceiling wall (top wall), and the height of the door gap of a toilet unit (gap) = 0 m. Figure 6a shows the flow field in the aisle of the restroom (profile A in Figure 3a). The north wind flows from the right to the indoor space. Due to the smaller window area and the obstruction of the top-to-ceiling wall, the outdoor air encountered a larger flow resistance after flowing into the indoor space, the flow velocity decreased, and the flow pattern became oriented to the floor from the window (❶ in Figure 6a). Then, the air flowed through the aisle and to the south (on the left side of the figure) (❷). This north to south air flow became the main force driving the indoor air flow and air circulations at both sides (❸), above and under it (❹). Because the door gap of the toilet unit was 0, air could only enter or exit the toilet (❺) from above for air exchange. For details, see Section 3.2. The flow pattern of the case with the low flow resistance (Hw = 1.0 m, not top-to-ceiling wall (lower wall), gap = 0.1 m) (data not shown) was similar to the former case (Figure 6), yet the velocity of the outdoor air slightly decreased after flowing into the unit and flowed almost parallel with the floor. After flowing through the aisle, some airflow flew over the inner wall (❻) and moved toward the south, while some exited the restroom through the south gate (❷).
3.2. Ventilation Mechanism of Toilet Units
Since the conventional IAQ specification does not have quantitative restrictions on the concentration of acetic acid (the indicator pollutant in this study), this study only considered a qualitative description of this odor concentration. According to Figure 7a,b, when there was a north wind of 2 m/s, Hw = 0.6 m, top wall and gap = 0 m, there were inner circulations (❶❷) in toilet Unit 4 and Unit 8, which made it difficult for air pollutants to be discharged from the units, and the odor concentration increased (such as ❸❹). The blank at symbols ❸❹ indicate that the odor concentration was greater than the maximum value 1 × 10⁻³ marked by the legend in the figure. In Unit 8 (left side of Figure 7a,b), some of the air flow surrounding the human ❶ exited the toilet unit along with the above circulation ❺, and fresh air ❻ flowed into the unit from above, thereby lowering the odor concentration in the human respiratory zone (Figure 7b ❼). In Unit 4 (right side of Figure 7a,b), there was a large circulation ❷, and a wide range of indoor air was polluted; due to the limited exchanges with airflow outside the unit, the odor concentration (Figure 7b ❽) in the human respiratory zone was higher than ❼ (toilet Unit 8).
When the window height was increased to 1 m, the inner wall was changed to not top-to-ceiling, and the door gap of the toilet unit was 0.1 m, as shown in Figure 7c, the main airflow stream drove the circulation ❶ above Unit 8 and circulation ❷ around the toilet user, and entrained the air ❸ flowing from the door gap. The airflow ❸ flowing into the unit diluted the odor concentration, and the airflow with odor ❷ flowed out of the unit with the airflow ❶. Then, the odor concentration in the respiratory zone decreased, as shown in Figure 7d. A similar mechanism also occurred in Unit 4, although the circulation ❹ size was smaller than circulation ❷, and circulation ❻ was larger than circulation ❶.
According to these results, the odor concentration in the unit was significantly influenced by the flow structure, which is a case-by-case circumstance, and each unit showed different concentration distributions as the parameters varied.
3.3. Difference in the Age of the Air in Each Unit
The entire process lasted for more than 1648 s. This flow pattern brought air pollutants to many units, causing cross infection. There was a large difference between the age of the air in each unit, as shown in Figure 8b. When the flow resistance of indoor air decreased so that air could easily flow through the toilet unit, the overall age of air sharply decreased, as shown in Figure 8c (Hw = 1.0 m, lower wall, gap = 0.1 m). The age of air of each unit is still different.
3.4. Ventilation Rate in Each Unit
According to the ASHRAE [15] Standard 62.1-2019 (Table 6-4 Minimum Exhaust Rates), the exhaust rate per water closet and/or urinal for a public use should be 25–35 (L/s·unit); the frequently used sites, such as theatres, schools, and stadiums, the upper limit (35 (L/s·unit)) should be applied, and the exhaust makeup air can be a combination of outdoor air, recirculated air, and transfer air. With school restrooms as the research object, 35 (L/s·unit) was used as the benchmark. Taking each toilet unit (1.2 × 1.2 × 2 m (H)) as the air volume, the required minimum ventilation rate is 43.75 ACH; taking the entire restroom (6.75 × 4.6 × 3 m (H), nine toilet units) as the air volume, the required minimum ventilation rate is 12 ACH.
As shown in Figure 9a, which summarizes the ventilation rates (ACH) of each unit for a winter wind of 2 m/s, all units had a rate of more than 12 ACH (the red dotted line in the figure). With 43.75 ACH as the benchmark (the blue dotted line in the figure), most cases passed this benchmark. When (Hw = 0.6 m, top wall and gap = 0.1 m) (Hw = 1 m, top wall and gap = 0.05 m) (Hw = 1 m, lower wall, gap = 0.1 m), the ventilation rates of all units were greater than 43.75 ACH. In addition, both Units 8 and 9 had good ventilation effects, and the ventilation rates were more than the high benchmark of 43.75 ACH (the area marked by ❶); the ventilation effects of these two units were significantly affected by the architectural design, so that the data points (ventilation rate) in the figure are disperse. In Unit 3, in addition to the two cases with (Hw = 0.6 m, top wall and gap = 0 m) and (Hw = 0.8 m, top wall and gap = 0 m) that showed a decreased ventilation rate (❷), the other design parameters caused the ventilation effect of Unit 3 to be higher than the benchmark of 43.75 ACH (❸); and the architectural design had a limited impact on the ventilation effect, which makes the data points (ventilation rate) in the figure concentrated.
A phenomenon that is worthwhile considering is whether a ventilation rate that is higher than the benchmark can ensure good air quality in the unit. Consider the case with Hw = 0.6 m, top wall and gap = 0.1 m as an example. With a north wind (outdoor wind velocity 2 m/s), this design showed ventilation rates that were higher than the benchmark in all of the units (the ventilation rate of the unit = 48.5–108.8 ACH, average value = 74.25 ACH). However, as shown in Figure 10a, most units had a high concentration of acetic acid. In Unit 4, acetic acid was concentrated around the toilet user (Figure 10b). According to the flow structure, this can be attributed to the large inner circulation (Figure 10c), which results in a high ventilation rate of the unit. However, acetic acid is restricted within this circulation, causing pollutant accumulation.
When there is south wind, as shown in Figure 9b, the ventilation rates in nearly half of the cases failed to reach 12 ACH, and Unit 4 failed to reach this benchmark value within the scope of the design parameters (area marked by ❹); the ventilation effect of Unit 1 was greatly affected by the architectural design (❺); in Unit 3, except for the three cases (Hw = 0.8 m, lower wall and gap = 0 m) (Hw = 1 m, lower wall and gap = 0 m) (Hw = 1 m, lower wall and gap = 0.05 m) (❻), the remaining design parameters resulted in a poor ventilation effect; in Unit 7, except for the case of Hw = 1 m, top wall and gap = 0–0.1 m (❼), the remaining design parameters produced a poor ventilation effect.
According to these results, maintaining an adequate ventilation rate by utilizing passive design and architectural design is difficult. In addition, even with a high ventilation rate, odors in a toilet may not be effectively exhausted due to the flow pattern. Therefore, thinking about how to improve the ventilation efficiency of toilet units by means of simple, appropriate, and energy-saving mechanical ventilation approaches is necessary.
3.5. Can a Small Fan in a Toilet Unit Improve Its Ventilation Effect?
In this section, Unit 4 of the design case with the lowest ventilation rate in the south wind (please refer to Figure 9b) (Hw = 0.6 m, lower wall and gap = 0.1 m) is used as the ventilation performance improvement object. The average concentration of acetic acid in the respiratory zone was 7.027 × 10⁻⁴ (kg acetic acid/kg air) (= 702 ppm) (the range of the respiratory zone is marked by ❸ in Figure 4a), and the concentration distribution is shown in Figure 11a. A common low-speed (0.5 m/s) fan was first installed in the center of Unit 4 (height 2.7 m) (marked by in ❶ Figure 11b). As shown in Figure 11b, the average concentration of acetic acid in the respiratory zone decreased to 171 ppm. According to the flow structure (not shown), acetic acid may flow into the airflow pattern, and then be brought out of the toilet unit.
However, when the fan was moved to above the respiratory zone (i.e., toward the door of the unit, as marked by ❷), this downward airflow acted as an air curtain and prevented the air pollutants inside the unit from being discharged to the aisle, thereby increasing the average concentration of acetic acid in the respiratory zone around the toilet user to 401 ppm. At this point, whether or not this was caused by insufficient outdoor fresh air (the velocity of the south wind was only 0.5 m/s) might be considered. Therefore, at the position of the window, we installed an exhaust fan (marked by ❸ in Figure 11d, with the same flow area as the window area, 2 m/s), which had the same exhaust direction as the south wind. The results show that the concentration of acetic acid outside the unit declined sharply, but that inside the unit remained at a high value, especially in the respiratory zone, with an average concentration of 281 ppm, due to the flow structure.
In summary, the natural ventilation designs of toilet units in K–12 schools are case specific, therefore, it is not possible to provide a universal solution. If mechanical ventilation is employed to improve ventilation efficacy and reliability, other conditions such as the architectural design and outdoor environment should be considered; otherwise, the ventilation may not be effective. Combined natural and mechanical ventilation (hybrid ventilation) is worth discussing, though it is not the topic of this study.
4. Conclusions
With the restrooms in the K–12 public schools of Taiwan as research objects, the influence of architectural design parameters, such as the window area, the height of the side wall on the corridor side, and the door gap of a toilet unit, on the natural ventilation performance and malodorous volatile substance (acetic acid) distributions within toilet units were analyzed through CFD. The following conclusions were drawn:
- (1)
- To reduce the solar heat gain of a building and improve the natural ventilation efficacy, the long axis of most K–12 public school buildings in Taiwan is parallel with the east to west direction, with restrooms on both sides. In this case, the north to south air flow is the main force driving indoor air flow and the ventilation mechanism in toilet units.
- (2)
- The odor concentration in a toilet unit was significantly influenced by the flow structure, which is a case-specific circumstance, and each unit showed different concentration distributions as the parameters varied.
- (3)
- Within the design parameters discussed in this study, when the speed of the north wind was 2 m/s in winter, all the cases were greater than the benchmark 12 ACH, and most were even above 43.75 ACH. In three cases (Hw = 0.6 m, top wall and gap = 0.1 m; Hw = 1 m, top wall and gap = 0.05 m; Hw = 1 m, lower wall and gap = 0.1 m), the ventilation rates of all the units were above 43.75 ACH. Units 8 and 9 had good ventilation effects, but these effect were significantly influenced by the architectural design.
- (4)
- When there was a south wind (0.5 m/s) in summer, in nearly half of the cases, the ventilation rate failed to reach 12 ACH; Unit 4 failed to reach 12 ACH within all the design parameters; the architectural design had a large influence on the ventilation effect of Unit 1.
- (5)
- Maintaining an adequate natural ventilation rate by utilizing passive design and architectural design is difficult. In addition, even with a high ventilation rate, odor may not be effectively exhausted due to the flow pattern. Therefore, how to improve the ventilation efficiency of toilet units with the aid of simple, appropriate, and energy-saving mechanical ventilation approaches is worthy of further study.
The modeling and simulation results are limited to the spatial layout of the investigated restroom and the selected typical wind speeds and wind directions. To explore the practical applications and ventilation rates at other conditions, tests should be performed under detailed wind conditions. The surrounding configurations (e.g., building height and geometric shapes) of the research object would affect the flow field of the investigated toilet units. The design and layout of restroom indoor partitions would also affect ventilation performance. Although the investigation of these subjects (more detailed wind conditions, surrounding configurations, and indoor partitioning effects) is not what we explored in this study, but is worthy discussing.
Funding
This research received no external funding.
Institutional Review Board Statement
Not applicable.
Informed Consent Statement
Not applicable.
Data Availability Statement
Not applicable.
Acknowledgments
The authors gratefully acknowledge the support provided by the Ministry of Sciences and Technologies (MOST) of ROC in Taiwan through Project No. MOST 109-2221-E-224-010-MY2.
Conflicts of Interest
The authors declare no conflict of interest.
References
- Tung, Y.C.; Hu, S.C.; Tsai, T.Y. Influence of bathroom ventilation rates and toilet location on odor removal. Build. Environ. 2009, 44, 1810–1817. [Google Scholar] [CrossRef]
- Tung, Y.C.; Shih, Y.C.; Hu, S.C.; Chang, Y.L. Experimental performance investigation of ventilation schemes in a private bathroom. Build. Environ. 2010, 45, 243–251. [Google Scholar] [CrossRef]
- Yang, J.H.; Kim, O. Improvement of ventilation efficiency by changing the shape of glass partition in bathroom of apartment house. Indoor Built Environ. 2017, 26, 1274–1291. [Google Scholar] [CrossRef]
- Seo, Y.; Park, I.S. Study for flow and mass transfer in toilet bowl by using toilet seat adopting odor/bacteria suction feature. Build. Environ. 2013, 67, 46–55. [Google Scholar] [CrossRef]
- Kim, O.; Yang, J.H. On the design to improve the bathroom exhaust performance in multi-unit residential buildings. J. Asian Archit. Build. Eng. 2016, 15, 349–356. [Google Scholar] [CrossRef] [Green Version]
- Yin, P.; Pate, M.B.; Sweeney, J.F. The impact of operating pressure on residential bathroom exhaust fan performance. J. Build. Eng. 2016, 6, 163–172. [Google Scholar] [CrossRef]
- Choi, W.; Pate, M.B.; Sweeney, J.F. Study of bathroom ventilation fan performance trends for years 2005 to 2013—Data analysis of loudness and efficacy. Energy Build. 2016, 116, 468–477. [Google Scholar] [CrossRef]
- Chung, S.C.; Lin, Y.P.; Yang, C.; Lai, C.M. Natural ventilation effectiveness of awning windows in restrooms in K-12 public schools. Energies 2019, 12, 2414. [Google Scholar] [CrossRef] [Green Version]
- Sato, H.; Hirose, T.; Kimura, T.; Moriyama, Y.; Nakashima, Y. Analysis of malodorous volatile substances of human waste: Feces and urine. J. Health Sci. 2001, 47, 483–490. [Google Scholar] [CrossRef] [Green Version]
- Sato, H.; Morimatsu, H.; Kimura, T.; Moriyama, Y.; Yamashita, T.; Nakashima, Y. Analysis of malodorous substances of human feces. J. Health Sci. 2002, 48, 179–185. [Google Scholar] [CrossRef] [Green Version]
- Spalding, D. The PHOENICS Encyclopedia; CHAM Ltd.: London, UK, 2012. [Google Scholar]
- Franke, J.; Hellsten, A.; Schlunzen, H.; Carissimo, B. Best Practice Guideline for the CFD Simulation of Flows in the Urban Environment; COST Office: Brussels, Belgium, 2007. [Google Scholar]
- Tominaga, Y.; Mochida, A.; Yoshie, R.; Kataoka, H.; Nozu, T.; Yoshikawa, M.; Shirasawa, T. AIJ guidelines for practical applications of CFD to pedestrian wind environment around buildings. J. Wind Eng. Ind. Aerodyn. 2008, 96, 1749–1761. [Google Scholar] [CrossRef]
- Blocken, B. Computational fluid dynamics for urban physics: Importance, scales, possibilities, limitations and ten tips and tricks towards accurate and reliable simulations. Build. Environ. 2015, 91, 219–245. [Google Scholar] [CrossRef] [Green Version]
- ASHRAE. ANSI/ASHRAE Standard 62.1-2019; Ventilation for Acceptable Indoor Air Quality, American Society of Heating, Refrigerating, and Air-Conditioning Engineers, Inc: Atlanta, GA, USA, 2019. [Google Scholar]
Figure 1.
Common K–12 School Buildings in Taiwan: long strip shape from east to west and restrooms at both sides of the building.
Figure 1.
Common K–12 School Buildings in Taiwan: long strip shape from east to west and restrooms at both sides of the building.

Figure 2.
Development process of the physical model used in this study.

Figure 3.
Physical model for this research (not to scale, unit (m)).

Figure 4.
Variables (architectural design parameters) discussed in this Study (not to scale, unit (m)).
Figure 4.
Variables (architectural design parameters) discussed in this Study (not to scale, unit (m)).

Figure 5.
Determining the computational domain (a); grid (b); results of the grid independency test (c); and model validation results [8] (d).
Figure 5.
Determining the computational domain (a); grid (b); results of the grid independency test (c); and model validation results [8] (d).

Figure 6.
Indoor flow field driven by the north wind (airflow velocity m/s). Window height (Hw) = 0.6 m, top-to-ceiling wall (top wall), height of the door gap of a toilet unit (gap) = 0 m, outdoor wind velocity = 2 m/s. (Humans in the figure are not included for simulated calculation). (a) Vertical cross-section of the aisle in the restroom (profile A in Figure 3a); (b) Horizontal cross-section at a height of Z = 1.5 m (profile B in Figure 6a, horizontal and in the center of the exterior window.


Figure 7.
(a,c) Flow field (m/s) of the toilet Units 4 and 8; (b,d) the concentration distribution (kg acetic acid/kg air) of the pollutants (acetic acid) in the north wind (outdoor wind velocity 2 m/s) (location, profile C in Figure 3a). (Humans in the figure are not included for simulated calculation).

Figure 8.
(a) Air trajectory (start point, location ❶); (b,c) age of air in the respiratory zone at the sitting position (height of 1 m) for a north wind of 2 m/s (unit, s).
Figure 8.
(a) Air trajectory (start point, location ❶); (b,c) age of air in the respiratory zone at the sitting position (height of 1 m) for a north wind of 2 m/s (unit, s).


Figure 9.
Ventilation rates of toilet units.

Figure 10.
(a) Concentration distribution of acetic acid in the respiratory zone (1 m height) at the sitting position; (b) concentration distribution of acetic acid in the vertical plane of toilet Unit 4; (c) the flow field of the north wind (velocity 2 m/s) (location, profile D in Figure 10a) (Hw = 0.6 m, top wall and gap = 0.1 m).

Figure 11.
Concentration of acetic acid before and after installing a small Fan: (a) no fan; (b) fan in the center of the unit; (c) fan above the respiratory zone; (d) toilet window installed with a fan (Hw = 0.6 m, lower wall and gap = 0.1 m, south wind) (location profile C in Figure 3a).
Figure 11.
Concentration of acetic acid before and after installing a small Fan: (a) no fan; (b) fan in the center of the unit; (c) fan above the respiratory zone; (d) toilet window installed with a fan (Hw = 0.6 m, lower wall and gap = 0.1 m, south wind) (location profile C in Figure 3a).


Table 1.
Geometric data.
| Parts of the Model | Geometric Data |
|---|---|
| Representative school building (Figure 2) | 11 × 69.6 × 3.2 m (H) |
| CFD model (Figure 3a and Figure 5a) | 11 (Lx) × 30 (Ly) × 3.2 m (H) |
| Investigated restroom (Figure 3b) | 6.75 × 4.8 × 3.2 m (H) |
| Air volume of toilet unit | 1.2 × 1.2 × 2 m (partition height) |
| Classroom (green block of Figure 3a) | 8.25 × 25.2 × 3.2 m (H) |
| Pedestal toilet (expressed as cylinder) | 0.4 m in both diameter and height |
| Flow area of source of odor pollution | 0.1 × 0.1 m |
| Small fan | 2.7 m in height, flow area = 0.2 × 0.2 m |
| Thickness of floor and wall | 0.2 m |
| Thickness of partition wall and door | 0.1 m |
| Height of partition wall and door | 2 m |
| Dado of window | 1.2 m from the floor |
| Net ceiling height | 3.0 m (Z direction) |
Table 2.
Parameters specified in the numerical calculations.
| Window height (Hw) (Figure 3b and Figure 4b) | 0.6, 0.8, 1 m |
| Interior wall type (Figure 3b and Figure 4c) | Top-to-ceiling wall (top wall) (wall height 3.0 m)Not top-to-ceiling wall (lower wall) (wall height 2.2 m) |
| Height of the door gap of a toilet unit (gap) (Figure 4d) | 0, 0.05, 0.1 m |
| Wind environment | 0.5 m/s (south wind), 2.0 m/s (north wind); at the reference height of 3.2 m; power law index of velocity profile = 0.15 |
| Walls, doors, floor | Adiabatic |
| Setting of pollution source (acetic acid) | Volumetric flow rate 5 × 10⁻⁶ m3/s; mass percentage concentration of acetic acid = 1 (kg acetic acid/kg Air); vapor density = 2.71 kg/m3; Flow area 0.1 m × 0.1 m |
| Ambient acetic acid concentration | 0 ppmv |
| Plane Y = 0 and Z = 0 (i.e., ground in the computational domain (Figure 5a) | Wall with no-slip condition |
| Air inlet boundary in winter | Plane X = 0 in the computational domain (Figure 5a) |
| Air inlet boundary in summer | Plane X = 19 Lx in the computational domain (Figure 5a) |
Publisher’s Note: MDPI stays neutral with regard to jurisdictional claims in published maps and institutional affiliations. |
© 2021 by the author. Licensee MDPI, Basel, Switzerland. This article is an open access article distributed under the terms and conditions of the Creative Commons Attribution (CC BY) license (https://creativecommons.org/licenses/by/4.0/).
Share and Cite
MDPI and ACS Style
Lin, Y.-P. Natural Ventilation of Toilet Units in K–12 School Restrooms Using CFD. Energies 2021, 14, 4792. https://doi.org/10.3390/en14164792
AMA Style
Lin Y-P. Natural Ventilation of Toilet Units in K–12 School Restrooms Using CFD. Energies. 2021; 14(16):4792. https://doi.org/10.3390/en14164792
Chicago/Turabian StyleLin, Yi-Pin. 2021. "Natural Ventilation of Toilet Units in K–12 School Restrooms Using CFD" Energies 14, no. 16: 4792. https://doi.org/10.3390/en14164792
Note that from the first issue of 2016, this journal uses article numbers instead of page numbers. See further details here.