Article

Modelling, Design and Control of a Standalone Hybrid PV-Wind Micro-Grid System

Electrical Power Engineering Department, Yarmouk University, Irbid 21163, Jordan
*
Author to whom correspondence should be addressed.
Energies 2021, 14(16), 4849; https://doi.org/10.3390/en14164849
Submission received: 10 July 2021 / Revised: 29 July 2021 / Accepted: 2 August 2021 / Published: 9 August 2021
(This article belongs to the Special Issue Computing for Sustainable Energy)

Abstract

:
The problem of electrical power delivery is a common problem, especially in remote areas where electrical networks are difficult to reach. One of the ways that is used to overcome this problem is the use of networks separated from the electrical system through which it is possible to supply electrical energy to remote areas. These networks are called standalone microgrid systems. In this paper, a standalone micro-grid system consisting of a Photovoltaic (PV) and Wind Energy Conversion System (WECS) based Permanent Magnet Synchronous Generator (PMSG) is being designed and controlled. Fuzzy logic-based Maximum Power Point Tracking (MPPT) is being applied to a boost converter to control and extract the maximum power available for the PV system. The control system is designed to deliver the required energy to a specific load, in all scenarios. The excess energy generated by the PV panel is used to charge the batteries when the energy generated by the PV panel exceeds the energy required by the load. When the electricity generated by the PV panels is insufficient to meet the load’s demands, the extra power is extracted from the charged batteries. In addition, the controller protects the battery banks in all conditions, including normal, overcharging, and overdischarging conditions. The controller should handle each case correctly. Under normal operation conditions (20% < State of Charge (SOC) < 80%), the controller functions as expected, regardless of the battery’s state of charge. When the SOC reaches 80%, a specific command is delivered, which shuts off the PV panel and the wind turbine. The PV panel and wind turbine cannot be connected until the SOC falls below a safe margin value of 75% in this controller. When the SOC goes below 20%, other commands are sent out to turn off the inverter and disconnect the loads. The electricity to the inverter is turned off until the batteries are charged again to a suitable value.

1. Introduction

The use of renewable energy resources has rapidly increased in the last few years because of the global lack of conventional energy sources. Several factors are affecting the use of these resources such as the large capital cost and the uncontrollable parameters of the environment like variation of wind speed and sun irradiance. Therefore, an intelligent energy control system should be applied to switch the supply from one source to another according to load variations, ambient environment, and the State of Charge (SoC) of the energy storage systems.
A microgrid system is the most efficient system used to adapt the variation of the previous parameters in a multi-sources renewable energy system which is called a Hybrid Renewable Energy System (HRES). In the literature, several articles are mainly focused on various methodologies of optimal sizing, configurations, power management strategies and controllers used in the context of HRES [1,2,3,4,5]. In [2], the use of a photovoltaic (PV) and wind turbine (WT) generator hybrid microgrid architecture was constructed. Bidirectional control mechanisms were created, with an AC system integrating with a PMSG-based WT and a DC system integrating with a sliding mode algorithm. For steady-state conditions, the wind and PV interconnected microgrid system was mathematically modeled. The MATLAB/SIMULINK software (MathWorks, Inc., Natick, MA, USA) was used to simulate this hybrid microgrid model. An optimal load management method was implemented. On the test system, various case studies involving the connection and disconnection of sources and loads were carried out. The findings show that, when the network is altered, starting with one operating condition and progressing to the next, the system may be retained in a steady-state condition using the proposed control methods. In [3], the energy management system (EMS) is described as a Markov decision process (MDP). The reinforcement learning strategy is proposed to deal with a non-stationary scenario. In addition, a comprehensive reward function has been constructed, which reduces infeasible action explorations to improve the data-driven technique’s performance. A comparison study between a trading EMS model and a non-trading case is undertaken using a typical commercial load curve and PV profile over a 24-h horizon to examine the performance of the proposed EMS.
Additional articles in the literature are mainly focused on integration between renewable and traditional resources, performance assessment, and converter design of a specific HES [6,7,8,9,10]. The Smart Hybrid Energy System (SHES) is an alternate option proposed by the authors of [6], which attempts to replace the present diesel generator with an integrated diesel-solar power generation system. To ensure the system’s optimal efficiency, all components are managed in a specific way to keep a continuous energy flow to the load. In [7], Microgrid Energy Management (MGEM) is formulated as mixed integer linear programming to manage the energy flow of a specific hybrid Energy system (HES) that incorporates wind, PV, fuel cell, micro turbine, diesel, and energy storage. The HES’s which depend on old energy sources, such as diesel, increase greenhouse gas emissions and reduce the efficiency of the system in preserving the environment from pollution.
The impact of smart and intelligent controllers on HRES power management is rarely defined and covered in the literature. The type of linked hybrid Microgrid can be used to categorize the focus of this study field. Power management in the hybrid AC/DC Microgrid is focused on droop and power flow regulation. Droop control can be used for both DC and AC sub-grids or both [11,12,13,14,15]. If the latter approach is used, an interlinking between the two sub-grids is mainly used to handle the case when any sub-grid failure occurs due to over-stress, keeping individual source variations as small as possible [9].
Battery-based Energy Storage Elements play a prominent role in power management, mainly in isolated microgrids. Different energy storage devices such as Superconducting Magnetic Energy Storage (SMES) and Composite Energy Storage System (CESS) were addressed in [11,12]. In [13], wireless power management with batteries, load variations, and uninterrupted supply were managed with energy storage devices. Recently, many research works were carried out on the mode of communication in energy management [14,15,16].
This paper is aimed to fill the gap by providing a smart controller of a specific Hybrid renewable energy micro-grid system. The main contribution of this work can be summarized as follows: the research study in this manuscript focuses on the off-grid hybrid wind-PV system which can be applied in remote areas, where the grid does not exist. A smart controller is applied to achieve a specific behavior for this off-microgrid. The control system is intended to achieve the load in all cases as follows: when the energy generated by the PV panel exceeds the energy consumed by the load, the excess energy is used to charge the batteries. When the electricity provided by the PV panel is insufficient to meet the load’s needs, the extra power is extracted from the charged batteries. Moreover, the smart controller is used to protect the batteries banks in all conditions; normal, overcharging, and over discharging conditions. The controller should handle each scenario appropriately. Under normal operating conditions (20% < SOC < 80%), the controller performs as expected, regardless of the battery’s state of charge. When the SOC reaches 80%, a special command is issued that turns off the PV panel and the wind turbine. The PV panel and wind turbine cannot be linked until the SOC reduces to a safe margin, which is 75% in this controller. When SOC falls below 20%, other commands are sent out to turn off the inverter and disconnect the loads. The inverter’s electricity is turned off until the batteries are charged to 25% of their full value.
The rest of this paper is organized as follows: Section 2 describes the configuration of the micro-grid system, which includes the PV system and the WECS based PMSG integrated with a battery energy storage system. The control system for the proposed microgrid is discussed in detail in Section 3. In Section 4, the used control strategy is verified and validated using several conditions and scenarios. Finally, conclusions are presented in Section 5.

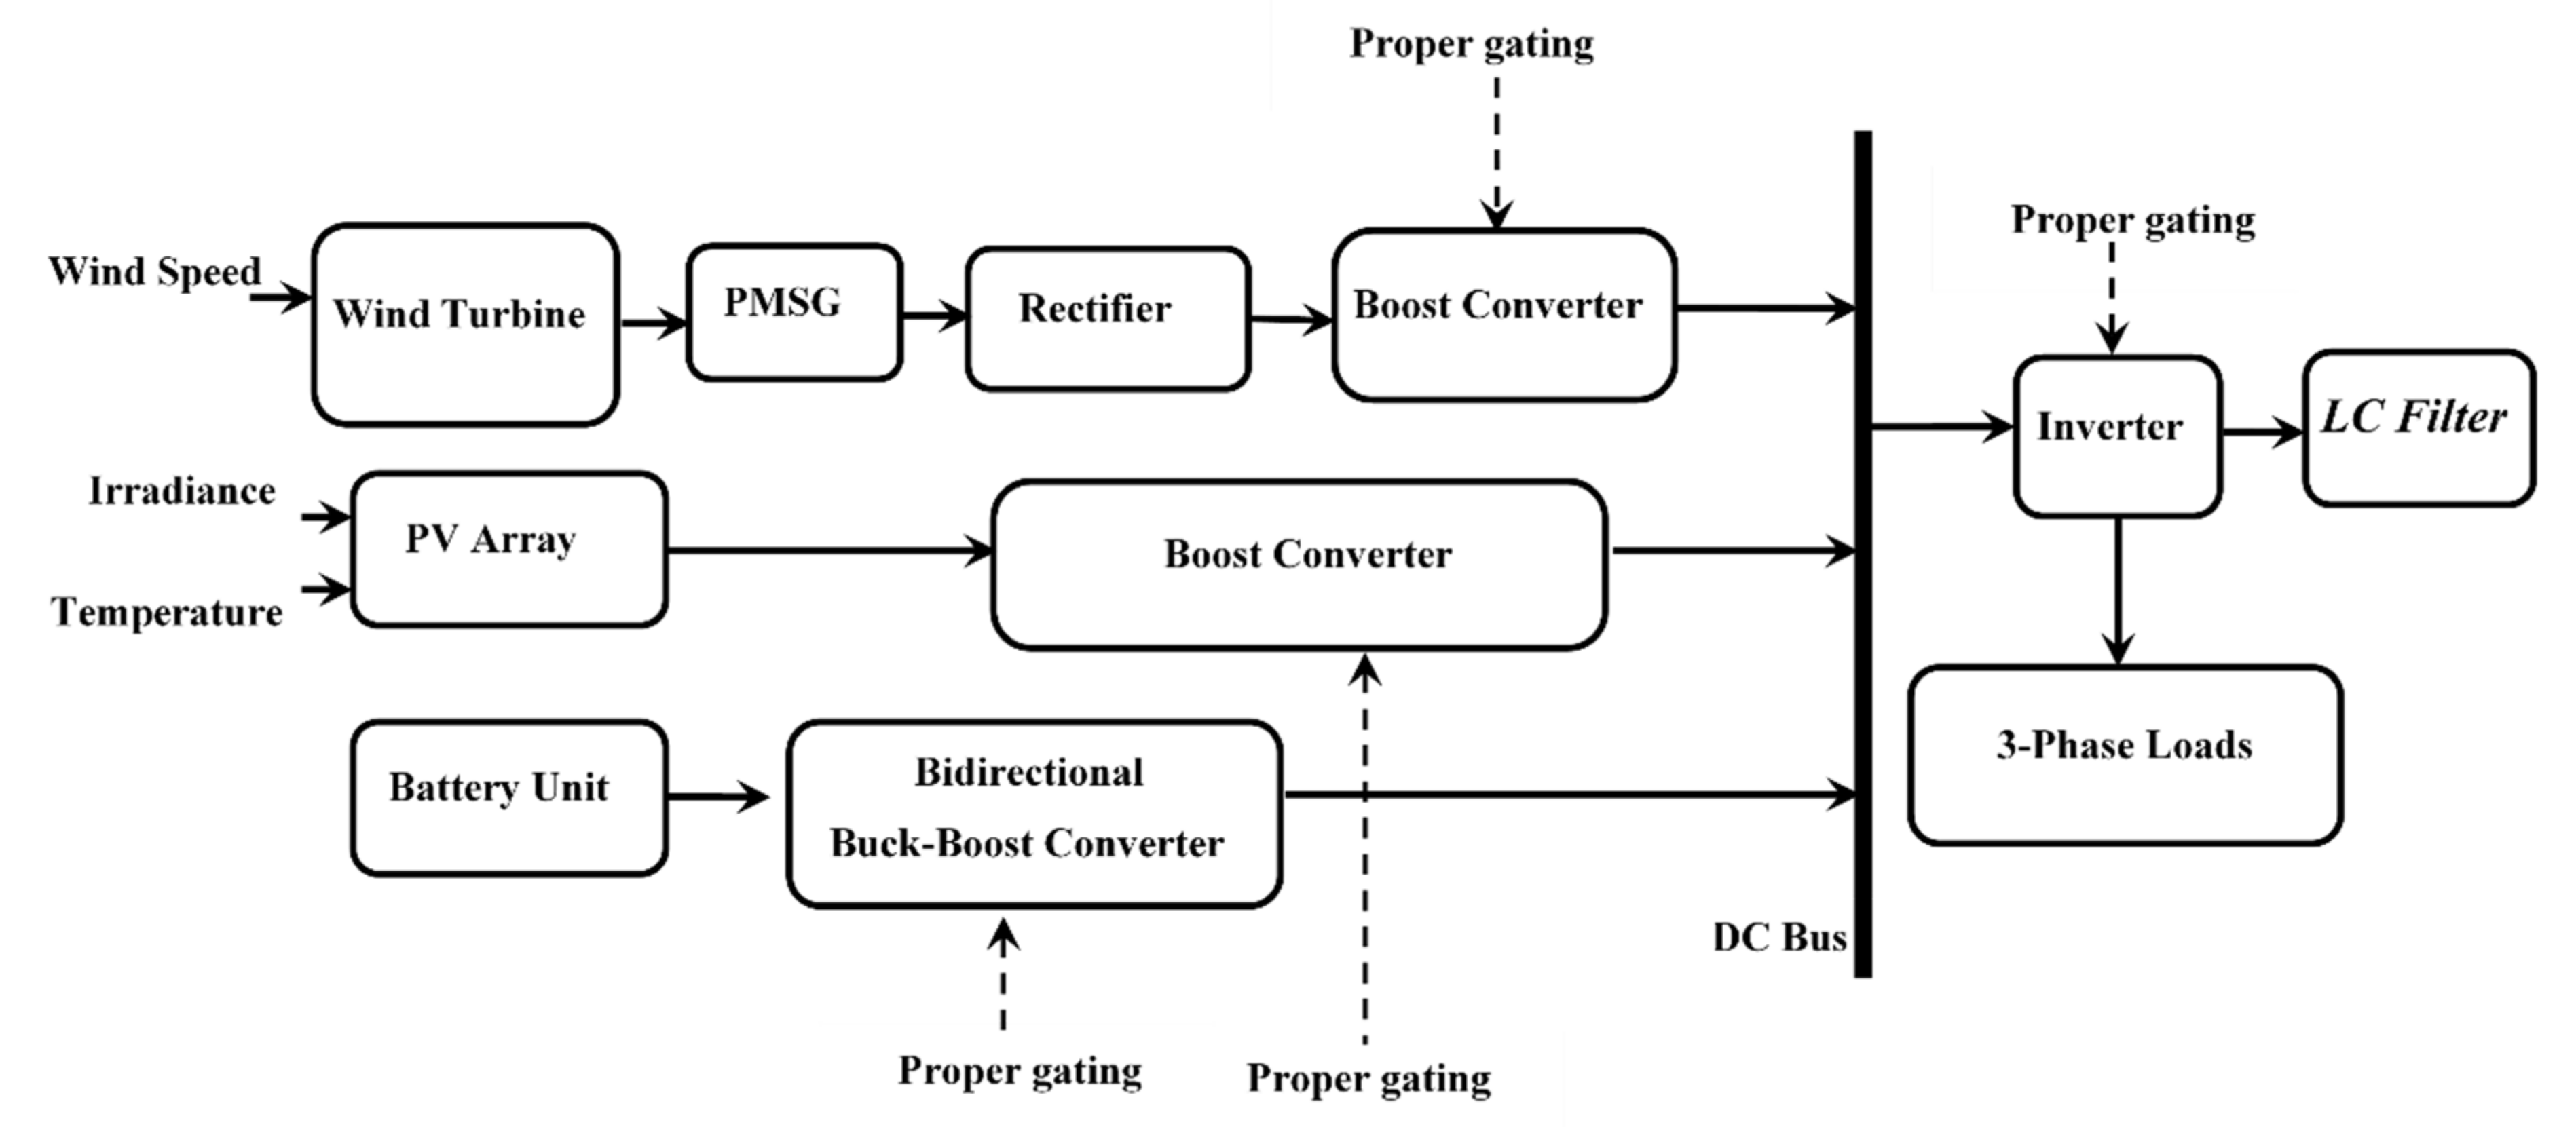
2. Micro-Grid System Configuration
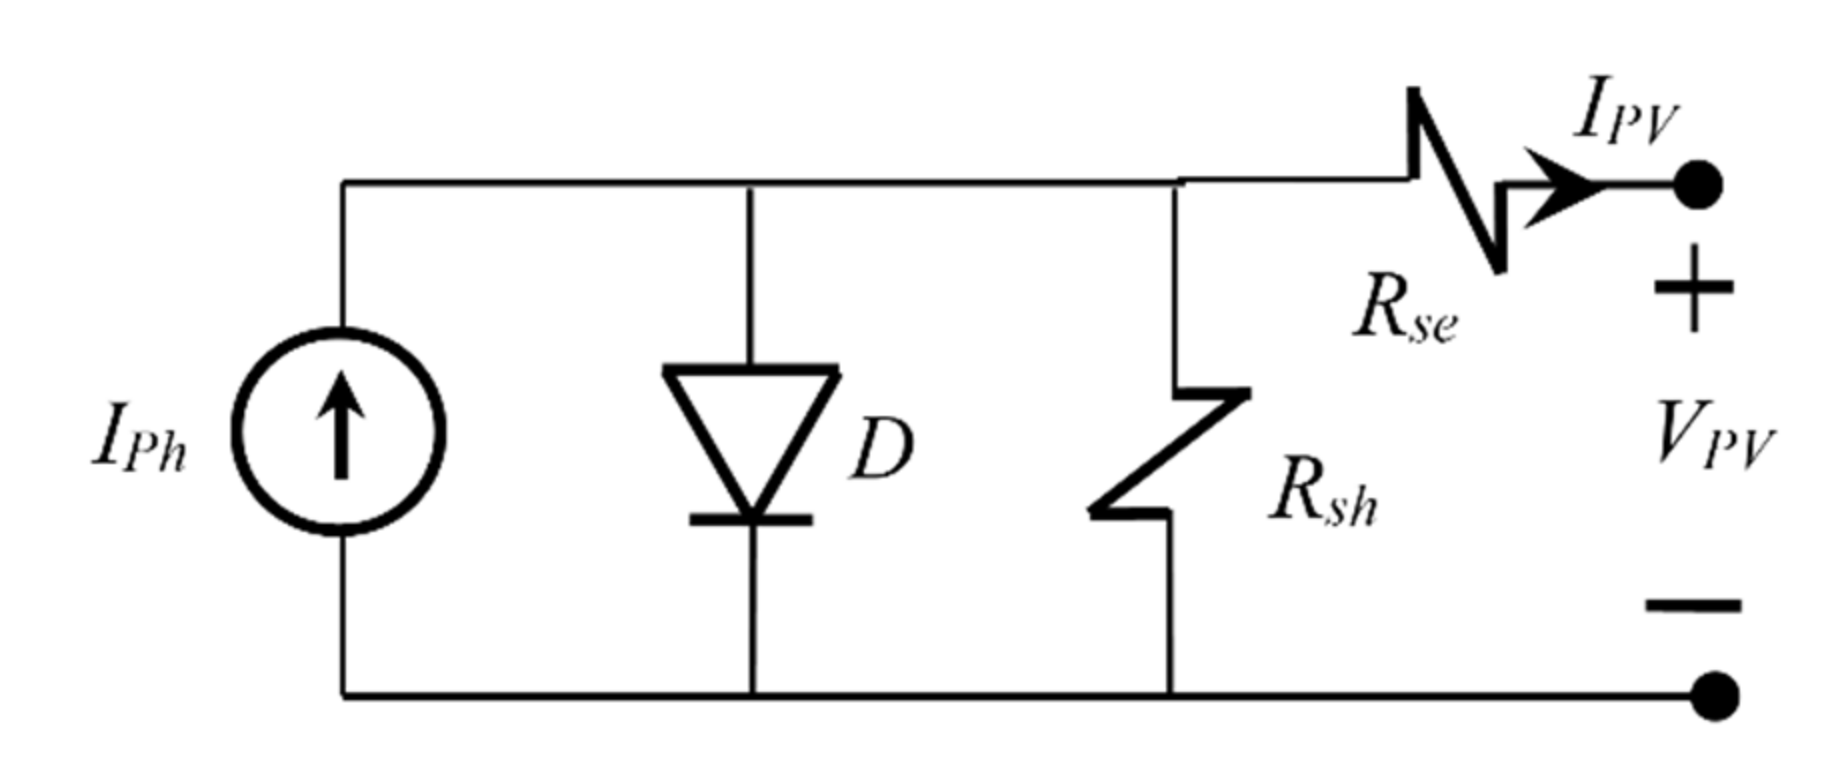
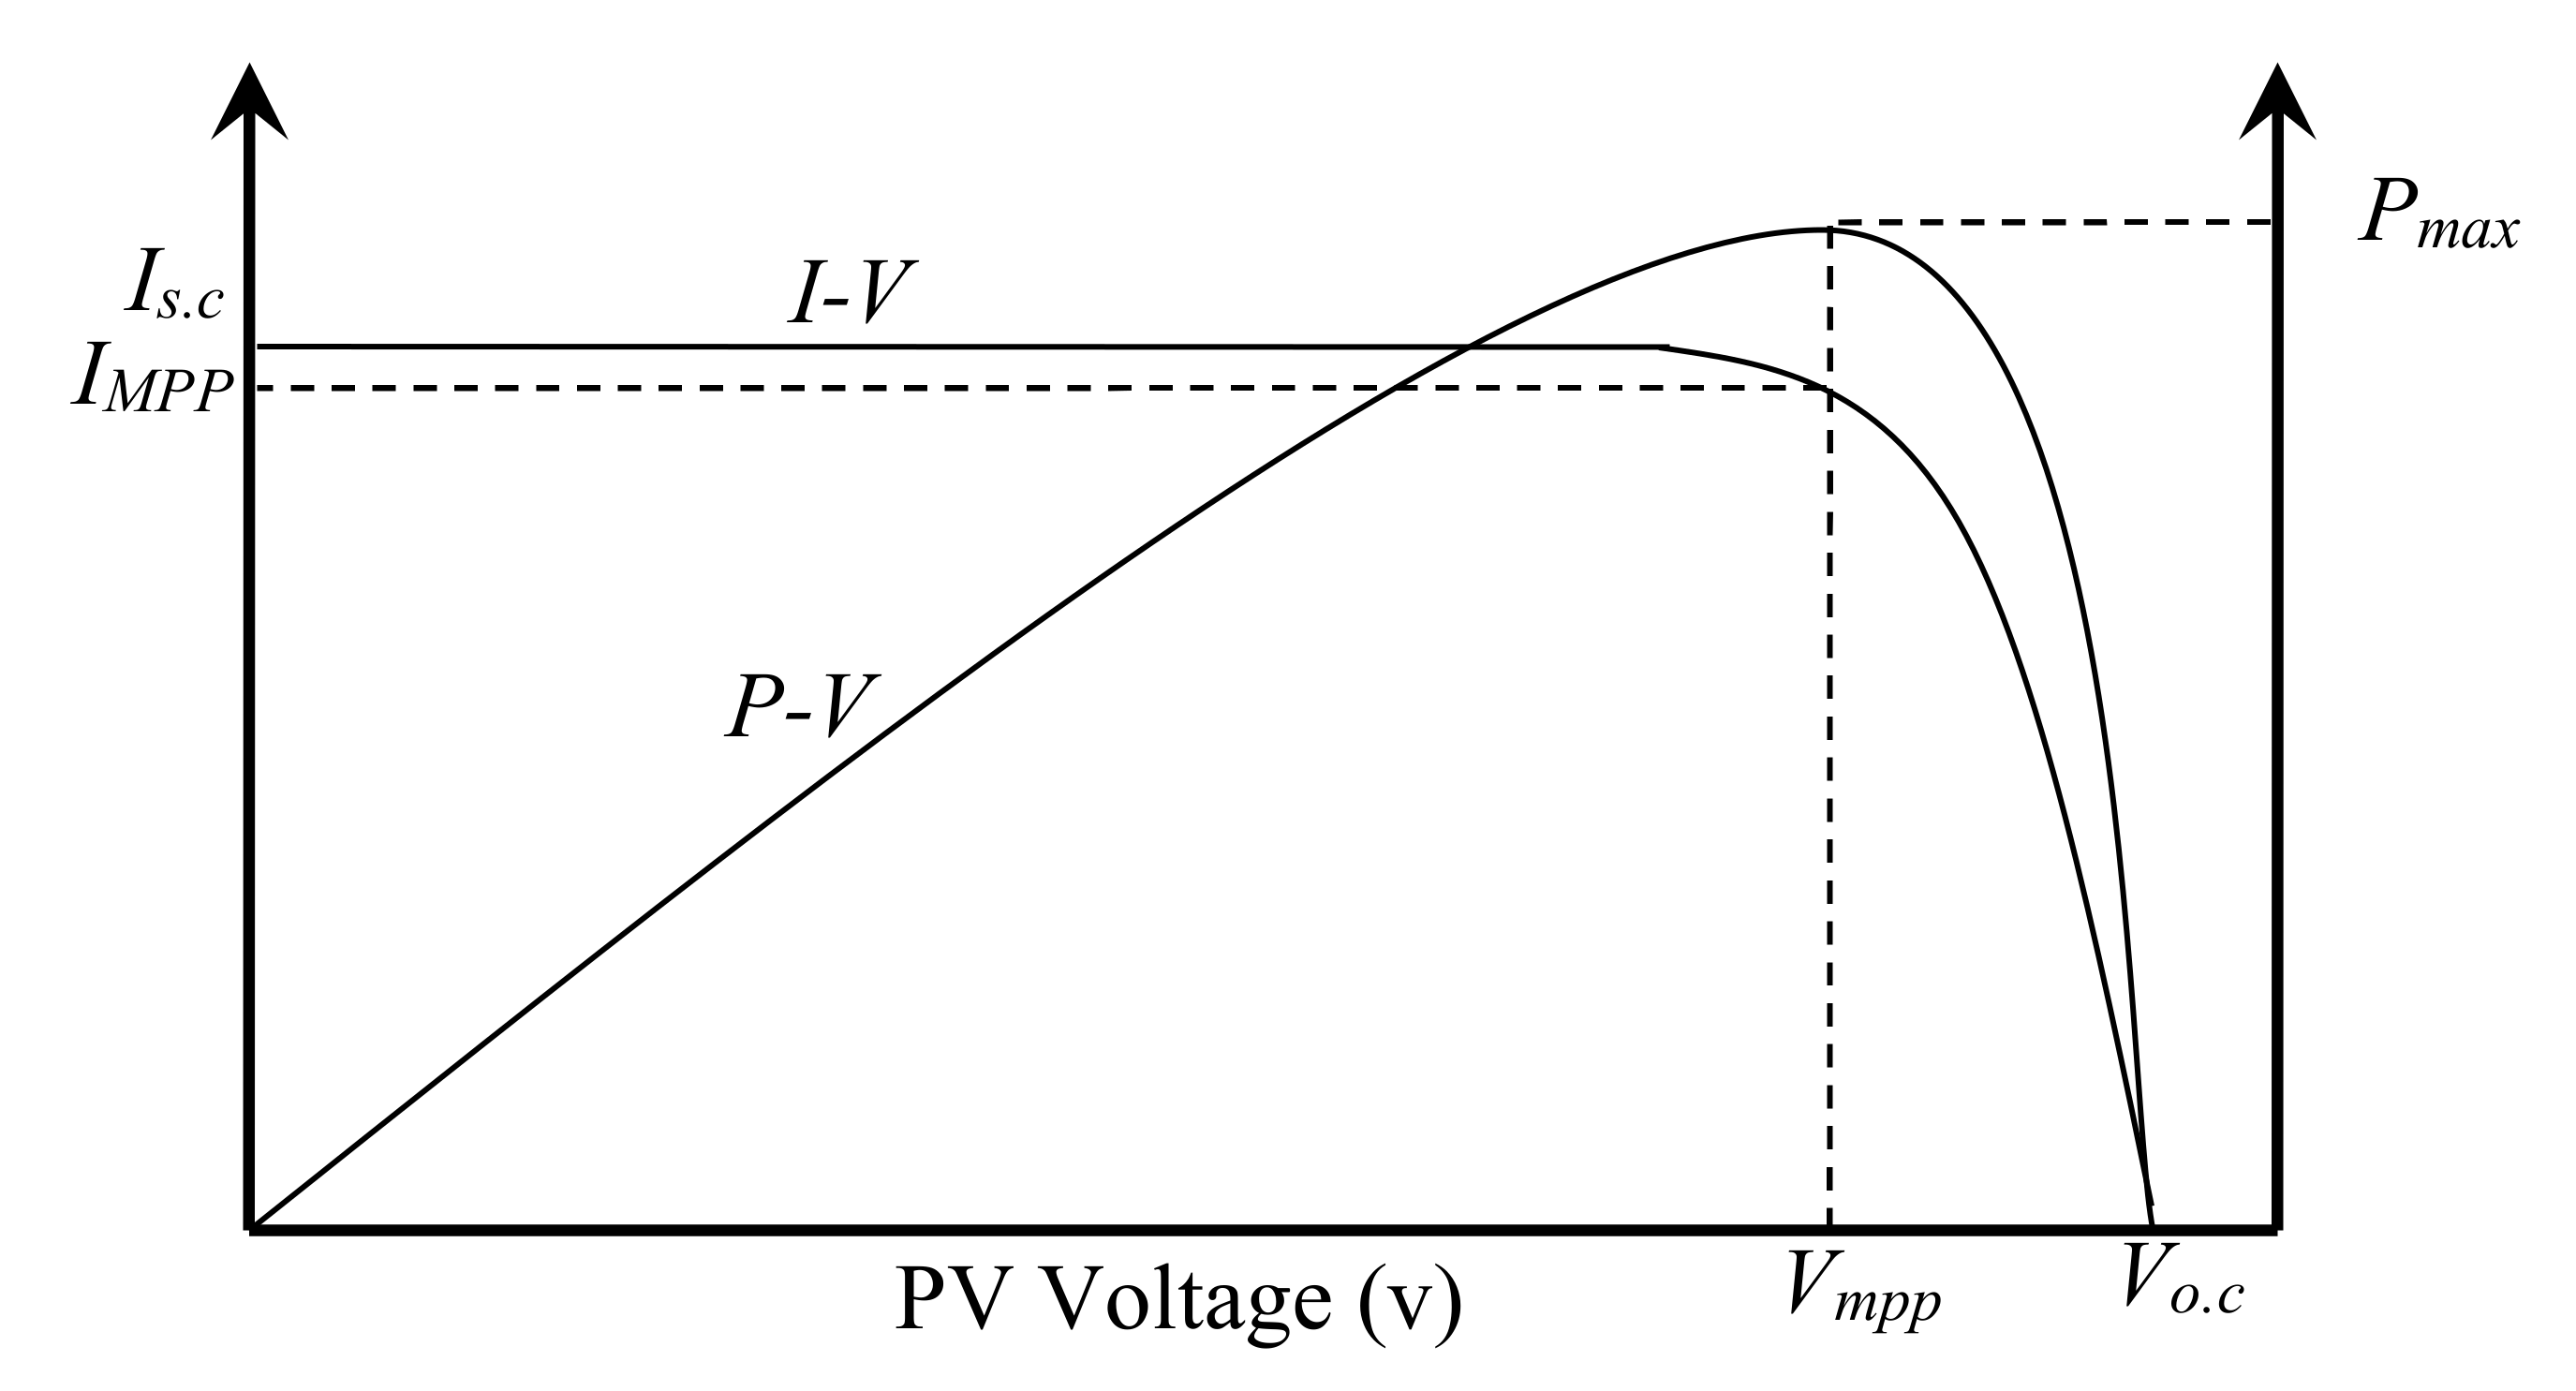
The system under study consists of three main parts: PV system, Wind Energy Conversion System based Permanent Magnet Synchronous Generator (WECS-PMSG), and power electronic devices that connect AC and DC sides of the micro-grid system. Several controllers are required for each power electronic device. Figure 1 shows a schematic diagram and the system configuration for the suggested microgrid. The configuration of each part will be discussed individually in the following subsections.

2.1. PV System

The voltage–current (V-I) characteristics of the used PV model are given by [16]:
I p v = I p h I s e q V p v + R s I p v n k T 1 V p v + R s I p v R s h
where Iph is the photo-current, Is is the diode saturation current, q is the electron charge, T is the temperature in (K), n is P-N junction ideality factor, and Rs and Rsh are intrinsic series and shunt resistances of PV cell, respectively. A schematic diagram of this PV model is given by Figure 2.
The connected PV system is a PV array that consists of three series and six parallel strings to generate about 3.84 kW at full irradiance of 1000 W/m2.
Figure 3 shows the relationship between voltage–current and voltage–power of PV modules, respectively. It is clear from this figure that the maximum power occurs close to open circuit voltage of the PV panel. The rating power of this panel at STC condition is 215 W. The open circuit voltage and the voltage at the maximum power are 36.6 Volts and 29 Volts, respectively. The short circuit current and the current at the maximum point are: 7.84 A and 7.35 A, respectively. More details and specifications about this panel can be found in [17,18].

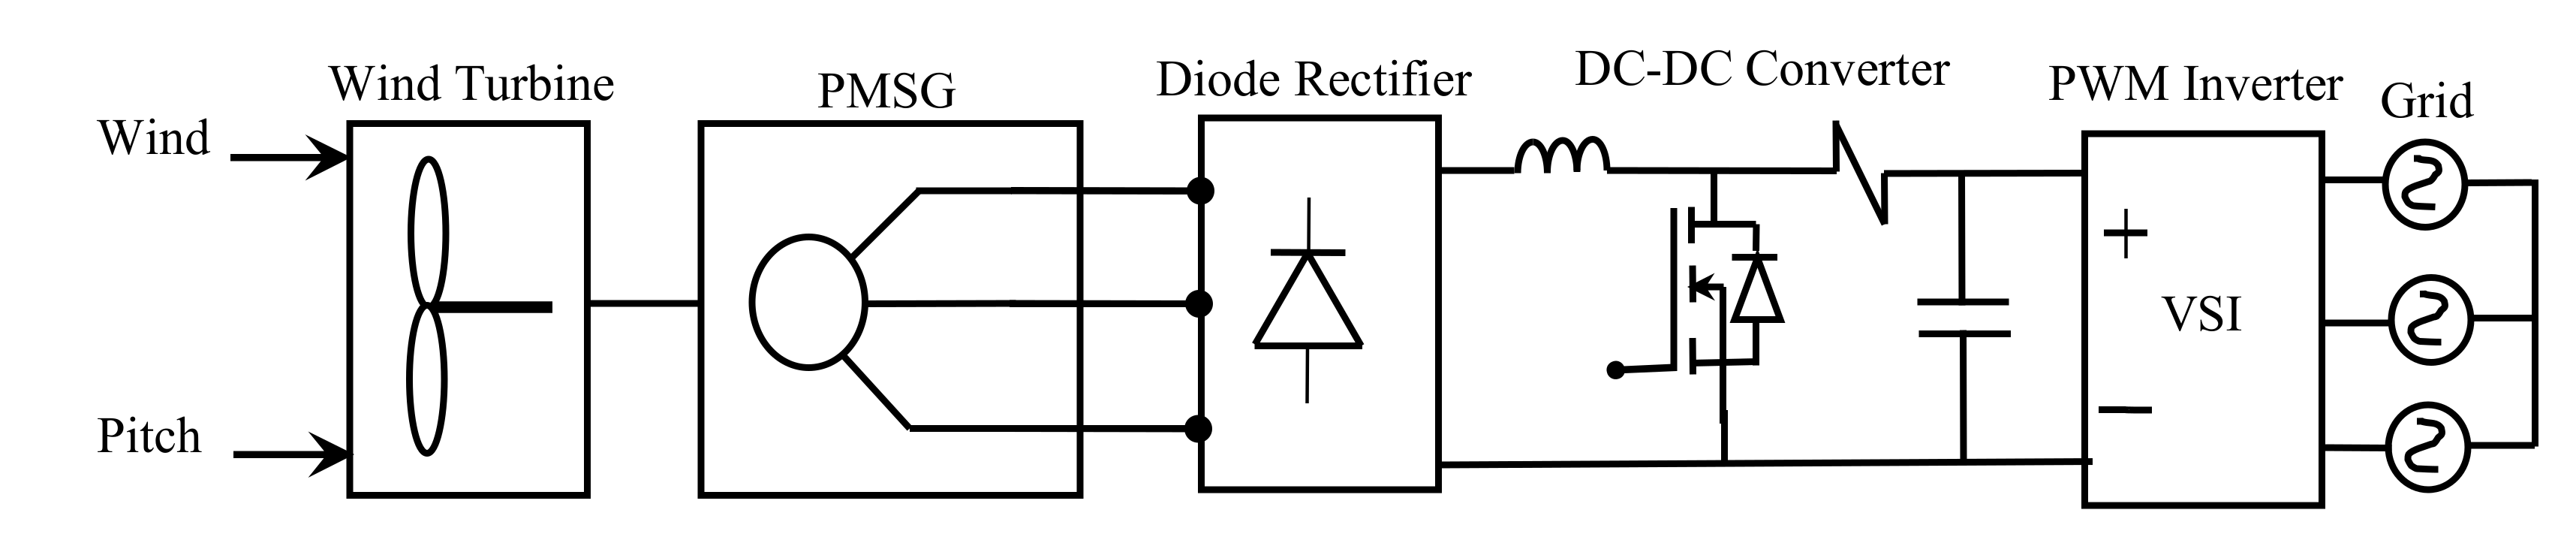
2.2. PMSG-Based Wind Energy System

Wind Turbines are required in any wind system. They operate as prime movers of electric generators which are connected to their shafts. They can be classified based on direction of their rotation: Horizontal Axis Wind Turbines (HAWT) and Vertical Axis Wind turbines (VAWT). Another classification is based on their mode of operations: fixed speed and variable speed types. The characteristics of the wind turbine and the types of the wind generator used in the wind system are the main factors that affect the mode of operation of the WECS.

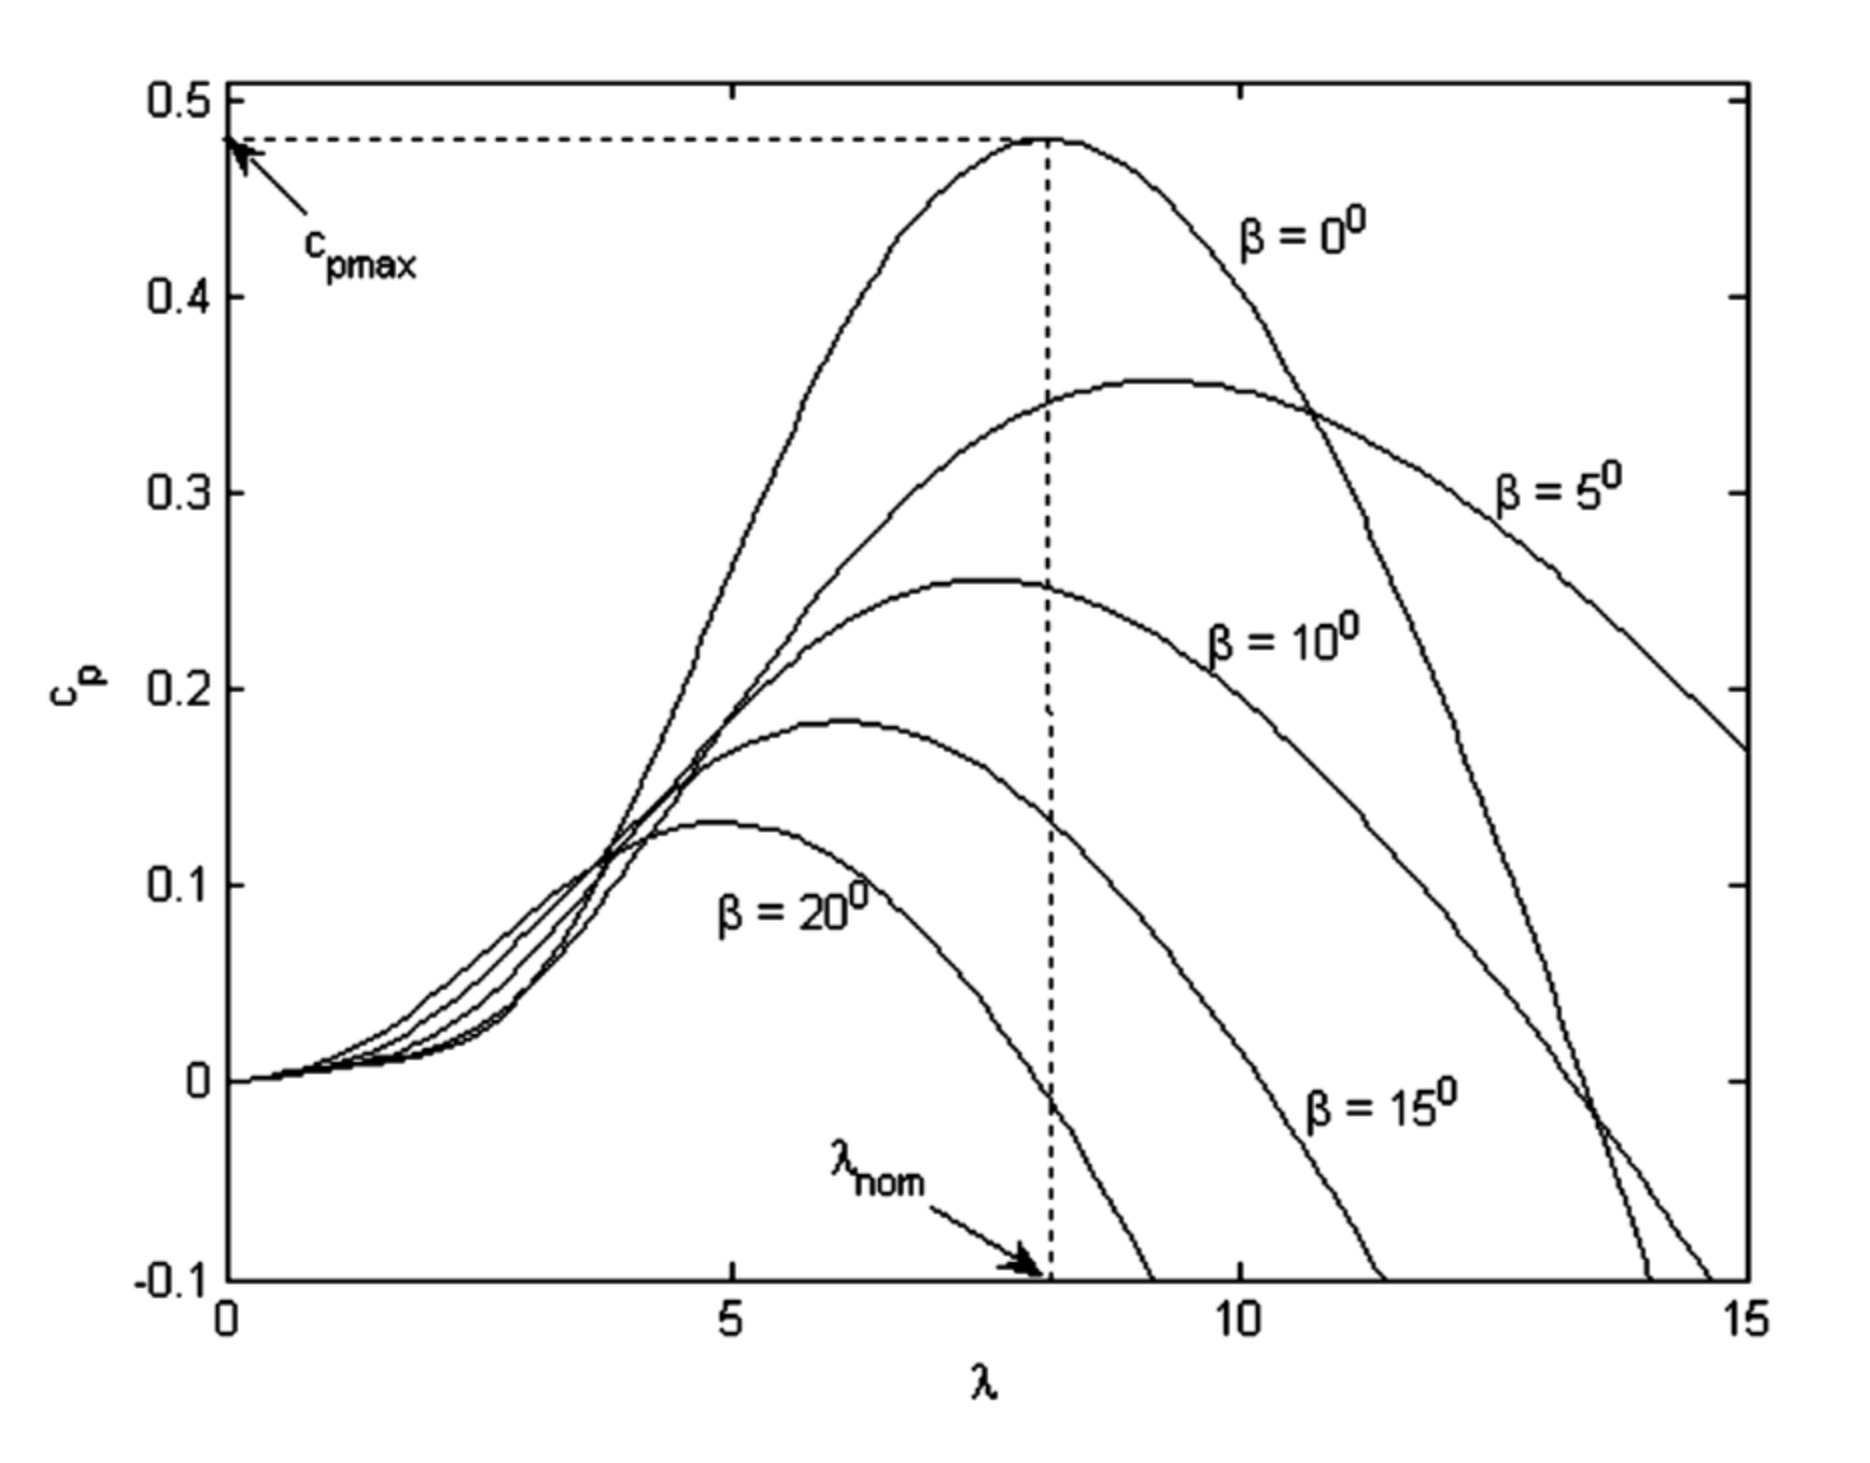
2.2.1. Wind Turbine Characteristics

The output power generated by the wind turbine can be given in terms of the turbine aerodynamic power coefficient (Cp), as follows [18,19]:
P = 0.5   ρ a A C p v 3
The aerodynamic power coefficient of a wind turbine is a performance indicator, which is influenced by the blade pitch angle (β) and the tip–speed ratio (λ). A generic equation of Cp based on the turbine characteristics is given by (2) [20,21,22,23,24,25,26,27,28,29]:
C p λ , β = C 1 C 3 λ i C 3 β C 4 e C 5 λ i + C 6 λ
where the coefficients C1 to C6 are: C1 = 0.5176, C2 = 116, C3 = 0.4, C4 = 5, C5 = 21, and C6 = 0.0068, and
λ = ω R V w
1 λ i = 1 λ + 0.08 β 0.035 β 3 + 1
R is the turbine radius in (m), Vw is the wind speed in (m/s), and ω is the turbine angular speed in (rad/s). Figure 4 shows power characteristics of a typical wind turbine with β = zero and variable speed operation [30,31,32,33].
Figure 5 shows the variation of Cp versus λ with different values of β as described by (2). It can be observed from Figure 5 that λ needs to be maintained at an optimal value for all wind speeds—to run the WECS with maximum Cp value [34,35,36,37,38,39,40]. This can be done only using variable speed operation with DFIG or PMSG where the rotor speed of the turbine can be adjusted at variable wind speed [9,41,42,43,44,45].
Pitch angle control is usually used in large scale wind systems to fix the output power of the wind turbines at a specific limit, especially at high wind speed [28,46].

2.2.2. Permanent Magnet Synchronous Generators

PMSG is usually built with several numbers of poles in WECS. Thus, it can run at a low speed that corresponds to the wind turbine’s spinning speed. As a result, the wind turbine’s rotor shaft can be directly connected to PMSG. The direct-drive operation, which does not require any additional gearbox setups, is one example of this form of operation [10]. Removal of gearboxes reduces the installation and maintenance costs and gives the system an advantage over DFIG-based systems that need the use of a gearbox. For variable speed operation, the PMSG can accommodate a wide variety of rotor speeds. The output voltage received at the stator terminals of a PMSG varies in frequency and amplitude according to the wind speed.
Power electronic converters are used to link the stator to the grid. A typical PMSG-based wind energy conversion system is shown in Figure 6. The utilized power converters are rated at full capacity because there is no additional rotor control, ensuring maximum wind energy conversion efficiency for a wide range of wind speeds. Furthermore, power converters with full capacity ratings help to meet various grid regulations and do not require additional equipment for fault ride-through scenarios [11].

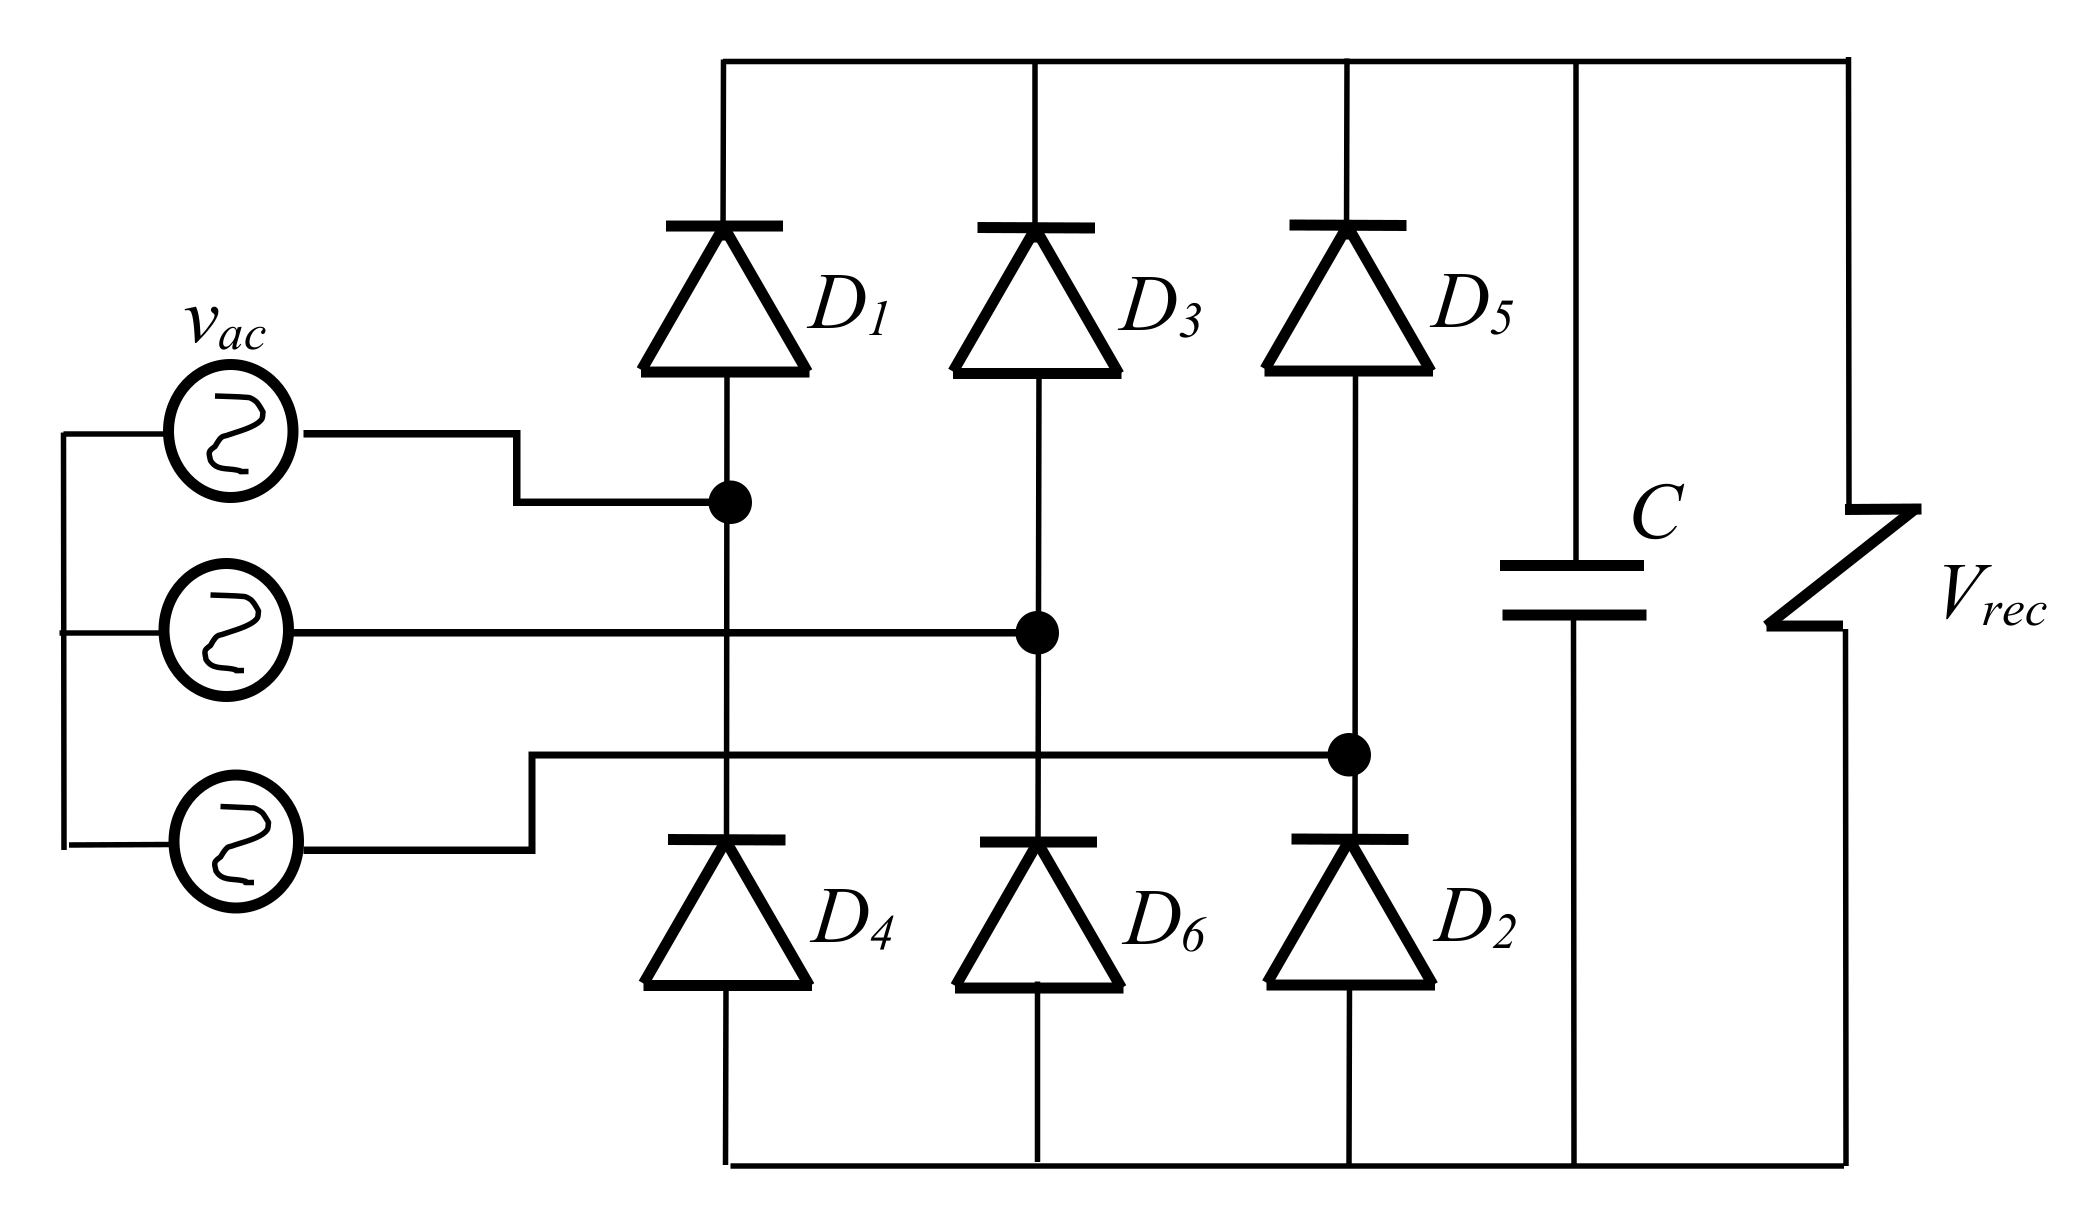
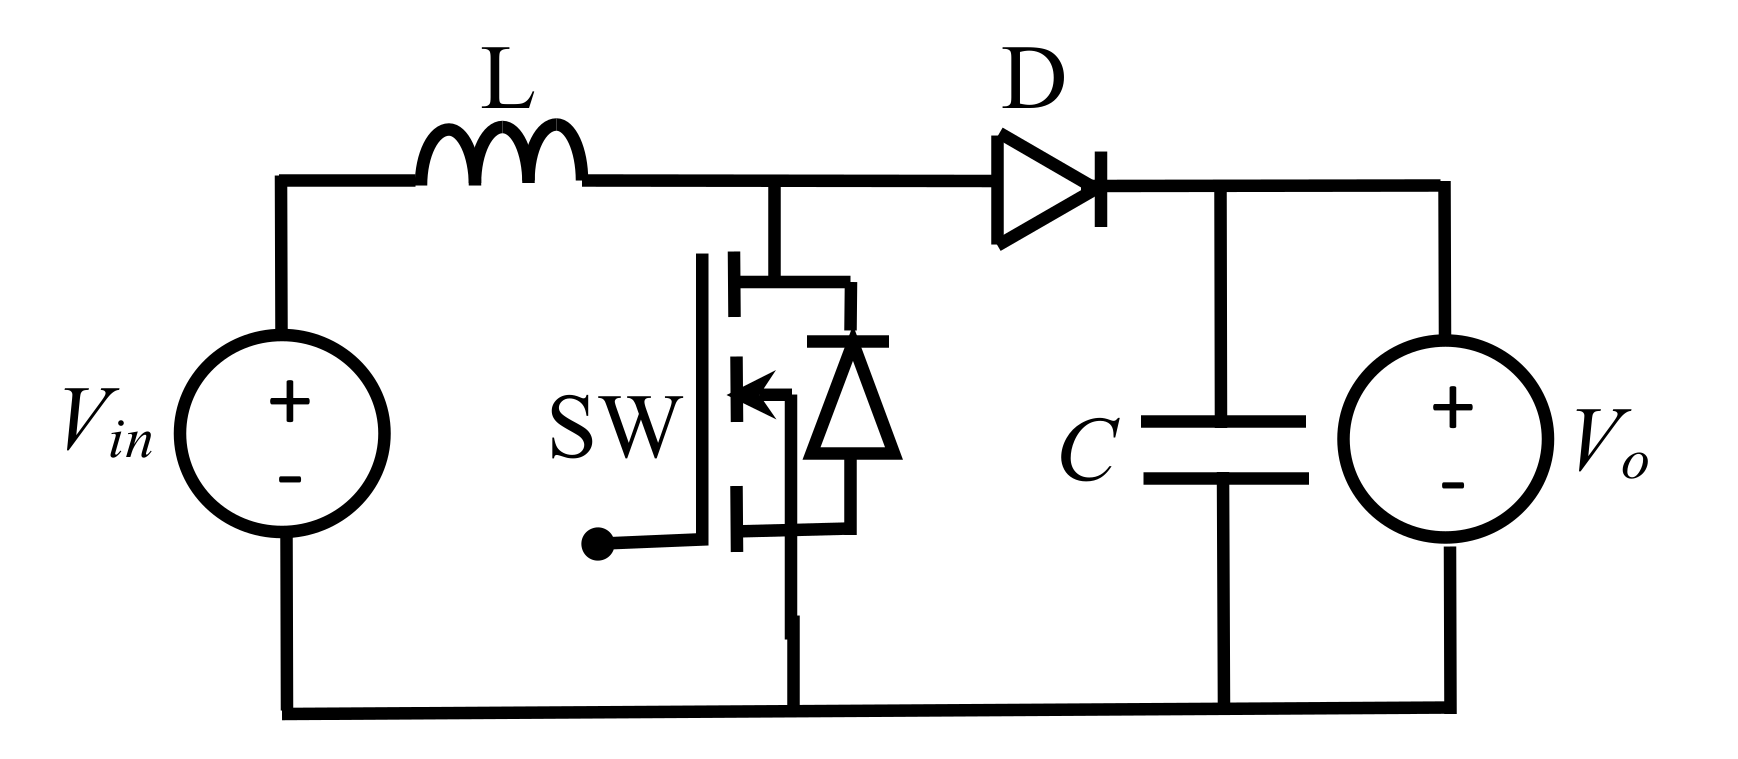
2.3. Power Electronic Devices

The power converters used are three-phase diode rectifiers, DC–DC converters to achieve the desired DC voltage level, and inverters to obtain an AC output voltage with a specific power frequency from the generated DC voltage. As a result, the PMSG’s variable-frequency output voltage is transformed to a grid-frequency sinusoidal AC voltage.
A boost converter in the WECS is used to raise the output voltage of the three-phase diode rectifier to achieve a specific value of DC voltage. The switching signal of this boost converter is generated by a specific control algorithm which will be discussed later. The PV system uses a DC–DC converter, and the switching signal is designed for generating a proper voltage and power.

2.3.1. Three-Phase Diode Rectifier of PMSGs

The diode rectifier is used in this work to convert the three-phase output voltage of the PMSG into a DC voltage. The rectified DC voltage (Vrec) is given by [12]:
V r e c = 3 2 π V u r m s
where Vurms is the rms voltage applied to the three-phase rectifier. Figure 7 depicts the circuit diagram of a three-phase diode rectifier. Although the diode rectifier’s output voltage is uncontrolled, there are no additional losses due to the switching of any power electronic components. If diode losses are ignored, it can be assumed that the whole power obtained by PMSG is completely converted from AC to DC.

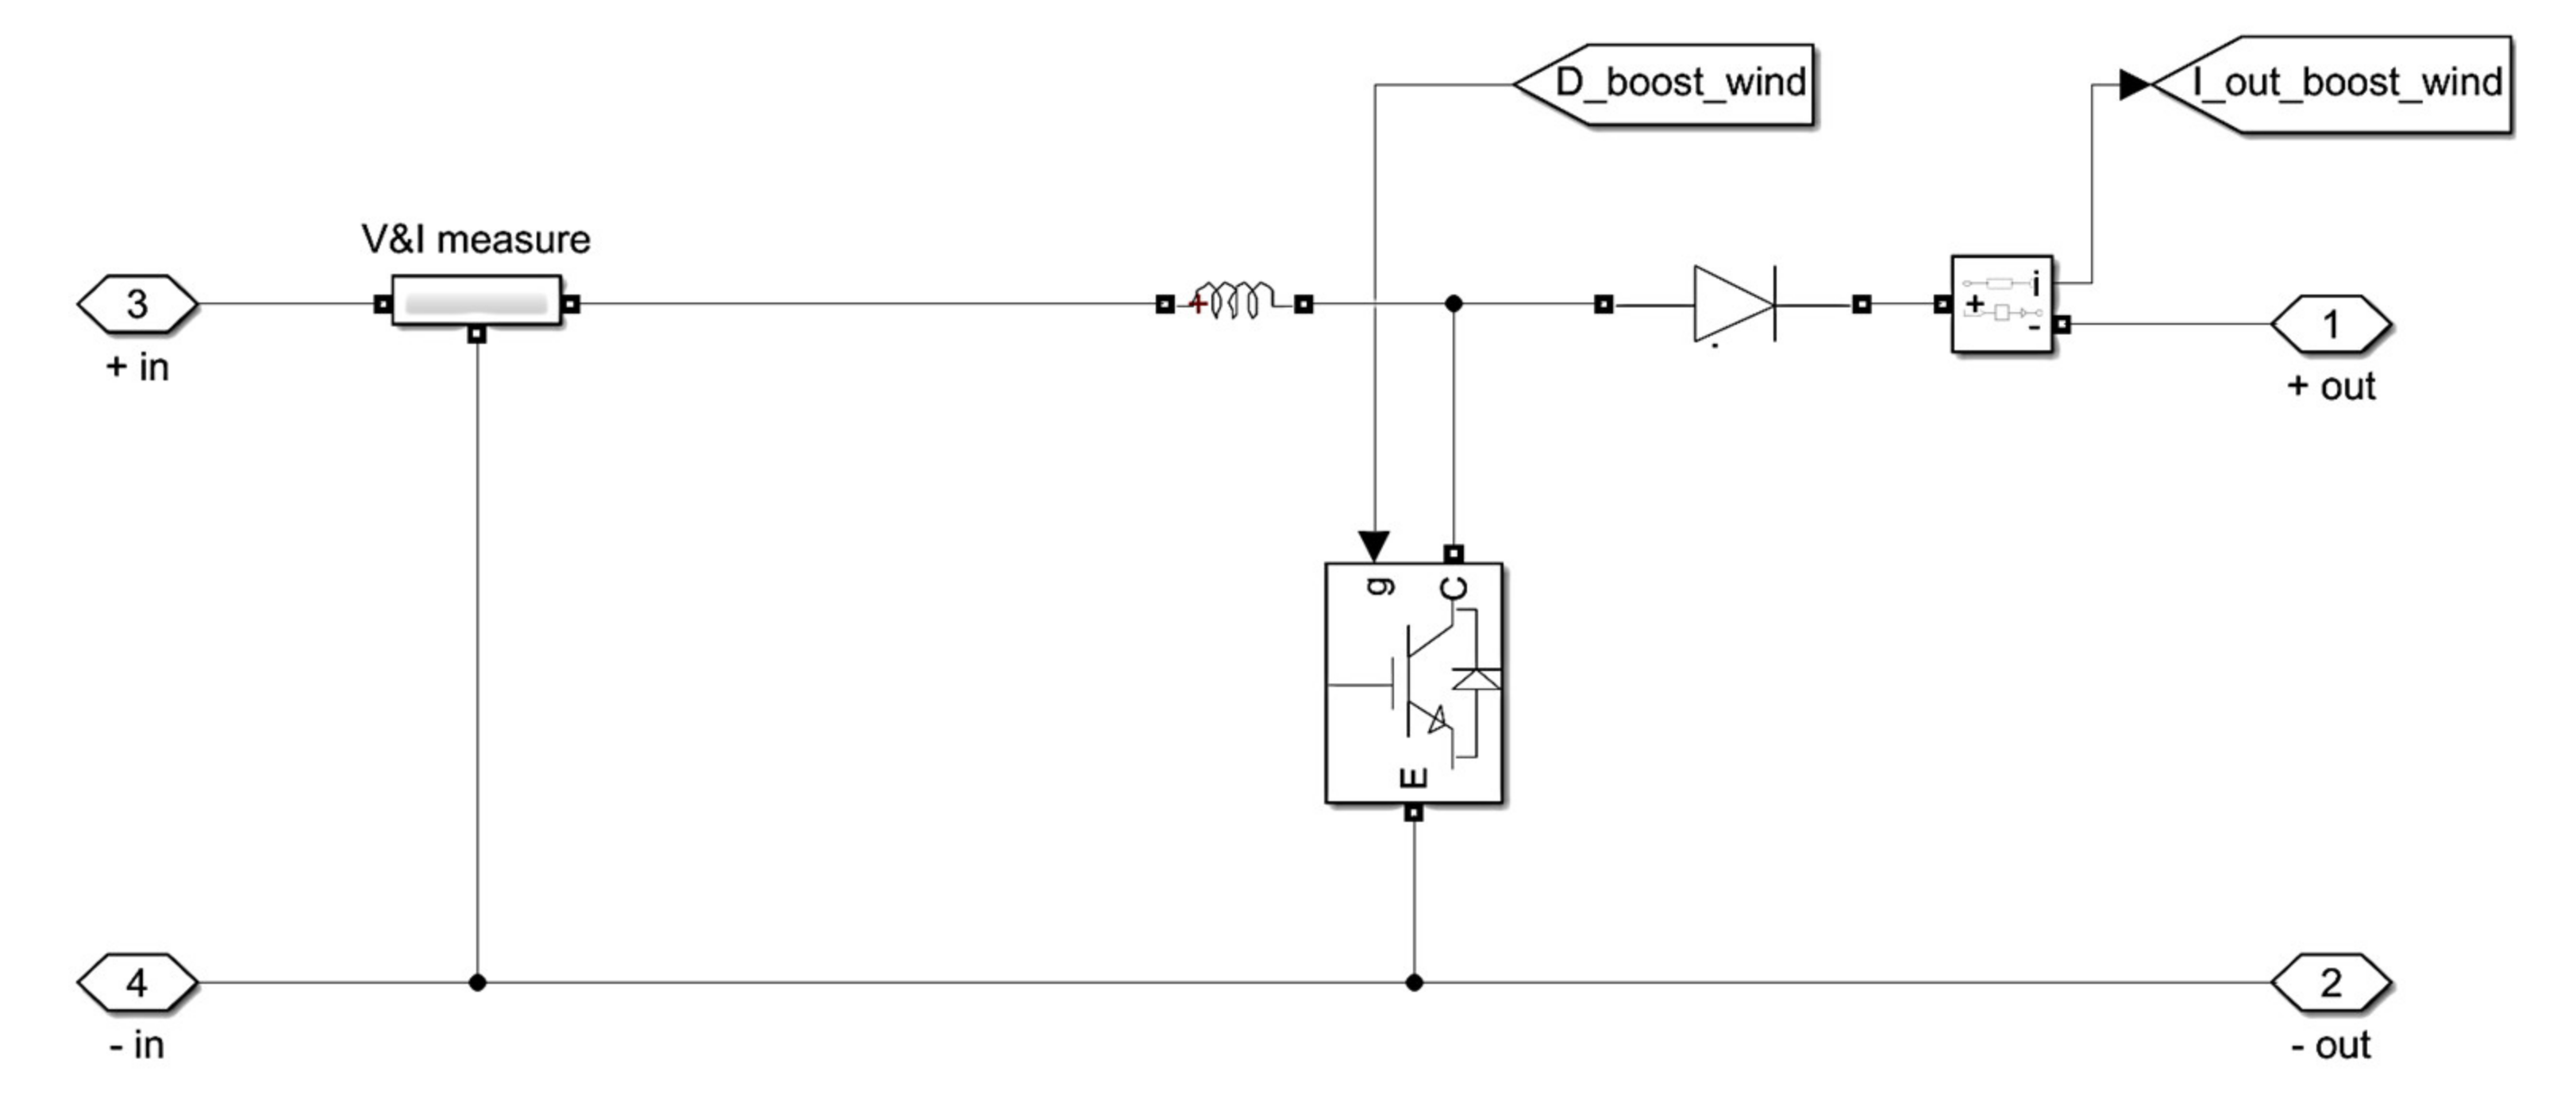
2.3.2. Boost Converter
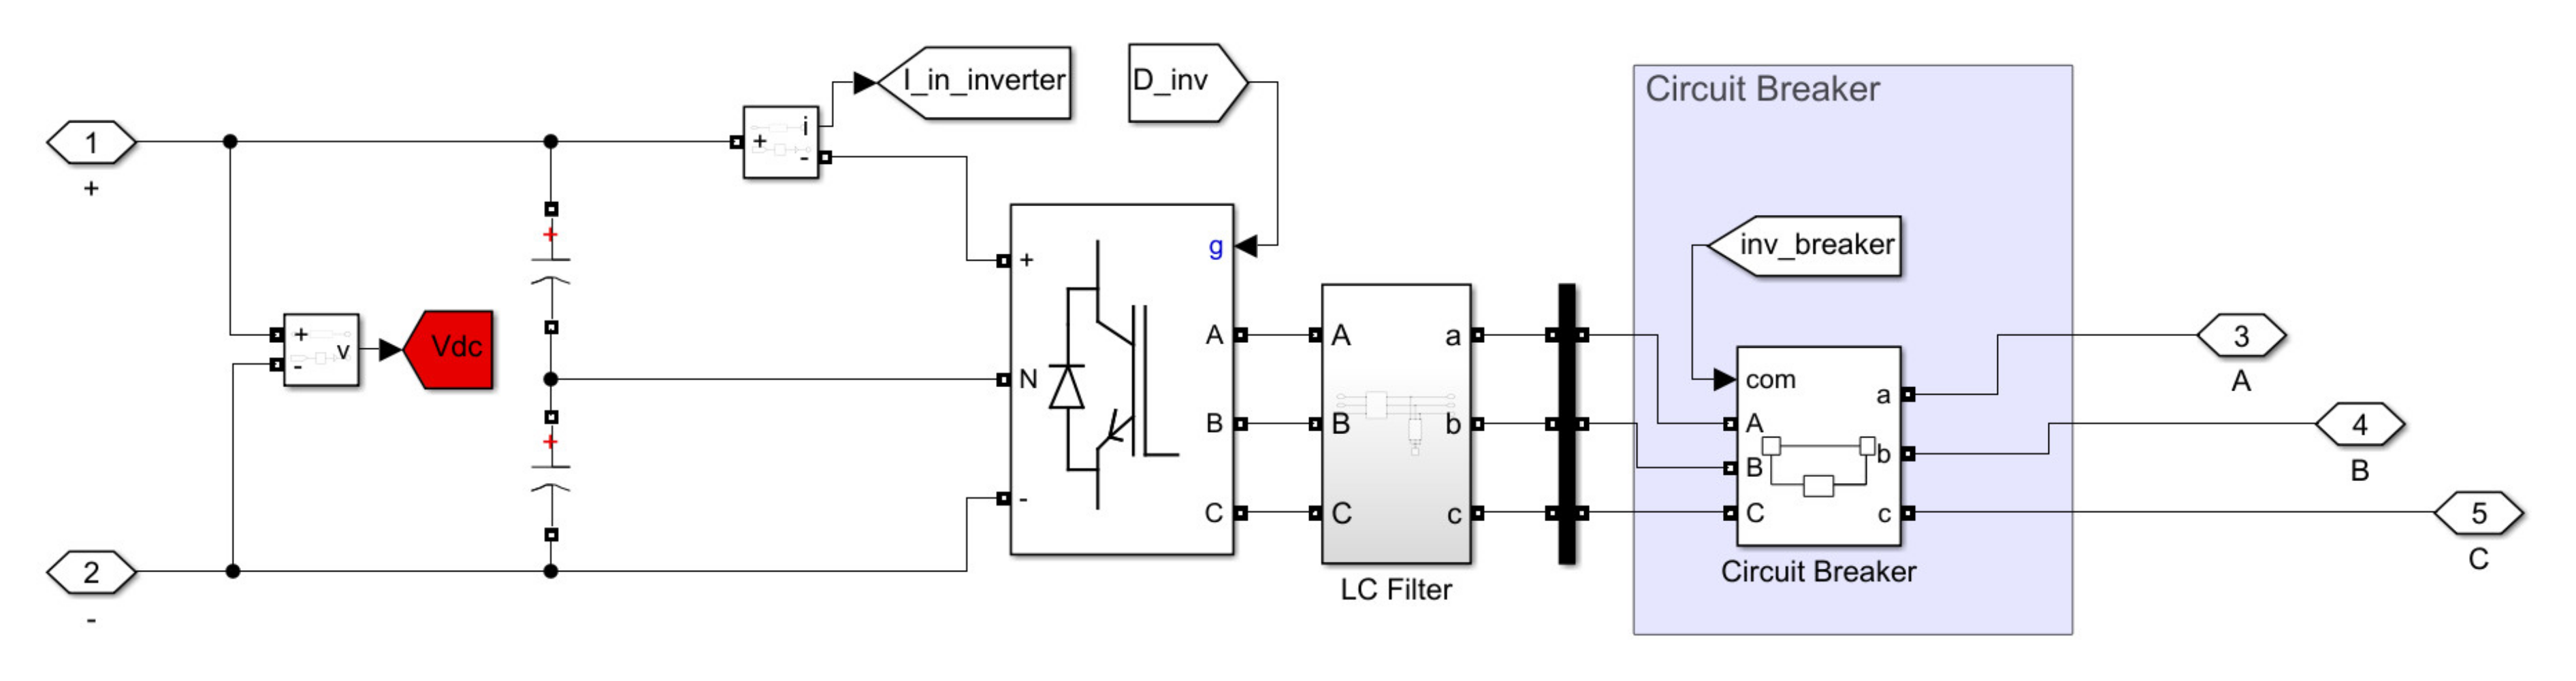
A circuit diagram of a boost converter is shown in Figure 8. The output voltage of the boost converter (Vo) is higher than the input voltage (Vin). Under continuous current mode (CCM) of operation, Vo is given by [12]:
V o = V i n 1 d
where D is the switch’s duty cycle. In comparison to the buck converter, the boost converter requires a larger inductor (L) and output filter capacitor (C). By carefully selecting their values, the input current may be kept constant.
The PMSG’s variable DC rectified voltage is boosted to a constant voltage of 700 V by the boost converter. Equations (7)–(9) are used to design the component parameters of the boost converter [13]:
Δ i L = V p v 2 L D T s
Δ v = V d c 2 R C d c D T s
where:
T s = 1 f s
and ΔiL is the inductor current ripple which is assumed to be 5% of the output current, Δv is the output DC voltage ripple which is assumed to be 1% of the output DC voltage, and fs is the switching frequency. In the PV system, the MPPT algorithm using Fuzzy logic provides a control signal for a proper gating of the boost converter.

2.3.3. Inverters

Different topologies and configurations of grid-connected PV system inverters are discussed in detail in [9]. The authors in [10] use a two-level Neutral Point Coupling (NPC) inverter for a hybrid PV/battery system. In this paper, the work has been extended by considering a three-phase three-level NPC. This topology provides three output voltage levels: (+VDC/2), zero and (−VDC/2), which is better than two-level inverter topology in terms of THD. Furthermore, because the voltage stress is decreased to half of the DC voltage, lower switching frequency and rating IGBT modules can be used. In the linear modulation area, the peak amplitude of the line-to-line voltage at the output is given by (10):
( v l l ) p e a k = m a 3 V D C 2
where ma is the amplitude modulation index. The circuit diagram for a multi-level inverter is shown in Figure 9:
LC-filter is being used to get the final form that is close to sinusoidal waveform. The values of L and C have to be selected based on (11) and (12), respectively [14]:
L f = 0.1 U 2 2 π f P p
C f = 0.05 P p 2 π f U 2

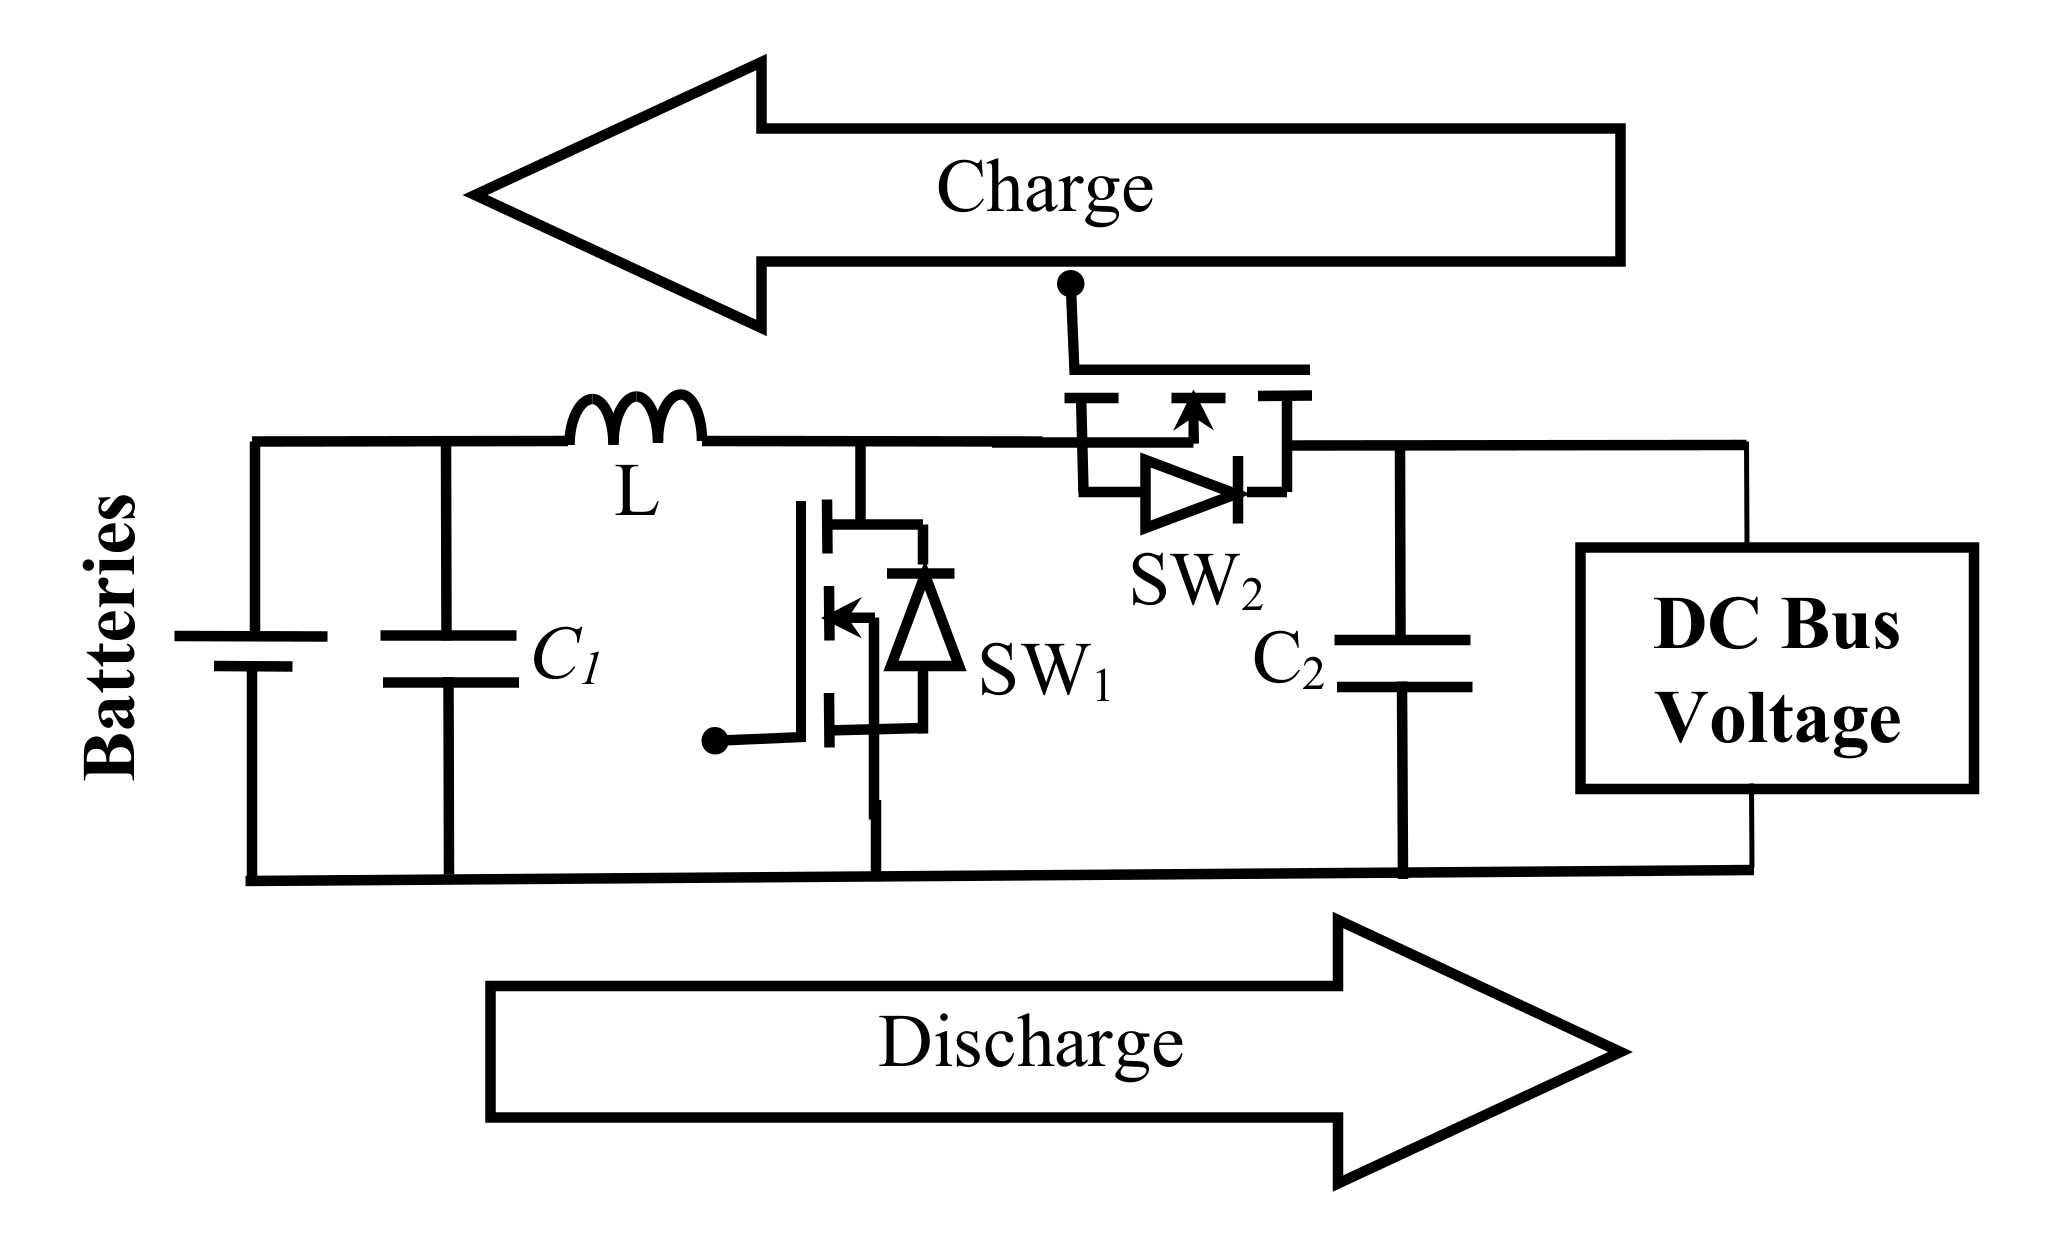
2.3.4. Bidirectional DC–DC Converter with a Battery Storage System

In most PV power systems, lead-acid batteries are employed. The charging and discharging of these batteries are handled by a bidirectional DC–DC converter. The authors in [15,16] describe several topologies and configurations of bidirectional DC–DC converters used in PV systems. For charging and discharging operations, a buck–boost DC–DC converter is used in this research.
The usual configuration of the bidirectional converter employed in this paper is shown in Figure 10. The bidirectional converter is operated as a buck converter with the gate signal applied to the switch S1. This mode of operation occurs to charge the battery system when PV output is high. When the PV system’s power is low or the grid is down, the bidirectional converter acts as a boost converter, sending a gate signal to switch S2. As a result, the battery is discharged, and energy is supplied to the load. Parameters of bidirectional converters are designed using (13)–(15).
C H = D R H f s Δ V H / V H
L b ,   m i n D 1 D 2 R H 2 f s
For buck mode of operation:
L b ,   m i n 1 D R L 2 f s
where RL and RH are the load resistance at buck and boost sides, respectively. CH is the capacitance value at the boost side. Lb,min is the minimum value of the inductance and fs is the switching frequency. Other specifications of this microgrid are shown in Table 1.

3. Control System

The new control system of this microgrid is divided into four subsystems: fuzzy logic-based MPPT for controlling the PV system, WECS controllers, battery unit controllers, and inverter controllers. The main purpose of the control system is to maintain serving power to load and protect batteries’ health from overcharge or over discharge which harm them and shorten their lifetime. Therefore, the controller keeps the SOC of the batteries within the safe limits. The following subsections discuss the subsystems of each controller individually:

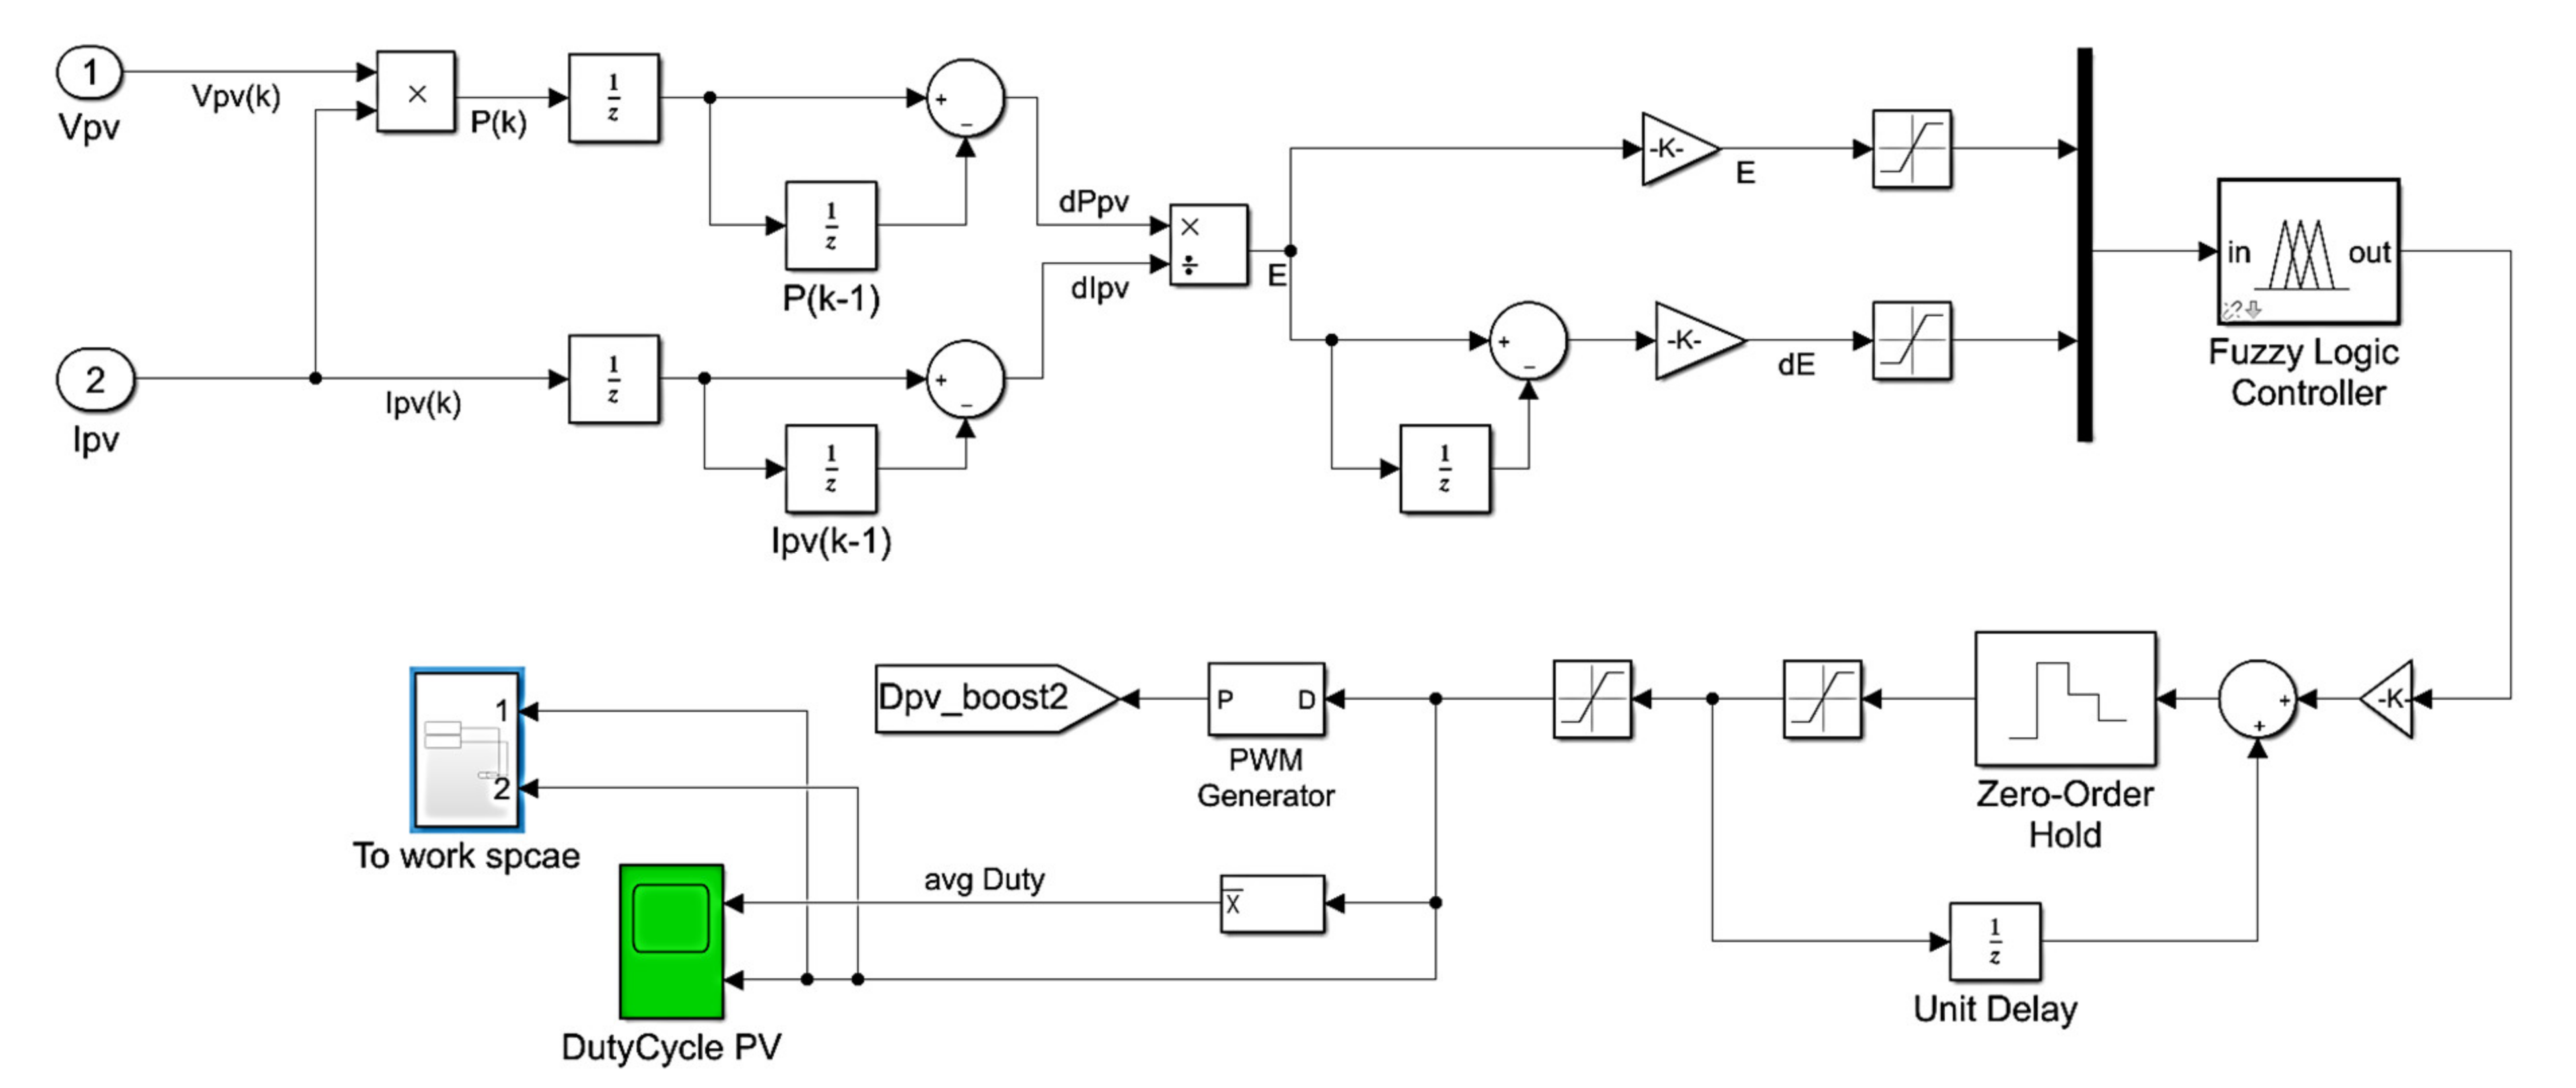
3.1. Bidirectional DC–DC Converter with Battery Storage System

The inputs of FLC are the error (E) and the change in error (dE) signals, which are generated using the power and the current of the PV module. E and dE signals are defined by (16) and (17), respectively:
E k = P p v k P p v k 1 I p v k I p v k 1
d E k = E k E k 1
where Ppv (k) and Ipv (k) are the power and the current of the PV module, respectively. The duty cycle change is the output of FLC. Fuzzification, rule base, inference engine, and defuzzification are the four main elements of fuzzy logic control operation which will be discussed individually in the following subsections.

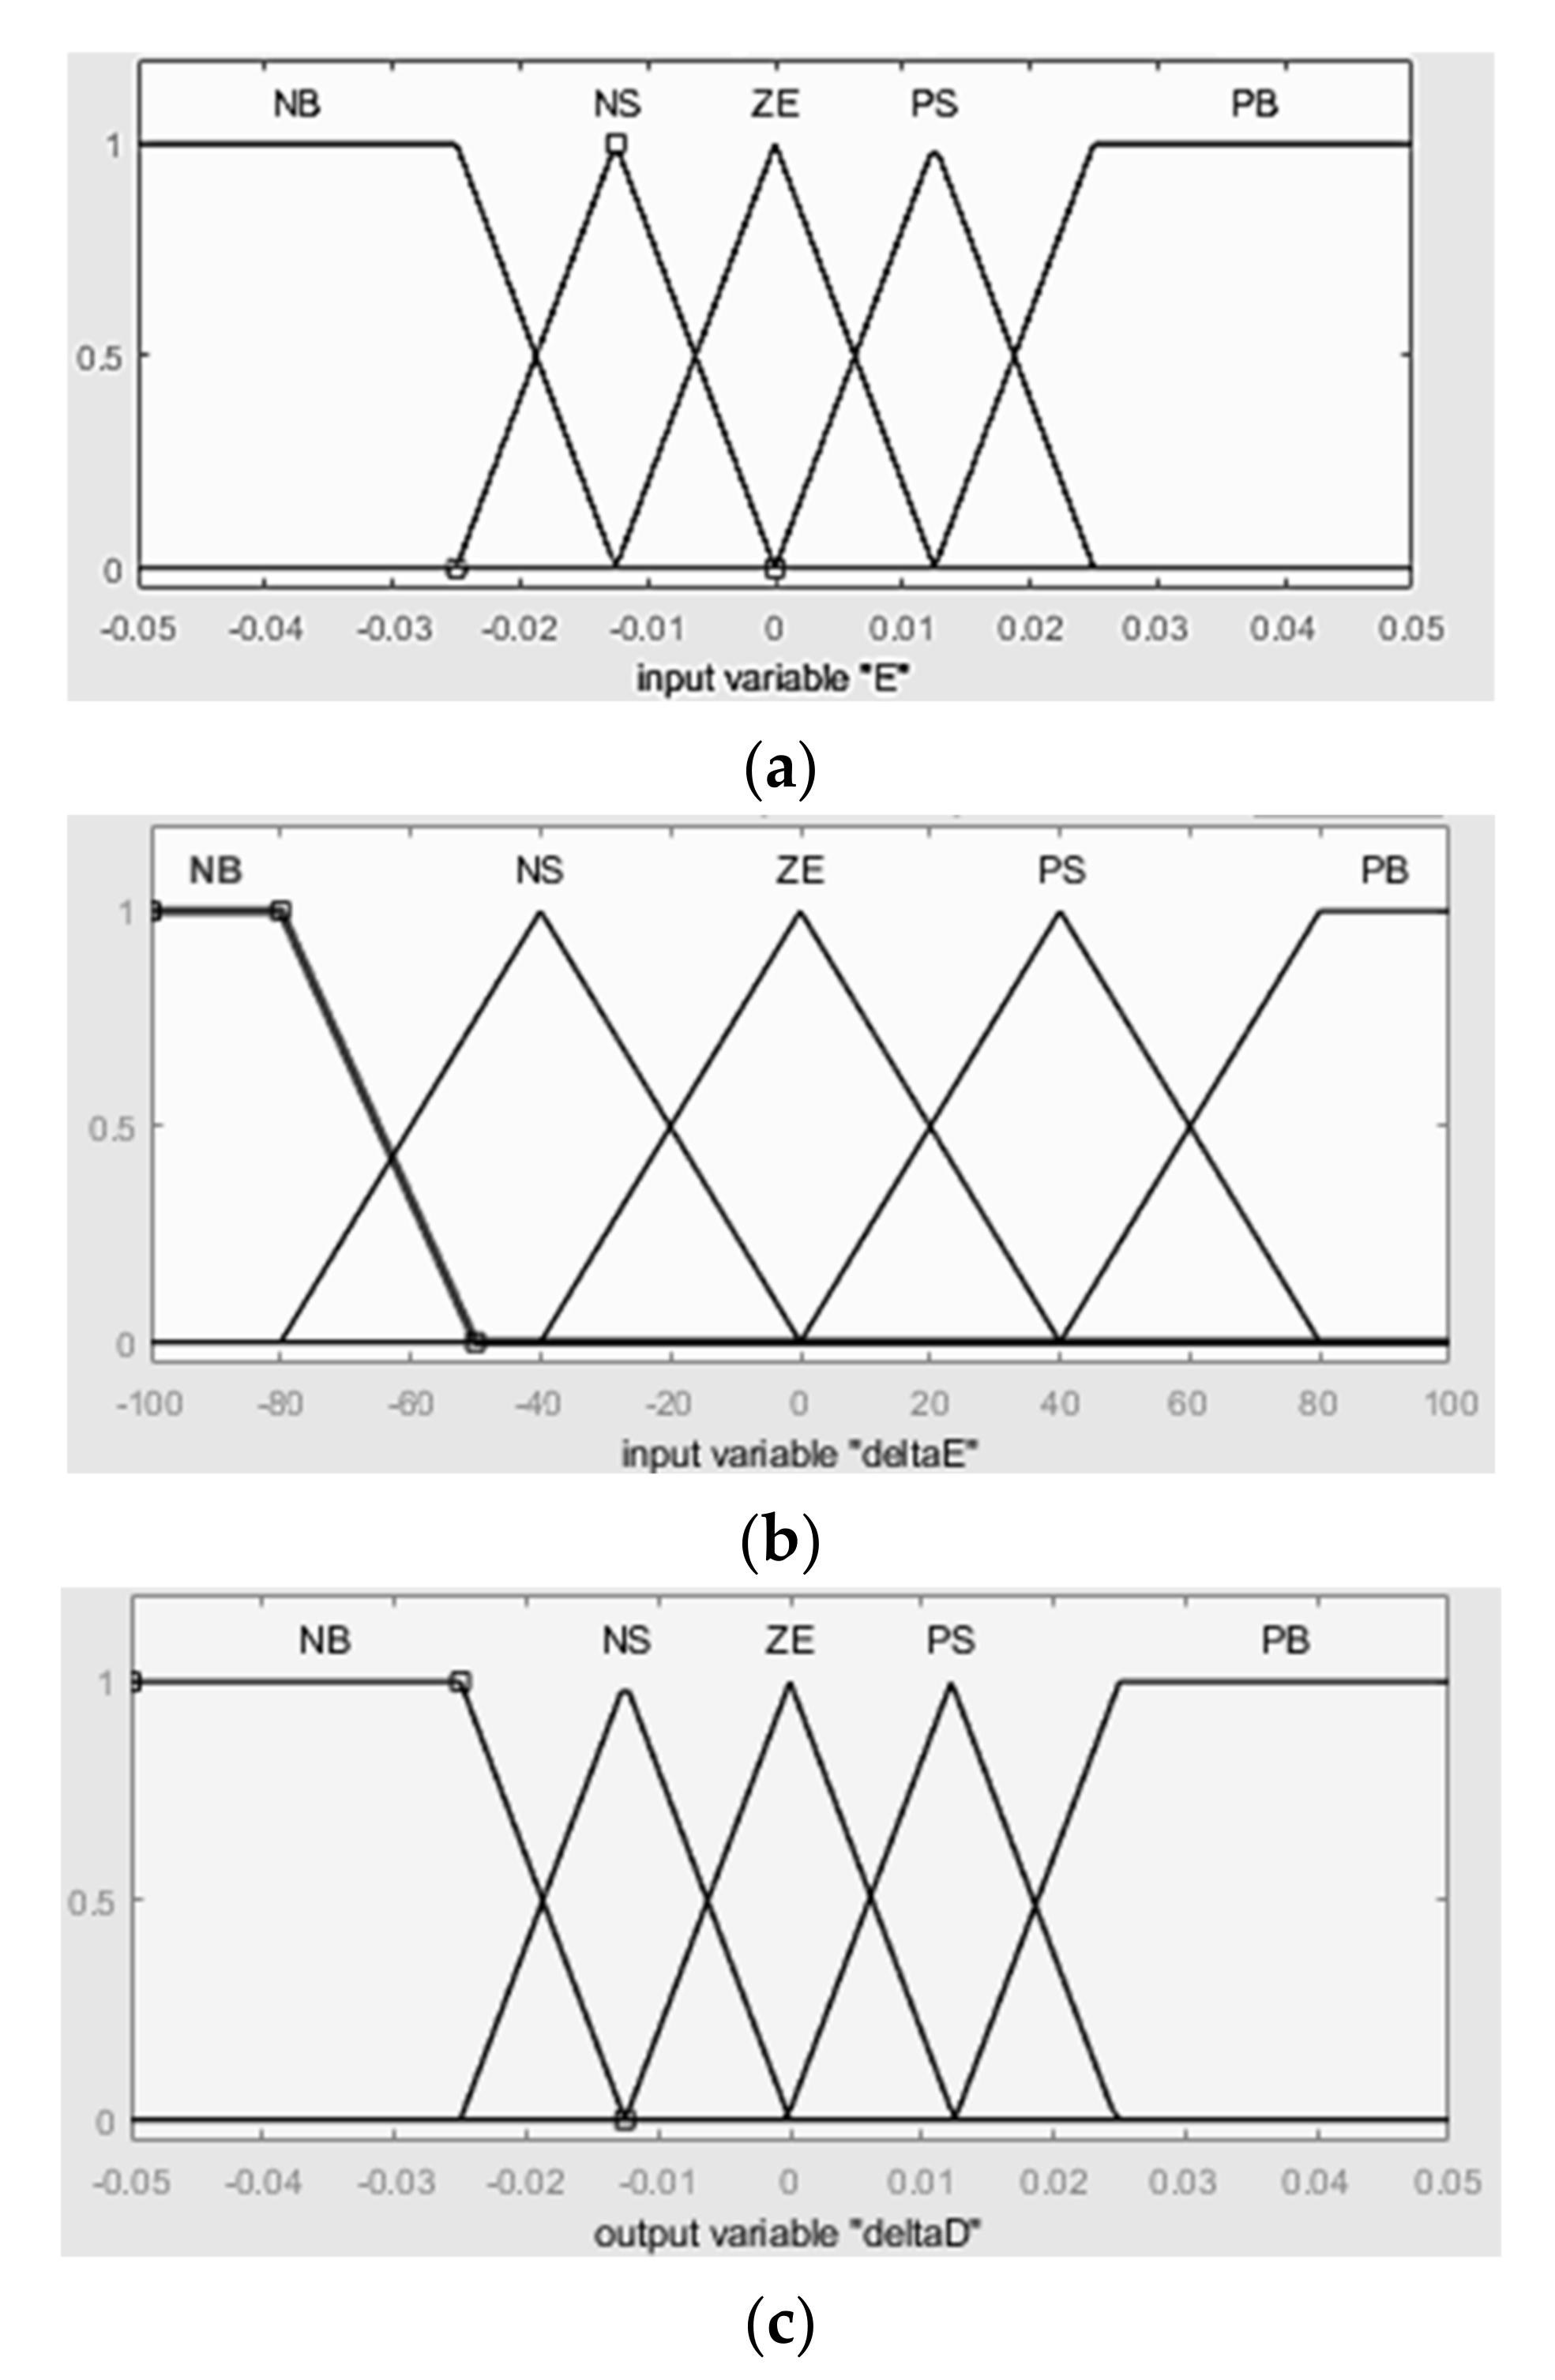
3.1.1. Fuzzification

Five fuzzy subsets are used to assign membership function values to linguistic variables: Negative Big (NB), Negative Small (NS), Zero (ZE), Positive Small (PS), and Positive Big (PB). Figure 11 depicts the partition of fuzzy subsets and the shape of membership functions that can adapt and implement a given system.

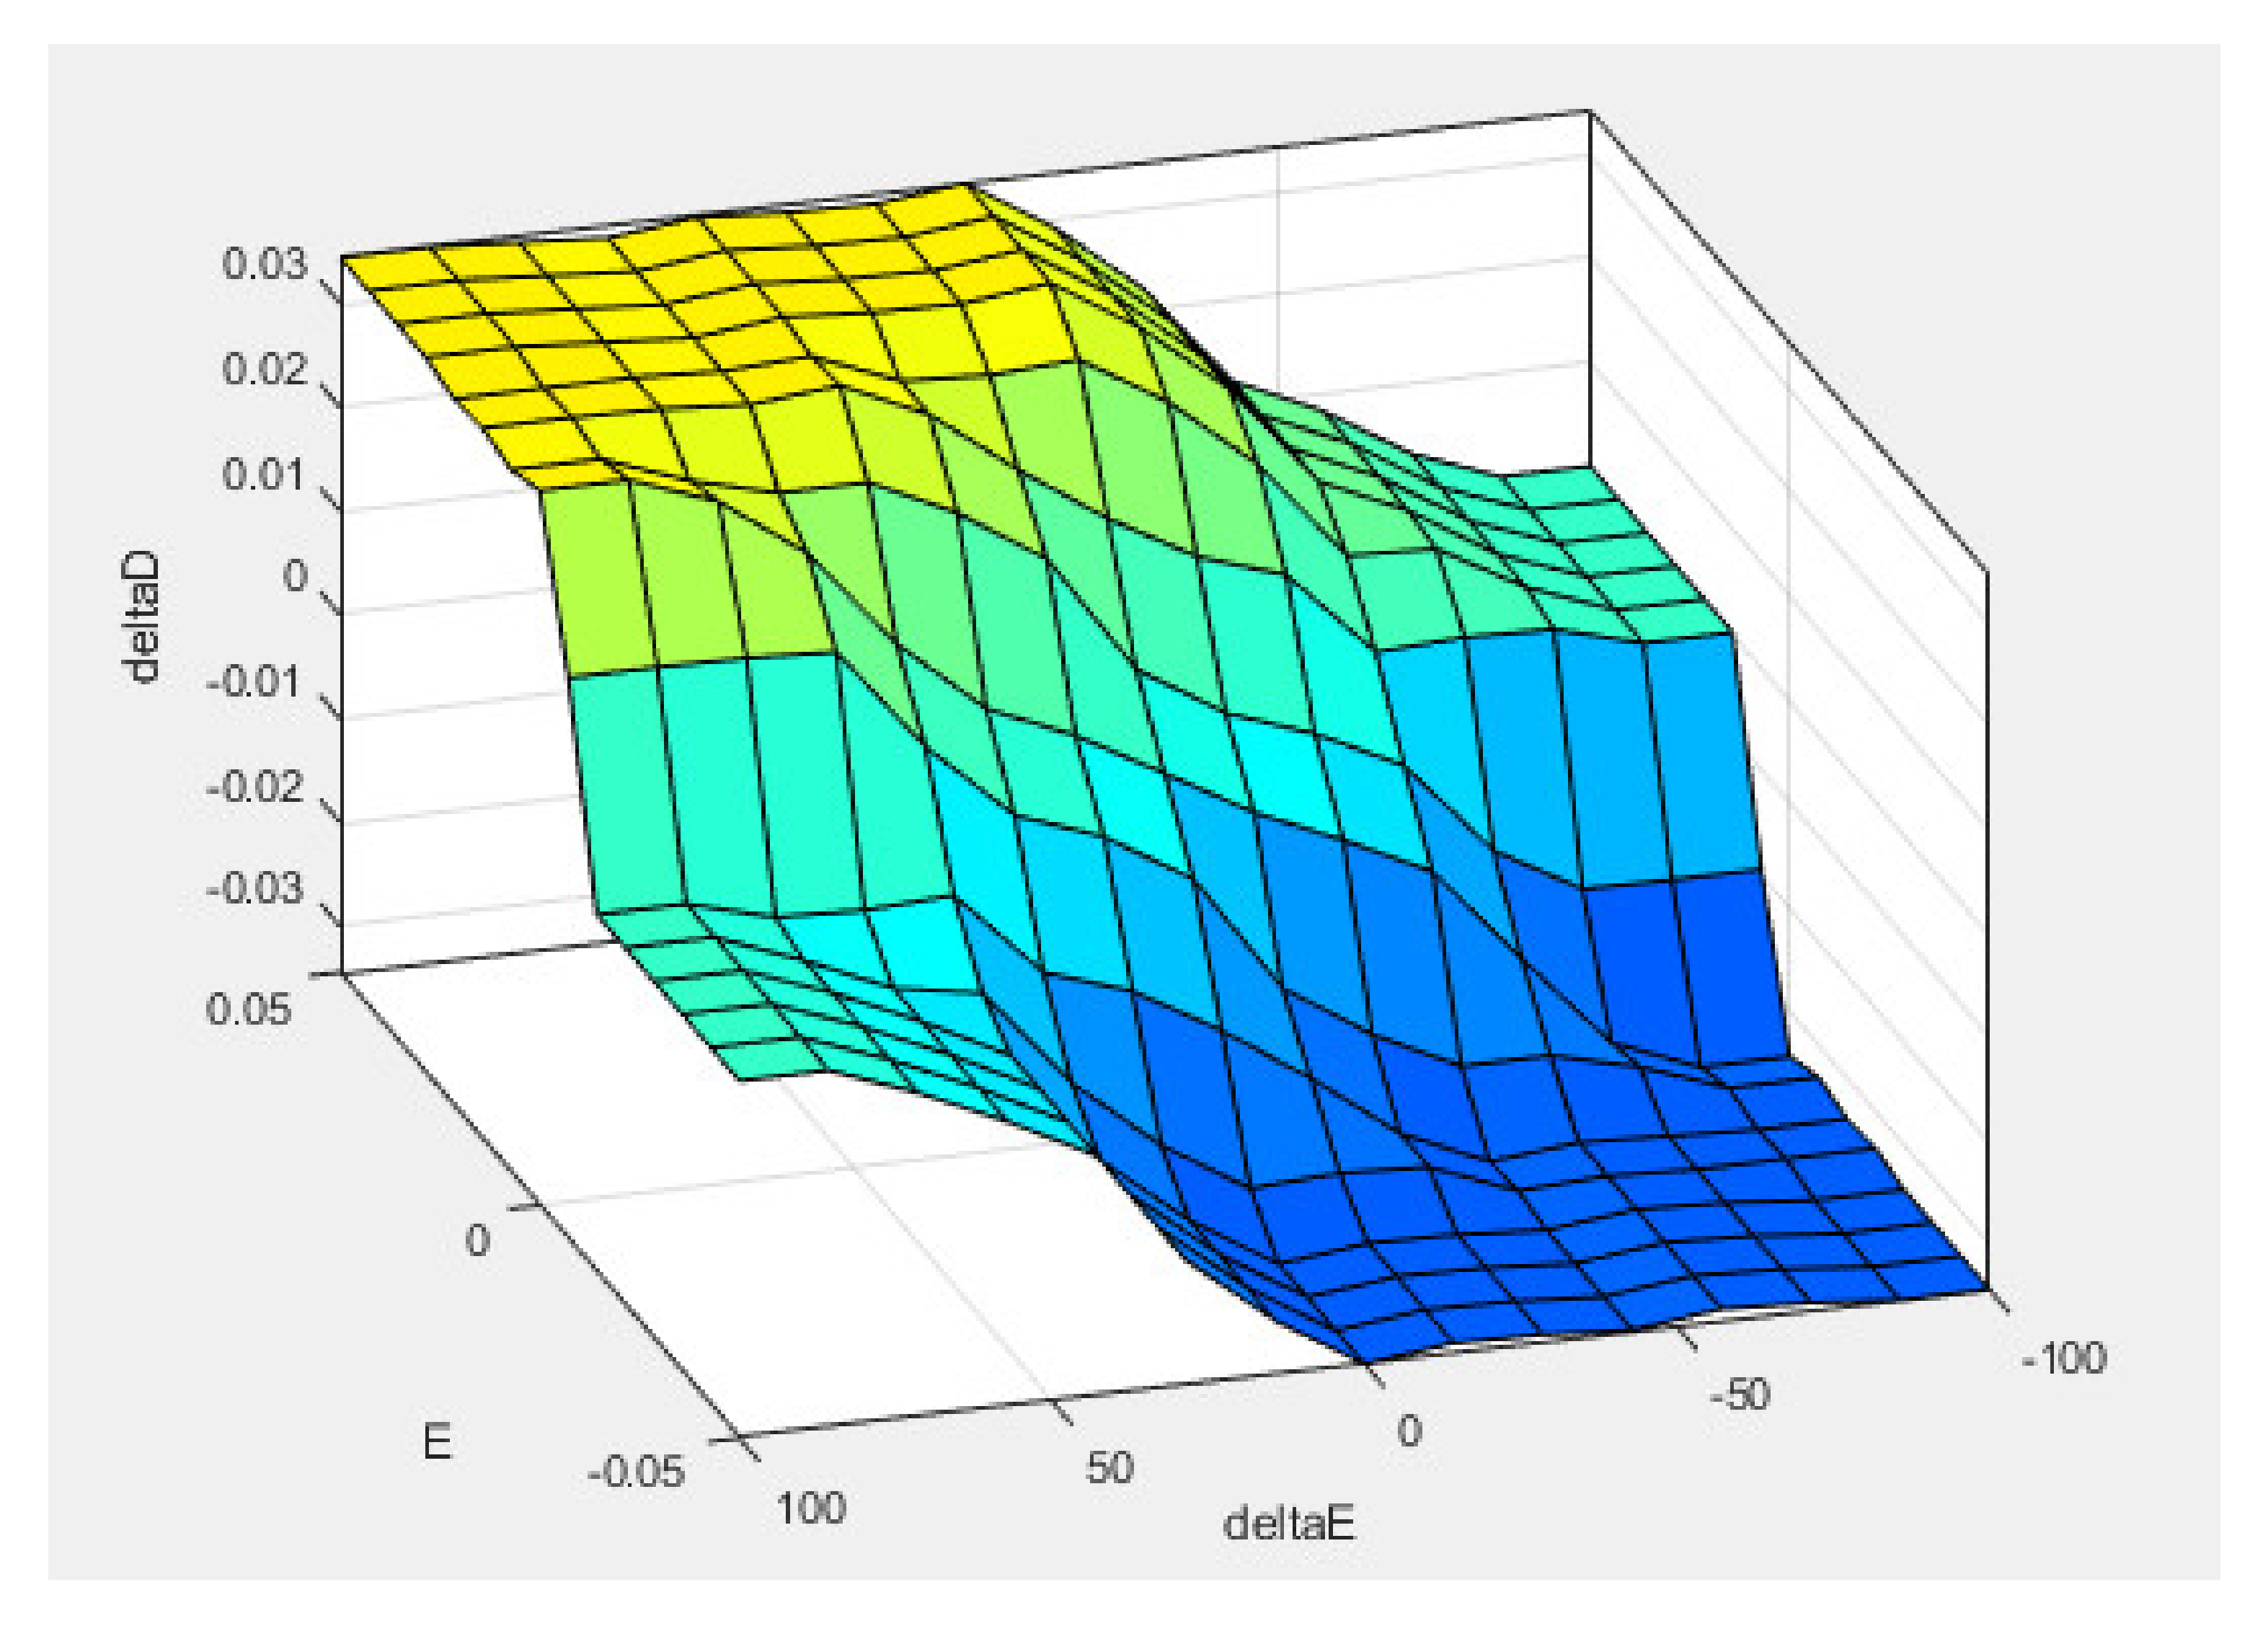
3.1.2. Inference Method

The fuzzy rule base and fuzzy implication sub-blocks make up the majority of the inference engine. The inference engine receives the fuzzified inputs, and the rule base is then applied. The fuzzy output set is identified using a Min-Max fuzzy implication method [28]. The twenty-five fuzzy rules, used in this controller, are listed in Table 2. These rules describe the relation between the two input variables (E and dE) and the output variable (dD), see Figure 12. This figure shows all cases that can be true to a certain degree, and the suitable change in the duty cycle.
The main purpose of the controller is to keep the slope equal to zero and achieve the MPP. This can be done by applying the fuzzy rules that process the possibilities of the operation point on the P–I curve of the PV array to maintain MPP and control the change in the duty cycle. The output of fuzzy logic control has been controlled through PWM which generated pulses to control the MOSFET switch in a DC–DC converter. The configuration of the MPPT topology is presented in Figure 13, where the inputs are voltage and current of the PV panel, and the output is the duty cycle of the DC–DC boost converter.

3.2. WECS Controllers

As discussed before, the PMSG is connected to a three-phase bridge rectifier to convert the variable AC voltage into a DC voltage. Then, a boost converter is used to increase the DC bus voltage and fix it at 700 V. The gating of the boost converter is generated through a basic PI controller which generates the duty cycle to provide the boost converter with a proper gating signal. Figure 14 and Figure 15 show the boost converter and its control circuit.

3.3. Bidirectional DC–DC Converter Control

The overall control system is designed to satisfy the load in all scenarios [19]. When the power generated by the PV panel is greater than the power consumption by the load, the surplus power goes for charging batteries. When the power generated by the PV panel is not enough to supply the load, the extra power needed by the load is drawn from the charged batteries.
A bidirectional DC–DC converter control system converter consists of two loops, outer and inner voltage and current loops, see Figure 16. The outer loop is in charge of keeping the DC-link voltage constant, while the inner loop is in charge of keeping the battery energy storage units charging and discharging.

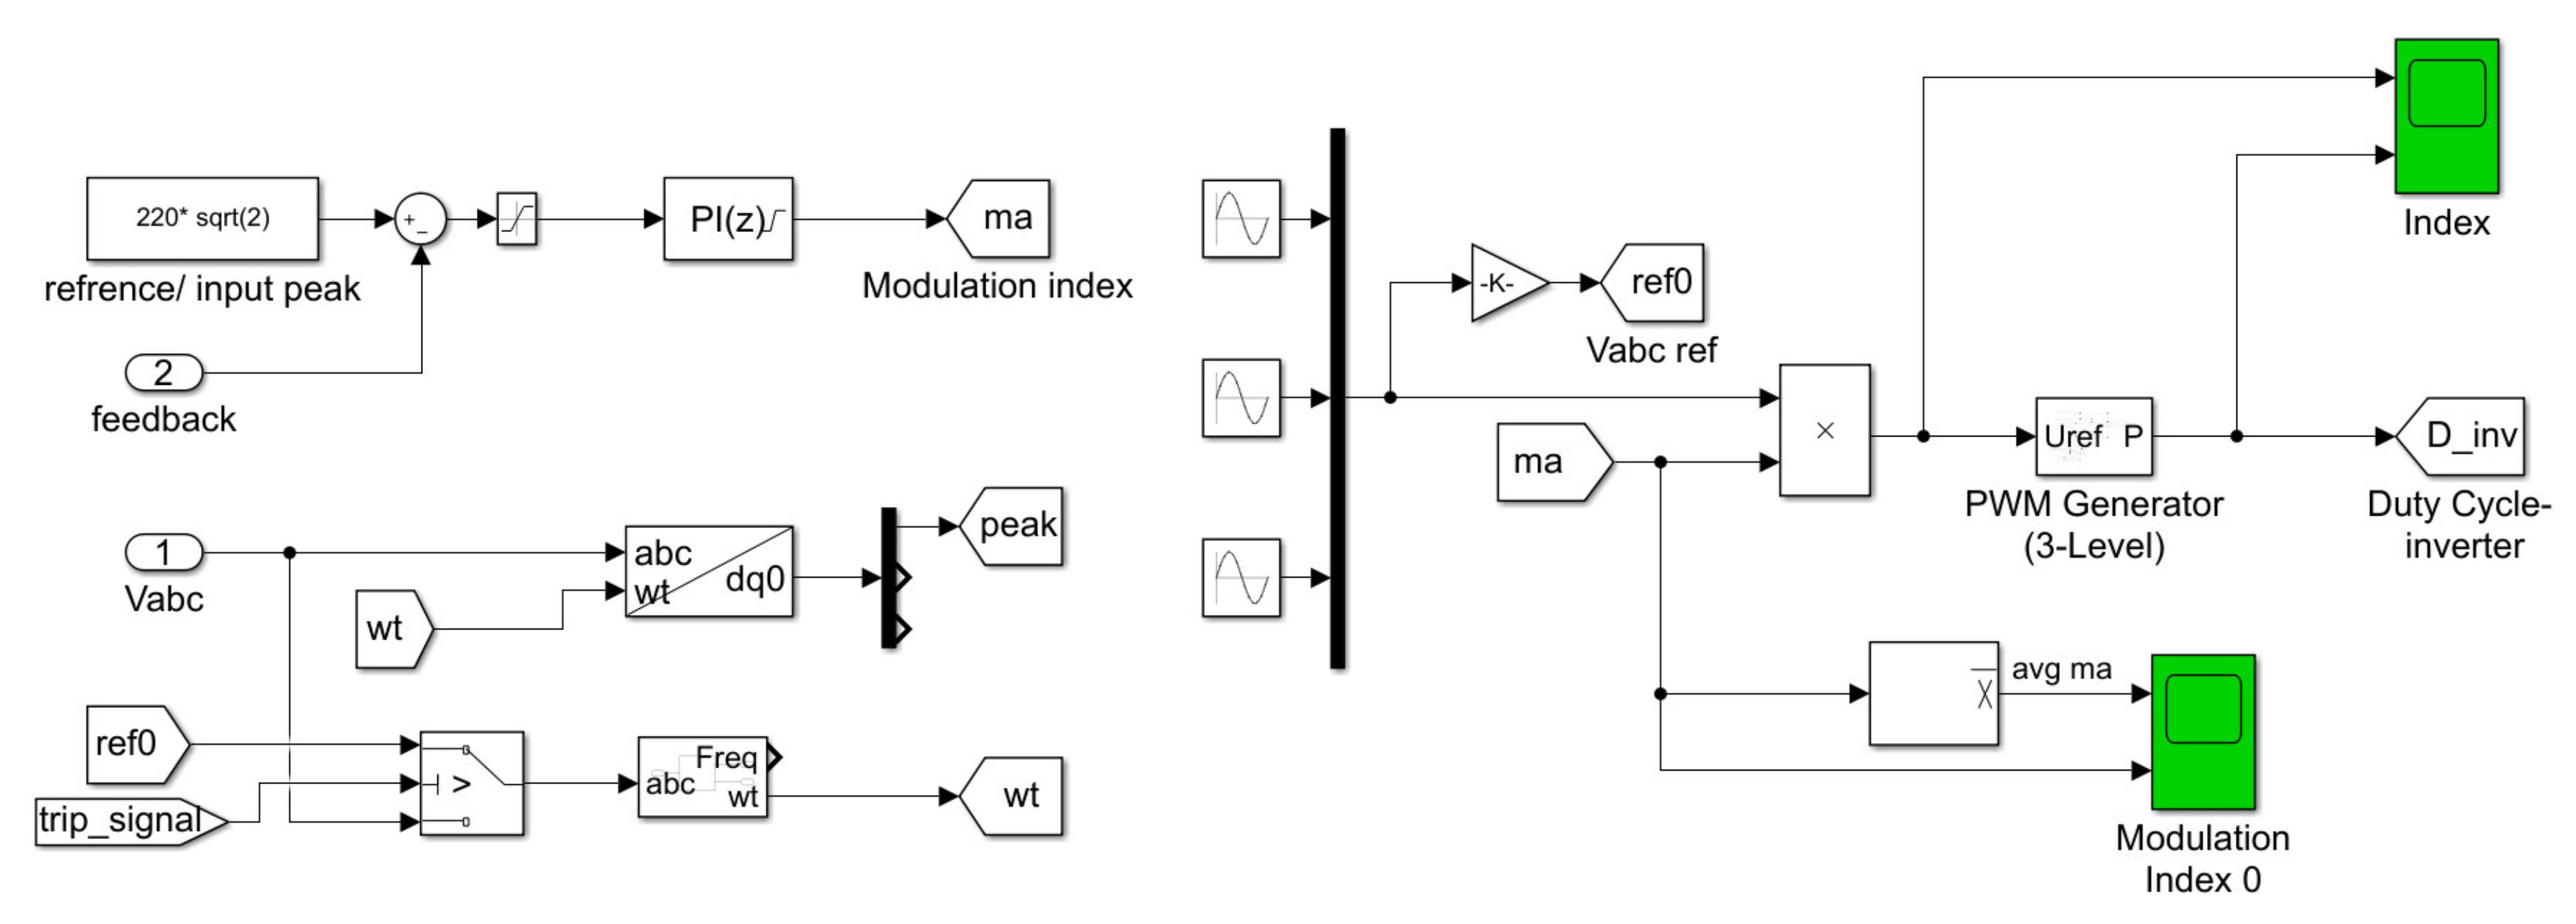
3.4. Inverter Unit Control

A three-level inverter with the levels (−VDC, 0, +VDC) is being used. An SPWM method is used to get a proper gating signal for the inverter. The controller is designed to generate a modulation index to keep 220 Vrms with 50 Hz AC voltage.
The controller measures the phase voltage of the output inverter (Van, Vbn, Vcn). Phase-Locked Loop (PLL) is used to extract the phase angle of the fundamental voltage component of phase A. The extracted phase angle is used to convert the voltages Vabc into Vdq0. The converted voltages Vdq0 are compared with preset reference values to feed error signals to the PI controllers. Finally, the modulation index, which varies between 0 and 1, is used to generate a 3-phase SPWM and control the inverter. Figure 17 shows a schematic diagram for the inverter SPWM.

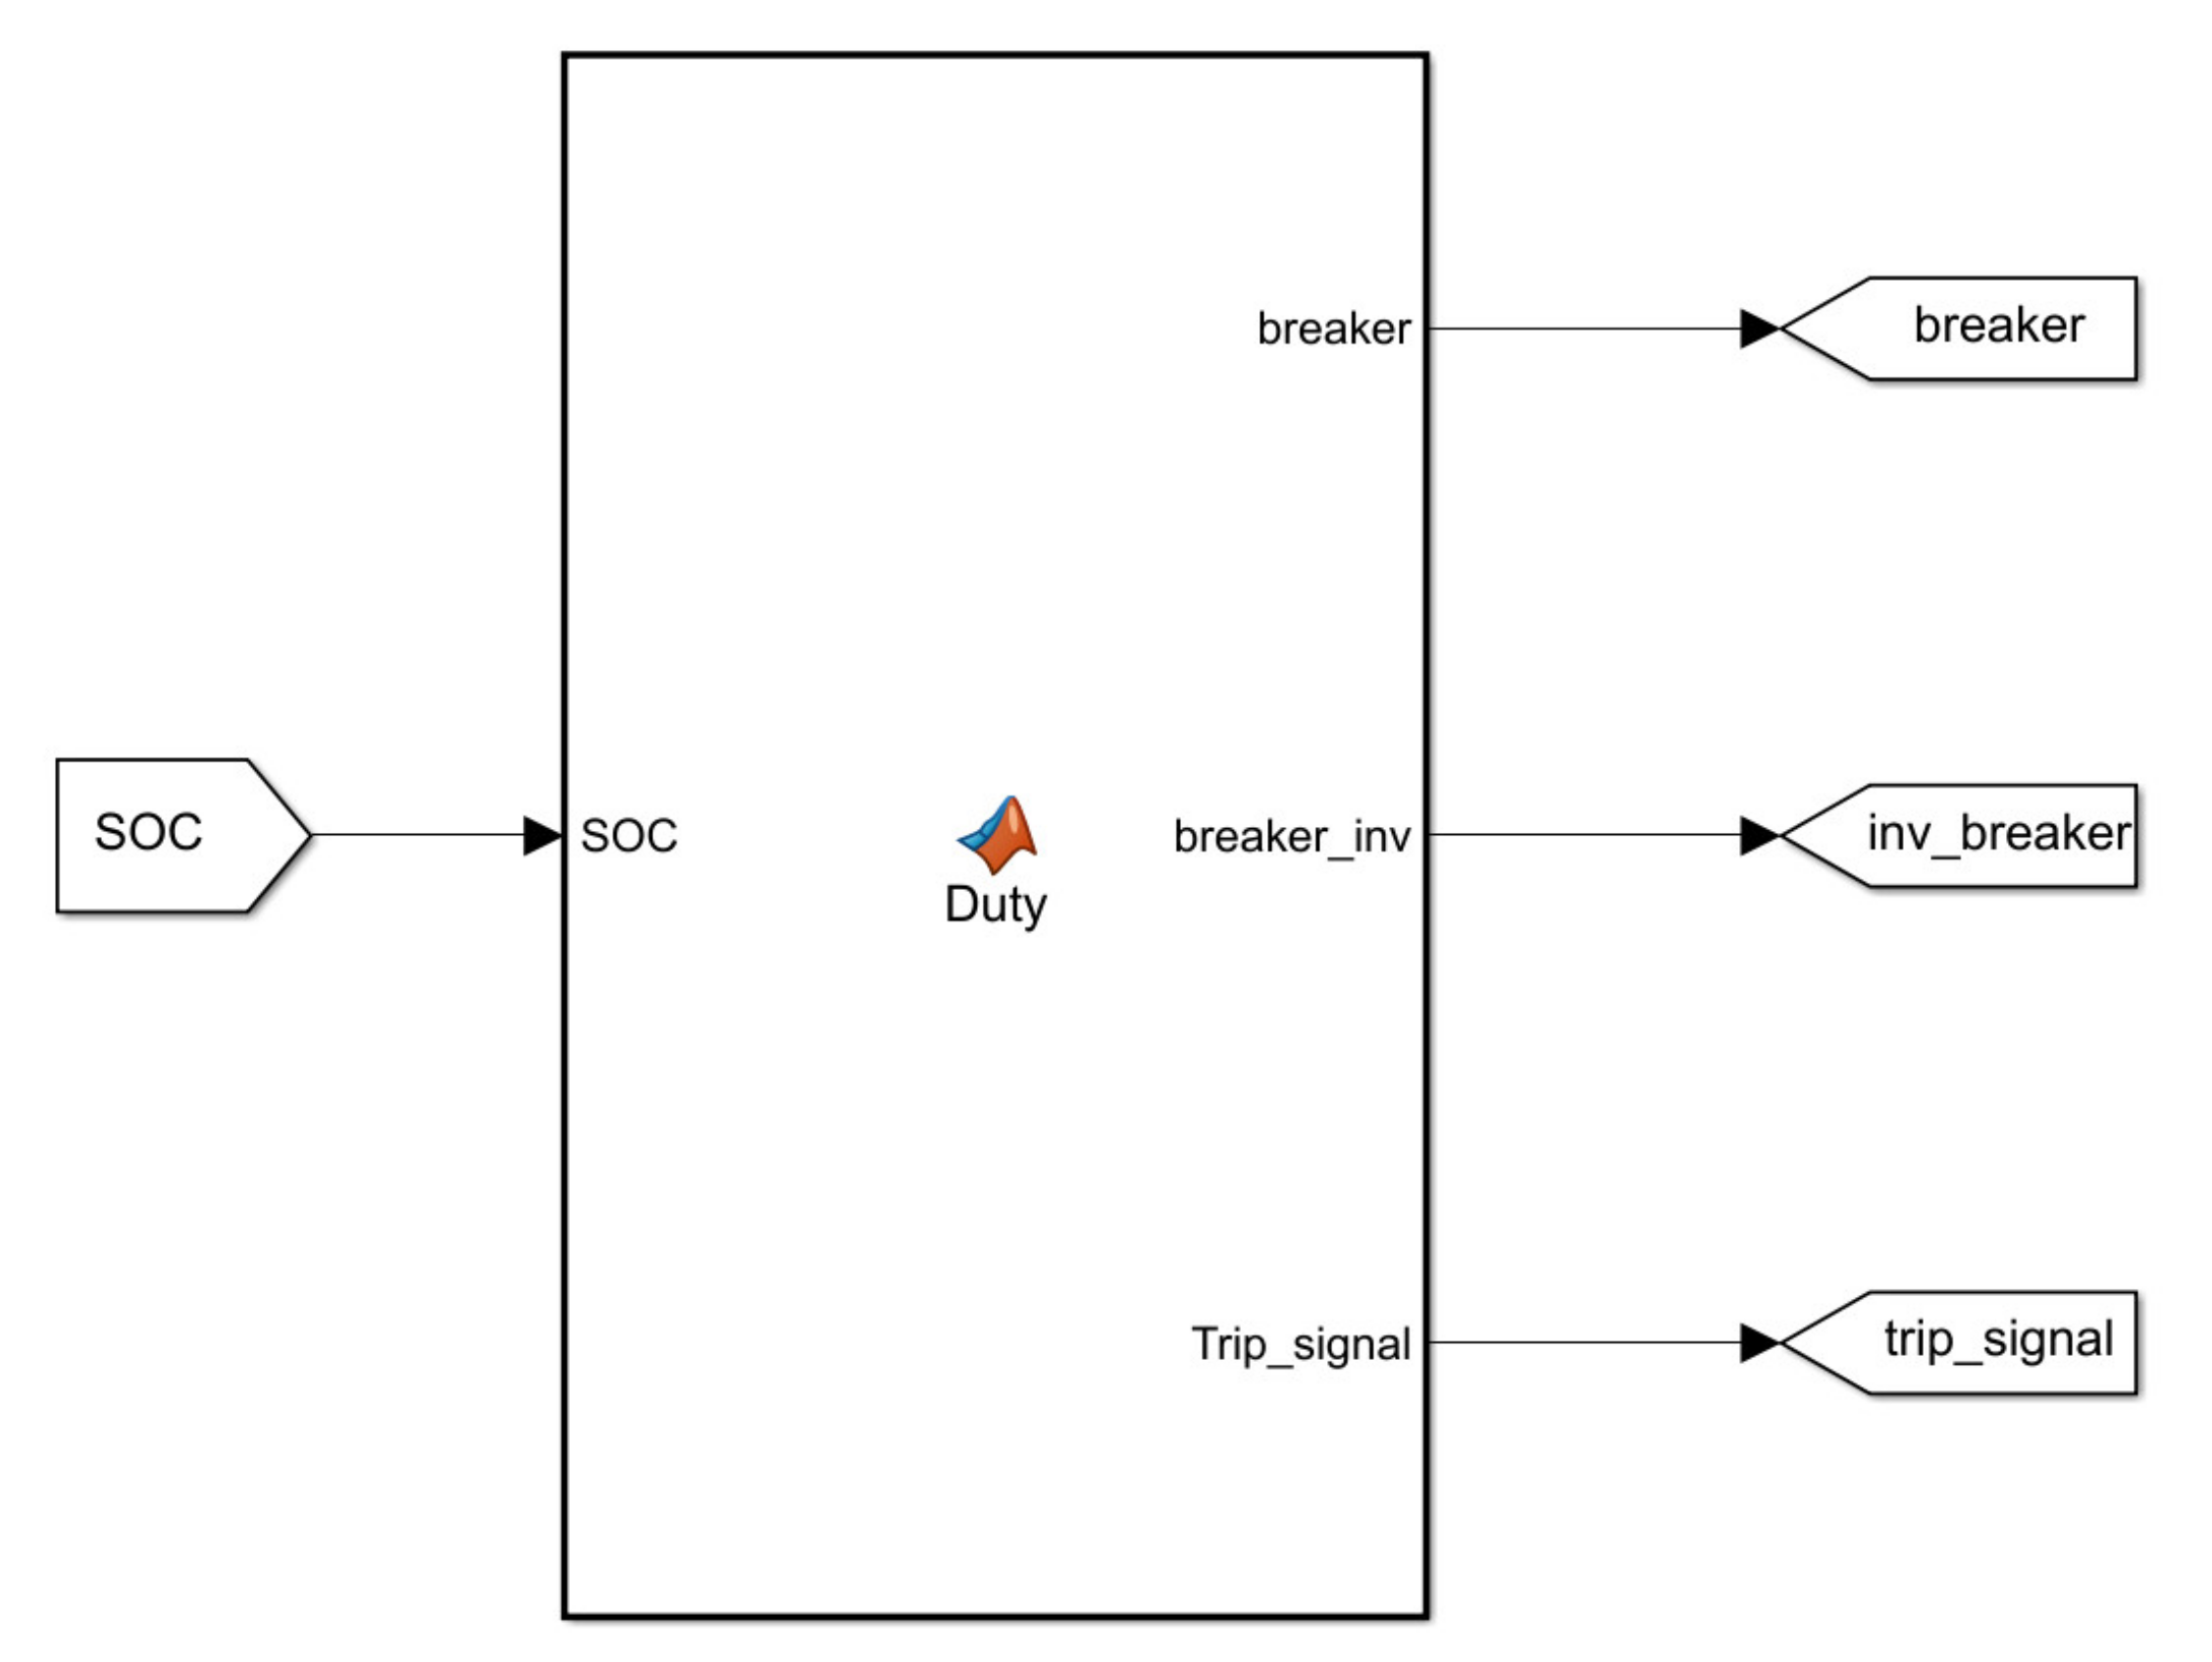
3.5. Battery Protection Controller

Batteries can get overcharged or over-discharged, which usually leads to damaging the batteries. Thus, limiting the batteries’ State of Charge (SOC) within (20–80%) will help to keep the batteries safe and well maintained long enough. Based on the SOC range, operation of batteries can be classified into three main conditions:
(1)
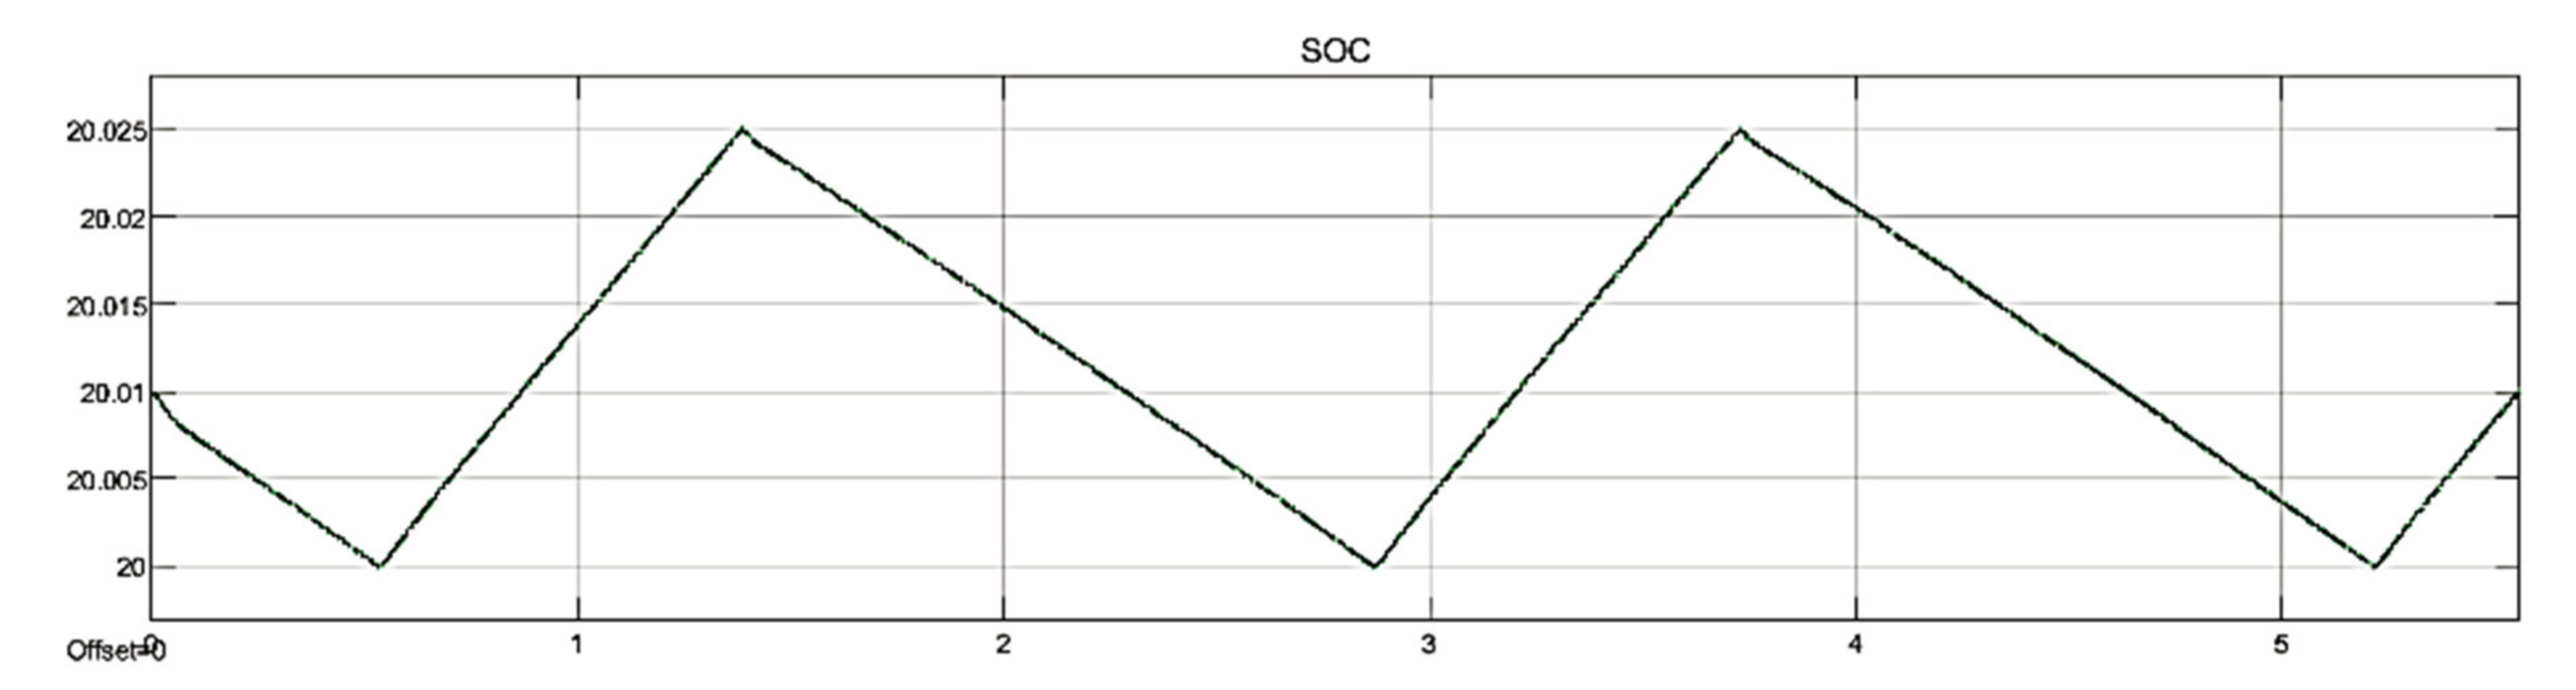
Normal condition where the batteries SOC is running between 20% and 80%.
(2)
Overcharging condition, where the batteries’ SOC is exceeding 80%.
(3)
Over-discharging condition, where the batteries’ SOC is running below 20%.
The controller should deal with each condition in a proper way to protect batteries from either overcharging or over-discharging. In normal operation conditions (20% < SOC < 80%), the controllers described above operate as expected without any regard to the SOC of the batteries. However, once the SOC exceeds 80%, certain commands that turned off the PV panel and the wind turbine are issued. The PV panel and the wind turbine are not allowed to be connected unless the SOC drops to a safe margin, which is 75% in the case of our controller. Similarly, when SOC drops below 20%, other commands are issued to turn off the inverter and disconnect the loads. The power from the inverter is kept off until the batteries are charged enough, which is 25% in the case of our controller.
This control strategy is applied using a microcontroller that takes battery SOC as input and generates proper signals based on the previous scenarios.
The microcontroller is implemented in MATLAB/SIMULINK using the “MATLAB function” block which allows us to access the coding process to address the purposes of our controller; see Figure 18 for input and output of this block function. Controlling the power flow in the system is being done through a “circuit breaker/contactor” block to get the circuit closed/open as required. The circuit breakers can be installed before or after the converter. In WECS, the circuit breaker is installed just before the converter. When the battery SOC hits 80% of the full battery charge, the microcontroller sends a tripping command to the breaker to interrupt the power flow to the load. Instead, another breaker is installed before the main breaker to change the power flow direction to a dummy load that can be used for useful applications as shown in Figure 19. Wind power flow is kept interrupted, and the load is completely fed from the batteries unit, fading away from the upper SOC limit of 80%. PV power flow is also interrupted as a discharging batteries unit is required in this scenario. The breaker of the PV system is connected right after the boost converter, and no dummy load is used in the PV system. On the AC side, after the inverter, the three-phase load is switched off by a circuit breaker connected right after the inverter as shown in Figure 20.

4. Simulation and Results

The results below verify the validity of the used control method. The controller has been tested, as previously mentioned, using three main conditions: normal condition, overcharging state, and over-discharging state.

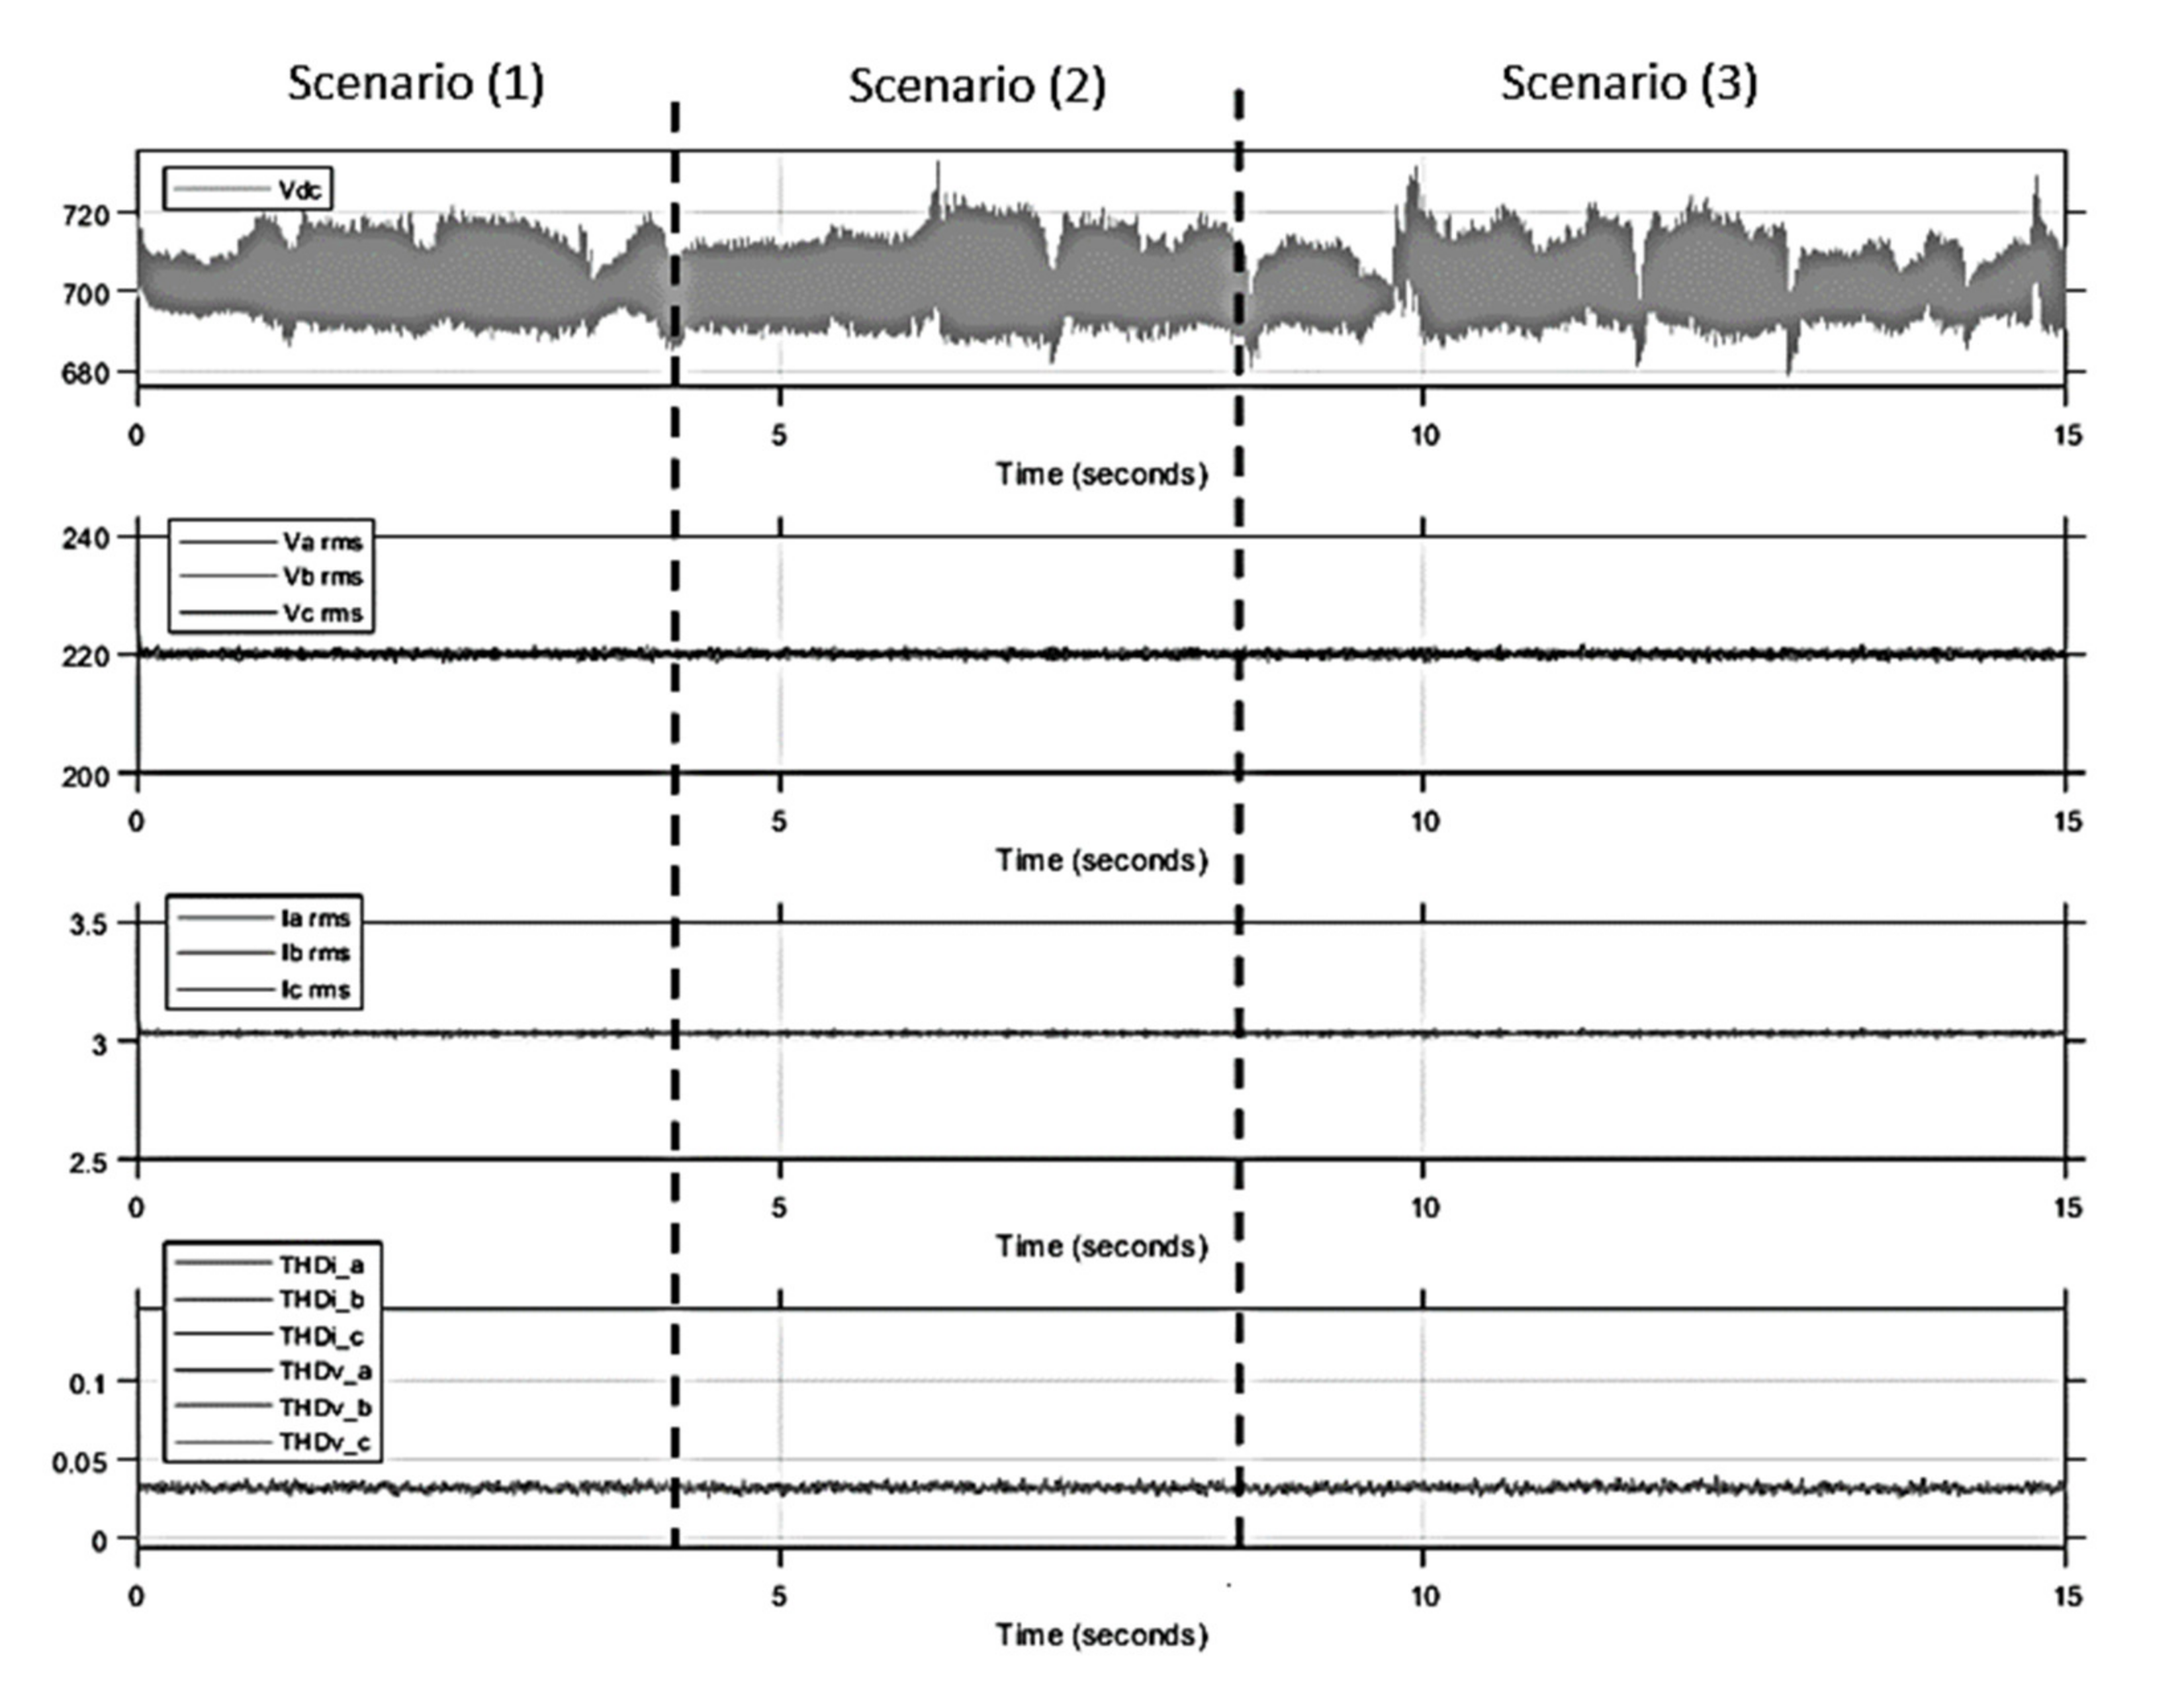
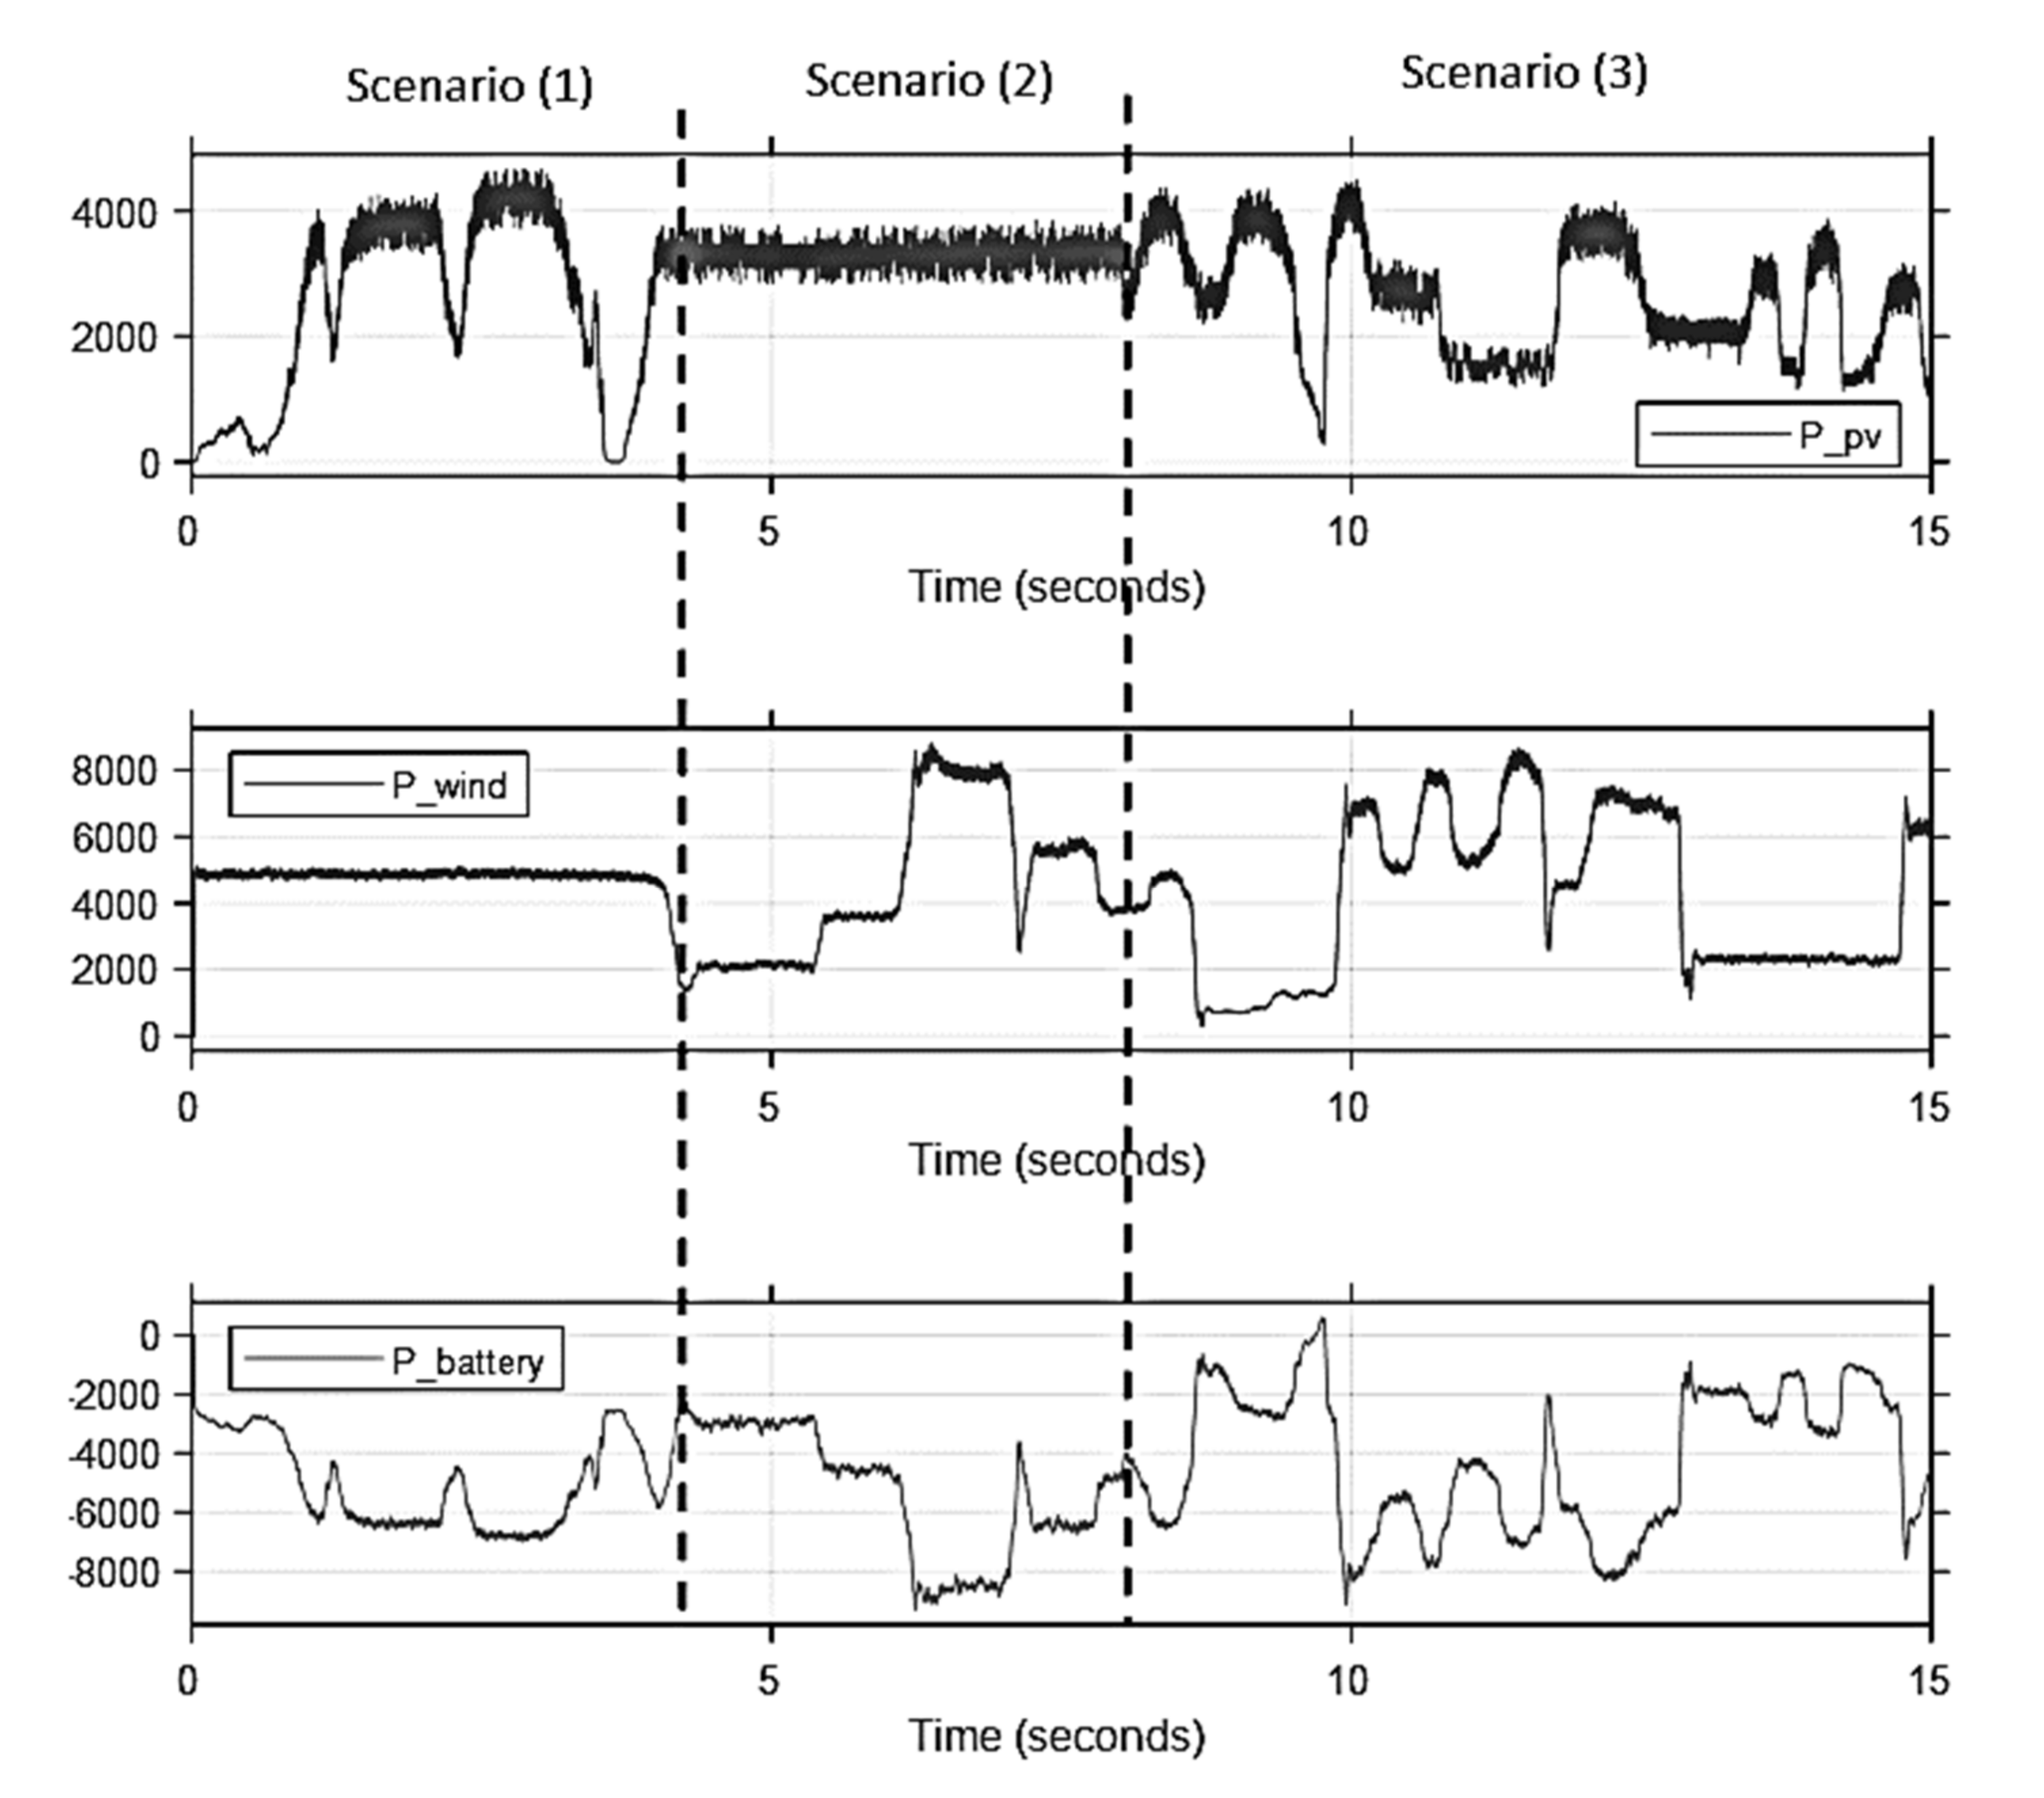
4.1. Normal Condition

The simulation shown in Figure 21 shows the system performance in three different scenarios as follows:
(1)
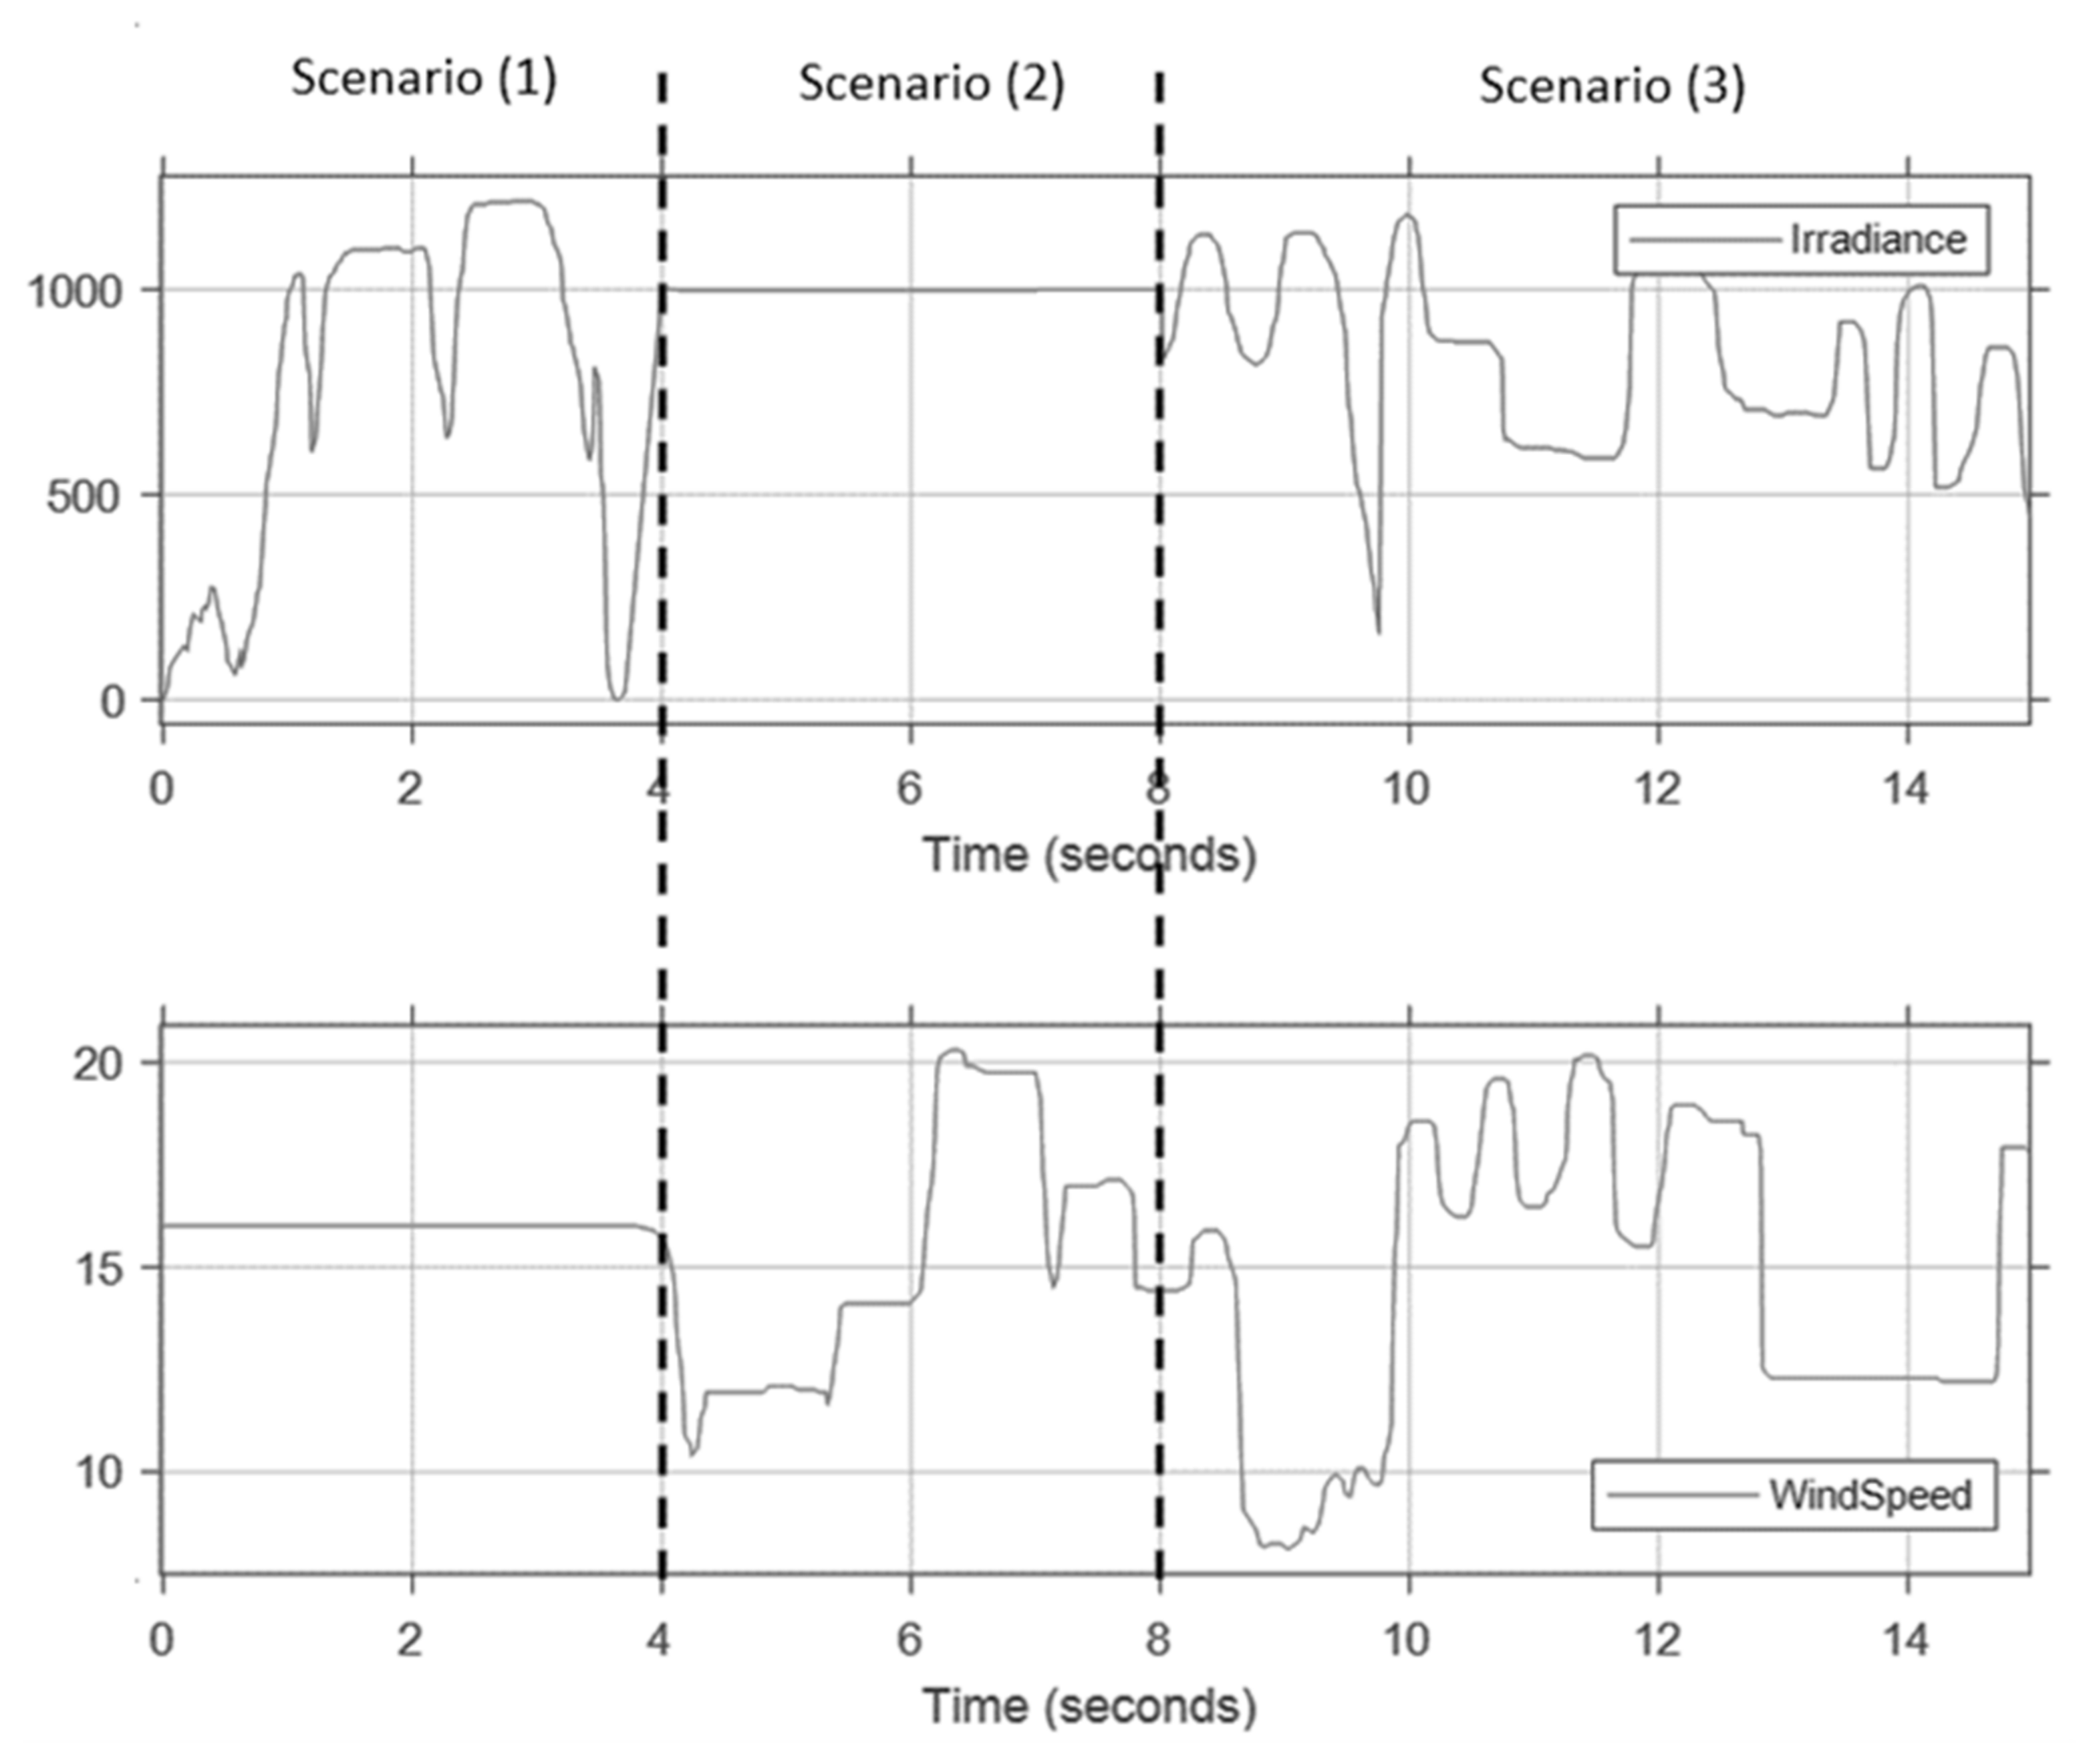
In the period between t = (0 to 4 s), the effect of the PV system is examined under variable irradiance and fixed wind speed. The irradiance is changed between (0–1200) W/m2 with a constant wind speed of 16 m/s.
(2)
The effect of the wind system is examined under variable wind speed and fixed irradiance in the period between t = (4 s to 8 s). The irradiance has been fixed at 1000 W/m2, so the effect of the wind controller is simply observed.
(3)
In the remaining simulation time, the system is examined under variable irradiance and variable wind speed for (t > 8 s).
For the first scenario of the simulation t = (0–4) s, the irradiance is intended to simulate a clear day irradiance as the sun shines with minimum values of irradiance, then increases till its peak for that day, and then drops again with some clouds randomly passing by. Therefore, the irradiance is selected to start from 0 to 1200 (W/m2) and then 0 again; it also drops at random times during this interval as a simulation of clouds may block the irradiance. Meanwhile, for this interval, wind speed is kept constant at 16 m/s, since this scenario is designed to test and validate the controller of the solar energy part alone.
For the second scenario t = (4 s to 8), the main purpose is to clearly observe the effect of the wind turbine controller in the simulation. To obtain such observability, the irradiance is kept constant, and the wind speed changes randomly between some limits (8–25) m/s.
For the third scenario t > 8 s, a variable and random irradiance and wind speed is being simulated to validate the ability of the control algorithm to keep up with these two random inputs.
Figure 22 shows the corresponding PMSG rectified voltage, PV voltage, and battery voltage, respectively. As seen in this figure, the MPPT is working well, since the PV voltage always reaches Vmax for irradiance greater than 0.
Figure 23 shows the DC bus voltage with a small ripple under variable irradiance and variable wind speed conditions. The three-phase voltages and currents driven through the inverter are shown in this figure. THD for both voltages and currents are 3% and 5%, respectively. Figure 24 illustrates the power flow in the system, where the power fed to the inverter is constant at around 2080 W. The load is only consuming 2 kW, and the remaining are losses in the LC filter and power electronic devices as well.

4.2. Overcharging Condition

The power required by the load is 2 kW, and the power coming from the solar and wind sources are 4.8 kW and 4.9 kW, respectively. In addition, 2 kW feeds load and the excess power, which is 7.7 kW, is being driven to the batteries to charge them up. This process will keep going until the upper limit of the SOC is reached, which is set to 80%. At this moment, two circuit breakers are switched off and solar and wind sources are disconnected. Therefore, the total power provided by these sources is zero, and the load is fully fed by the charged batteries, causing the SOC to decrease. The batteries’ SOC continues decreasing until it reaches a predefined SOC limit, which is 75% in our controller. Figure 25 shows the behavior of the controller during overcharging process. SOC follows the sequence (80–79.93–80–79.93%) until the power coming from the sources is dropped to lower values.

4.3. Overdischarging Condition

To keep batteries from getting damaged due to over discharging conditions, the load gets disconnected as batteries’ SOC hits 20%. They are kept in the off state until a safe margin of SOC is reached. In this work, this safety limit is set to be 20.025%. Figure 26 shows that batteries are being discharged due to low power fed from the PV system and WECS. Therefore, batteries’ SOC hits 20%, and the circuit breaker is opened. The power generated by the PV system and WECS feeds the batteries and gets them charged. The load circuit breaker remains open until the safety limit SOC level is reached, where the load circuit breaker gets closed again.

5. Discussion

Several studies have looked into the issue of energy management; differences were found in the types of sources used, the storage systems considered, and whether or not the grid was connected. The authors in [47] compared the intuitive solution to the optimal control. According to findings, the ideal method reduced the cost of electricity more than the predictive system. This is due to the fact that the intuitive approach did not take into consideration the cost constraint or the price per time slot.
In [48], Zupancic et al. suggested a tree-based control mechanism as an Energy Management System (EMS) solution for GCHES with PV and battery systems. After examining historical data for the specific area, including electric load, electricity pricing, and solar irradiance, this method creates a decision tree for power flow by executing a multi-objective optimization using the Non-dominated Sorting Genetic Algorithm II (NSGA-II) considering operational cost and green factor. The optimization of decision trees required access to a huge quantity of historical data and a computationally expensive optimization methodology, despite the fact that the control mechanism itself is computationally cheap. In addition, if electricity costs and/or solar irradiance patterns change, this strategy will necessitate control model upgrades. Predictive control approaches update the control parameters of EMS by maximizing the EMS objectives using predicted HES variables, in contrast to flowchart and tree-based control methods where the controlled parameters are fixed.
Guichi et al. in [49] sized the solar system to power the load and charge the battery using a flowchart method. This system adapts to changes in grid demand. The limited power point mode was used to compensate for the excess power generated by the panels as a result of the installation’s oversizing. Indeed, before sizing, the authors must consider the maximum power that can be pumped into the system. Otherwise, by using 85% of the battery’s total capacity, their management system puts the battery’s health at risk.
Aghajani et al. in [50] introduced an EMS technique that uses artificial neural networks (ANN) to forecast future load, wind turbine power, and PV array power. Using the Multi-Objective Particle Swarm Optimization (MOPSO) algorithm, the anticipated values are employed for multi-objective optimization of operating cost and CO2 emission goals. The free-flow of energy between the HES and the grid was also demonstrated in this study to result in higher cost savings and CO2 emission reduction goals. The previous discussions about the related work are summarized in Table 3.
For our case, we studied the energy shared between sources of a stand-alone hybrid PV/Wind/battery system to meet the load. Our energy management control forces the batteries to be considered as an emergency source of energy. The energy coming from the PV and wind system is initially supplied the load. If these two sources cannot support the load, the energy will be drawn from the batteries. Moreover, the designed controller in our proposed system protects the batteries in all conditions, including normal, overcharging, and overdischarging. The controller should handle each case properly. Under normal working conditions (20% < SOC < 80%), the controller functions as expected, regardless of the battery’s state of charge. When the SOC reaches 80%, the PV panel and the wind turbine are turned off, and a specified order is delivered. This controller’s SOC must drop to a safe margin of 75% before the PV panel and wind turbine can be linked. When the inverter’s SOC goes below 20%, other commands are sent out to switch it off and disconnect the loads. The inverter’s power is turned off until the batteries have been recharged to a suitable level.

6. Conclusions

Design and control of a standalone micro-grid system with a PV system and WECS were proposed in this work. To control and harvest the most power possible from the PV system, fuzzy logic-based MPPT was used for a boost converter. The PV system’s output provided a constant DC bus voltage to a battery storage system that was regulated by two PI voltage and current control loops. The control system is intended to achieve the load in all cases. When the energy generated by the PV panel exceeds the energy required by the load, the excess energy is used to charge the batteries. When the PV panel’s electricity is inadequate to fulfill the load’s demands, the extra power is drawn from the charged batteries. Furthermore, the controller is employed to protect the battery banks in all scenarios, including normal, overcharging, and overdischarging scenarios. Each case should be handled appropriately by the controller. Regardless of the battery’s state of charge, the controller performs as expected under normal operating conditions (20% < SOC < 80%). A specific order is delivered when the SOC hits 80%, which turns off the PV panel and the wind turbine. The PV panel and wind turbine cannot be connected until the SOC drops to a safe margin of 75% in this controller. Other commands are sent out to turn off the inverter and disconnect the loads when SOC falls below 20%. The inverter’s power is switched off until the batteries are charged again to a suitable value. The designed stand-alone microgrid system and their controllers solved the problem of supplying the electric energy to remote areas where the electrical grid does not exist.

Author Contributions

Conceptualization, A.A.-Q.; methodology, A.A.-Q. and M.A.-Q.; software, M.A.-Q.; validation, A.A.-Q. and M.A.-Q.; formal analysis, M.A.-Q.; investigation, A.A.-Q.; resources, A.A.-Q.; data curation, M.A.-Q.; writing—original draft preparation, M.A.-Q.; writing—review and editing, A.A.-Q.; visualization, A.A.-Q. and M.A.-Q.; supervision, A.A.-Q.; project administration, A.A.-Q.; funding acquisition, A.A.-Q. Both authors have read and agreed to the published version of the manuscript.

Funding

This research received no external funding.

Institutional Review Board Statement

Not applicable.

Informed Consent Statement

Not applicable.

Data Availability Statement

Not applicable.

Acknowledgments

The authors acknowledge Yarmouk University for the support in this study.

Conflicts of Interest

The authors declare no conflict of interest.

References

  1. Bendary, A.F.; Ismail, M.M. Battery charge management for hybrid PV/wind/fuel cell with storage battery. Energy Procedia 2019, 162, 107–116. [Google Scholar] [CrossRef]
  2. Elavarasan, R.M.; Ghosh, A.; Mallick, T.K.; Krishnamurthy, A.; Saravanan, M. Investigations on performance enhancement measures of the bidirectional converter in PV–wind interconnected microgrid system. Energies 2019, 12, 2672. [Google Scholar] [CrossRef] [Green Version]
  3. Muriithi, G.; Chowdhury, S. Optimal energy management of a grid-tied solar PV-battery microgrid: A Reinforcement learning approach. Energies 2021, 14, 2700. [Google Scholar] [CrossRef]
  4. Shan, Y.; Hu, J.; Chan, K.W.; Fu, Q.; Guerrero, J.M. Model predictive control of bidirectional DC-DC converters and AC/DC interlinking converters—A new control method for PV-wind-battery microgrids. IEEE Trans. Sustain. Energy 2019, 10, 1823–1833. [Google Scholar] [CrossRef]
  5. Mahesh, A.; Sandhu, K.S. Hybrid wind/photovoltaic energy system developments: Critical review and findings. Renew. Sustain. Energy Rev. 2015, 52, 1135–1147. [Google Scholar] [CrossRef]
  6. Berardi, U.; Tomassoni, E.; Khaled, K. A smart hybrid energy system grid for energy efficiency in remote areas for the army. Energies 2020, 13, 2279. [Google Scholar] [CrossRef]
  7. Murty, V.V.S.N.; Kumar, A. Multi-objective energy management in microgrids with hybrid energy sources and battery energy storage systems. Prot. Control Mod. Power Syst. 2020, 5, 1–20. [Google Scholar] [CrossRef] [Green Version]
  8. Alhasnawi, B.N.; Jasim, B.H.; Esteban, M.D. A new robust energy management and control strategy for a hybrid microgrid system based on green energy. Sustainability 2020, 12, 5724. [Google Scholar] [CrossRef]
  9. Kumar, G.R.P.; Sattianadan, D.; Vijayakumar, K. A survey on power management strategies of hybrid energy systems in microgrid. Int. J. Electr. Comput. Eng. IJECE 2020, 10, 1667–1673. [Google Scholar] [CrossRef]
  10. Datta, U.; Kalam, A.; Shi, J. Hybrid PV–wind renewable energy sources for microgrid application: An overview. In Hybrid-Renewable Energy Systems in Microgrids; Elsevier BV: Amsterdam, The Netherlands, 2018; pp. 1–22. [Google Scholar]
  11. Rehman, S.; Habib, H.U.R.; Wang, S.; Buker, M.S.; Alhems, L.M.; Al Garni, H.Z. Optimal design and model predictive control of standalone HRES: A real case study for residential demand side management. IEEE Access 2020, 8, 29767–29814. [Google Scholar] [CrossRef]
  12. Fathy, A.; Kaaniche, K.; Alanazi, T.M. Recent approach Based social spider optimizer for optimal sizing of hybrid PV/wind/battery/diesel integrated microgrid in Aljouf region. IEEE Access 2020, 8, 57630–57645. [Google Scholar] [CrossRef]
  13. Luo, Y.; Yang, D.; Yin, Z.; Zhou, B.; Sun, Q. Optimal configuration of hybrid-energy microgrid considering the correlation and randomness of the wind power and photovoltaic power. IET Renew. Power Gener. 2020, 14, 616–627. [Google Scholar] [CrossRef]
  14. Yahaya, A.A.; Al-Muhaini, M.; Heydt, G.T. Optimal design of hybrid DG systems for microgrid reliability enhancement. IET Gener. Transm. Distrib. 2020, 14, 816–823. [Google Scholar] [CrossRef]
  15. Samy, M.; Mosaad, M.I.; Barakat, S. Optimal economic study of hybrid PV-wind-fuel cell system integrated to unreliable electric utility using hybrid search optimization technique. Int. J. Hydrog. Energy 2021, 46, 11217–11231. [Google Scholar] [CrossRef]
  16. Lamichhane, A.; Zhou, L.; Yao, G.; Luqman, M. LCL Filter based grid-connected photovoltaic system with battery energy storage. In Proceedings of the 2019 14th IEEE Conference on Industrial Electronics and Applications (ICIEA), Xi’an, China, 19–21 June 2019; Institute of Electrical and Electronics Engineers (IEEE): New York, NY, USA, 2019; pp. 1569–1574. [Google Scholar]
  17. 1STH-215-P Solar Panel from 1Soltech Specifications. Available online: http://www.posharp.com/1sth-215-p-solar-panel-from-1soltech_p1621902445d.aspx (accessed on 25 July 2021).
  18. Al-Mahmodi, M.; Al-Quraan, A. On-grid solar energy system—A study case in Irbid. In Proceedings of the 6th Global Conference on Renewable Energy and Energy Efficiency for Desert Regions (GCREEDER 2018), Amman, Jordan, 3–5 April 2018. [Google Scholar]
  19. Rathore, A.; Patidar, N. Reliability assessment using probabilistic modelling of pumped storage hydro plant with PV-wind based standalone microgrid. Int. J. Electr. Power Energy Syst. 2019, 106, 17–32. [Google Scholar] [CrossRef]
  20. Al-Quraan, A.; Stathopoulos, T.; Pillay, P. Comparison of wind tunnel and on site measurements for urban wind energy estimation of potential yield. J. Wind. Eng. Ind. Aerodyn. 2016, 158, 1–10. [Google Scholar] [CrossRef] [Green Version]
  21. Stathopoulos, T.; Alrawashdeh, H.; Al-Quraan, A.; Blocken, B.; Dilimulati, A.; Paraschivoiu, M.; Pilay, P. Urban wind energy: Some views on potential and challenges. J. Wind Eng. Ind. Aerodyn. 2018, 179, 146–157. [Google Scholar] [CrossRef]
  22. Yang, D.; Jiang, C.; Cai, G.; Huang, N. Optimal sizing of a wind/solar/battery/diesel hybrid microgrid based on typical scenarios considering meteorological variability. IET Renew. Power Gener. 2019, 13, 1446–1455. [Google Scholar] [CrossRef]
  23. Xie, H.; Zheng, S.; Ni, M. Microgrid development in China: A method for renewable energy and energy storage capacity configuration in a megawatt-level isolated microgrid. IEEE Electrif. Mag. 2017, 5, 28–35. [Google Scholar] [CrossRef]
  24. Shaqour, A.; Farzaneh, H.; Yoshida, Y.; Hinokuma, T. Power control and simulation of a building integrated stand-alone hybrid PV-wind-battery system in Kasuga City, Japan. Energy Rep. 2020, 6, 1528–1544. [Google Scholar] [CrossRef]
  25. Benlahbib, B.; Bouarroudj, N.; Mekhilef, S.; Abdeldjalil, D.; Abdelkrim, T.; Bouchafaa, F.; Lakhdari, A. Experimental investigation of power management and control of a PV/wind/fuel cell/battery hybrid energy system microgrid. Int. J. Hydrog. Energy 2020, 45, 29110–29122. [Google Scholar] [CrossRef]
  26. Belouda, M.; Hajjaji, M.; Sliti, H.; Mami, A. Bi-objective optimization of a standalone hybrid PV-Wind-battery system generation in a remote area in Tunisia. Sustain. Energy Grids Netw. 2018, 16, 315–326. [Google Scholar] [CrossRef]
  27. MathWorks, Implement Model of Variable Pitch Wind Turbine. Available online: https://www.mathworks.com/help/physmod/sps/powersys/ref/windturbine.html (accessed on 25 July 2021).
  28. Nadjemi, O.; Nacer, T.; Hamidat, A.; Salhi, H. Optimal hybrid PV/wind energy system sizing: Application of cuckoo search algorithm for Algerian dairy farms. Renew. Sustain. Energy Rev. 2017, 70, 1352–1365. [Google Scholar] [CrossRef]
  29. Hu, J.; Shan, Y.; Xu, Y.; Guerrero, J. A coordinated control of hybrid ac/dc microgrids with PV-wind-battery under variable generation and load conditions. Int. J. Electr. Power Energy Syst. 2019, 104, 583–592. [Google Scholar] [CrossRef] [Green Version]
  30. Ben Ali, I.; Turki, M.; Belhadj, J.; Roboam, X. Optimized fuzzy rule-based energy management for a battery-less PV/wind-BWRO desalination system. Energy 2018, 159, 216–228. [Google Scholar] [CrossRef] [Green Version]
  31. Zhang, T.; Yue, D.; O’Grady, M.J.; O’Hare, G.M.P. Transient oscillations analysis and modified control strategy for seamless mode transfer in micro-grids: A wind-PV-ES hybrid system case study. Energies 2015, 8, 13758–13777. [Google Scholar] [CrossRef] [Green Version]
  32. Beykverdi, M.; Jalilvand, A.; Ehsan, M. Cooperative energy management of hybrid DC renewable grid using decentralized control strategies. Energies 2016, 9, 859. [Google Scholar] [CrossRef] [Green Version]
  33. El-Hendawi, M.; Gabbar, H.A.; El-Saady, G.; Ibrahim, E.-N.A. Control and EMS of a Grid-Connected Microgrid with Economical Analysis. Energies 2018, 11, 129. [Google Scholar] [CrossRef] [Green Version]
  34. Cheng, C.-H. Implementation of a small type DC microgrid based on fuzzy control and dynamic programming. Energies 2016, 9, 781. [Google Scholar] [CrossRef] [Green Version]
  35. Luna, A.C.; Diaz, N.L.; Graells, M.; Vasquez, J.C.; Guerrero, J.M. Mixed-integer-linear-programming-based energy management system for hybrid PV-wind-battery microgrids: Modeling, design, and experimental verification. IEEE Trans. Power Electron. 2017, 32, 2769–2783. [Google Scholar] [CrossRef] [Green Version]
  36. Lin, S.; Wang, Y.; Liu, M.; Fan, G.; Yang, Z.; Li, Q. Stochastic optimal dispatch of PV/wind/diesel/battery microgrids using state-space approximate dynamic programming. IET Gener. Transm. Distrib. 2019, 13, 3409–3420. [Google Scholar] [CrossRef]
  37. Al-Quraan, A.; Alrawashdeh, H. Correlated capacity factor strategy for yield maximization of wind turbine energy. In Proceedings of the 2018 5th International Conference on Renewable Energy: Generation and Applications (ICREGA), Al Ain, United Arab Emirates, 26–28 February 2018; Institute of Electrical and Electronics Engineers (IEEE): New York, NY, USA, 2018; pp. 264–267. [Google Scholar]
  38. Al-Quraan, A.A.; Pillay, P.; Stathopoulos, T. Use of a wind tunnel for urban wind power estimation. In Proceedings of the 2014 IEEE Power and Energy Society General Meeting, Conference & Exposition, National Harbor, MD, USA, 27–31 July 2014; Institute of Electrical and Electronics Engineers (IEEE): New York, NY, USA, 2014; pp. 1–5. [Google Scholar]
  39. Al-Quraan, A.; Stathopoulos, T.; Pillay, P. Estimation of urban wind energy—Equiterre building case in montreal. In Proceedings of the International Civil Engineering for Sustainability and Resilience Conference (CESARE’14), Irbid, Jordan, 24–27 April 2014. [Google Scholar]
  40. Al-Masri, H.M.K.; Al-Quraan, A.; Abuelrub, A.; Ehsani, M. Optimal coordination of wind power and pumped hydro energy storage. Energies 2019, 12, 4387. [Google Scholar] [CrossRef] [Green Version]
  41. Al-Quraan, A.; Al-Masri, H.; Radaideh, A. New method for assessing the energy potential of wind sites—A case study in Jordan. Univers. J. Electr. Electron. Eng. 2020, 7, 209–218. [Google Scholar] [CrossRef]
  42. Al-Quraan, A.; Al-Mahmodi, M.; Radaideh, A.; Al-Masri, H.M.K. Comparative study between measured and estimated wind energy yield. Turk. J. Electr. Eng. Comput. Sci. 2020, 28, 2926–2939. [Google Scholar] [CrossRef]
  43. Balasubramanian, G.; Singaravelu, S. Fuzzy logic controller for the maximum power point tracking in photovoltaic system. Int. J. Comput. Appl. 2012, 41, 22–28. [Google Scholar] [CrossRef]
  44. Radaideh, A.; Al-Quraan, A.; Al-Masri, H.; Albataineh, Z. Rolling horizon control architecture for distributed agents of thermostatically controlled loads enabling long-term grid-level ancillary services. Int. J. Electr. Power Energy Syst. 2021, 127, 106630. [Google Scholar] [CrossRef]
  45. Chakir, A.; Tabaa, M.; Moutaouakkil, F.; Medromi, H.; Julien-Salame, M.; Dandache, A.; Alami, K. Optimal energy management for a grid connected PV-battery system. Energy Rep. 2020, 6, 218–231. [Google Scholar] [CrossRef]
  46. Shivam, K.; Tzou, J.-C.; Wu, S.-C. A multi-objective predictive energy management strategy for residential grid-connected PV-battery hybrid systems based on machine learning technique. Energy Convers. Manag. 2021, 237, 114103. [Google Scholar] [CrossRef]
  47. Wu, Z.; Xia, X. Optimal switching renewable energy system for demand side management. Sol. Energy 2015, 114, 278–288. [Google Scholar] [CrossRef] [Green Version]
  48. Zupančič, J.; Filipič, B.; Gams, M. Genetic-programming-based multi-objective optimization of strategies for home energy-management systems. Energy 2020, 203, 117769. [Google Scholar] [CrossRef]
  49. Guichi, A.; Talha, A.; Berkouk, E.M.; Mekhilef, S. Energy management and performance evaluation of grid connected PV-battery hybrid system with inherent control scheme. Sustain. Cities Soc. 2018, 41, 490–504. [Google Scholar] [CrossRef]
  50. Aghajani, G.; Ghadimi, N. Multi-objective energy management in a micro-grid. Energy Rep. 2018, 4, 218–225. [Google Scholar] [CrossRef]
Figure 1. System configuration of the suggested microgrid.
Energies 14 04849 g001
Figure 2. Equivalent circuit of a PV cell.
Energies 14 04849 g002
Figure 3. Characteristics of PV cells.
Energies 14 04849 g003
Figure 4. Power characteristics of a typical wind turbine [27].
Energies 14 04849 g004
Figure 5. Variation of aerodynamic power coefficient versus tip–speed ratio at variable pitch angle [27].
Energies 14 04849 g005
Figure 6. Typical PMSG based wind energy conversion system.
Energies 14 04849 g006
Figure 7. Circuit diagram for a three-phase diode rectifier.
Energies 14 04849 g007
Figure 8. Boost converter.
Energies 14 04849 g008
Figure 9. Multi-level inverter circuit.
Energies 14 04849 g009
Figure 10. Bidirectional buck–boost converter.
Energies 14 04849 g010
Figure 11. Membership function plots: (a) ‘E’; (b) ‘deltaE’; (c) ‘D’.
Energies 14 04849 g011
Figure 12. Overview of control rules as a 3D surface.
Energies 14 04849 g012
Figure 13. Fuzzy controller circuit diagram, with the use of a microcontroller to turn ON/OFF the boost converter.
Energies 14 04849 g013
Figure 14. Boost converter used to step up PMSG’s terminal voltage.
Energies 14 04849 g014
Figure 15. Control circuit for the wind system.
Energies 14 04849 g015
Figure 16. The bidirectional buck–boost converter controller, consisting of two closed loops of PI controllers.
Energies 14 04849 g016
Figure 17. Control circuit for the inverter—SPWM.
Energies 14 04849 g017
Figure 18. MATLAB function block which represents the microcontroller.
Energies 14 04849 g018
Figure 19. Wind boost converter with the circuit breaker and the dummy load are presented.
Energies 14 04849 g019
Figure 20. Circuit breaker used with the inverter.
Energies 14 04849 g020
Figure 21. Irradiance (W/m2), wind speed (m/s).
Energies 14 04849 g021
Figure 22. PMSG rectified voltage, PV voltage, and battery voltage, respectively.
Energies 14 04849 g022
Figure 23. DC output voltage, RMS values of the voltage and current, and THD of the voltage and current.
Energies 14 04849 g023
Figure 24. Power Flow in the system at a load power of 2k: (1) power output of the PV panel, (2) wind power, (3) power storage in the batteries unit.
Energies 14 04849 g024
Figure 25. PMSG rotational speed in rpm and Batteries SOC in % for the overcharging condition.
Energies 14 04849 g025
Figure 26. Batteries SOC in % for the over discharging condition.
Energies 14 04849 g026
Table 1. Sizing and specifications of the microgrid system.
Load SizingDC Bus Voltage700 Vdc
Load Power Required2 kW
Battery SizingBatteries capacity102 Ah
Battery Voltage96 Vdc
Batteries capacity9.8 kWh
Batteries strings (parallel)1
Batteries per string (series)4
PV Array SizingPV moduleSoltech 1STH-215-P
Max power per module213 W
Max current7.35 A
Max voltage29 V
Parallel Strings6
Series Modules per string3
PMSGRated Power3 kW
Rated Speed360 RPM
Table 2. Fuzzy inference table.
dE ENBNSZEPSPB
NBNBNBNBNSZE
NSNBNBNSZEZE
ZENBNSZEPSPB
PSZEZEPSPBPB
PBZEPSPBPBPB
Table 3. Comparative study with related work [45,46].
ReferencesEnergy SourcesRequired DataStorage SystemEnergy Management System StrategyOptimization ObjectivesEnergy Management System Approach
Wu et al. [47]PVirradianceBatteryGrid-connectedMinimize the cost of electricityLinear programming/intuitive control
Zupančič et al. [48]PVLoad, electricity price and irradianceBatteryGrid-connectedMinimizing the operational cost and maximizing the green factorMulti objective
Guichi et al. [49]PVLoad, irradianceBatteryGrid-connectedSatisfy the batteries, loads and grid energy requirementsFlow chart
Aghajani et al. [50]PV, wind turbine and fuel cellLoad, irradiance, wind speed and temperatureBatteryGrid-connectedMinimizing the operational cost and CO2 emissionMulti-objective optimization using MOPSO algorithm
Our proposedPV, wind energy systemLoad, irradiance, and wind speedBatteryStandaloneSatisfying the demand, protecting the batteries bank and prolong batteries lifeFlowchart and control algorithm
Publisher’s Note: MDPI stays neutral with regard to jurisdictional claims in published maps and institutional affiliations.

