Article

Prediction of the Water-Bearing Capacity of Coal Strata by Using the Macro and Micro Pore Structure Parameters of Aquifers

1
College of Earth Sciences & Engineering, Shandong University of Science and Technology, Qingdao 266590, China
2
College of Natural Resources, Shandong University of Science and Technology, Tai’an 271019, China
*
Author to whom correspondence should be addressed.
Energies 2021, 14(16), 4865; https://doi.org/10.3390/en14164865
Submission received: 15 July 2021 / Revised: 31 July 2021 / Accepted: 6 August 2021 / Published: 9 August 2021

Abstract

:
Accurate prediction of the water-bearing capacity of aquifers is crucial for protecting the surface ecological environment and ensuring safety during coal mining. In this study, a macro–micro combination was used to investigate the water-bearing capacity of bedrock aquifers. At the micro-level, the micro pore parameters of various sandstones were determined through cast sheeting. At the macro-level, the porosity and water absorption rate of various sandstones were determined experimentally. After that, a new index weighting method was proposed to comprehensively evaluate the water-bearing capacity index of sandstone. According to this method, the water-bearing capacity of aquifers in the Guojiahe coalmine were evaluated. The research results revealed that the water-bearing capacity of sandstone was mainly related to its pore connectivity, and the water-bearing capacity of sandstone in the Luo’he and Zhi’luo formation was considerably greater than that in the Yan’an formation. The water bearing capacity of strata in the eastern part of the mining area is lower than that in the western part of the mining area. The research results can provide considerable money savings for coal mining and protect the ecological environment and groundwater resources in the region.

1. Introduction

The increase in energy demand is mainly due to the increase in the population and industrialization [1,2,3]. The large-scale development of energy will lead to a violent conflict between man and nature [4,5,6,7]. Mining activities will inevitably cause surface subsidence, water waste and pollution, air pollution and a series of related problems, especially for the fragile ecological environment in some areas; moreover, mining easily causes injury and even death [8,9,10,11]. Water inrush is the main disaster of coal mining. Mastering the water content of strata is helpful to protect the groundwater from waste and pollution, and also to help the safe production of coal mining [8,12,13,14]. The water-bearing capacity of the strata is crucial for predicting sudden roof water rush accidents. Therefore, accurate and reliable evaluation of aquifer water distribution is critical. Many studies have focused on the water distribution evaluation of aquifers. Wei performed classification and partition clustering analysis on roof sandstone aquifers [15]. Wu used the graphic information system (GIS) information joint function to establish an aquifer water-rich evaluation model [5]. Chen used fuzzy clustering method combined with analytic hierarchy process (AHP) to divide the formation water abundance [16,17]. In fact, the water capacity of sandstone aquifer is closely related to its own pore structure. At present, there are many researches on the pore morphology and size of sandstone in the field of oil and gas [18,19]. The application of various technologies, including low field nuclear magnetic resonance (LF-NMR) [20], nuclear magnetic resonance (NMR) and mercury intrusion porosimetry (MIP) [21], X-ray diffraction (XRD) analysis, thin section, scanning electron microscopy (SEM) [22], small Angle neutron scattering (SANS) [23], X-ray computed tomography (XCT) [24,25], low temperature nitrogen adsorption (LTNA), rate-controlled mercury intrusion (RCMI) and high pressure mercury intrusion (HPMI) [26,27]. These experiments provide advanced methods for the study of the microscopic pore structure of sandstone. However, few scholars pay attention to the effect of pore structure on the water-bearing capacity of sandstone in the field of water control in coal mining.
Therefore, based on previous studies, this study considered the Guojiahe coal mine as an example. Sandstone-type water-bearing capacity has been comprehensively analyzed from the micro and macro perspectives. On the micro level, the plane porosity (PP), average pore diameter (APD), average specific surface (ASS), pore sorting coefficient (PSC), and throat homogenization coefficient (THC) of sandstone with various lithologies are determined through cast sheeting. On the macro level, the porosity and natural water absorption of various sandstone types are obtained by measuring pressure porosity and rock natural water absorption (NWA).
Through exploratory data analysis (EDA) of the indexes, it was found that there is a strong correlation between the indicators. Therefore, this paper proposes a new index weighting method that may well identify factors affecting the water-bearing capacity of sandstone formations. Grey relational analysis (GRA) method may be effective for evaluating the correlation between indicators and ranking different indicators according to their importance, but it cannot accurately provide quantitative weight assignment [28,29,30]. The new method considers the basis of the grey correlation coefficient, quantitatively estimates the change trend between sequences, considers the analysis of the nonlinear relation between multiple variables which is used to determine the grey correlation coefficient, and then establishes an objective evaluation based on the grey correlation coefficient matrix and computing feature vector according to different characteristics of the matrix vector value of sensitivity calculation [31,32,33,34]. On this basis, the model of sandstone water capacity is established. Then, the water-bearing capacity of groundwater was evaluated, and it was found that the water-bearing capacity of bedrock aquifer in the second mining area is weak, so large-scale geophysical exploration and water exploration and release work may not be conducted. The purpose of this study is to evaluate the water-bearing capacity of the bedrock strata in the study area through experiments on the water-bearing capacity of the strata, so as to ensure the safety of coal mining while protecting the groundwater resources from being wasted.

2. Background and Method

2.1. Background of the Study Area

The Guojiahe coal mine is located in Shanxi Province, China. Many folds and faults occur in the mining area and the groundwater resources are rich. In August 2020, during the mining of the 1309 working face in the first mining area, a serious water inrush accident occurred, with the maximum water inrush reaching 1200 m3/h. The maximum water depth of approximately 1 m and the cumulative water inflow was approximately 12.6 × 10⁴ m3. The collapse of the hydraulic support for coal seam protection in mining reduced the transportation efficiency of the belt conveyor and caused an economic loss of nearly 10 million US dollars [35,36]. The second mining area to be mined in the future is located west of the Guojiahe coal mine. The thickness of the aquifer in part of the second mining area is similar to that of the 1309 working face. Therefore, to ensure coal mining safety, large-scale geophysical exploration was planned to be carried out in the second mining area, covering nearly 11 km2. Then, 80 boreholes were designed in the second mining area to extract water from the aquifer. The plan would cost a lot of time and money and cause irreparable damage to groundwater (Figure 1).
The main mining coal seam is the Jurassic 3# coal seam, and the main roof aquifers are the Cretaceous Luo’he Formation and Jurassic Zhi’luo and Yan’an formations. The average thickness of the Luo’he Formation is 191 m, and its main lithology is brown-red sandstone with weak cementation. The average thickness of the Zhi’luo Formation is 42.5 m, and its main lithology is greyish green sandstone with medium sorting, secondary calcareous cementation and high hardness. The average thickness of the Yan’an Formation is 27.6 m and its main lithology is greyish black sandstone, which is poorly sorted and contains fine quartz gravel. In general, sandstone aquifers have large pores and locally developed fractures in water-rich heterogeneous layers (Figure 2).
In this experiment, sandstone samples were obtained from the Luo’he, Zhi’luo and Yan’an formations to conduct porosity and water absorption measurement experiments to predict the water-bearing capacity of aquifers with various lithologies.

2.2. Experiment on the Pore Structure Characteristics

The water storage space of sandstone aquifer contains various pores of different origins. The primary pores are gradually compacted and filled during deposition, burial, and diagenesis [37,38,39]. Simultaneously, the particles are destroyed by dissolution, resulting in secondary pores and a change in the primary pore structure. The number, size, and connectivity between primary and secondary pores are critical factors affecting strata aquifers.
The microscopic observations of casting sheets can be used to effectively study the size, distribution, type, connectivity, characteristics, and geometric morphology of rock pores; average pore throat ratio; average pore radius; throat; coordination number; fracture length and width; and fracture rate [40,41]. These parameters determine the pore structure characteristics of the rock. Therefore, after the collection of the rock samples from the coal mine, cast thin sections were made with a rock pore casting instrument, and microscopic analyses were performed using an Axio Scope A1 Pol optical microscope. The microscopic pore characteristics of rocks were studied using the fractal theory [42].
The macro pore characteristics of sandstone can be investigated using porosity and NWA. Sandstone aquifer is a rock mass formed during geological evolution and is formed through the diagenesis of clastic materials. The water-bearing capacity of sandstone aquifer is closely related to porosity and NWA [43]. The Poropdp-200 porosity measuring instrument was used to measure the porosity of the samples (Figure 3) [44,45]. The equipment constitutes a data control and analysis module, pulse attenuation control module, pressure pump, porosity measurement module, and high-precision pressure sensors with a pressure range of 0–200 psi, and the accuracy of ±0.1% of the full range was used in the study. Helium was used as the test medium. According to Boyle’s law, the sample’s pore volume was calculated using the helium pressure difference before and after the test to calculate its porosity.
The NWA of rock is a critical physical and mechanical property and refers to the ratio between the maximum weight of water absorbed by a rock sample under atmospheric pressure and the specimen’s drying weight (Equation (1)). The NWA size mainly depends on the number, size and opening degree of pores and fissures in the rock, which can effectively reflect the water-holding capacity of rock and the connectivity between rock pores.
W m = m 0 m s m s 100 %
W m N a t u r e   w a t e r   a b s o r p t i o n ( % ) ;   m 0 M a s s   o f   r o c k   s a t u r a t e d   w i t h   w a t e r ( g ) ;   m s Q u a l i t y   o f   r o c k   a f t e r   d r y i n g ( % )
Before measurement, the rock samples to be tested were placed in a vacuum oven and dried at 110 °C for 24 h. Next, the samples were weighed to the accuracy of 0.1 g after cooling to room temperature. The weighed test pieces were then placed in the water tank. Subsequently, water was injected to 1/4 of the test pieces’ height and filled to 1/2 and 3/4 places every 2 h. After 8 h, all the core samples were immersed. Next, the sample quality was measured every 8 h until no change was observed in the sample quality. Finally, Equation (1) was used to calculate the NWA of the sample.

2.3. Weighting Method of Eigenvector Based on the GRA

The structure and properties of sandstone determine its water-bearing capacity. The evaluation of the water-bearing capacity of sandstone essentially refers to the coupling of all the influencing indexes. Therefore, the determination of the index weight is the key to solving the multi-attribute decision-making problem. As an objective analysis method, GRA can be used to compare various influencing factors pairwise, observe the grey relational grade (GRG) between the reference and comparison sequences, evaluate the correlation between various indexes from the data level, and sort the correlation. However, combining all indexes and obtaining quantitative evaluation is difficult in GRG [31].
Therefore, based on GRA, an improved index weighting algorithm was proposed in which the index importance can be ranked by estimating the similarity between the data, and the evaluation matrix was established based on this. Then, the eigenvector of the matrix was calculated, and the evaluation model was finally established. The detailed steps of the algorithm are as follows.
First, the evaluation object and evaluation criteria are determined. The reference sequence is recorded as x j = x j ( 1 ) , x j ( 2 ) x j ( n ) . The comparison sequence is recorded as x i = x i ( 1 ) , x i ( 2 ) x i ( n ) . After standardizing the comparison sequence, according to Equation (2), the following evaluation matrix (2) is established:
y i = x i 1 n i = 1 n x i 1 n 1 i = 1 n ( x i 1 n i = 1 n x i ) 2
Y = y 11 y 12 y ln y 21 y 22 y 2 n y n 1 y n 2 y m n
Second, using Equation (3), the grave correlation coefficient (GCC) was calculated as follows:
ξ i ( k ) = min i min k y i ( k ) x j ( k ) + ρ max i max k y i ( k ) x j ( k ) | y i ( k ) x j ( k ) + ρ max i max k y i ( k ) x j ( k )
ξ i ( k ) T h e   G C C   o f   t h e   K   i n   t h e   i ;   ρ - R e s o l u t i o n   c o e f f i c i e n t ,   t h e   v a l u e   i s   0.54 . k = 1 , 2 , 3 , , n ;   i = 1 , 2 , 3 , , m ;
Then, using Equation (4), we calculated the GRG of each evaluation index.
G ( n , i ) = 1 n k = 1 n ξ i ( k )
G ( n , i ) - T h e   G r e y   R e l a t i o n a l   G r a d e ( G R G ) ;   k = 1 , 2 , 3 , , n ;   i = 1 , 2 , 3 , , m ;
The relational degree sequence of the evaluation object is established through GRG, and the relational degree is sorted. The larger the GRG is, the better the correlation is.
Next, the evaluation matrix containing all the indexes was established. The relation degree of the level set, a i j , is closely related to the judgement index and is determined using G ( n , i ) .
A = a 11 a 12 a 1 j a 21 a 22 a 2 j a i 1 a i 2 a i j
Next, using Equation (7), the eigenvector corresponding to each matrix is calculated as follows:
W i = a i j i = 1 a i j j = 1 a i j i = 1 a i j i = 1 , 2 , n ;   j = 1 , 2 , m
where W i is the influence intensity of a comparison sequence on the reference sequence as well as the weight value of the factors in the comparison sequence. To ensure the validity of Equation (7), the matrix completed through calculation is tested for consistency (Equation (8)).
C I = ( 1 n i = 1 n A w i / W i n ) / ( n 1 ) , C R = C I / R I
R I = C I 1 + C I 2 + + C I n n
The consistency test refers to determining the allowable range for judgement matrix A. The unique nonzero characteristic root of the n × n consistency matrix is n. The largest characteristic root of the n × n positive matrix, λ , is greater than or equal to n, if and only if λ = n, then matrix A is consistent.
When CR < 0.1, the judgement matrix passes the consistency test. Thus, the weight distribution is reasonable.

3. Results

3.1. Measurement of Pore Structure Parameters

In this case, 18 sandstone slices with various physical properties were selected for analysis. The pore size and connectivity of the samples were determined by measuring the PP, APD, ASS, PSC and THC of the samples. The PP refers to the percentage of pore and throat area in the total area of the slice. The equivalent area circle diameter represents the APD. The ASS relates to the ratio of pore surface area to volume or the ratio of equal circle surface area to volume. The THC is the average pore diameter divided by the maximum pore diameter.
Figure 4 displays the microscopic structures of the samples. Figure 5 shows an SEM image of the samples.
The minerals of the sandstone in the Luo’he formation are dominated by quartz and feldspar, with a particle size of 500–1000 µm. These are subangular, with poor roundness, poor sorting and pore cementation (Figure 4a). Intergranular pores are developed, and pore throat is large (Figure 5a). Feldspar dissolution occurs, and a large amount of kaolinite is formed (Figure 5b).
The porosity of the sandstone in Zhi’luo and Yan’an formations is less than that in the Luo’he formation, indicating their poor packing pattern and intergranular space (Figure 4b,c). Mineral composition mainly constitutes quartz and feldspar. The particle size is mostly between 250 and 500 m, with pore type cementation and particle support, and some pores are filled with organic matter (Figure 5c,d). The quartz grains are granular aggregate, with calcite cementation (Figure 5e).
The development of micro-cracks in the rock enhances pore connectivity and improves the rocks’ water-bearing capacity under certain conditions (Figure 4d and Figure 5f).
As listed in Table 1, the PP of sandstone is 4.57%–20.15%. The APD ranges from 20.3 to 51.9 μm. The ASS ranges from 0.51 μm−1 to 1.18 μm−1. The PSC is between 0.44 and 0.63, and the THC is between 13.59 and 28.74. Obvious differences occurred in pore structure parameters among various samples. The average PP, APD, ASS, PSC and THC of Luo’he sandstone were 19.17%, 47.94 μm, 1.125 μm−1, 0.6116 and 27.515, respectively; those of Zhi’luo sandstone were 14.015%, 28.2 μm, 1.02 μm−1, 0.5517 and 20.133, respectively; and those of Yan’an sandstone were 5.89%, 11.83 μm, 0.58 m−1, 0.473 and 14.81, respectively.

3.2. Macro Pore Characteristics of the Aquifer

In this experiment, 18 groups of core samples were selected to measure the porosity and NWA. The sampling depth of sandstone in the Luo’he formation was 460–570 m; that in the Zhi’luo formation was 750–810 m, and that in the Yan’an formation was 810–890 m. According to the differences in depth, the overburden pressure gradient was approximately 328.08 psi/m.
Table 2 presents the porosity measurement data of the sandstone core samples from various formations. The average porosities of the Yan’an, Zhi’luo and Luo’he formations were 8.48%, 14.50% and 21.89%, respectively.
The experimental results of NWA are presented in Table 3. The NWA rates of sandstone in the Luo’he, Zhi’luo and Yan’an formations were 7.42–7.63%, 5.2–5.4% and 4.54–4.68%, respectively, with average values of 7.53%, 5.31% and 4.6%, respectively.

3.3. Information Fusion of Micro Pore Parameters

Seven factors, namely NWA, porosity, PP, APD, ASS, PSC and THC, were used to establish the calculation model for sandstone water-carrying capacity.
Considering PP, APD, ASS, PSC, THC, porosity and NWA as reference sequences, the GCC of each index was calculated based on Equation (4). The GRG calculation of the evaluation index, the GCC of each index and the relationship between the comparison and reference sequences are illustrated in Figure 6.
Considering PP as the comparison sequence, the sensitivity of each factor to PP is as follows:
Porosity > THC > PSC > NWA > ASS > APD
Assuming APD as the comparison sequence, the sensitivity of each factor to APD is as follows:
NWA > Porosity > THC > PP > PSC > ASS
Considering ASS as the comparison sequence, the sensitivity of each factor to ASS is as follows:
PP > Porosity > PSC > THC > NWA > APD
With the PSC comparison sequence, the sensitivity of each factor to PSC is as follows:
THC > PP > Prosity > NWA > APD > ASS
Assuming THC as the comparison sequence, the sensitivity of each factor to THC is as follows:
  Prosity > PP > NWA > APD > PSC > PP
Assuming porosity as the comparison sequence, the sensitivity of each factor to porosity is as follows:
PP > THC > NWA > PSC > APD > ASS
With NWA as the comparison sequence, the sensitivity of each factor to NWA is as follows:
APD > THC > Porosity > PP > PSC > ASS
According to Equation (5), the GRG of each evaluation index is as follows:
  G PP = 0.6692 ; G APD = 0.6786 ; G ASS = 0.5941 ;   G PSC = 0.657 ; G THC = 0.735 ; G Porosity = 0.669 ; G NWA = 0.6935
According to differences between the GRG values of each index, a nine-level scaling method was established (Table 4), and a judgement matrix A was established based on Table 4. The judgement matrix A is presented in Table 5.
Based on Equation (7), the eigenvector W is calculated as follows:
W P P = 0.1139 , W A P D = 0.1187 , W A S S = 0.0326 , W P S C = 0.0724 , W T H C   = 0.3555 , W P o r o s i t y = 0.1139 , W N W A = 0.1930
Table 4 is checked for consistency according to Equation (8), λmax = 7.2499 CR = 0.0306 < 0.1.
By comparing the eigenvector coefficient of each index, the indexes difference is as follows:
  W T H C   > W N W A > W A P D > W P o r o s i t y = W P P > W P S C   > W A S S
The sandstone water-bearing capacity index calculation model was established in line with each index’s eigenvector, and the equation is as follows:
L = 0.1139 a P P + 0.1187 a A P D + 0.0326 a A S S + 0.0724 a P S C   + 0.3555 a T H C   + 0.1139 a P o r o s i t y + 0.193 a N W A
L   T h e   S a n d s t o n e   w a t e r   b e a r i n g   c a p a c i t y   i n d e x                    
Equation (9) is the evaluation model of the water-bearing capacity of sandstone. The water-bearing capacity of three sandstone types in the study area was calculated and evaluated using this expression (Table 6). According to Table 6, the average water-bearing capacity index of sandstone in the Luo’he, Zhi’luo and Yan’an formations is 0.917, 0.423 and 0.076, respectively. The comparison index revealed that the water-bearing capacity of sandstone in the Luo’he and Zhi’luo formations was higher than that in the Yan’an formation.
M E q u = 0.917 M L u o h e + 0.423   M Z h i l u o   + 0.076 M Y a n a n
M E q u E q u i v a l e n t   t h i c k n e s s   o f   s a n d s t o n e

4. Discussion

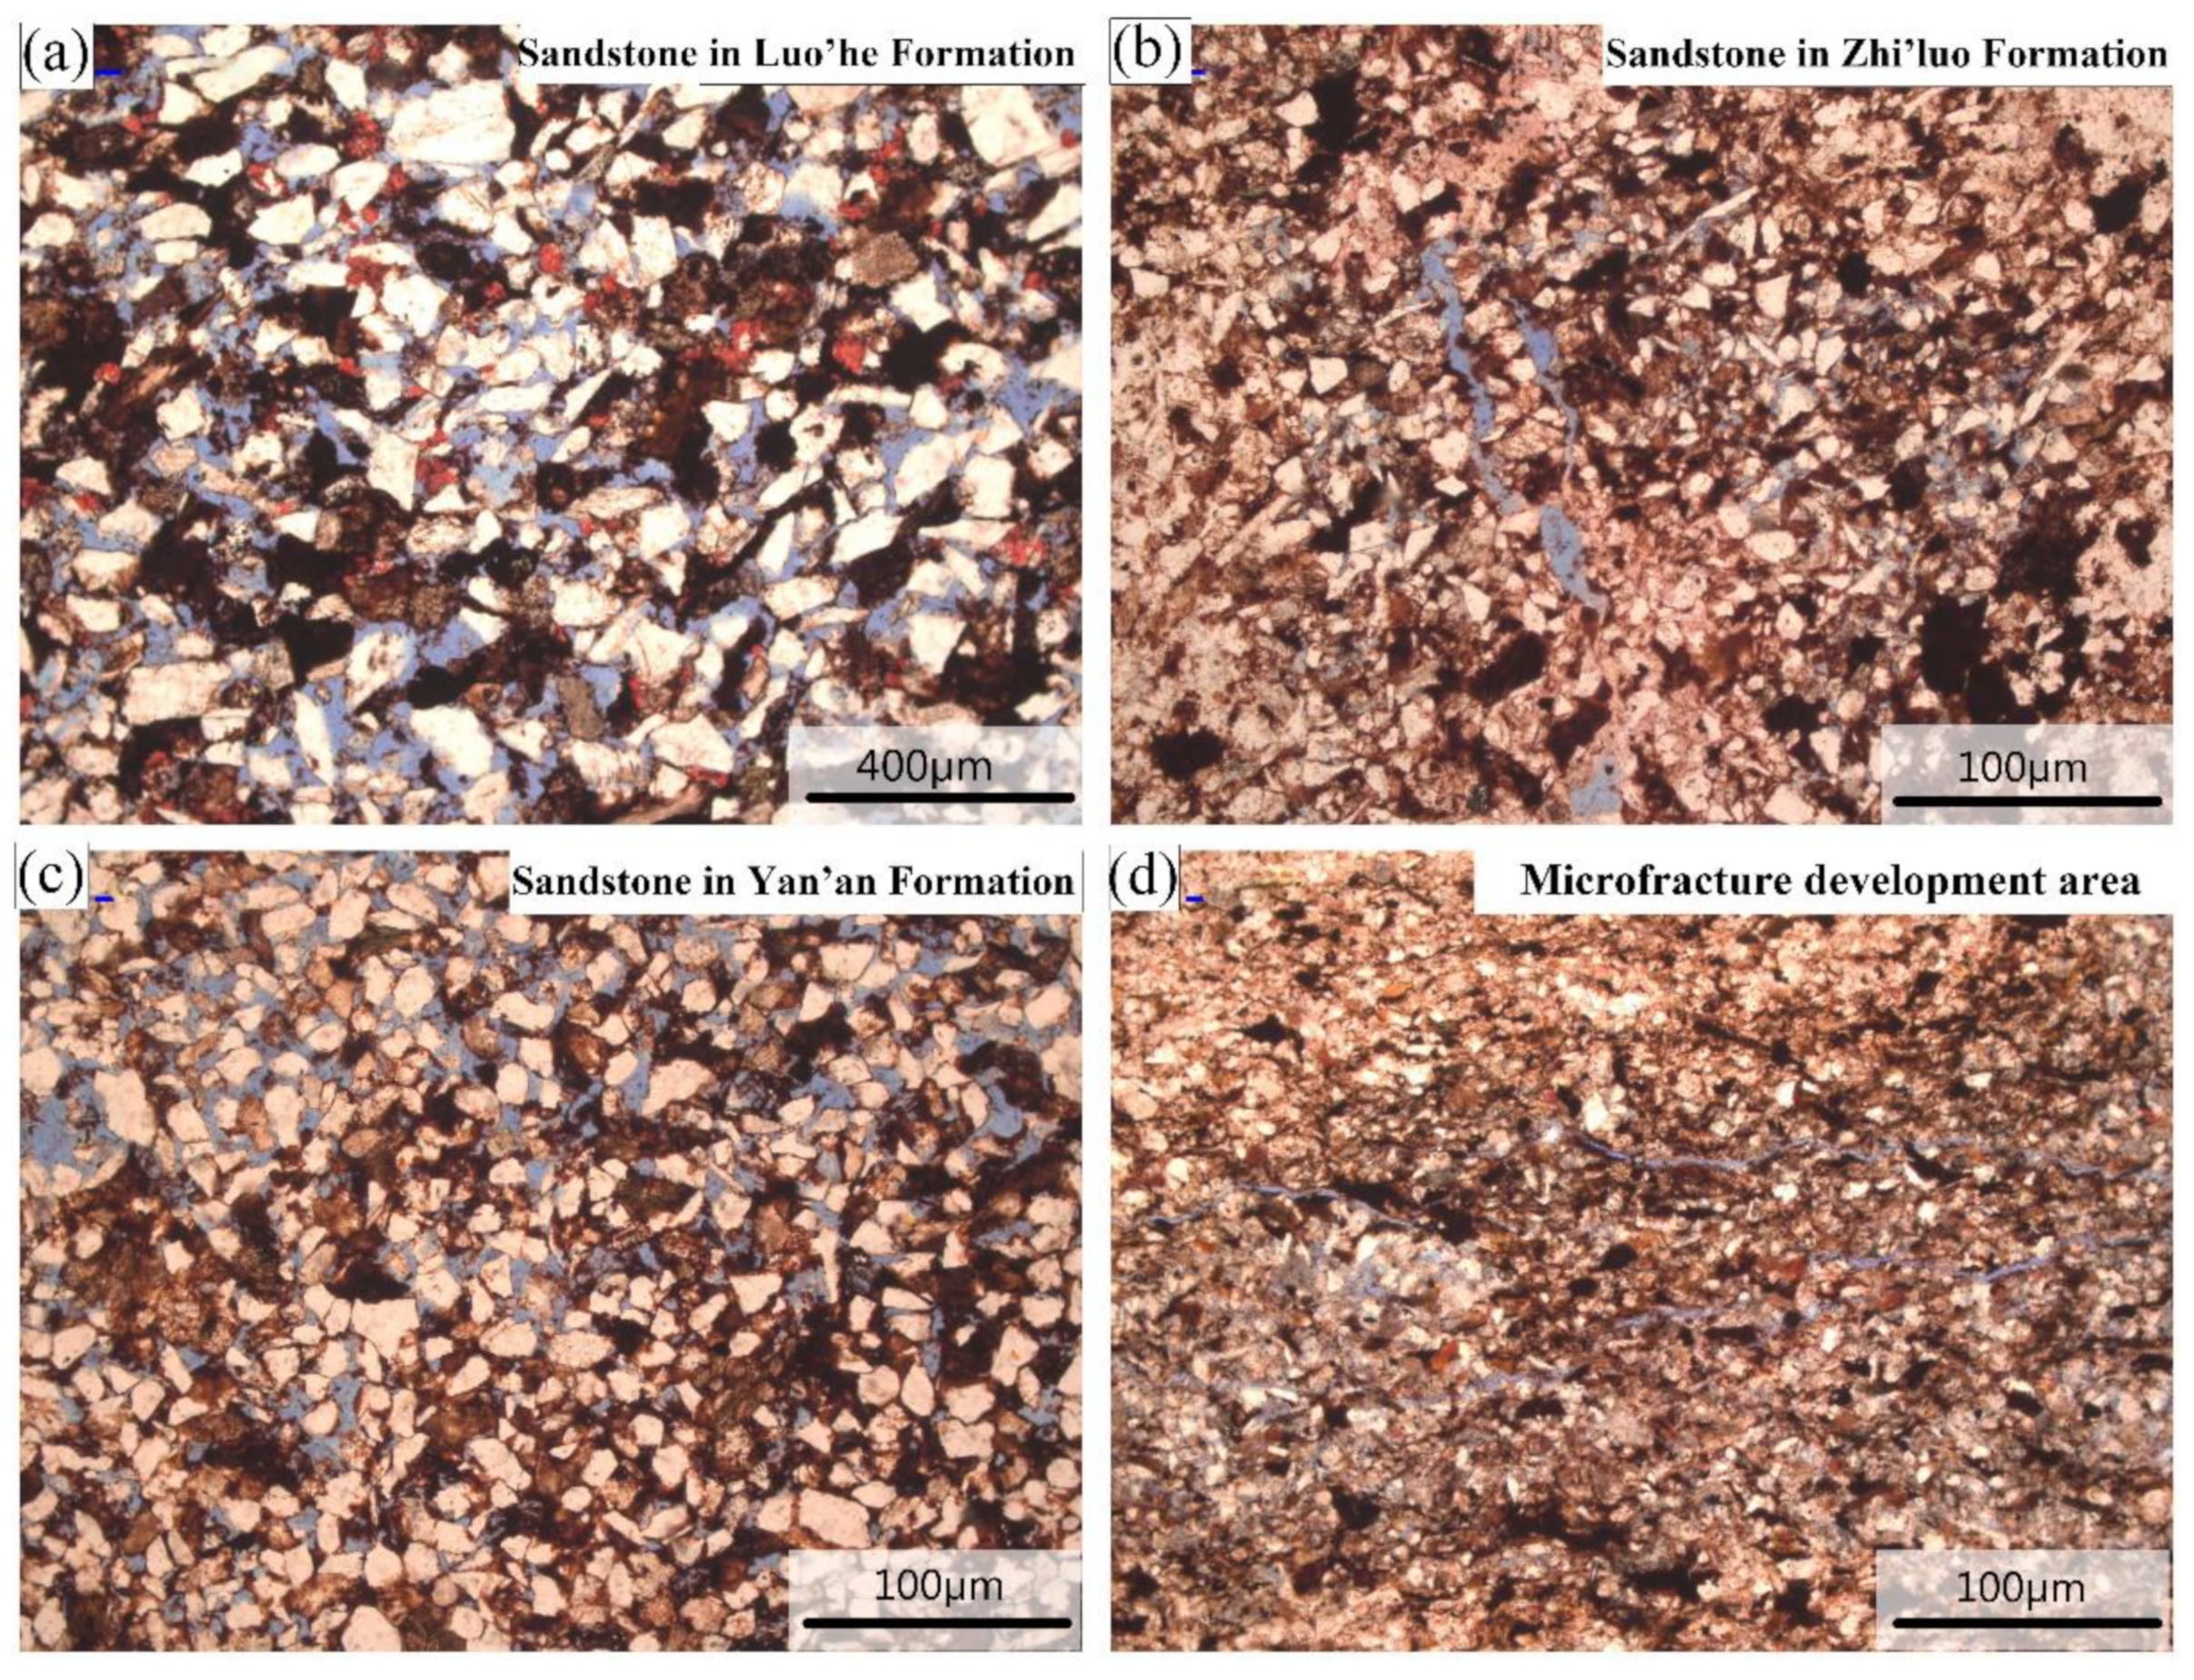
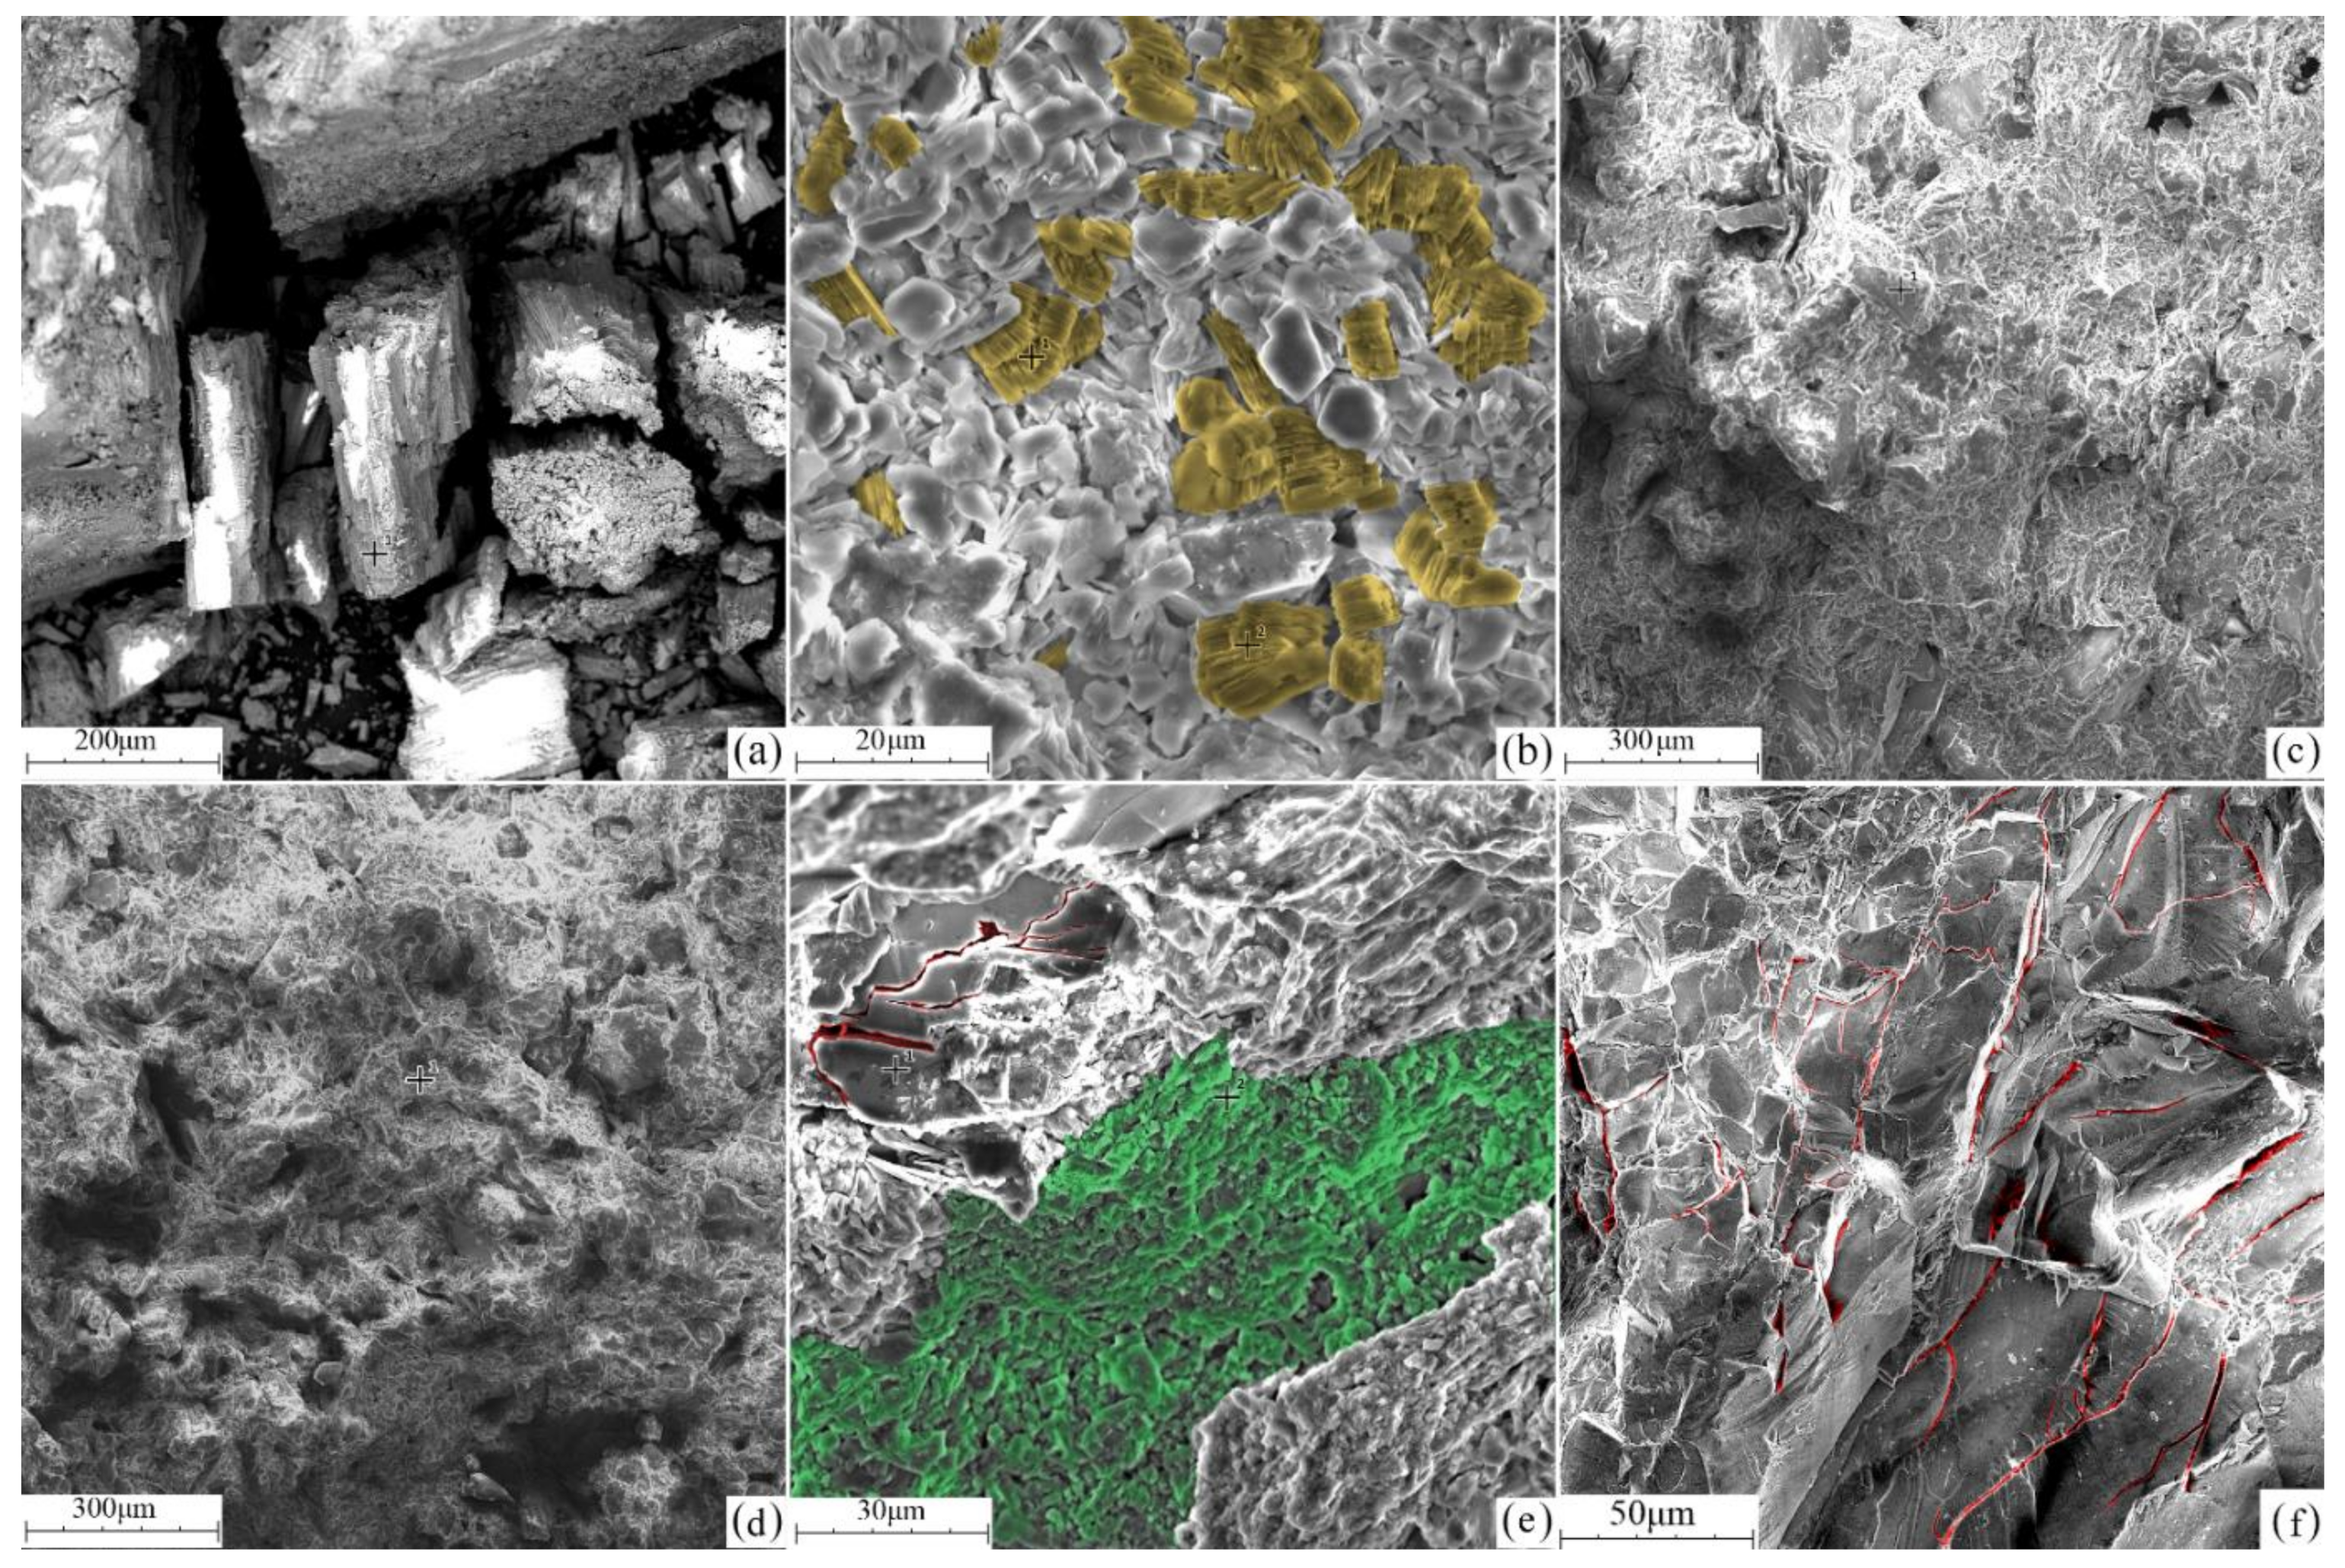
4.1. Micro Pore Structure Parameters of Various Types of Sandstone

The microscopic pore parameters of various groups of sandstone differ considerably due to the differences in their sedimentary environment, tectonic stress and burial depth. Figure 7 displays the diagram of the pore structure of the sample. The graph provides an intuitive comparison of the differences and trends of the same pore structure parameters of various samples.
Figure 7a reveals that the PP of various formation samples exhibits obvious step changes, which indicates that the sedimentary environments of the Luo’he, Zhi’luo and Yan’an formations differ considerably, and their pore content is different. In all the formations, the coefficient of variation of PP of different samples is 0.1599 at most, indicating that PP of different samples is stable in the same stratum.
As described in Figure 7b, the APD of Luo’he sandstone is considerably larger than that of the Zhi’luo and Yan’an sandstone, whereas the APD of Zhi’luo and Yan’an sandstone is similar. Thus, the pore connectivity of the Luo’he formation is considerably superior to that of the Zhi’luo and Yan’an formations. In all the formations, the coefficient of variation of APD of different samples is 0.074 at most; APD fluctuations in the same formation do not exceed 8 μm.
Figure 7c illustrates that the ASS of the sandstone in the Luo’he formation differs less from that of the sandstone in the Zhi’luo formation, whereas the ASS of Yan’an sandstone is considerably smaller than Luo’he and Zhi’luo sandstone. The particles of the Luo’he and Zhi’luo formations are rough, with poor roundness and strong adsorption capacity. In all formations, the coefficient of variation of ASS of different samples is 0.093 at most; ASS fluctuations in the same formation do not exceed 0.13 μm−1.
As displayed in Figure 7d, the PSC of the sandstone in the Luo’he formation is large. The PSC between Zhi’luo and Yan’an sandstone has a few differences. The sandstone of the Luo’he formation exhibits superior seepage capacity compared with that of the Zhi’luo and Yan’an formations. In the same formation, the coefficient of variation of PSC of different samples is no more than 0.0456, indicating that the PSC of the same layer is similar.
Figure 7e displays the variation trend of the THC, which is similar to the variation trend of Figure 7a. The THC of various formation samples exhibits considerable step change. In the same formation, the coefficient of variation of THC of different samples is no more than 0.0682, indicating that the THC of the same layer is similar.
The microscopic pore structure parameters of different samples in the same formation are similar, and the microscopic pore parameters of the samples in different formations show large differences. Therefore, sandstone in the same formation can be considered to belong to the same category when calculating the water-bearing capacity.
Figure 7f displays the radar chart of characteristic parameters of the pore structure test. The variation trends of various structural parameters among all the samples are generally similar, which indicates that PP, APD, AAS, THC and PSC are closely related. A strong correlation exists between the parameters. Therefore, the advantages and disadvantages of the reservoir space can be evaluated through comprehensive information fusion according to the similarity of the five parameters.

4.2. Macro Pore Structure Parameters of Various Types of Sandstone

Figure 8 illustrates a linear plot of porosity variation. First, obvious differences existed in the porosity of the samples of the Luo’he, Zhi’luo and Yan’an formations, indicating that the water-bearing capacity of various horizons differs considerably. Second, with an increase in pressure, the porosity of the samples of the Luo’he and Zhi’luo formations decreases, whereas the porosity of the samples of the Yan’an formations fluctuates relatively less, indicating that the pores of the Luo’he and Zhi’luo formations are large in diameter and suffer from weak original tectonic stress, which is a high-quality water reservoir.
Figure 9 displays the time-varying fitting curves of NWA of the three types of sandstone. The blue, green and red curves represent sandstones in the Luo’he, Zhi’luo and Yan’an formations, respectively. The points in Figure 9 represent the experimental data, and the curve represents the relevant results. The fitting effect is excellent, indicating that the experimental results are accurate. The NWA rate of the sample increased rapidly in the initial 48 h and remained stable during the next 48 h. After 64 h, the NWA rate did not change. Therefore, the experimental time was set for 72 h.
The final experimental results revealed limited difference in the samples from Luo’he and Zhi’luo formations, both of which are high-quality aquifers. The NWA rate of the samples from Yan’an formation was inferior; therefore, it was not considered the main aquifer.

4.3. Evaluation Model of Formation Water-Bearing Capacity in the Guojiahe Coal Mine

The established water-bearing capacity model was used to measure the water-bearing capacity. The thickness statistics and calculation results of various types of sandstone in the study area are displayed in Table 7. Next, the contour map (Figure 10) was drawn to comprehensively evaluate the water-bearing capacity of 3# coal roof.
Figure 10a presents the contour map of cumulative thickness of 3# coal roof aquifer in the study area. In the 1309 working face water inrush, the aquifer thickness was 380 m, and its maximum thickness was large. In the study area in the east, a piece of aquifer thickness was a >400 m area (red rectangle). If the region is in high-risk areas, drilling should be performed in advance before pumping water, which is not only costly but also destroys the groundwater resources and affects the ecological balance of the region.
Figure 10b displays the contour map of equivalent thickness of coal roof aquifer in the third research area and reveals the water inrush that occurred in the 1309 working face, with aquifer thickness of up to 330 m, which is similar to that presented in Figure 10a. By contrast, in the east, the red rectangle area within the aquifer thickness decreased to 250 m and was less dangerous primarily because the aquifer in the area of Yan’an group was large and thick. The water capacity was weak and the impact on mining was small. When mining in this area, geophysical exploration surveys can guarantee safety.

5. Conclusions

The following conclusions can be drawn from the study:
(1)
The results of the microscopic experiment showed that the APD and PSC of Luo’he formation sandstone were larger than those of Zhi’luo formation sandstone, but the APD and PSC of Zhi’luo and Yan’an formation sandstone do not differ considerably. The pore connectivity of Luo’he formation sandstone was much better than that of Zhi’luo and Yan’an formation sandstone. The Luo’he formation is the main aquifer in this region.
(2)
The results of the macroscopic experiment revealed that the average porosity of Luo’he formation sandstone was 7.39% higher than that of Zhi’luo formation sandstone and 13.41% higher than that of Yan’an formation sandstone. The Luo’he and Zhi’luo formations exhibit weak compaction, develop pores and have strong water-bearing capacity. The porosity of the Yan’an formation is low, and its water-bearing capacity is weak. In addition, the NWA difference between sandstone in the Zhi’luo and Yan’an formations was 0.62%, and the difference between sandstone in the Luo’he and Zhi’luo formations was 2.31%. The water-carrying capacity of the sandstone in Luo’he and Zhi’luo formations was considerably higher than that of the sandstone in the Yan’an formation.
(3)
An objective weighting model based on the similarity between indexes was proposed. This model was used to analyze pore structure parameters of various formations in the Guojiahe coal mine. The calculation model of water-bearing capacity of various formations was established. According to this model, the water-carrying capacity of 3# coal roof in the study area was analyzed. The results of previous mining studies indicated that there is a large-scale area with strong water inrush risk in the east of the study area, which is prone to water inrush if normal mining continues in the future. However, according to the model analysis in this paper, it was found that the actual water capacity in this area is medium, and there is no need to perform large-scale pumping, drilling or geophysical exploration before mining. The research results can save money for coal mining, which is beneficial for protecting the ecological environment and groundwater resources.

Author Contributions

Conceptualization, L.S. and T.L.; methodology, L.S.; validation, L.S., X.Z. and D.X.; formal analysis, T.L.; data curation, L.S.; writing—original draft preparation, L.S.; writing—review and editing, W.G. All authors have read and agreed to the published version of the manuscript.

Funding

This research was funded by the National Natural Science Foundation Program under Grant No. 42002282, the National Natural Science Foundation of China under Grant No. 41807283, the National Natural Science Foundation of China under Grant No. 51804184, the Natural Science Foundation of Shandong Province under Grant No. ZR2020KE023, Open Fund of State Key Laboratory of Coal Resources and Safe Mining under Grant No. SKLCRSM19KFA10, and Science and Technology Research Directive Plans of China National Coal Association under Grant No. MTKJ2018-263.

Institutional Review Board Statement

This paper does not involve human medical research.

Informed Consent Statement

This paper does not involve human medical research.

Data Availability Statement

The data presented in this study are available on request from the corresponding author.

Conflicts of Interest

The authors declare no conflict of interest. The funders had no role in the design of the study; in the collection, analyses, or interpretation of data; in the writing of the manuscript; or in the decision to publish the results.

Abbreviations

PPPlane Porosity
APDAverage Pore Diameter
ASSAverage Specific Surface
PSCPore Sorting Coefficient
THCThroat Homogenization Coefficient
NWANatural Water Absorption
SEMScanning Electron Microscope
GRAGrey Relational Analysis
GCCGrave Correlation Coefficient
GRGGrey Relational Grade
WmNatural Water Absorption
ξi(k)Grave Correlation Coefficient
ρResolution coefficient
G(n,i)Grey Relational Grade
WiEigenvectort
CIConsistency Index
RIRandom Consistency Indicator
CRConsistency Ratio

References

  1. Bárdossy, A.; Hörning, S. Gaussian and non-Gaussian inverse modeling of groundwater flow using copulas and random mixing. Water Resour. Res. 2016, 52, 4504–4526. [Google Scholar] [CrossRef] [Green Version]
  2. Bayram, A.; Oensoy, H. Sand and gravel mining impact on the surface water quality: A case study from the city of Tirebolu (Giresun Province, NE Turkey). Environ. Earth Sci. 2015, 73, 1997–2011. [Google Scholar] [CrossRef]
  3. Gordalla, B.C.; Ewers, U.; Frimmel, F.H. Hydraulic fracturing: A toxicological threat for groundwater and drinking-water? Environ. Earth Sci. 2013, 70, 3875–3893. [Google Scholar] [CrossRef]
  4. Howladar, M.F. Coal mining impacts on water environs around the Barapukuria coal mining area, Dinajpur, Bangladesh. Environ. Earth Sci. 2013, 70, 215–226. [Google Scholar] [CrossRef]
  5. Zeng, Y.; Wu, Q.; Liu, S.; Zhai, Y.; Lian, H.; Zhang, W. Evaluation of a coal seam roof water inrush: Case study in the Wangjialing coal mine, China. Mine Water Environ. 2017, 37, 174–184. [Google Scholar] [CrossRef]
  6. Karaman, A.; Seyhan, T.; Işık, M.F. Detecting the footprint of a longwall mine panel claimed to infringe on a permit boundary at the Soma–Darkale coalfield (Manisa, Turkey) using surface fractures and microgravity measurements. Environ. Earth Sci. 2013, 70, 1895–1902. [Google Scholar] [CrossRef]
  7. Quispe-Jofré, A.; Philimon, P.P.; Alfaro-Lira, S. Socio-environmental conflict over abandoned mining waste in Copaquilla, Chile. Environ. Sci. Pollut. Res. 2021, 7, 1–19. [Google Scholar] [CrossRef]
  8. Sasowsky, I.D.; Mylroie, J. Studies of Cave Sediments: Physical and Chemical Records of Paleoclimate; Springer: Cham, Switzerland, 2007. [Google Scholar]
  9. Zhang, Z.; Zou, Y.; Chen, J.; Wang, Y. Prediction model of land dynamic settlement in coal mining subsidence area. Trans. Chin. Soc. Agric. Eng. 2016, 32, 246–251. [Google Scholar]
  10. Pauli, L.; Markku, O. Optimal Environmental Policy for a Mine Under Polluting Waste Rocks and Stock Pollution. Environ. Resour. Econ. 2019, 73, 133–158. [Google Scholar]
  11. Su, R.J. Study and Analysis on Engineering Feature and Environmental Influence of Coal Mine. Adv. Mater. Res. 2012, 511, 175–178. [Google Scholar] [CrossRef]
  12. Golian, M.; Teshnizi, E.S.; Parise, M.; Terzić, J.; Milanović, S.; Vakanjac, V.R.; Mahdad, M.; Abbasi, M.; Taghikhani, H.; Saadat, H. A new analytical method for determination of discharge duration in tunnels subjected to groundwater inrush. Bull. Int. Assoc. Eng. Geol. 2021, 80, 3293–3313. [Google Scholar] [CrossRef]
  13. Harris, J.; Turner, J.; Kirsch, P. Case Study—Application of RISKGATE to Managing Strata Failure in an Australian Coalmine. In Proceedings of the Australian Ground Control Mining Conference, Sydney, NSW, Australia, 5–6 November 2014. [Google Scholar]
  14. Wu, Q.; Du, Z.; Zhao, Y.; Xu, H.; Zhang, X. Optimal location of water level sensors for monitoring mine water inrush based on the set covering model. Sci. Rep. 2021, 11, 1–12. [Google Scholar] [CrossRef]
  15. Wu, Q.; Xu, K.; Zhang, W.; Wei, Z. Roof aquifer water abundance evaluation: A case study in Taigemiao, China. Arab. J. Geosci. 2017, 10, 1–13. [Google Scholar] [CrossRef]
  16. Chen, L.; Feng, X.; Xu, D.; Zeng, W.; Zheng, Z. Prediction of Water Inrush Areas Under an Unconsolidated, Confined Aquifer: The Application of Multi-information Superposition Based on GIS and AHP in the Qidong Coal Mine, China. Mine Water Environ. 2018, 37, 786–795. [Google Scholar] [CrossRef]
  17. Yin, H.; Shi, Y.; Niu, H.; Xie, D.; Wei, J.; Lefticariu, L.; Xu, S. A GIS-based model of potential groundwater yield zonation for a sandstone aquifer in the Juye Coalfield, Shangdong, China. J. Hydrol. 2018, 557, 434–447. [Google Scholar] [CrossRef]
  18. Guo, X.; Huang, Z.; Zhao, L.; Han, W.; Ding, C.; Sun, X.; Yan, R.; Zhang, T.; Yang, X.; Wang, R. Pore structure and multi-fractal analysis of tight sandstone using MIP, NMR and NMRC methods: A case study from the Kuqa depression, China. J. Pet. Sci. Eng. 2019, 178, 544–558. [Google Scholar] [CrossRef]
  19. Hou, X.; Zhu, Y.; Chen, S.; Wang, Y.; Liu, Y. Investigation on pore structure and multifractal of tight sandstone reservoirs in coal bearing strata using LF-NMR measurements. J. Pet. Sci. Eng. 2020, 187, 106757. [Google Scholar] [CrossRef]
  20. Wang, F.; Yang, K.; Cai, J. Fractal Characterization of Tight Oil Reservoir Pore Structure Using Nuclear Magnetic Resonance and Mercury Intrusion Porosimetry. Fractals 2018, 26, 2. [Google Scholar] [CrossRef]
  21. Qu, K.; Guo, S. Investigation of the Pore Structure of Tight Sandstone Based on Multifractal Analysis from NMR Measurement: A Case from the Lower Permian Taiyuan Formation in the Southern North China Basin. Energies 2020, 13, 4067. [Google Scholar] [CrossRef]
  22. Anovitz, L.; Cole, D.R.; Jackson, A.; Rother, G.; Littrell, K.; Allard, L.F.; Pollington, A.; Wesolowski, D.J. Effect of quartz overgrowth precipitation on the multiscale porosity of sandstone: A (U)SANS and imaging analysis. Geochim. Cosmochim. Acta 2015, 158, 199–222. [Google Scholar] [CrossRef] [Green Version]
  23. Gong, L.; Nie, L.; Xu, Y. Geometrical and Topological Analysis of Pore Space in Sandstones Based on X-ray Computed Tomography. Energies 2020, 13, 3774. [Google Scholar] [CrossRef]
  24. Oluwadebi, A.G.; Taylor, K.G.; Ma, L. A case study on 3D characterisation of pore structure in a tight sandstone gas reservoir: The Collyhurst Sandstone, East Irish Sea Basin, northern England. J. Nat. Gas Sci. Eng. 2019, 68, 102917. [Google Scholar] [CrossRef]
  25. Zhao, X.; Yang, Z.; Lin, W.; Xiong, S.; Luo, Y.; Liu, X.; Xia, D. Fractal study on pore structure of tight sandstone based on full-scale map. Int. J. Oil Gas Coal Technol. 2019, 22, 123–139. [Google Scholar] [CrossRef]
  26. Zhao, X.; Yang, Z.; Lin, W.; Xiong, S.; Luo, Y.; Wang, Z.; Chen, T.; Xia, D.; Wu, Z. Study on Pore Structures of Tight Sandstone Reservoirs Based on Nitrogen Adsorption, High-Pressure Mercury Intrusion, and Rate-Controlled Mercury Intrusion. J. Energy Resour. Technol. 2019, 141, 1–26. [Google Scholar] [CrossRef]
  27. Wei, G.-W. GRA method for multiple attribute decision making with incomplete weight information in intuitionistic fuzzy setting. Knowl. Based Syst. 2010, 23, 243–247. [Google Scholar] [CrossRef]
  28. Zhang, S.-F.; Liu, S.-Y. A GRA-based intuitionistic fuzzy multi-criteria group decision making method for personnel selection. Expert Syst. Appl. 2011, 38, 11401–11405. [Google Scholar] [CrossRef]
  29. Wei, G.-W. Gray relational analysis method for intuitionistic fuzzy multiple attribute decision making. Expert Syst. Appl. 2011, 38, 11671–11677. [Google Scholar] [CrossRef]
  30. Yazdani, M.; Kahraman, C.; Zarate, P.; Onar, S.C. A fuzzy multi attribute decision framework with integration of QFD and grey relational analysis. Expert Syst. Appl. 2019, 115, 474–485. [Google Scholar] [CrossRef] [Green Version]
  31. Younas, M.; Jaffery, S.H.I.; Khan, M.; Khan, M.A.; Ahmad, R.; Mubashar, A.; Ali, L. Multi-objective optimization for sustainable turning Ti6Al4V alloy using grey relational analysis (GRA) based on analytic hierarchy process (AHP). Int. J. Adv. Manuf. Technol. 2019, 105, 1175–1188. [Google Scholar] [CrossRef]
  32. Altintas, K.; Vayvay, O.; Apak, S.; Cobanoglu, E. An Extended GRA Method Integrated with Fuzzy AHP to Construct a Multidimensional Index for Ranking Overall Energy Sustainability Performances. Sustainability 2020, 12, 1602. [Google Scholar] [CrossRef] [Green Version]
  33. Qiu, M.; Huang, F.; Wang, Y.; Guan, T.; Shi, L.; Han, J. Prediction model of water yield property based on GRA, FAHP and TOPSIS methods for Ordovician top aquifer in the Xinwen coalfield of China. Environ. Earth Sci. 2020, 79, 1–14. [Google Scholar] [CrossRef]
  34. Robert, K.; Witold, K.; Lech, G. An Effective Belt Conveyor for Underground Ore Transportation Systems. IOP Conf. 2017, 95, 042047. [Google Scholar]
  35. Krol, R. Studies of The Durability of Belt Conveyor Idlers with Working Loads Taken into Account. IOP Conf. Ser. Earth Environ. Sci. 2017, 95, 42054. [Google Scholar] [CrossRef] [Green Version]
  36. Zhao, J.; Xu, H.; Tang, D.; Mathews, J.P.; Li, S.; Tao, S. Coal seam porosity and fracture heterogeneity of macrolithotypes in the Hancheng Block, eastern margin, Ordos Basin, China. Int. J. Coal Geol. 2016, 159, 18–29. [Google Scholar] [CrossRef]
  37. Li, P.; Zheng, M.; Bi, H.; Wu, S.; Wang, X. Pore throat structure and fractal characteristics of tight oil sandstone: A case study in the Ordos Basin, China. J. Pet. Sci. Eng. 2017, 149, 665–674. [Google Scholar] [CrossRef]
  38. Shi, L.; Qiu, M.; Wang, Y.; Qu, X.; Liu, T. Evaluation of water inrush from underlying aquifers by using a modified water-inrush coefficient model and water-inrush index model: A case study in Feicheng coalfield, China. Hydrogeol. J. 2019, 27, 2105–2119. [Google Scholar] [CrossRef]
  39. Hou, P.; Gao, F.; Ju, Y.; Liang, X.; Zhang, Z.; Cheng, H.; Gao, Y. Experimental investigation on the failure and acoustic emission characteristics of shale, sandstone and coal under gas fracturing. J. Nat. Gas Sci. Eng. 2016, 35, 211–223. [Google Scholar] [CrossRef]
  40. Huang, W.; Lu, S.; Hersi, O.S.; Wang, M.; Deng, S.; Lu, R. Reservoir spaces in tight sandstones: Classification, fractal characters, and heterogeneity. J. Nat. Gas Sci. Eng. 2017, 46, 80–92. [Google Scholar] [CrossRef]
  41. Lin, W.; Li, X.; Yang, Z.; Lin, L.; Xiong, S.; Wang, Z.; Wang, X.; Xiao, Q. A New Improved Threshold Segmentation Method for Scanning Images of Reservoir Rocks Considering Pore Fractal Characteristics. Fractals 2018, 26, 1840003. [Google Scholar] [CrossRef] [Green Version]
  42. Gupta, S.; Kua, H.W. Effect of water entrainment by pre-soaked biochar particles on strength and permeability of cement mortar. Constr. Build. Mater. 2018, 159, 107–125. [Google Scholar] [CrossRef]
  43. Abbas, A.K.; Flori, R.E.; Alsaba, M.; Dahm, H.; Alkamil, E.H. Integrated approach using core analysis and wireline measurement to estimate rock mechanical properties of the Zubair Reservoir, Southern Iraq. J. Pet. Sci. Eng. 2018, 166, 406–419. [Google Scholar] [CrossRef]
  44. Xu, Y.; Wang, Y.; Yuan, H.; Zhang, D.; Agostini, F.; Skoczylas, F. Pore structure characterization of tight sandstone from Sbaa Basin, Algeria: Investigations using multiple fluid invasion methods. J. Nat. Gas Sci. Eng. 2018, 59, 414–426. [Google Scholar] [CrossRef]
  45. Lo, H.-W.; Liou, J.J. A novel multiple-criteria decision-making-based FMEA model for risk assessment. Appl. Soft Comput. 2018, 73, 684–696. [Google Scholar] [CrossRef]
Figure 1. Location of the study area in Shaanxi Province, China and the geological structure of the Guojiahe coal mine.
Energies 14 04865 g001
Figure 2. Stratigraphic column of Guojiahe coalmine.
Energies 14 04865 g002
Figure 3. Poropdp-200 porosity measuring instrument.
Energies 14 04865 g003
Figure 4. Microscopic observation of sandstone samples. (a) Sandstone in the Luo’he formation; (b) Sandstone in the Zhi’luo formation; (c) Sandstone in the Yan’an formation; (d) Microfracture.
Energies 14 04865 g004
Figure 5. SEM observation of samples. (a) Sandstone pores of the Luo’he formation; (b) Kaolinite; (c) Sandstone in the Zhi’luo formation; (d) Sandstone in the Yan’an formation; (e) Calcareous cementation; (f) Microfracture.
Energies 14 04865 g005
Figure 6. Heat degree of the GCC.
Energies 14 04865 g006
Figure 7. Point-line plot and radar chart of characteristic parameters of the pore structure test. (a) Pore structure parameters of PP; (b) Pore structure parameters of APD; (c) Pore structure parameters of ASS; (d) Pore structure parameters of ASC; (e) Pore structure parameters of THC; (f) The radar chart of pore structure characteristic parameters.
Energies 14 04865 g007
Figure 8. Linear chart of porosity of sandstone core samples.
Energies 14 04865 g008
Figure 9. Time-varying fitting curves of the NWA of samples.
Energies 14 04865 g009
Figure 10. Contour map of the equivalent thickness of sandstone on the roof of 3# coal seam. (a) Contour map of cumulative thickness of sandstone in roof of 3# coal seam. (b) Contour map of equivalent thickness of sandstone in roof of 3# coal seam.
Energies 14 04865 g010
Table 1. Characteristic parameters of pore structure test.
Sample IDTypePP (%)APD (μm)ASS (μm−1)PSCTHC
XY-1Sandstone in Luo’he Formation20.1551.91.180.6328.74
XY-219.5747.71.170.6126.74
XY-318.7148.221.140.626.82
XY-419.2545.331.110.6127.52
XY-518.3244.791.060.6228.14
XY-618.9949.751.090.627.13
XY-7Sandstone in Zhi’luo Formation13.7428.40.980.5319.26
XY-814.2432.31.070.5421.56
XY-914.5727.21.030.5718.69
XY-1013.3226.750.970.5620.88
XY-1114.5527.641.010.5419.76
XY-1213.6726.881.040.5720.65
XY-13Sandstone in Yan’an Formation7.0713.70.620.515.47
XY-146.3112.40.610.4816.44
XY-155.5411.10.550.4614.41
XY-166.6212.70.640.4914.74
XY-174.5710.30.510.4413.59
XY-185.2110.80.530.4714.21
Table 2. Test values of overburden porosity of samples.
Sample IDTypeDepth/mPorosity/%Overburden Pressure/Mpa
XY-1Coarse sandstone10022.41.04
XY-215022.251.56
XY-320021.932.08
XY-425021.762.60
XY-530021.623.12
XY-635021.43.64
XY-7Medium sandstone50015.215.19
XY-853014.85.51
XY-955014.515.71
XY-1057014.315.92
XY-1160014.126.23
XY-1262014.036.44
XY-13Fine sandstone6308.606.54
XY-146408.556.65
XY-156508.486.75
XY-166608.456.86
XY-176708.406.96
XY-186808.387.06
Table 3. Test values of the NWA of samples.
Sample IDTypeNatural/gDrying/gWater-Saturated/gNWA/%Average NWA/%
XY-1Sandstone in Luo’he Formation399.4374.6402.77.57.53
XY-2373.7356382.47.42
XY-3390.4365.6393.47.6
XY-4394.4366.9394.27.44
XY-5383.2357.2384.27.56
XY-6401.4390.5420.37.63
XY-7Sandstone in Zhi’luo Formation392.5385.6406.45.45.31
XY-8416.8410.2431.55.2
XY-9416.6408.9430.45.25
XY-10415408.8430.85.37
XY-11412.3404.1425.65.33
XY-12408.6391.2411.95.3
XY-13Sandstone in Yan’an Formation437432.3452.14.574.6
XY-14461.2447.3467.64.53
XY-15442.8433.2452.94.55
XY-16460.6451.7472.74.65
XY-17416.6408.9427.74.6
XY-18450.8444.24654.68
Table 4. Five-level scale method improved using the GRG.
ScaleMeaningExpression of the GRG
1The two factors have the same importance0 < G(n,i)-G(n,j) < 0.01
2One factor was slightly important than the other0.01 < G(n,i)-G(n,j) < 0.3
3One factor is important to other factors0.03 < G(n,i)-G(n,j) < 0.06
4One factor is more important than other factors0.06 < G(n,i)-G(n,j) < 0.09
5One factor is much more important than the other factorsG(n,i)-G(n,j) > 0.09
Table 5. Judgement matrix.
PPAPDASSPSCTHCPorosityNWAWi
PP0−0.0090.0750.012−0.0660.000−0.0240.1139
APD0.00900.0840.022−0.0570.010−0.0150.1187
ASS−0.075−0.0840−0.063−0.141−0.075−0.0990.0326
PSC−0.012−0.0220.0630−0.078−0.012−0.0370.0724
THC0.0660.0570.1410.07800.0660.0420.3555
Porosity0.000−0.0100.0750.012−0.0660−0.0250.1139
NWA0.0240.0150.0990.037−0.0420.02500.1930
Table 6. Statistics of the calculation results of the sandstone water-bearing capacity index.
Sandstone in Luo’he FormationSandstone in Zhi’luo FormationSandstone in Yan’an Formation
IDLAverageIDLAverageIDLAverage
10.9860.91770.4070.423130.0970.076
20.89580.467140.131
30.89590.397150.055
40.909100.436160.110
50.904110.408170.011
60.915120.425180.052
Table 7. Statistics table of sandstone thickness in the study area.
Borehole M L u o h e M Z h i l u o M Y a n a n M E q u Borehole M L u o h e M Z h i l u o M Y a n a n M E q u
G36-11603026161G19-12653212257
G36-22175432225G19-2333174313
G36-32413627238G31-1200539206
G36-42002830198G32-51914548198
G37-11984027201G32-71525715165
G37-22342243227G33-1128280129
G37-32944219288G33-21361720133
G38-12485441253G33-31514212157
G14-12203325217G33-4152559163
G14-21624617169G33-51463912151
G15-21313324136G33-6159201154
G15-342394359G33-71982625194
G15-41353653143G33-82174434220
G15-52064843213G34-11513430155
15-61816932198G34-21396829159
G16-11803125180G34-31347743158
G16-21544628162G34-41905143198
G16-31675457180G34-52687039278
G16-42805632283G34-63094340305
G16-53165338315G34-72054010206
G16-6114400121G35-1146508156
G16-72445624250G35-21475224159
G17-11436122159G35-31594836169
G17-22375320242G35-43194223312
G17-33243326313G319315135244
G17-43573322343G5-221118524273
G17-51703230171G5-322412479264
bk-1308324296G6-11453120147
bk-22922434281G6-21392716140
bk-33084110300G6-31422912143
bk-434816577395G6-41535545167
c13655311358G6-52405129243
C91903122189G6-62944120289
c102374717238G7-21435037155
c112814618279G7-33604618351
C142002420195G7-51593410161
C15180426183G8-32014228204
C172283314224G8-4329304315
C211713622174
Publisher’s Note: MDPI stays neutral with regard to jurisdictional claims in published maps and institutional affiliations.

