Article

A Simple Method for Detecting Partial Shading in PV Systems

1
Department of Electrical and Computer Engineering, Sultan Qaboos University, P.O. Box 33, Muscat 123, Oman
2
Sustainable Energy Research Center (SERC), Sultan Qaboos University, P.O. Box 33, Muscat 123, Oman
*
Author to whom correspondence should be addressed.
Energies 2021, 14(16), 4938; https://doi.org/10.3390/en14164938
Submission received: 14 July 2021 / Revised: 10 August 2021 / Accepted: 10 August 2021 / Published: 12 August 2021

Abstract

:
Partial shading conditions (PSCs) can significantly reduce the output energy produced by photovoltaic (PV) systems. Moreover, when such conditions occur, conventional and advanced maximum power point tracking (MPPT) systems fail to operate the PV system at its peak because the bypassing diodes may cause the PV system to become trapped at a low power point when they are in conduction mode. The PV system can be operated at the global maximum power point (MPP) with the help of global peak searching tools. However, the frequent use of these tools will reduce the output of PV systems since they force the PV system to operate outside its power region while scanning the I-V curve in order to determine the global MPP. Thus, the global peak searching tools should be deployed only when a PSC occurs. In this paper, a simple and accurate method is proposed for detecting PSCs by means of monitoring the sign of voltage changes (positive or negative). The method predicts a PSC if the sign of successive voltage changes is the same for a certain number of successive changes. The proposed method was tested on two types of PV array configurations (series and series–parallel) with several shading patterns emulated on-site. The proposed method correctly and timely identified all emulated shading patterns. It can be used to trigger the global MPP searching techniques for improving the PV system’s output under PSCs; furthermore, it can be used to notify the PV system’s operator of the occurrence of PSCs.

1. Introduction

The performance of solar photovoltaic (PV) systems is impacted by several parameters, such as solar irradiation, ambient temperature, PV cell temperature, airflow, dust, partial shading conditions (PSCs), and clouding. PSCs are considered to be the main cause of a PV system’s lifespan and output power reduction [1]. In addition, PSCs are one of the major factors contributing to power mismatches within PV modules or arrays [2]. Furthermore, when PSCs occur, the sun’s irradiation is unevenly distributed on the PV array, which results in conventional maximum power point tracking (MPPT) systems, such as constant voltage technique (CVT) [3], open circuit voltage technique (OVT) [4], short circuit technique (SCT) [5], perturb and observe (P&O) [6,7,8,9,10], and incremental conductance (IC) [11,12,13], not achieving their maximum power [1]. In recent years, many research studies have proposed advanced intelligent MPPT methods to improve conventional MPPT systems. Such methods include fuzzy logic (FL) [14,15,16], neural networks [17,18], support vector machines (SVMs) [19,20], particle swarm optimization [21,22], firefly algorithm (FA) [23], grey wolf optimization (GWO) [24], and simulated annealing (SA) [25]. Intelligent MPPT methods proved to be faster, more efficient, and more stable [26]. However, these methods are difficult to implement since they are complex [26] and carry a heavy calculation burden [27]. Aside from these drawbacks, intelligent MPPT methods are unable to ensure global maximum power point (MPP) operations under all PSCs. Therefore, to determine the global MPP under PSCs, both conventional and intelligent MPPT methods must be equipped with a searching mechanism, such as an I-V curve tracer: resistance [28], electronics [29,30], and capacitance [31,32], or a soft I-V curve sweeper, such as ant colony optimization [33], differential evolution (DE) [34], cuckoo search [35], chaotic search [36], Jaya-DE [37], and artificial bee colony [24]. As a result of this modification, the power of the PV system will be reduced if this searching technique is not correctly matched with the occurrence of PSCs. Therefore, it is crucial to have PSC detection methods that accurately determine when PSCs occur. The wrong decision unnecessarily initiates searching the global MPP.
Therefore, the necessity of developing a new PSC detection (PSD) method without sacrificing the PV maximum output power is obvious.
Some PSD methods were proposed in [38,39,40,41,42,43]. The methodology of PSD relies on monitoring the rate of change between successive measurements of PV module/array output parameters, such as I p v , V p v , and P p v . According to [38,39,40,41,42,43], when the rate of change in P , I , or V is compared with threshold values, it may be possible to detect the occurrence of PSCs. For example, ref. [41,42] considered 10–20% of P m p p and 5% of the nominal power, respectively, to detect PSCs. For the same rate change, ref. [43] set the threshold at 15%. In other publications [38,39,40,44], the authors pointed out the need to normalize the rate change in the output parameters of the solar array in order to prevent falsely detecting PSCs even at extremely low solar irradiance levels. For instance, according to [38], to detect PSCs, the power rate change should be normalized to the voltage rate change as described in Equation (1). This ratio, however, does not make sense in every PSC scenario, especially when the area of the shaded panels exceeds that of the unshaded ones by a very large margin. Thus, to capture the various PSC scenarios, ref. [38] further enhances the PSD proposal with two additional criteria, which are given in Equations (3) and (4); these are the thresholds suggested by simulations of several PSC scenarios.
P S I = Δ P Δ V . P | V M P P _ a r r a y
| P S I | > 0.001
| Δ V M P P _ a r r a y V M P P _ a r r a y | > 0.02
| Δ V M P P _ m o d u l e   V M P P _ m o d u l e | > 0.02
Interestingly, ref. [40,44] provided another suggestion, stating that comparing the real power and the obtained maximum power per Equation (5) with a predetermined threshold value is sufficient for detecting PSCs. According to them, if the PSC is greater than 0.1, it is considered to take place. Similarly, ref. [45] used the same concept as [40] but with a smaller threshold (0.05).
Δ P = | P i n P M P P P M P P |
Although the PSD methods in the early references appear to be straightforward, they are not accurate and could be misled by changes in solar irradiance due to a slow movement of clouds or a change in load that could be caused by the PSC patterns [46,47]. In addition, there is no proof that the threshold values are effective [48]. Hence, [39] avoided these disadvantages by using more computational methods. It was stated by the author that a PSC is confirmed once the two conditions listed in Equations (6) and (7) are met simultaneously.
  V L P P 0.9   V m p p   n o m i n a l
G L P P   G n o m i n a l
A method was proposed in [49] that does not use any sensors to determine the PSC; instead, it is entirely based on reading the operating MPP. The method uses statistical techniques, such as principal component analysis (PCA) and linear discriminant analysis (LDA), to obtain the PSC classification threshold coefficient. Techniques such as these can, for example, easily separate data with different levels of health status. The author used the I–V curve tracing device to collect the necessary voltage, current, and power data for the shadowed and uncovered PV panels. This information is then utilized to train PCA and LDA tools to obtain the PSC signatures and features, such as classification coefficients. These coefficients are later used to determine whether the PV system is being shaded or not. Despite the author’s claims that the method is 100% accurate, the method has been tested on only one PV panel. Additionally, it is unlikely to be feasible for a large PV array since it becomes cumbersome and time-consuming.
In [50], an accurate method for detecting PSCs is proposed. In this method, a voltage sensor is positioned on the terminals of each PV module. When the panel voltage drops by more than 1 V, a PSC is alerted. The author of [51] employed the concept of [50] but with only one voltage sensor. The author used an automatic switching matrix and a controller to measure the voltage across each PV panel. Figure 1 illustrates the block diagram of the proposed method. These methods, however, are incredibly expensive and are not practical for large array sizes.
In this paper, a method is proposed for detecting PSCs by monitoring consecutive voltage changes in PV arrays. The primary objective of this method is to detect all possible array configurations of PV arrays (series and series–parallel) correctly. Various simulation cases will be tested to check the effectiveness of the developed method in alerting partial shading. In addition, to assess the effectiveness of the new method, the performance of the proposed method is compared with that of other detection methods. This paper’s major contributions are as follows:
  • The paper presents a simple and accurate method for detecting all types of PSCs;
  • The proposed method achieves excellent detection performance under different PSCs across two different PV array configurations (series and parallel).
The paper is organized as follows. Section 2 presents the proposed PSC detection method. In Section 3, the experimental setup and procedure are outlined. The simulation results, as well as the experimental results, are discussed and illustrated in Section 4. The conclusion is given in Section 5.

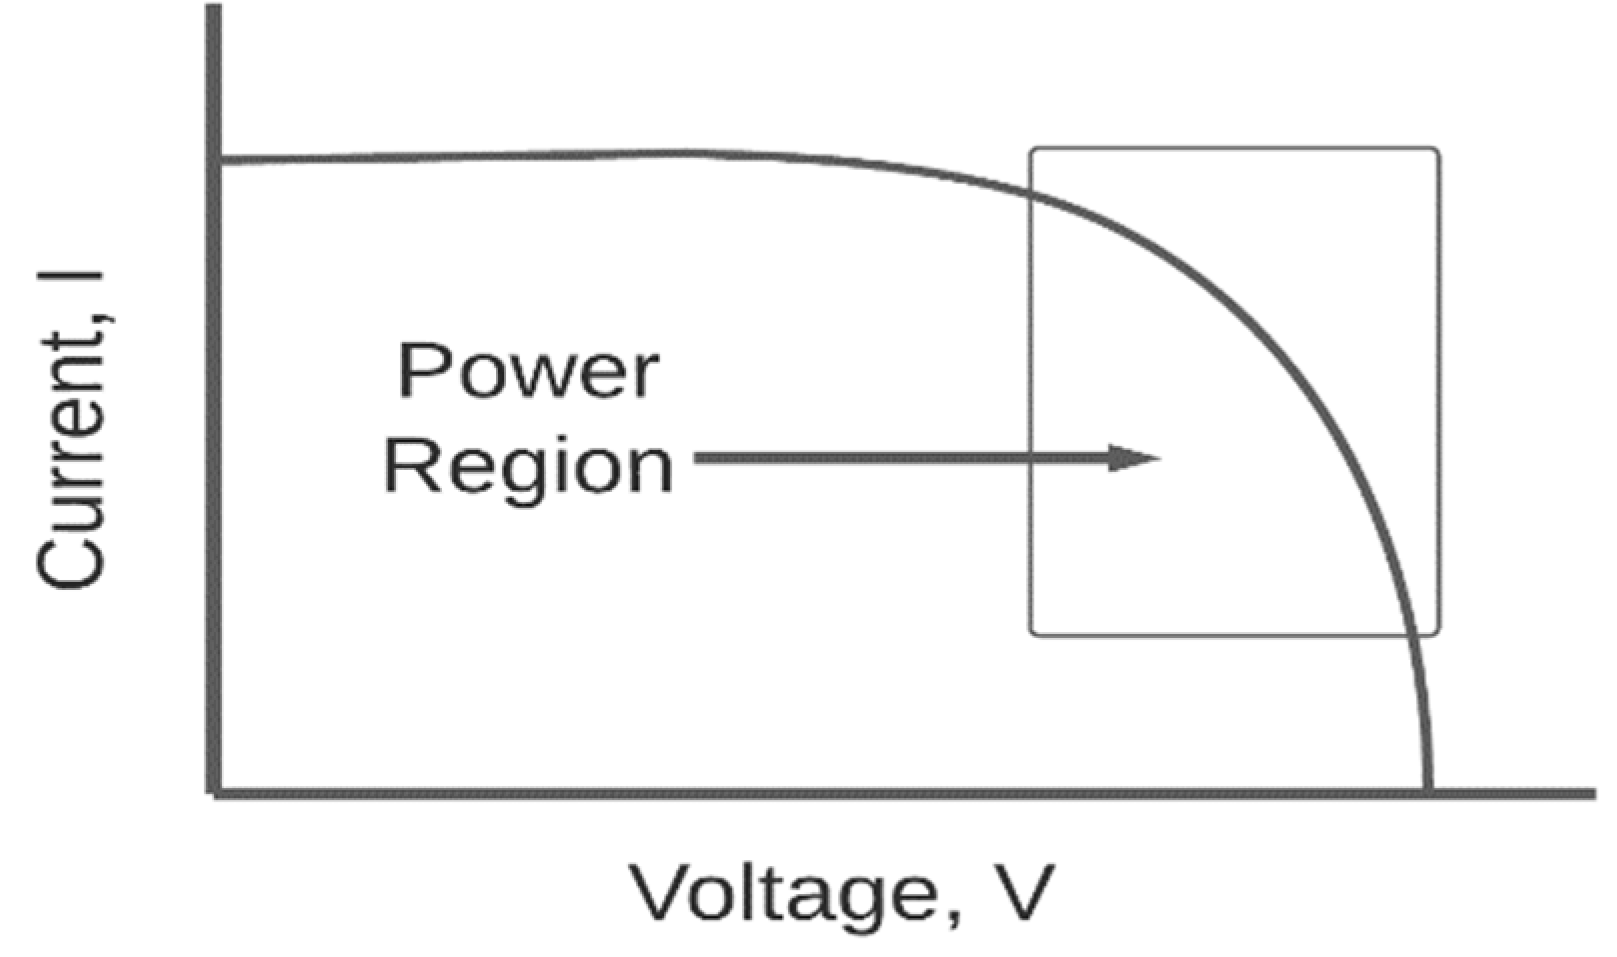
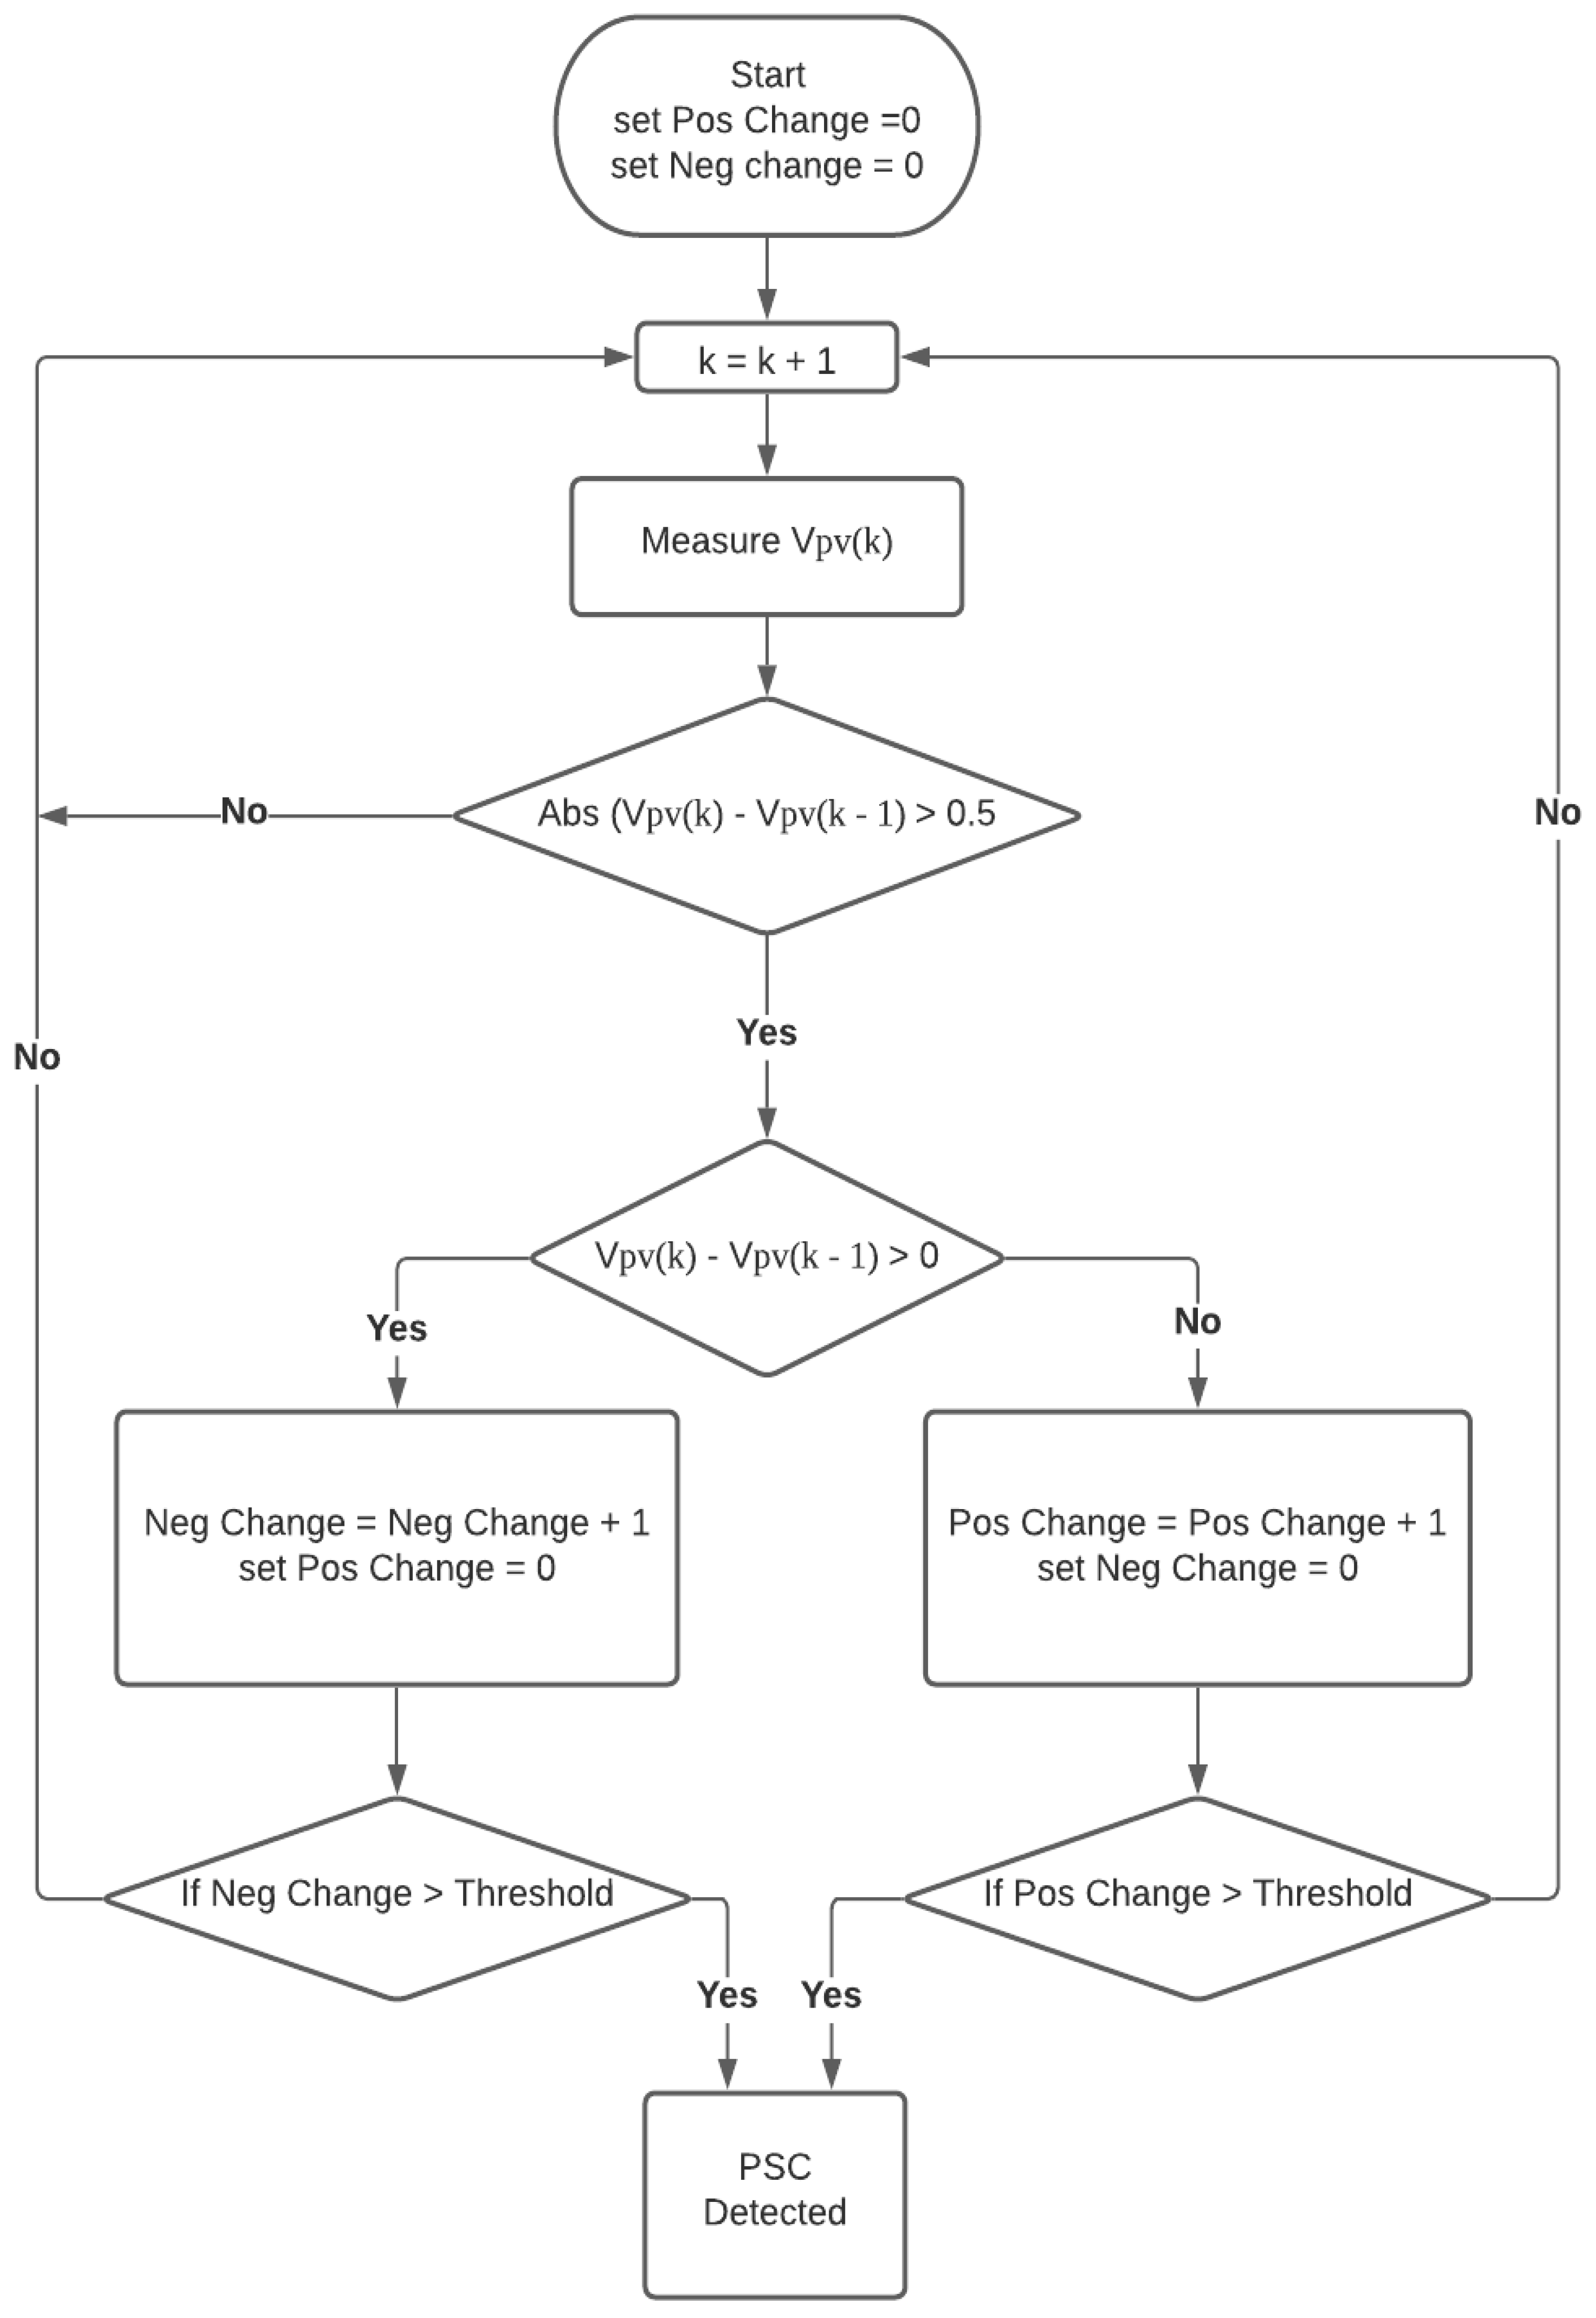
2. Proposed PSD Method

The PV arrays alter their output voltage with changes in their output current, which depends heavily on the amount of received sunlight. Based on Figure 2, we can see that as the array current decreases, the PV array’s voltage increases in the power region. Depending on the type of PSC, the array current may decrease or increase under PSCs. Some types of PSCs, such as object shading and row-to-row shading, will completely block the sun’s radiation, which eventually leads to conduction in the bypassing diodes, causing a sudden drop in the array voltage. On the other hand, some PSC types (e.g., clouds) lead to a reduction in the amount of incident sunlight on the PV panels. This reduction, in turn, causes a drop in output current, which leads to an increase in array voltage. Therefore, we conclude that changes in the array voltage can be a sign of any type of PSC.
In light of the above observation, the proposed PSD method monitors the consecutive voltage changes across the PV array. Figure 3 illustrates the proposed method with a flowchart. The method calculates the change from the last voltage to the next voltage and counts the number of times a change is consecutively positive or negative. Whenever the sign of successive voltage changes is the same for longer than a specified number (the threshold value) of consecutive changes, the proposed method declares a PSC occurrence. The number of successive changes is determined once and offline by partially shading one PV cell of the panel. While partial shading is applied, the number of successive changes is determined by counting how many times the voltage drops until it becomes stable. In contrast, if the sign of the change in voltage repeatedly alters from positive to negative, then the proposed method does not flag a PSC. To increase the immunity to voltage fluctuations, changes in voltage of less than 0.5 V (0.45% of V M P P ) are not taken into account, since they can result from changes in load, fluctuations in irradiance or temperature, or fault transients on the grid.

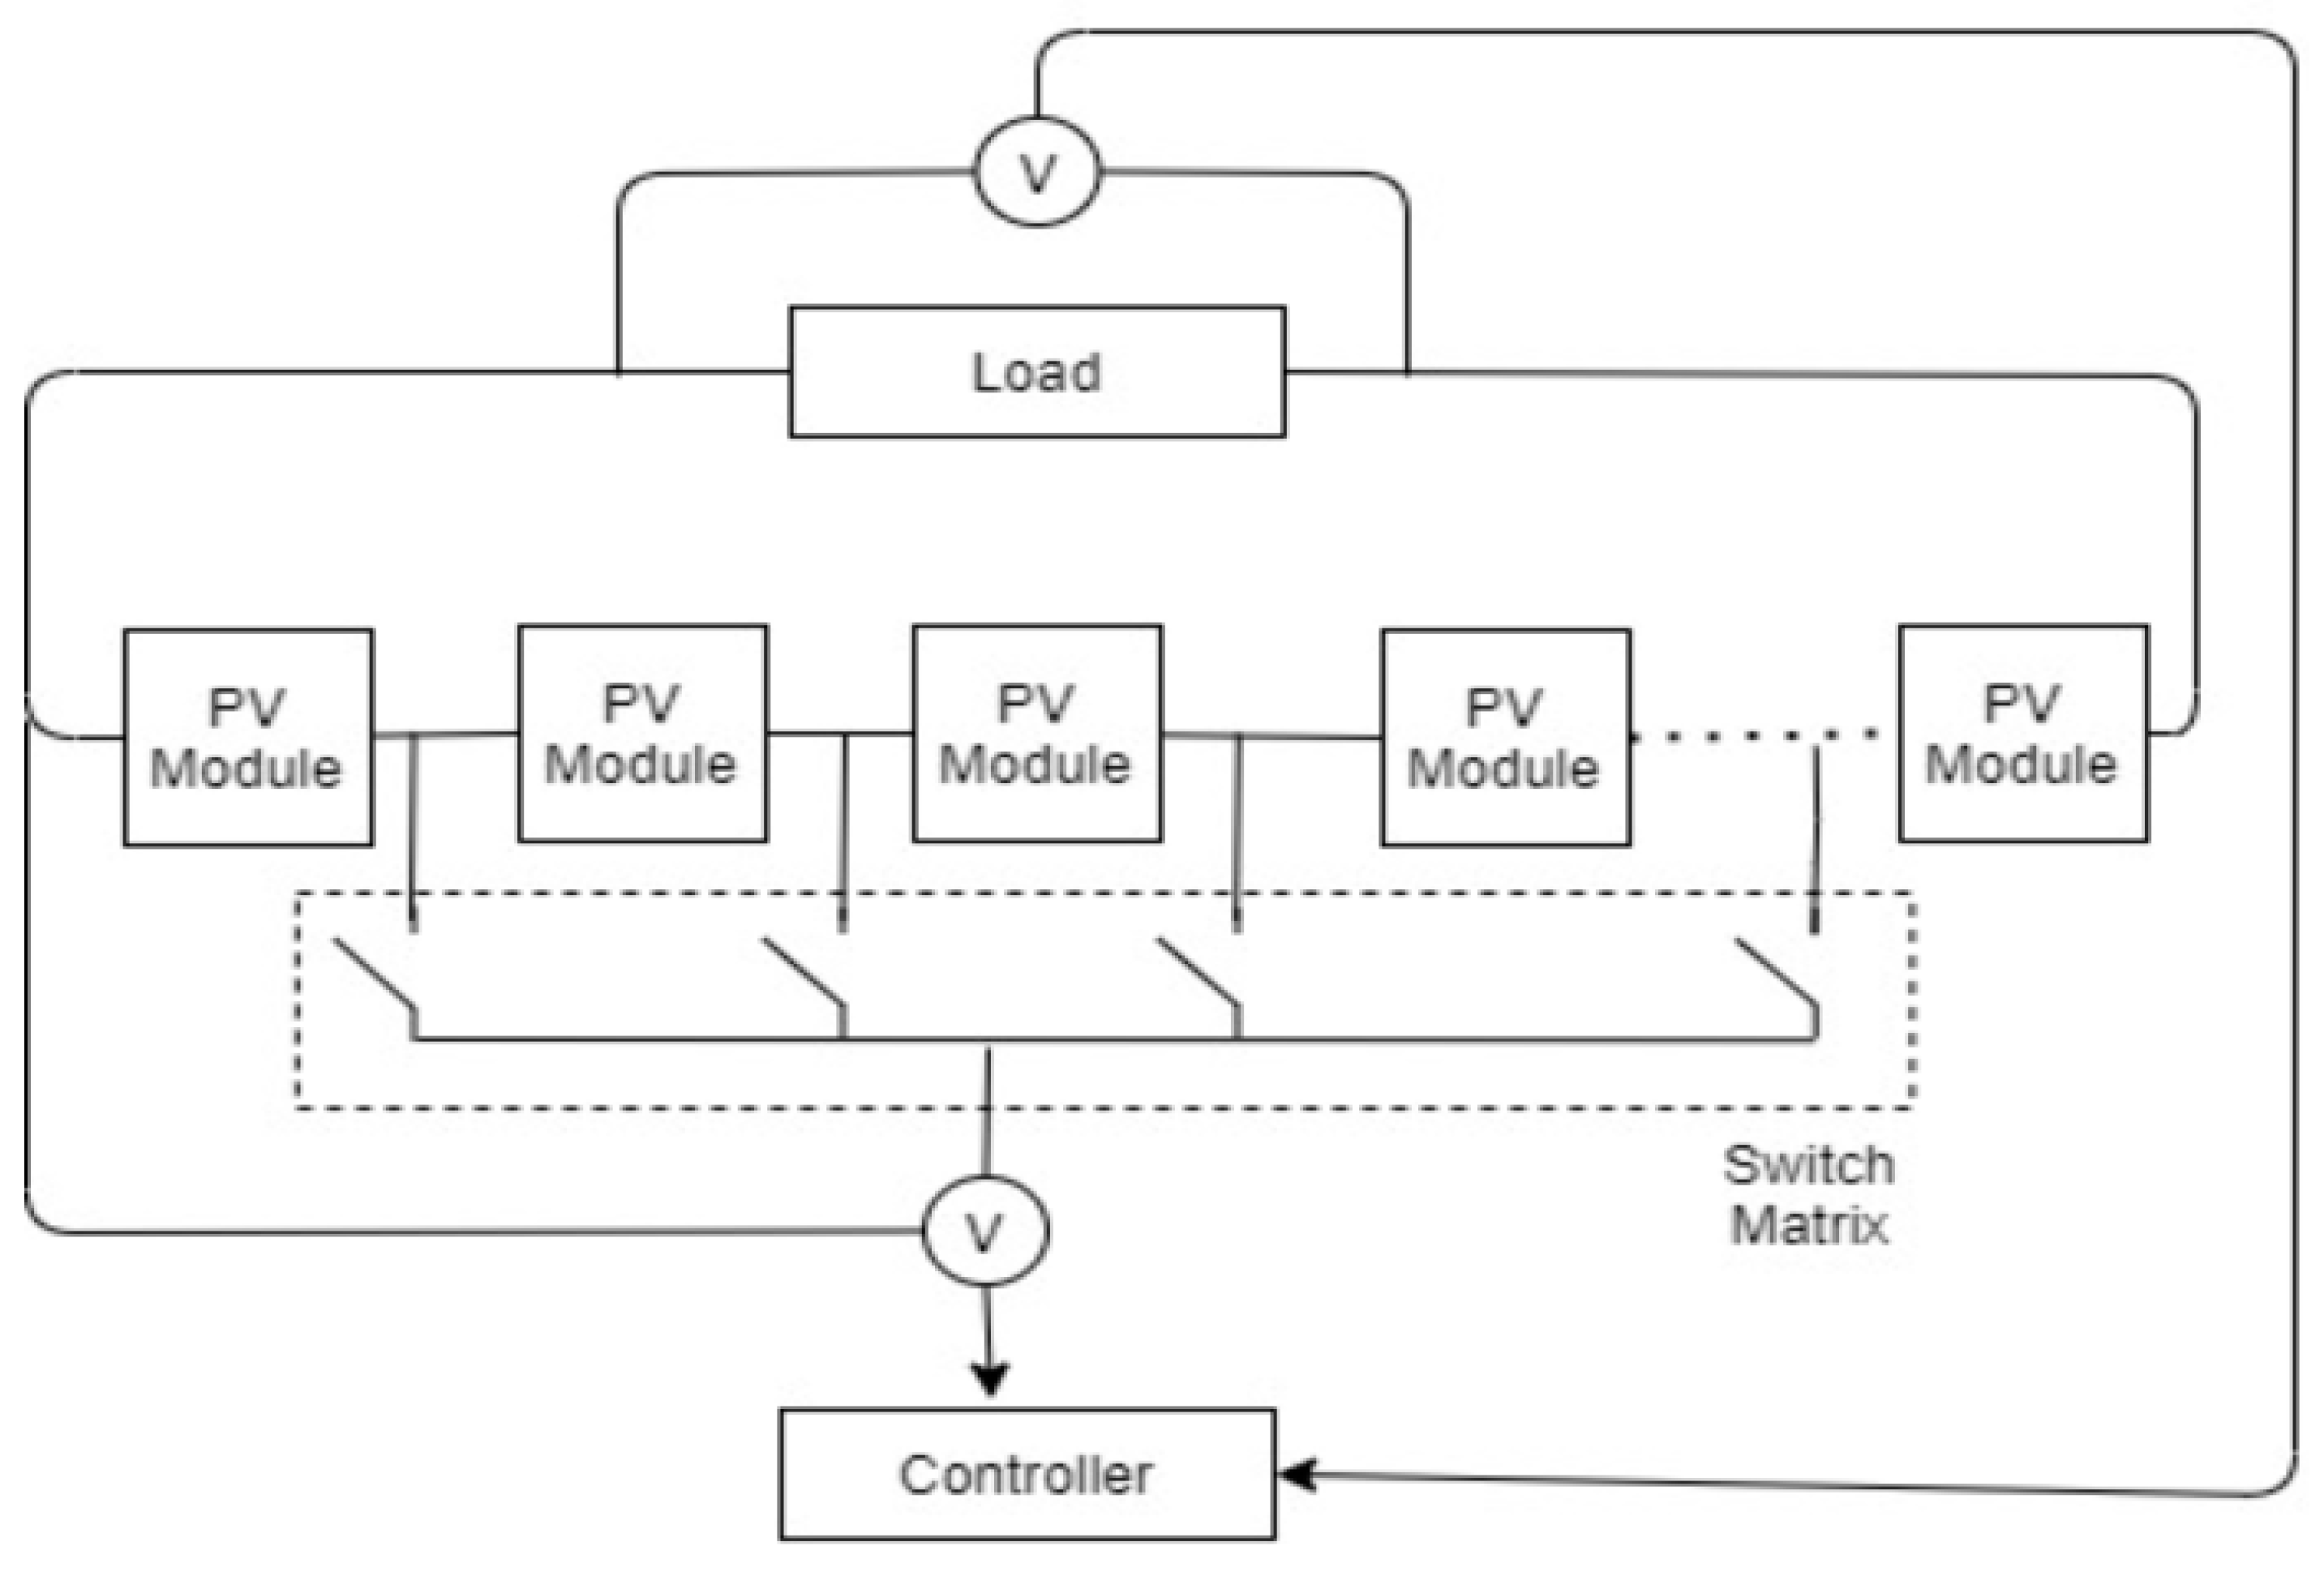
3. Experimental Set-Up and Procedure

3.1. Experimental Set-Up

To test the effectiveness of the proposed method, simulations of PSCs were physically conducted on two different PV array configurations: series and series–parallel. The MPP voltage for the series and series–parallel PV arrays were 576 V and 109.4 V, respectively. A series PV array consisted of 15 PV panels connected in series. A series–parallel PV system was a 2 × 6 array consisting of two PV modules connected in series, with six strings arranged in parallel. The specifications under standard test conditions (STCs) of a solar irradiation of 1000 W/m2, an air mass of 1.5, and a cell temperature of 25 °C of the PV modules used in a series PV array and in a series–parallel PV array are provided in Table 1. A Fluke 435 Power Quality Meter was connected to the PV array output terminals for measuring the voltage during the PSC simulations. The experimental setup of both PV array configurations is shown in Figure 4.

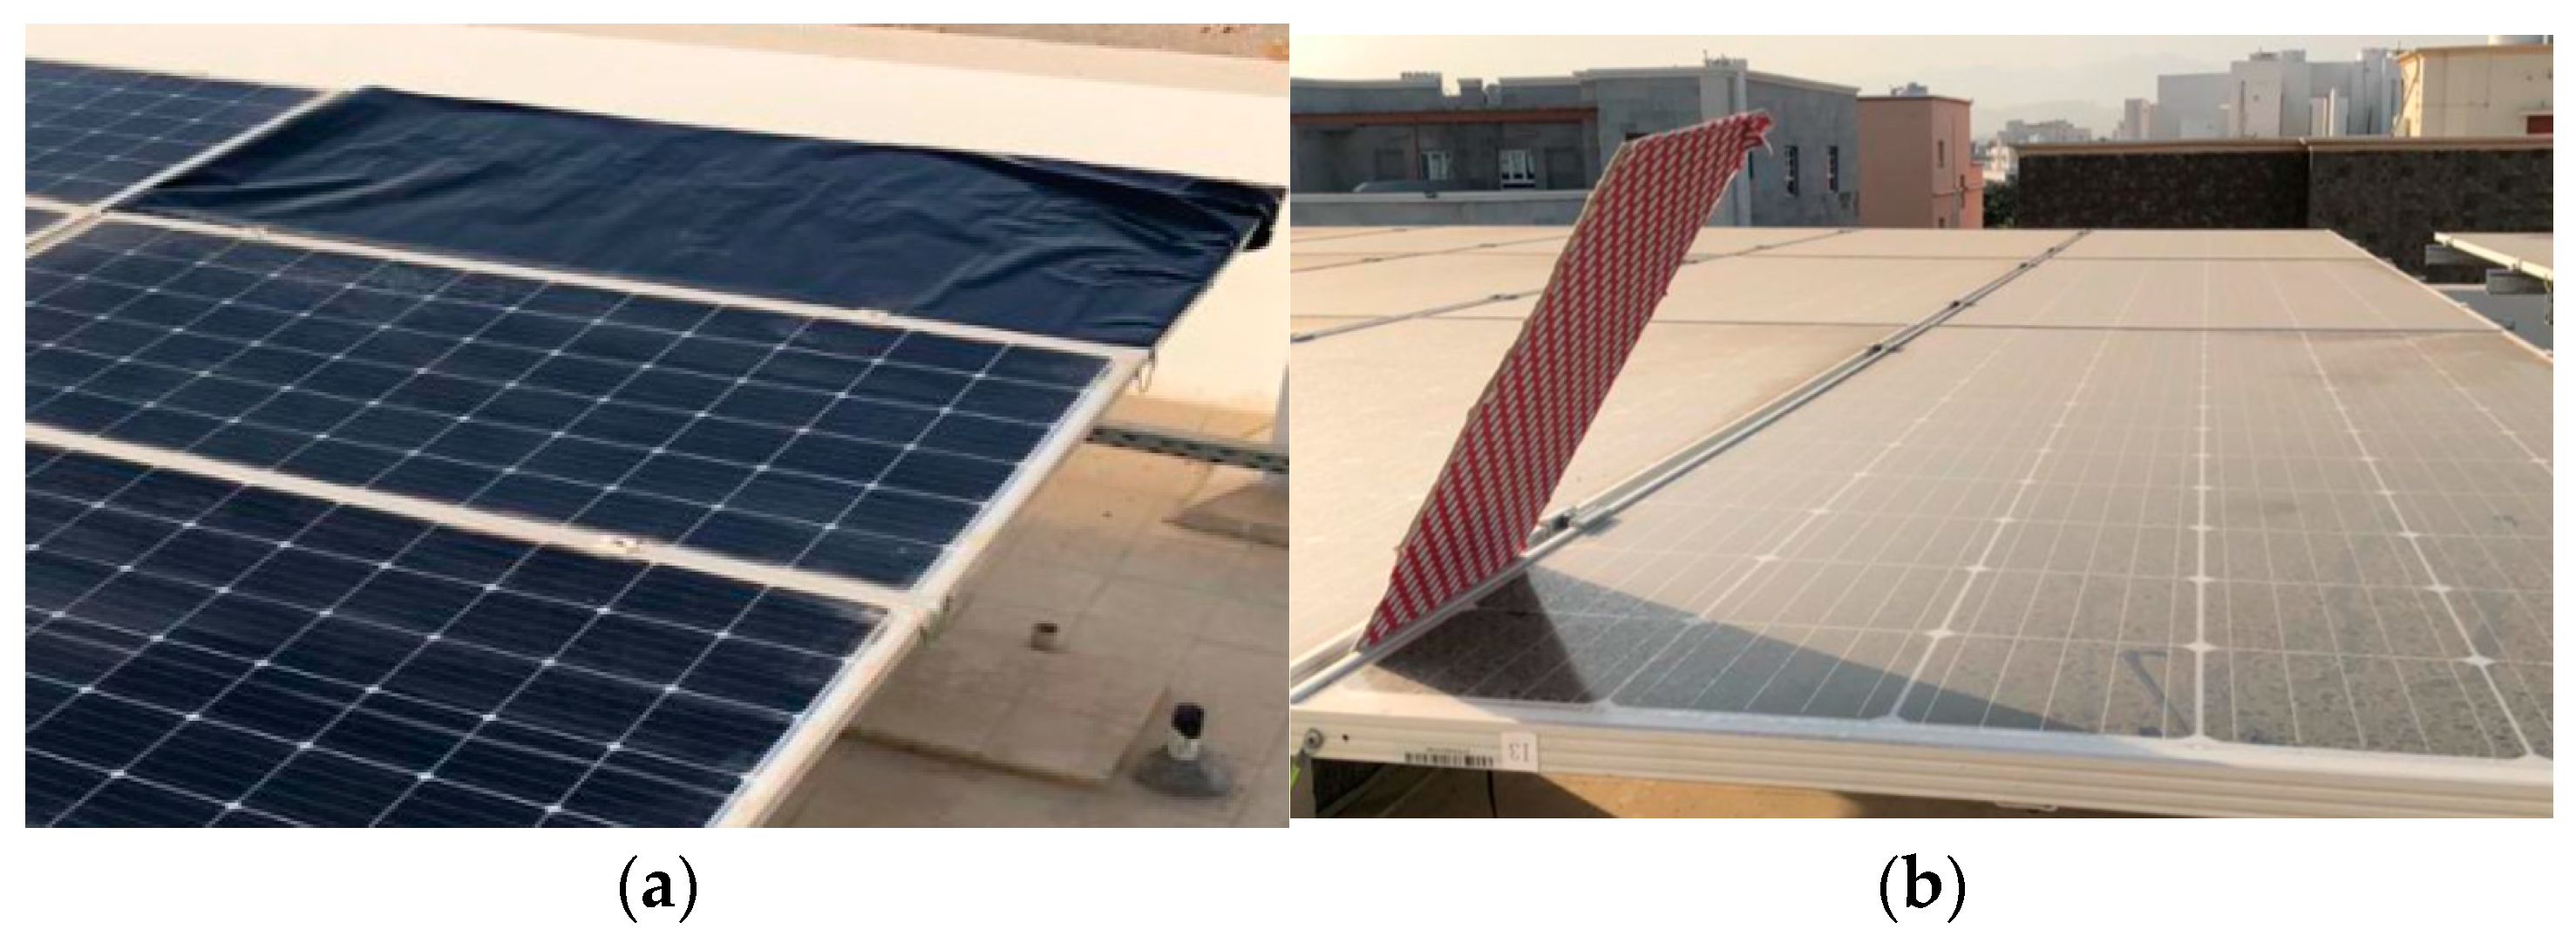
3.2. Experimental Procedure

A variety of shading scenarios were simulated to achieve the minimum shading possible in the PV arrays, from shading one PV cell to shading an entire PV panel. Two patterns of PSCs were simulated, namely object shading and cloud shading. Blinding material was used to emulate object shading (see Figure 5b), and tinting material was used to emulate cloud shading (see Figure 5a). During the simulations, the voltage of the PV array was measured every 0.25 s and recorded using the Fluke 435 Power Quality Meter. During the experiment, the sky was clear, the solar light intensity was 350–750 W/m2, and the ambient temperature was around 35 °C.

4. Simulation Cases and Discussion

The figures in this section depict the voltage waveform of the PV array in blue and the output of the proposed PSD method in red. The PSD signal output is either one (meaning a PSC has been detected) or zero (no PSC is present).

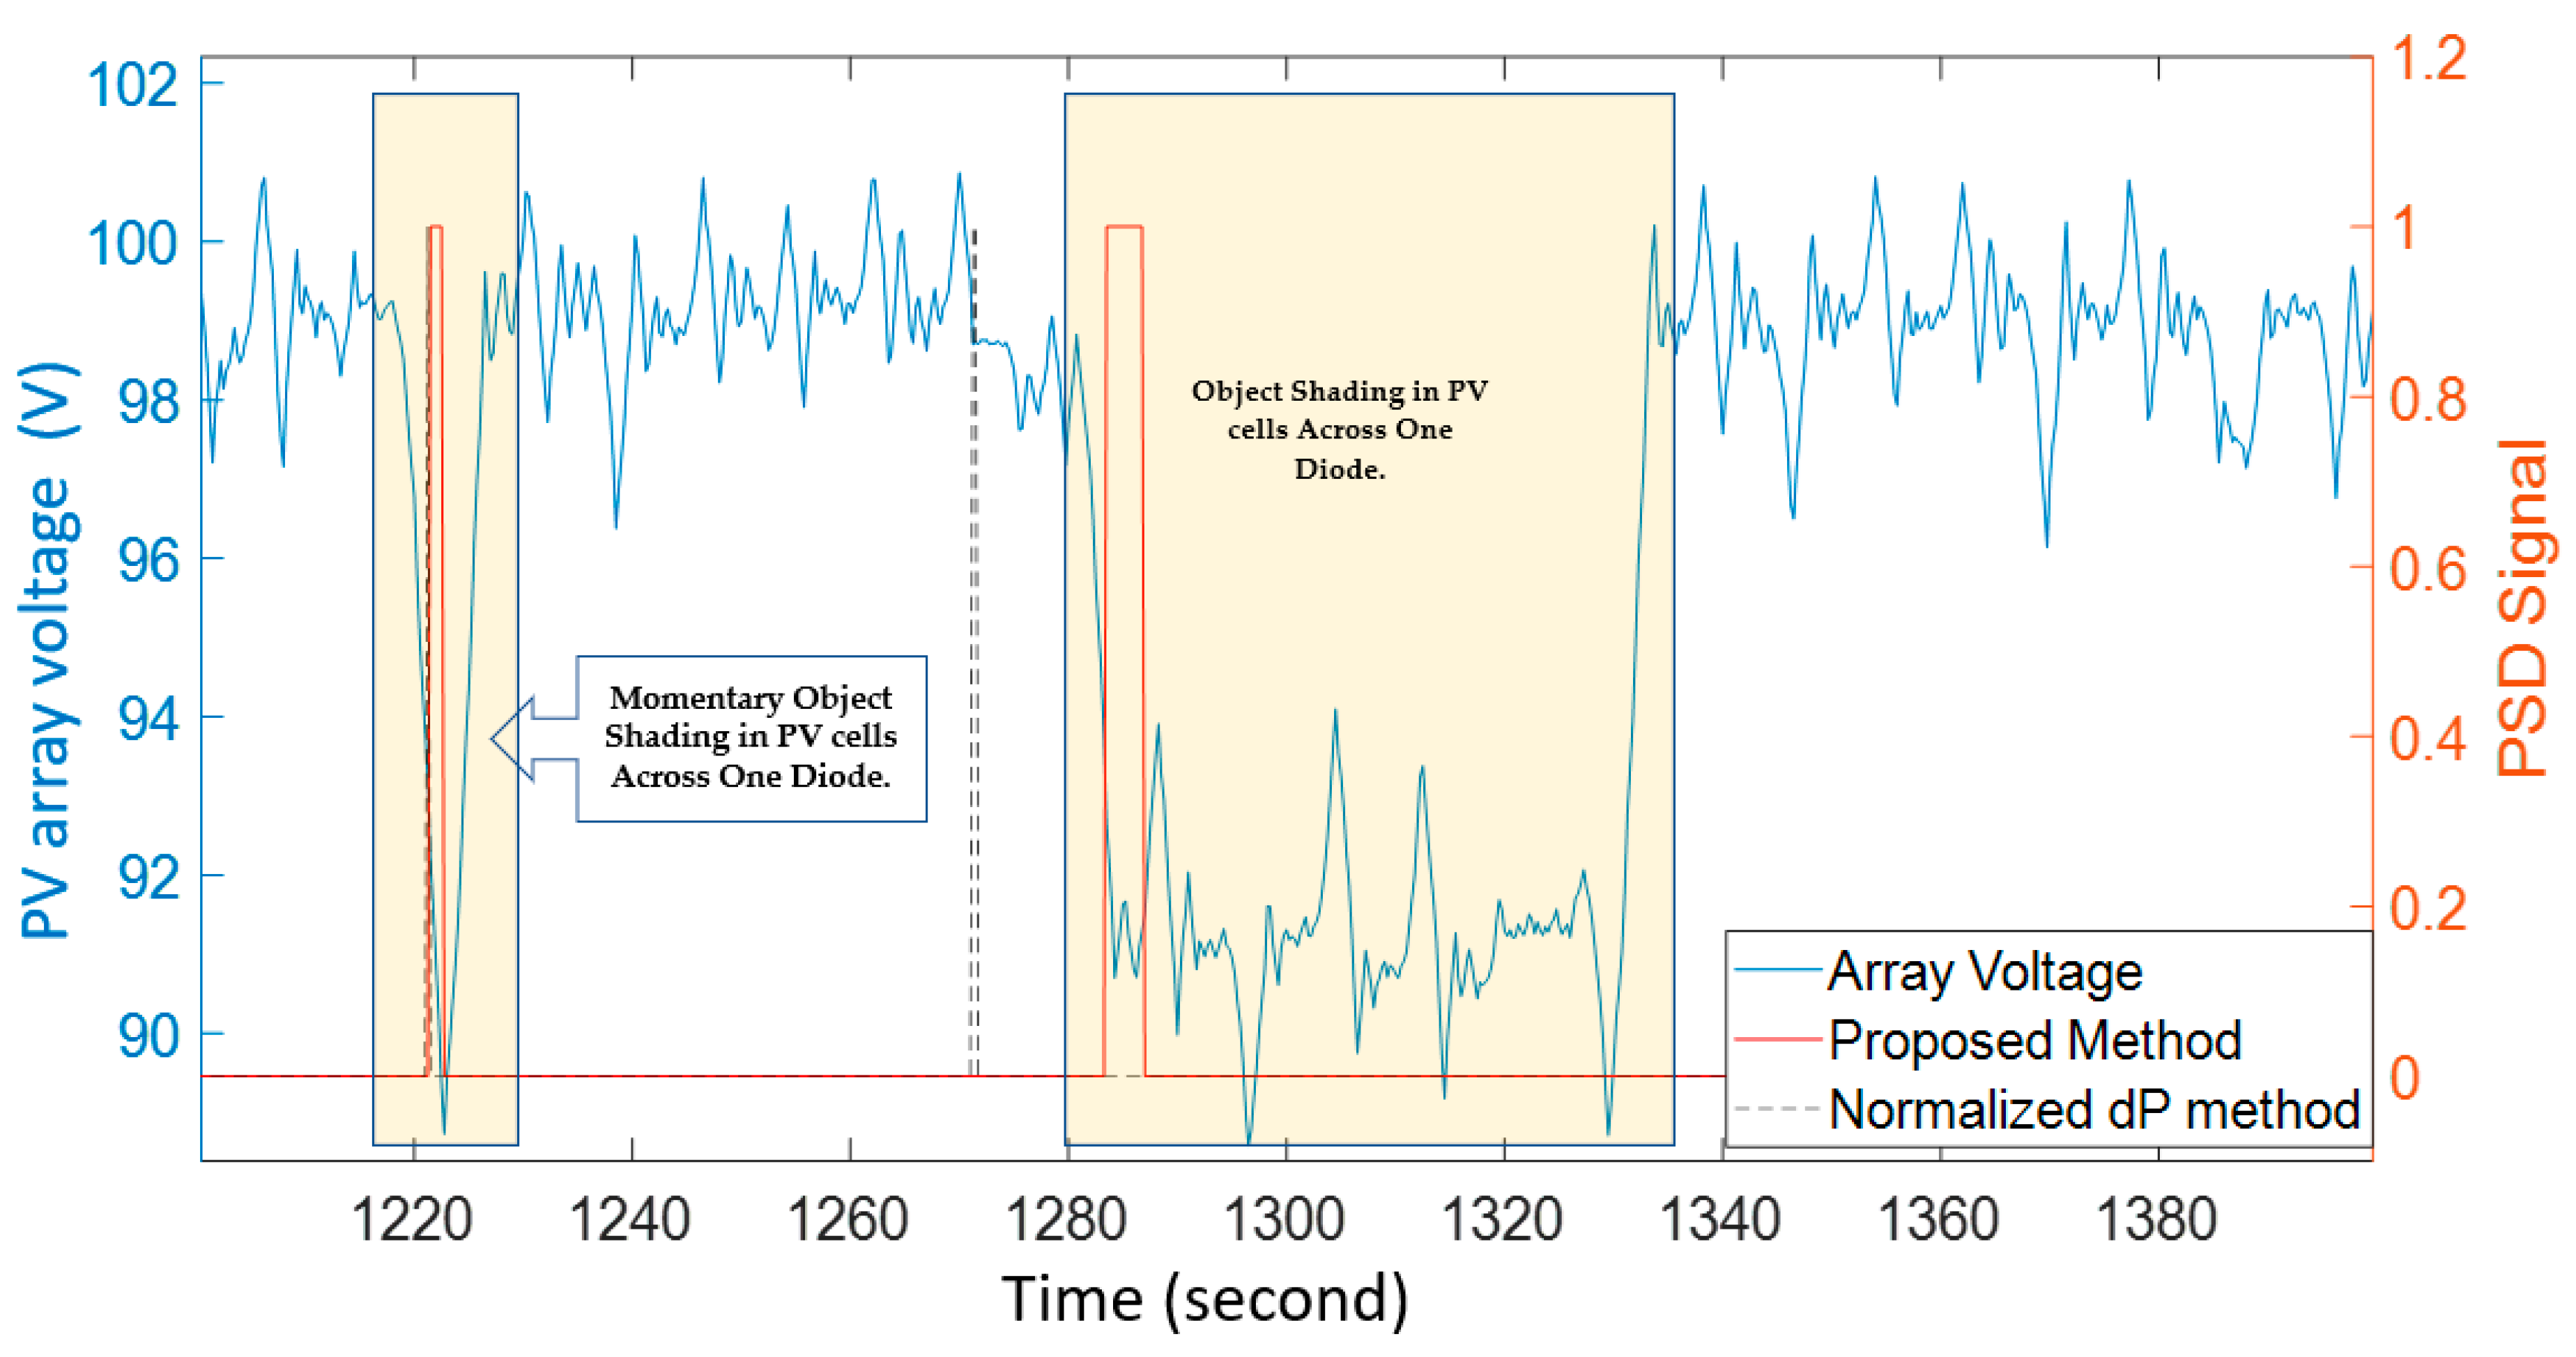
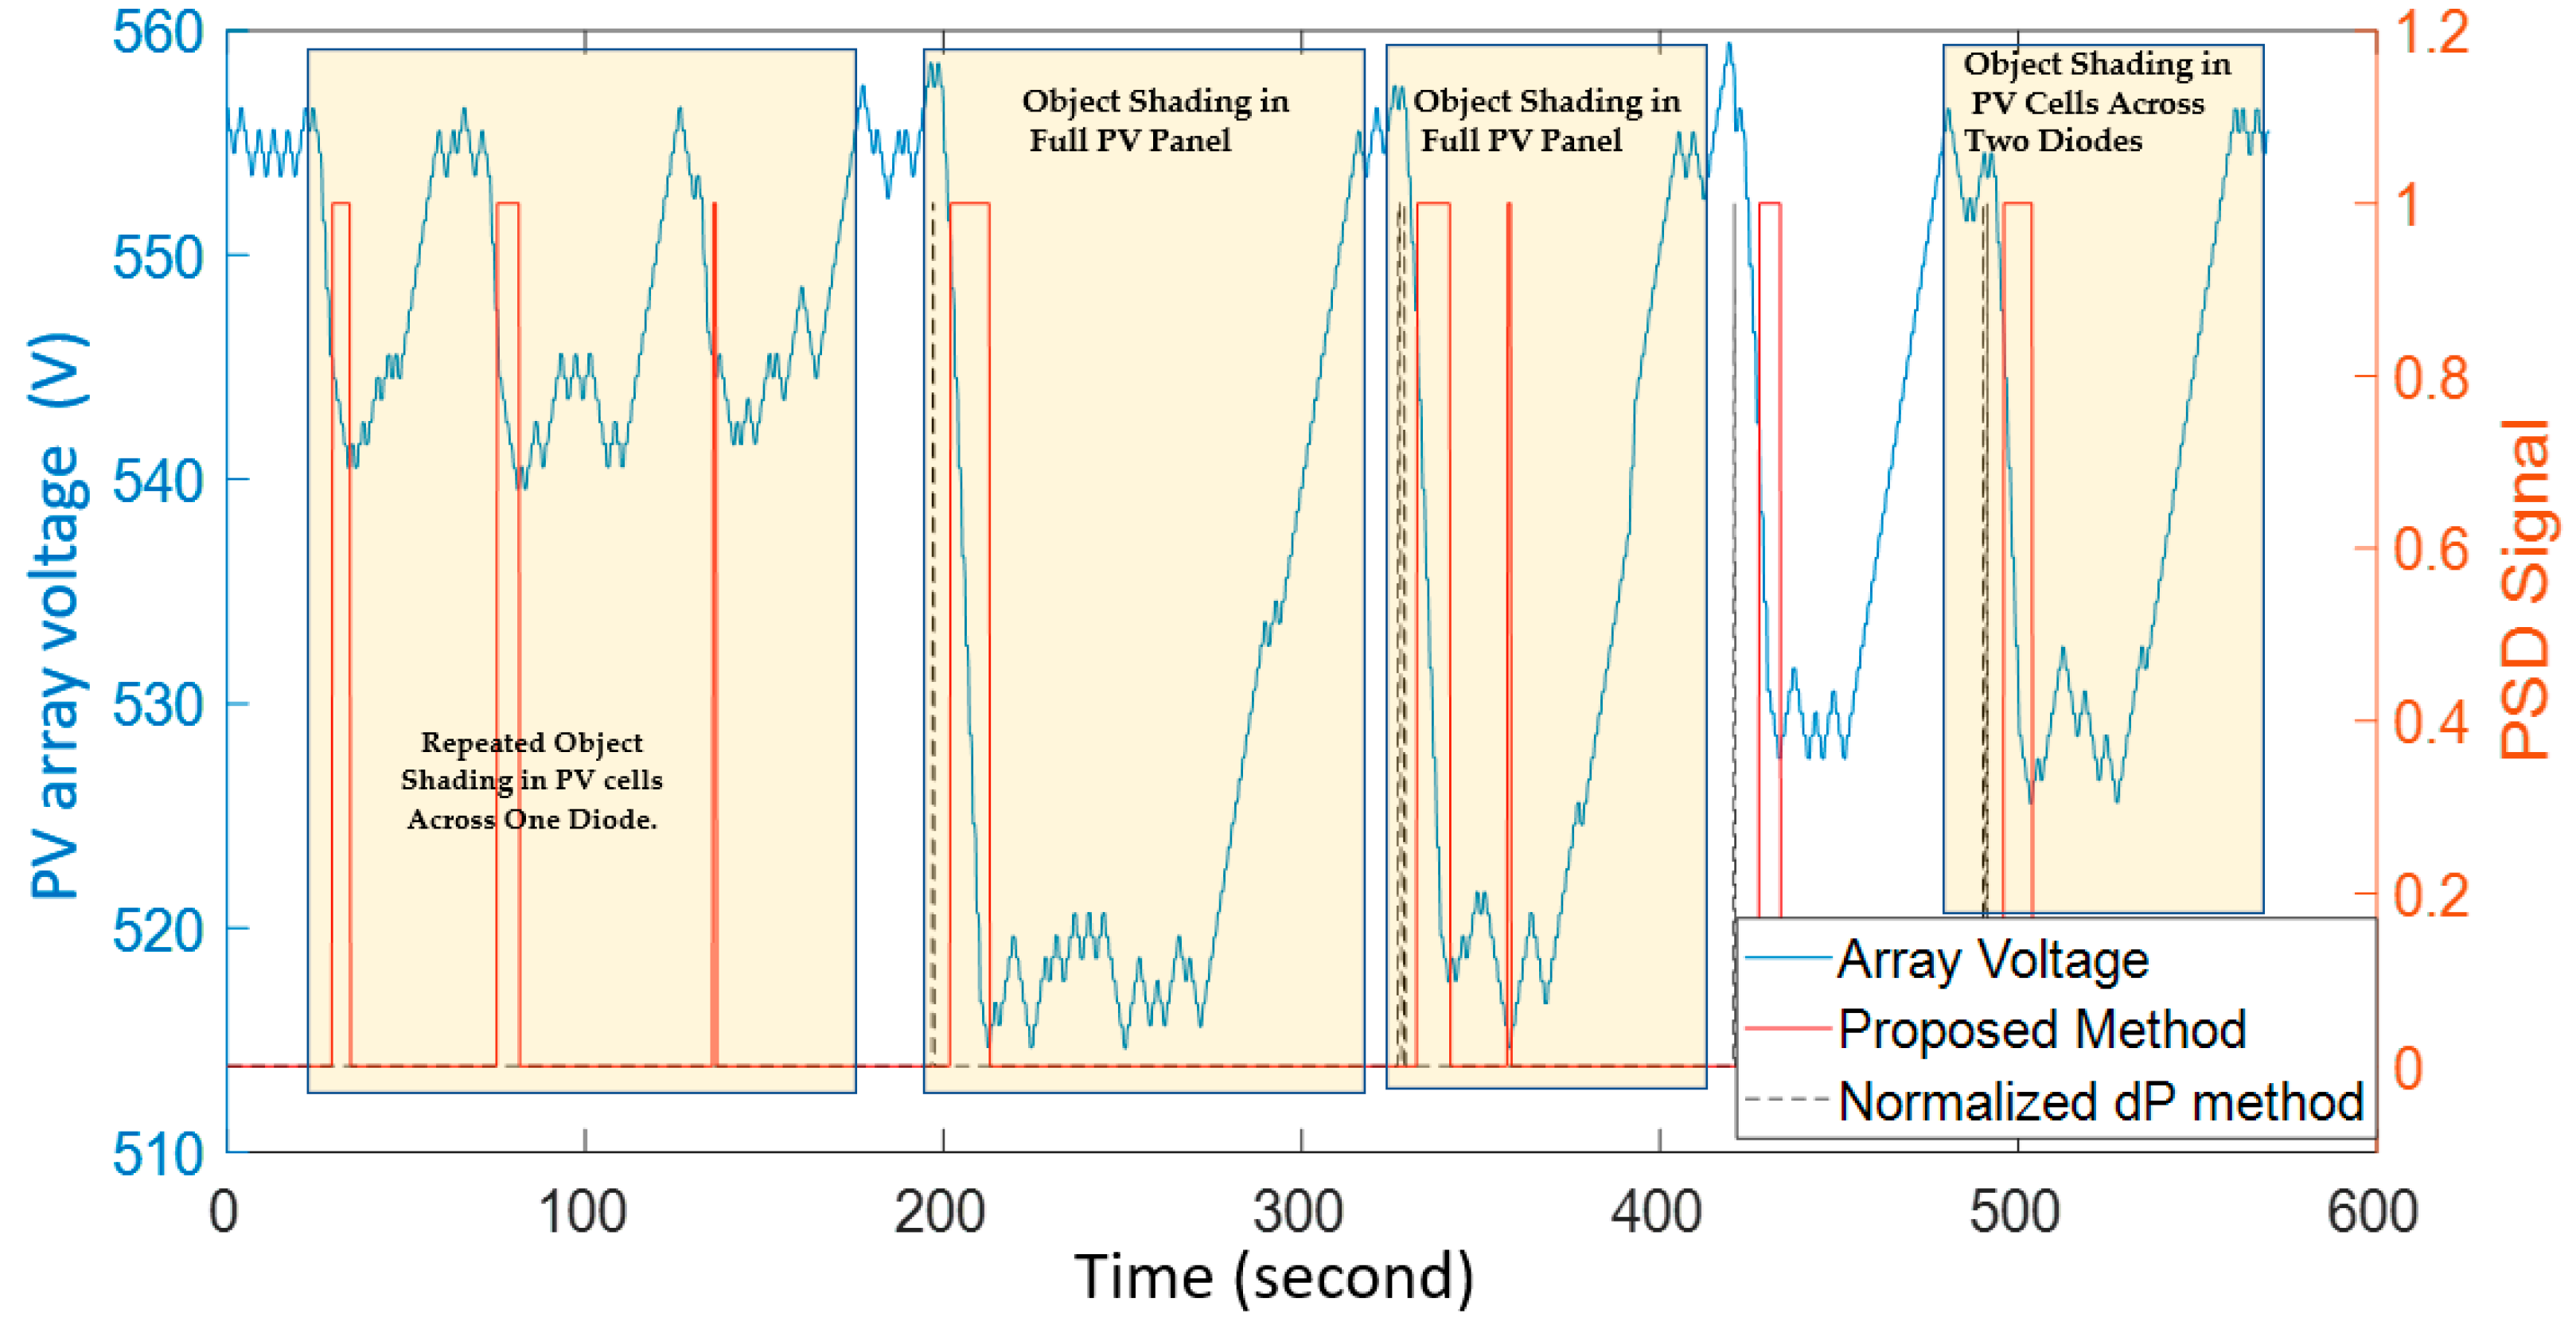
4.1. Case I: Object Shading

In this study case, both PV array configurations were subjected to object shading in order to observe the impact of this kind of shading on the voltage of the PV arrays. It is evident from Figure 5 and Figure 6 that this kind of shading had similar impacts on both PV arrays, with the voltage falling suddenly and dramatically.
For the purpose of testing the proposed method for detecting only object shading, the threshold value of the cloud shading was set very high, while the threshold value for object shading detection was set at 6 (this value was obtained by the method described in Section 3). Accordingly, the proposed method considered only negative changes in voltage and ignored the positive changes, as shown in Figure 6 and Figure 7.
To evaluate the effectiveness of the proposed PSC detection method, its performance was compared with that of the method in [40,44], which used the ratio of the normalized change in power. Figure 5 and Figure 6 demonstrate the performance of the two methods. The results revealed that the proposed method detected all simulated object shading patterns effectively and accurately in both PV array configurations. In contrast, the other method detected only the shading patterns that cause a high/sudden voltage drop. Moreover, because of the very small change in power, it cannot detect the shading patterns in which a slow drop in voltage occurs. In light of these results, it can be stated that the performance of the proposed method is better and more effective than that of the detection method based on the normalized change in power.

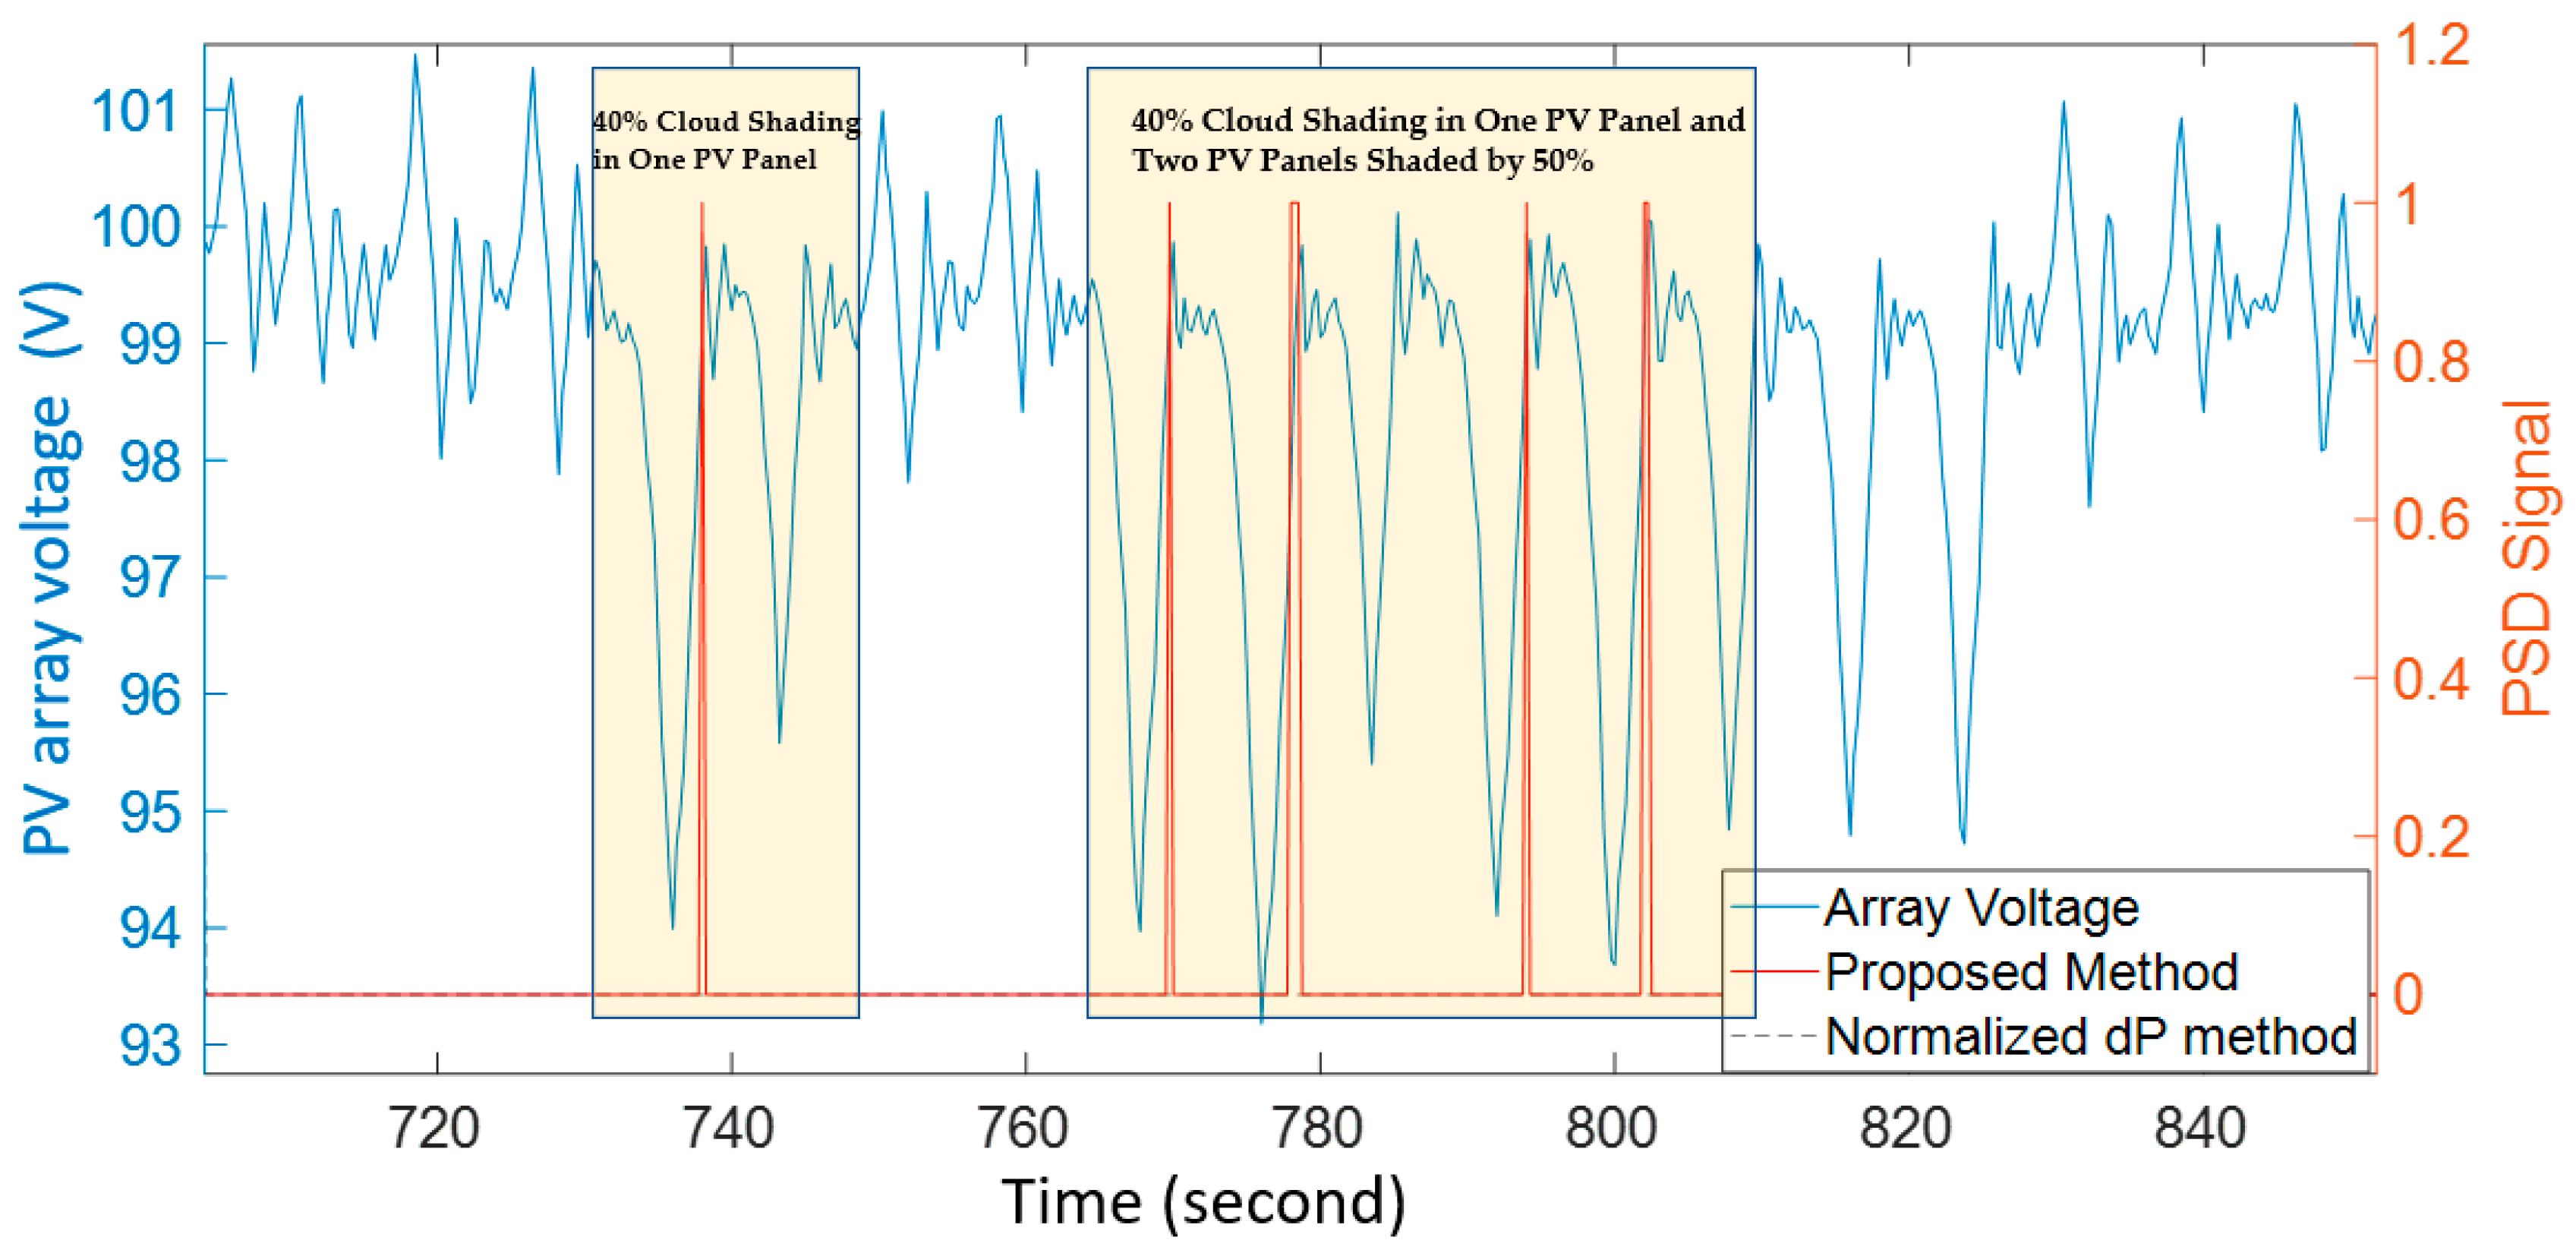
4.2. Case II: Cloud Shading

The simulation of this case exposed the PV arrays to different percentages of cloud shading. In Figure 7, it can be seen that multiple spikes of voltage occurred. This is due to the fact that, during the simulation, the branch that contained the shaded PV panel had an unstable voltage, which caused significant voltage fluctuations with noticeable spikes.
Figure 8 demonstrates that, unlike the series–parallel PV array, the series PV array showed an increase in voltage during the simulation. This is due to the shaded PV panels bottlenecking the entire array current during the shading period, thereby causing the array voltage to increase.
As part of the testing of the proposed method for identifying cloud shading, the threshold value for detecting cloud shading was set at 6, and the threshold value for detecting object shading was set at a very high value. Thus, in Figure 8 and Figure 9, it can be seen that the proposed method was looking only at positive changes in voltage while ignoring the negative changes.
The red line of the proposed PSD output signal, depicted in Figure 8 and Figure 9, shows that the method was successful in detecting this type of shading promptly and precisely in both PV array configurations. On the other hand, the detection method in [40,44] was not able to detect cloud shading in both PV array configurations for the same reason as mentioned in Section 4.1.

5. Conclusions

Photovoltaic (PV) systems produce less energy under partial shading conditions (PSCs). As a result, when such a condition occurs, conventional and advanced maximum power point tracking (MPPT) systems are unable to operate the PV system at its peak since the conduction of bypassing diodes causes the PV system to be trapped at a low power point. With the aid of global peak searching tools, a PV system can be operated at the global maximum power point (MPP). Using these tools, however, will often reduce the output of PV systems since they cause the system to work outside its power region in order to scan the I–V curve to determine the global MPP. Thus, global peak searching should be implemented only when there is a PSC event. In this paper, a simple and accurate method was presented for detecting PSCs by monitoring the sign of the voltage change. This method predicts the occurrence of a PSC when the sign of the successive voltage changes remains the same for a specified number of times. Several object and cloud shading patterns were emulated on-site on two types of PV array configurations (series and series–parallel) to test the effectiveness of the proposed method. According to the results, the proposed method accurately identified all emulated shading patterns. In addition, its performance was found to be superior to that of a detection method based on monitoring the normalized change in power. Finally, it can be said that utilizing the proposed method in conjunction with global peak searching tools will improve the PV system’s output under PSCs.

Author Contributions

Methodology, W.A.A.; Software, W.A.A.; Validation, R.A.A., H.Y. and A.A.-H.; Writing—original draft preparation, W.A.A.; Supervision, R.A.A.; Writing—review and editing, R.A.A., H.Y. and A.A.-H. All authors have read and agreed to the published version of the manuscript.

Funding

The resesrch was funded by Sustainable Energy Research Center (SERC) at Sultan Qaboos University (SQU) under grant number IG/DVC/SERC/18/01.

Institutional Review Board Statement

Not applicable.

Informed Consent Statement

Not applicable.

Data Availability Statement

Not applicable.

Acknowledgments

The authors acknowledge the financial support provided by Sustainable Energy Research Center (SERC) at Sultan Qaboos University (SQU) under grant number IG/DVC/SERC/18/01.

Conflicts of Interest

The authors declare no conflict of interest.

Abbreviations

The following abbreviations are used in this manuscript:
SSTDRSpread Spectrum Time Domain Reflectometry
PCAPrinciple component analysis
FLCFuzzy logic controllers
LDALinear discrimination analysis
P&OPerturb and observe
PVPhotovoltaic
MPPMaximum Power Point
MPPTMaximum Power Point Tracking
PSDPartial Shading Detection
PSI Partial Shading Index
GMPPGlobal Maximum Power Point
LPPLeftmost power peak
GLPPConductance at LPP
VMPPVoltage at MPP
IMPPCurrent at MPP
VOCVoltage at Open Circuit
ISCCurrent at Short Circuit
PMPPVoltage at Open Circuit
P i n Real Power

References

  1. da Luz, C.M.A.; Vicente, E.M.; Tofoli, F.L. Experimental evaluation of global maximum power point techniques under partial shading conditions. Sol. Energy 2020, 196, 49–73. [Google Scholar] [CrossRef]
  2. Bai, J.; Cao, Y.; Hao, Y.; Zhang, Z.; Liu, S.; Cao, F. Characteristic output of pv systems under partial shading or mismatch conditions. Sol. Energy 2015, 112, 41–54. [Google Scholar] [CrossRef]
  3. Lasheen, M.; Rahman, A.K.A.; Abdel-Salam, M.; Ookawara, S. Adaptive reference voltage-based mppt technique for pv applications. IET Renew. Power Gener. 2017, 11, 715–722. [Google Scholar] [CrossRef]
  4. Veerapen, S.; Huiqing, W.; Yang, D. Design of a novel mppt algorithm based on the two stage searching method for pv systems under partial shading. In Proceedings of the 2017 IEEE 3rd International Future Energy Electronics Conference and ECCE Asia (IFEEC 2017—ECCE Asia), Kaohsiung, China, 3–7 June 2017; pp. 1494–1498. [Google Scholar]
  5. Sher, H.A.; Rizvi, A.A.; Addoweesh, K.E.; Al-Haddad, K. A single-stage stand-alone photovoltaic energy system with high tracking efficiency. IEEE Trans. Sustain. Energy 2017, 8, 755–762. [Google Scholar] [CrossRef]
  6. Abdel-Salam, M.; El-Mohandes, M.; El-Ghazaly, M. An Efficient Tracking of MPP in PV Systems Using a Newly-Formulated P&O-MPPT Method Under Varying Irradiation Levels. J. Electr. Eng. Technol. 2019, 15, 501–513. [Google Scholar]
  7. Alik, R.; Jusoh, A. An enhanced P&O checking algorithm MPPT for high tracking efficiency of partially shaded PV module. Sol. Energy 2018, 163, 570–580. [Google Scholar]
  8. Al-Majidi, S.D.; Abbod, M.F.; Al-Raweshidy, H.S. A novel maximum power point tracking technique based on fuzzy logic for photovoltaic systems. Int. J. Hydrogen Energy 2018, 43, 14158–14171. [Google Scholar] [CrossRef]
  9. Manickam, C.; Raman, G.P.; Raman, G.R.; Ganesan, S.I.; Chilakapati, N. Fireworks Enriched P&O Algorithm for GMPPT and Detection of Partial Shading in PV Systems. IEEE Trans. Power Electron. 2017, 32, 4432–4443. [Google Scholar]
  10. Ghamrawi, A.; Gaubert, J.-P.; Mehdi, D. A new dual-mode maximum power point tracking algorithm based on the Perturb and Observe algorithm used on solar energy system. Sol. Energy 2018, 174, 508–514. [Google Scholar] [CrossRef]
  11. Kumar, R.; Khandelwal, S.; Upadhyay, P.; Pulipaka, S. Global maximum power point tracking using variable sampling time and p-v curve region shifting technique along with incremental conductance for partially shaded photovoltaic systems. Sol. Energy 2019, 189, 151–178. [Google Scholar] [CrossRef]
  12. Motahhir, S.; El Ghzizal, A.; Sebti, S.; Derouich, A. Modeling of photovoltaic system with modified incremental conductance algorithm for fast changes of irradiance. Int. J. Photoenergy 2018, 2018, 3286479. [Google Scholar] [CrossRef]
  13. Yatimi, H.; Ouberri, Y.; Aroudam, E. Enhancement of power production of an autonomous pv system based on robust mppt technique. Procedia Manuf. 2019, 32, 397–404. [Google Scholar] [CrossRef]
  14. Farajdadian, S.; Hosseini, S.M.H. Design of an optimal fuzzy controller to obtain maximum power in solar power generation system. Sol. Energy 2019, 182, 161–178. [Google Scholar] [CrossRef]
  15. Li, X.; Wang, Q.; Wen, H.; Xiao, W. Comprehensive studies on operational principles for maximum power point tracking in photovoltaic systems. IEEE Access 2019, 7, 121407–121420. [Google Scholar] [CrossRef]
  16. Yilmaz, U.; Kircay, A.; Borekci, S. Pv system fuzzy logic mppt method and pi control as a charge controller. Renew. Sustain. Energy Rev. 2018, 81, 994–1001. [Google Scholar] [CrossRef]
  17. Hamdi, H.; Ben Regaya, C.; Zaafouri, A. Real-time study of a photovoltaic system with boost converter using the pso-rbf neural network algorithms in a myrio controller. Sol. Energy 2019, 183, 1–16. [Google Scholar] [CrossRef]
  18. Issaadi, S.; Issaadi, W.; Khireddine, A. New intelligent control strategy by robust neural network algorithm for real time detection of an optimized maximum power tracking control in photovoltaic systems. Energy 2019, 187, 115881. [Google Scholar] [CrossRef]
  19. Kihal, A.; Krim, F.; Laib, A.; Talbi, B.; Afghoul, H. An improved mppt scheme employing adaptive integral derivative sliding mode control for photovoltaic systems under fast irradiation changes. ISA Trans. 2019, 87, 297–306. [Google Scholar] [CrossRef] [PubMed]
  20. Pahari, O.P.; Subudhi, B. Integral sliding mode-improved adaptive mppt control scheme for suppressing grid current harmonics for pv system. IET Renew. Power Gener. 2018, 12, 1904–1914. [Google Scholar] [CrossRef]
  21. Ishaque, K.; Salam, Z. A deterministic particle swarm optimization maximum power point tracker for photovoltaic system under partial shading condition. IEEE Trans. Ind. Electron. 2012, 60, 3195–3206. [Google Scholar] [CrossRef]
  22. Ishaque, K.; Salam, Z.; Amjad, M.; Mekhilef, S. An improved particle swarm optimization (pso)–based mppt for pv with reduced steady-state oscillation. IEEE Trans. Power Electron. 2012, 27, 3627–3638. [Google Scholar] [CrossRef]
  23. Sundareswaran, K.; Peddapati, S.; Palani, S. Mppt of pv systems under partial shaded conditions through a colony of flashing fireflies. IEEE Trans. Energy Convers. 2014, 29, 463–472. [Google Scholar]
  24. Sundareswaran, K.; Sankar, P.; Nayak, P.S.R.; Simon, S.P.; Palani, S. Enhanced energy output from a pv system under partial shaded conditions through artificial bee colony. IEEE Trans. Sustain. Energy 2014, 6, 198–209. [Google Scholar] [CrossRef]
  25. Lyden, S.; Haque, M.E. A simulated annealing global maximum power point tracking approach for pv modules under partial shading conditions. IEEE Trans. Power Electron. 2015, 31, 4171–4181. [Google Scholar] [CrossRef]
  26. Belhachat, F.; Larbes, C. A review of global maximum power point tracking techniques of photovoltaic system under partial shading conditions. Renew. Sustain. Energy Rev. 2018, 92, 513–553. [Google Scholar] [CrossRef]
  27. Liu, Y.-H.; Chen, J.-H.; Huang, J.-W. A review of maximum power point tracking techniques for use in partially shaded conditions. Renew. Sustain. Energy Rev. 2015, 41, 436–453. [Google Scholar] [CrossRef]
  28. van Dyk, E.E.; Gxasheka, A.R.; Meyer, E.L. Monitoring current–voltage characteristics and energy output of silicon photovoltaic modules. Renew. Energy 2005, 30, 399–411. [Google Scholar] [CrossRef]
  29. Campos, R.E.; Sakô, E.Y.; Moreira, H.S.; Silva, J.L.d.S.; Villalva, M.G. Experimental analysis of a developed i-v curve tracer under partially shading conditions. In Proceedings of the 2019 IEEE PES Innovative Smart Grid Technologies Conference—Latin America (ISGT Latin America), Gramado City, Brazil, 15–18 September 2019; pp. 1–5. [Google Scholar]
  30. Ahmad, R.; Murtaza, A.F.; Shami, U.T.; Spertino, F. An mppt technique for unshaded/shaded photovoltaic array based on transient evolution of series capacitor. Sol. Energy 2017, 157, 377–389. [Google Scholar] [CrossRef]
  31. Mahmoud, M.M. Transient analysis of a pv power generator charging a capacitor for measurement of the i–v characteristics. Renew. Energy 2006, 31, 2198–2206. [Google Scholar] [CrossRef]
  32. Spertino, F.; Ahmad, J.; Ciocia, A.; Di Leo, P.; Murtaza, A.F.; Chiaberge, M. Capacitor charging method for i–v curve tracer and mppt in photovoltaic systems. Sol. Energy 2015, 119, 461–473. [Google Scholar] [CrossRef] [Green Version]
  33. Sundareswaran, K.; Vigneshkumar, V.; Sankar, P.; Simon, S.P.; Nayak, P.S.R.; Palani, S. Development of an improved p&o algorithm assisted through a colony of foraging ants for mppt in pv system. IEEE Trans. Ind. Inform. 2015, 12, 187–200. [Google Scholar]
  34. Tajuddin, M.F.N.; Ayob, S.M.; Salam, Z.; Saad, M.S. Evolutionary based maximum power point tracking technique using differential evolution algorithm. Energy Build. 2013, 67, 245–252. [Google Scholar] [CrossRef]
  35. Ahmed, J.; Salam, Z. A maximum power point tracking (mppt) for pv system using cuckoo search with partial shading capability. Appl. Energy 2014, 119, 118–130. [Google Scholar] [CrossRef]
  36. Zhou, L.; Chen, Y.; Guo, K.; Jia, F. New approach for mppt control of photovoltaic system with mutative-scale dual-carrier chaotic search. IEEE Trans. Power Electron. 2010, 26, 1038–1048. [Google Scholar] [CrossRef]
  37. Kumar, N.; Hussain, I.; Singh, B.; Panigrahi, B.K. Rapid mppt for uniformly and partial shaded pv system by using jayade algorithm in highly fluctuating atmospheric conditions. IEEE Trans. Ind. Inform. 2017, 13, 2406–2416. [Google Scholar] [CrossRef]
  38. Ghasemi, M.A.; Foroushani, H.M.; Parniani, M. Partial shading detection and smooth maximum power point tracking of pv arrays under psc. IEEE Trans. Power Electron. 2015, 31, 6281–6292. [Google Scholar] [CrossRef] [Green Version]
  39. Pillai, D.S.; Ram, J.P.; Ghias, A.M.Y.M.; Mahmud, M.A.; Rajasekar, N. An accurate, shade detection-based hybrid maximum power point tracking approach for pv systems. IEEE Trans. Power Electron. 2020, 35, 6594–6608. [Google Scholar] [CrossRef]
  40. Wang, Y.; Li, Y.; Ruan, X. High-accuracy and fast-speed mppt methods for pv string under partially shaded conditions. IEEE Trans. Ind. Electron. 2015, 63, 235–245. [Google Scholar] [CrossRef]
  41. Rizzo, S.A.; Scelba, G. Ann based mppt method for rapidly variable shading conditions. Appl. Energy 2015, 145, 124–132. [Google Scholar] [CrossRef]
  42. Ramyar, A.; Iman-Eini, H.; Farhangi, S. Global maximum power point tracking method for photovoltaic arrays under partial shading conditions. IEEE Trans. Ind. Electron. 2016, 64, 2855–2864. [Google Scholar] [CrossRef]
  43. Kim, R.-Y.; Kim, J.-H. An improved global maximum power point tracking scheme under partial shading conditions. J. Int. Conf. Electr. Mach. Syst. 2013, 2, 65–68. [Google Scholar] [CrossRef] [Green Version]
  44. Wellawatta, T.R.; Choi, S.J. Adaptive partial shading determinant algorithm for solar array systems. J. Power Electron. 2019, 19, 1566–1574. [Google Scholar]
  45. Al-Ramaden, A.; Smadi, I.A. Partial shading detection and global mppt algorithm for pv system. In Proceedings of the 2019 IEEE Jordan International Joint Conference on Electrical Engineering and Information Technology, JEEIT 2019—Proceedings, Amman, Jordan, 9–11 April 2019; pp. 135–140. [Google Scholar]
  46. Ahmed, J.; Salam, Z. An accurate method for mppt to detect the partial shading occurrence in a pv system. IEEE Trans. Ind. Inform. 2017, 13, 2151–2161. [Google Scholar] [CrossRef]
  47. Chandrasekaran, K.; Sankar, S.; Banumalar, K. Partial shading detection for pv arrays in a maximum power tracking system using the sine-cosine algorithm. Energy Sustain. Dev. 2020, 55, 105–121. [Google Scholar] [CrossRef]
  48. Gosumbonggot, J.; Fujita, G. Partial shading detection and global maximum power point tracking algorithm for photovoltaic with the variation of irradiation and temperature. Energies 2019, 12, 202. [Google Scholar] [CrossRef] [Green Version]
  49. Fadhel, S.; Diallo, D.; Delpha, C.; Migan, A.; Bahri, I.; Trabelsi, M.; Mimouni, M.F. Maximum power point analysis for partial shading detection and identification in photovoltaic systems. Energy Convers. Manag. 2020, 224, 113374. [Google Scholar] [CrossRef]
  50. Zbeeb, A.; Devabhaktuni, V.; Sebak, A. Improved photovoltaic mppt algorithm adapted for unstable atmospheric conditions and partial shading. In Proceedings of the 2009 International Conference on Clean Electrical Power, Capri, Italy, 9–11 June 2009; pp. 320–323. [Google Scholar]
  51. Ma, J.; Bi, Z.; Man, K.L.; Yue, Y.; Smith, J.S. Automatic shading detection system for photovoltaic strings. In Proceedings of the International SoC Design Conference 2018, ISOCC 2018, Daegu, Korea, 12–15 November 2018; pp. 176–177. [Google Scholar]
Figure 1. Block diagram for the proposed shading detection system mentioned in [51].
Energies 14 04938 g001
Figure 2. The current-voltage (I–V) characteristics of a typical PV panel/array operating under normal conditions.
Energies 14 04938 g002
Figure 3. The flowchart of the proposed method.
Energies 14 04938 g003
Figure 4. Experimental set-up of (a) a series PV array and (b) a series–parallel PV array.
Energies 14 04938 g004
Figure 5. Example for simulation of (a) cloud shading by using a window tinting film. (b) Object shading simulation by using a carton sheet.
Energies 14 04938 g005
Figure 6. Series–parallel PV array voltage waveforms and PSD signals during the object shading simulation.
Energies 14 04938 g006
Figure 7. Series PV array voltage waveforms and PSD signals during the object shading simulation.
Energies 14 04938 g007
Figure 8. Series–parallel PV array voltage waveforms and PSD signals during the cloud shading simulation.
Energies 14 04938 g008
Figure 9. Series PV array voltage waveforms and PSD signals during the cloud shading simulation.
Energies 14 04938 g009
Table 1. System parameters.
ParameterSeries ArraySeries–Parallel Array
ManufacturerZNShine SolarBenQ Solar
ModuleZXH6-LD72PM096B00
VMPP38.4 V54.7 V
IMPP8.91 A6.09 A
PMPP345 W333 W
VOC46.9 V64.9 V
ISC9.42 A6.58 A
Number of PV Cells7296
Bypassing Diodes33
Publisher’s Note: MDPI stays neutral with regard to jurisdictional claims in published maps and institutional affiliations.

