1. Introduction
Progress in computer systems related to the growth of their performance, development, and a wide application of software technologies in the world, as well as the improvement of differential-type turbulence models and vortex-resolving methods drastically changed the state and scope of engineering methods for the calculation of turbulent flows in comparison to the known approaches—for example, monographs [
1,
2,
3]. The present article focuses on one of the most popular closure models of the Reynolds-averaged Navier–Stokes (RANS) equations—the Menter shear stress transport model (SST model) [
4]. This model with two differential equations is one of numerous semi-empirical models presented in reference [
5].
Constructing such models is associated with introducing semi-empirical constants into the equations. These constants are scaled with typical simple turbulent flows, including boundary and shear layers, as well as jets. Work [
6] contained a set of experimental test benches for the determination of the semi-empirical constants of one of the most successful turbulence models—the dissipative two-parameter high-Reynolds number Launder–Spalding
model [
7]. Improvements the standard SST model were carried out in works [
8,
9,
10,
11].
The present article pays attention to the actual fundamental and practical problems of how to model separated turbulent flows. As known, conventional turbulence models are constructed for fully developed turbulent flows. However separated flows combine different-scale mixing shear layers and zones of low-velocity backflows that cannot always be considered as fully developed turbulent flows. In these flows, stagnation (deceleration) zones can also appear at the places where near-wall flows are separated: with the regions of laminar flow and laminar-turbulent transition. It is obvious that the standard low-Reynolds number turbulence models constructed to show accelerating and decelerating channel flows with pressure gradients are not quite suitable to calculate complex flows. Moreover, 3D separated flows are characteristic of flow zones with intense swirling flows, as well as with localized vortex regions where the flow velocity is very moderate. It is also known that near-wall flows of the boundary layer type and free jets are characterized by different-value turbulent constants [
1]. Thus, it is quite justified that the standard turbulence models constructed for typical flows are not always suitable for displaying complex vortex structures characteristic of 3D separated flows. They require corrections—in particular, those taking into account the streamline curvature influence. Therefore, for the Launder–Spalding
model [
7] applied to two-dimensional twin parallel and concentric outflowing jets, Rodi and Leschziner [
12,
13] proposed the correction function:
that was multiplied by the semi-empirical constant
when determining the vortex viscosity coefficient. The additional constant
was determined analytically, and
was the turbulent Richardson number. It should be emphasized that the product (
) was within the range of 0.02–0.15. In works [
14,
15,
16,
17,
18,
19,
20,
21,
22], some results of the influence of curvature and rotation on the modeling of the vortex and separated flows were presented.
The Rodi–Leschziner approach to correcting the Launder–Spalding
model was used to solve a number of tasks [
23,
24,
25,
26,
27,
28] using physical analogs, but the additional constant
had to be decreased to 0.1. External sub- and transonic separated flows around both a classical-shape circular cylinder and a sphere and tandems: two co-axial different-sized discs, a disc and a cylinder, and a stepped cylinder, as well as a Volkswagen car profile near a movable shield, were considered. It was shown that the numerical predictions of the integral and local force loads agreed well with the available experimental data.
F. Menter in his works published in the years 1993 and 2003 [
29,
30] proposed two SST models differing mainly in the vortex viscosity coefficient. The Menter 1993 SST model uses the vorticity modulus
and the advanced model—the strain rate tensor modulus
. It should be noted that the modified Menter 2003 SST model approaches all similar differential turbulence models containing the modulus
[
7].
The Menter 1993 SST model was tested in detail in references [
31,
32,
33,
34,
35,
36,
37,
38,
39,
40,
41,
42,
43,
44,
45], dealing with the calculations of 2D and 3D separated incompressible liquid and compressed gas flows. It was successfully tested for modeling turbulent recirculating flow in a square cavity with a movable cover (in comparison to other semi-empirical models) [
31], a separated flow in a circular cavity on the walls of plane-parallel [
32] and divergent [
33] channels (S.V. Guvernyuk’s experiments, Research Institute of Mechanics, Moscow State University), a flow around a trench on a plane [
46,
47] (the experiments of A.I. Leontiev et al., N.E. Bauman Moscow State Technical University), discrete roughness elements in pipes [
36] (G.A. Dreitser’s experiments, Moscow Aviation Institute), separated flow and heat transfer in a tube bundle [
48] (A. Zhukauskas’ experiments), in the vicinity of spherical [
38,
49] and oval [
50] dimples on a plate (the experiments of S.Z. Sapozhnikov et al., St. Petersburg Polytechnic University, as well as of G.I. Kiknadze et al.), convective heat transfer in the plane-parallel and divergent channels with a set of spherical [
51] and conical [
42] dimples placed on a wall (the experiments of Chyu et al., as well as of Banker et al.), and a supersonic axisymmetric flow around a tear-shaped body with a conical tapered flare [
43] (A.N. Mikhalev’s experiments, A.F. Ioffe Physical-Technical Institute). The numerical study of unsteady turbulent flows around a circular cylinder under sub- and supercritical conditions in references [
44,
45] contained comparable available experimental data and numerical predictions obtained with the use of different software and turbulent models. The methodical tasks of how to develop the multiblock computational technique [
52] for a solution of the Reynolds equations and their correct uses for the numerical simulations of the flow and heat transfer of bodies were discussed.
It should be mentioned that, when separated flows are calculated, the SST model with the vorticity modulus does not require vortex viscosity correction, like the
model. As mentioned in reference [
53], constant vorticity cores appear in separated flow zones at high Reynolds numbers. These cores hinder the process of pumping vortex viscosity into them. At the same time, when the standard two-parameter dissipative model [
23] is used, regions of abnormal high vortex viscosity are formed in the large-scale cores. To eliminate these regions, streamline curvature corrections must be introduced. The realization and testing of the modified Menter 2003 model [
30] again raised the problem of the correct resolution of separated flows, since, in the modern semi-empirical turbulence models with the strain rate tensor modulus, false turbulence generation occurs in large-scale vortex cores. The additional constant
associated with correcting the vortex viscosity in the shear stress transport model was redefined and taken as equal to 0.02. The scope of application of the Menter 2003 SST model was significantly expanded in the calculations of the trans-, super-, and hypersonic separated flows, as well as of the 3D jet-vortex structures. The approach to correcting the Menter 2003 SST model with consideration of the streamline curvature influence on the vortex viscosity coefficient was generalized by S.A. Isaev and was called the Rodi–Leschziner–Isaev approach (RLI) [
54].
In general, the modified standard semi-empirical turbulence models allowing for the flow swirling and streamline curvature influence on turbulence characteristics are widely encountered in engineering practice. For example, Shur and Spalart [
55,
56] introduced the correction of the Spalart–Allmaras vortex viscosity with the consideration of the flow swirling in a one-parameter model. A similar approach was used by Smirnov and Menter (SM) [
57] to modify the Menter 2003 SST model [
4]. It is important to emphasize that, in this case, such an integral characteristic as the vortex viscosity does not undergo correction but only one of the constants in the equation for the specific dissipation rate.
Systematic comparisons of the predictions by means of two standard SST models and the modified Menter 2003 model [
30] started with the use of the RLI and SM approaches that are in progress in this study.
Approving and testing the RLI approach when comparing the numerical predictions obtained by different semi-empirical models and software with the experimental data were made to solve the traditional tasks of recirculating the flows, as well as of the flow and heat transfer control due to forming intense large-scale vortex structures [
58,
59,
60,
61,
62,
63,
64,
65,
66,
67,
68,
69,
70,
71,
72,
73,
74,
75,
76,
77]. The first group of tasks included recirculating flows in a square cavity with a movable cover [
53] in a round cavity on the wall of the plane-parallel [
53,
58] and U-shaped [
59,
60,
78] channels for the periodic flow around the airfoil NACA0012 when the angle of attack was varied from 0° to 180° [
61]. The predictions of the local and integral flow characteristics are in a good agreement with the experimental data of S.V. Guvernyuk [
61] (Research Institute of Mechanics, Moscow State University) and Ian Castro [
77] (University of Southampton).
The second group of tasks is characterized by interesting aerodynamic and thermophysical effects.
Recirculating flows in round vortex cells located on the plane-parallel channel wall [
79] or on the backside of the 20%-thick airfoil MQ [
62] are enhanced due to distributed suction (over the central body surface) and concentrated (slot) suction. In these cells, a maximum backflow velocity achieves a characteristic incoming flow velocity. It has been shown that vortex cells allow the carrying surface characteristics to be significantly increased at the Mach numbers from 0 to 0.55. A good agreement of the predicted and experimental profiles was obtained in a vortex cell on a channel wall over a wide range of the sucked air consumption coefficients [
79] (S.V. Guvernyuk’s experiment, Research Institute of Mechanics, Moscow State University).
For the thin disc–cylinder tandem at the sub- and supersonic air incoming flow velocities, when the rational sizes of the disc and the gap between it and the cylinder end have been chosen, it is possible to reach the close-to-zero drag of the tandem layout of the body at low subsonic velocities and to significantly reduce the drag at supersonic flight speeds. The numerical predictions of the integral and local loads on the bodies in axisymmetric flow agree quite fairly with the results of the aeroballistic experiments [
64,
65] (A.N. Mikhalev, A.F., Ioffe Physical-Technical Institute) and the tube tests [
80,
81,
82] (V.N. Konovalov, Aerospace Academy named after A.F. Mozhaiky) and A. Roshko [
83] (CalTech).
The comparison of the predictions and experiments of V.I. Zapryagaev (S.A. Khristianovich Institute of Theoretical and Applied Mathematics SB RAS) revealed a fair agreement of the characteristics of a supersonic jet flowing into a submerged space [
84].
The cycle of numerical and physical studies is concerned with the task of a subsonic periodic flow around a semi-circular cylinder at
[
69,
70]. It appeared that the ultra-low coefficients of the lift force
of the order of −1 [
85] (it was established by Z.P. Sluchanovskaya, Research Institute of Mechanics, Moscow State University) were seen for such a body at the angles of attack close to zero. This effect was explained by the numerical predictions. A detailed numerical study was made using different software, semi-empirical models, and numerous grid structures. A physical experiment was also done to assess the influence of side washers on the integral characteristics, since these washers allow us to reach the quasi-two-dimensional regime of flow around a body [
32,
33] (S.V. Guvernyuk’s experiment, Research Institute of Mechanics, Moscow State University). It appeared that the standard near-wall SST models in the all considered packages (VP2/3 and Sigma-flow) predicted the significantly underestimated (up to 30%) power loads on a semi-circular cylinder, although the Menter 1993 SST model, unlike the Menter 2003 SST model, yielded somewhat better results, since it reproduced the separated and vortex flows with less errors. The streamline curvature corrections led to a significant decrease of the vortex viscosity level in the cores of the vortices and vortex flow intensification and contributed to a better agreement between the numerical predictions and experimental data. The RLI approach turns out to be preferred over the SM approach. A better agreement of the predictions obtained by the Menter 2003 SST model corrected according to the RLI approach with the use of different software and grids (multiblock and composite) was demonstrated.
A good agreement of the results of the numerical and physical modeling of convective heat transfer in a narrow channel with single spherical dimples of moderate [
86] and average [
87] depths (V.I. Terekhov’s experiment, S.S. Kutateladze Institute of Thermophysics SB RAS) and in a channel with an in-line spherical dimple bundle [
42] (M.A. Gotovsky’s experiment, I. Polzunov Central Boiler and Turbine Institute) should also be mentioned. A recent publication [
74] was concerned with the abnormal enhancement of a separated flow and heat transfer in an inclined oval-trench dimple in a stabilized area of the narrow channel with the use of different methods. A general quantitative agreement was found, and the disagreement of the zonal models was explained by the different turbulence models (
Realizable, SA, and SST with the Durbin and Rodi–Leschziner–Isaev corrections) and by the applied software (StarCCM+ and VP2/3). Attention was paid to the low-pressure zone on the entrance spherical portion of a dimple with a dimensioned by double-hydraulic head pressure of −0.35. The negative relative friction in this zone attained a value of
−4.5, and the relative heat transfer
exceeded 5.
A good enough agreement of the predictions and experiments on the static pressure distribution was obtained by analyzing the 3D flow around models of high-rise buildings [
75] (S.V. Guvernyuk’s experiment, Research Institute of Mechanics, Moscow State University).
The present study continues the cycle of calculations [
53] of separated flows and heat transfers in the vicinity of a conical dimple with an inclination angle of
and a depth of 0.233 (in the spot diameter fractions) on the narrow channel wall—the computer analog of V.I. Terekhov’s setup [
86] with the use of different SST turbulence models (S.S. Kutateladze Institute of Thermophysics SB RAS).
2. Problem Statement
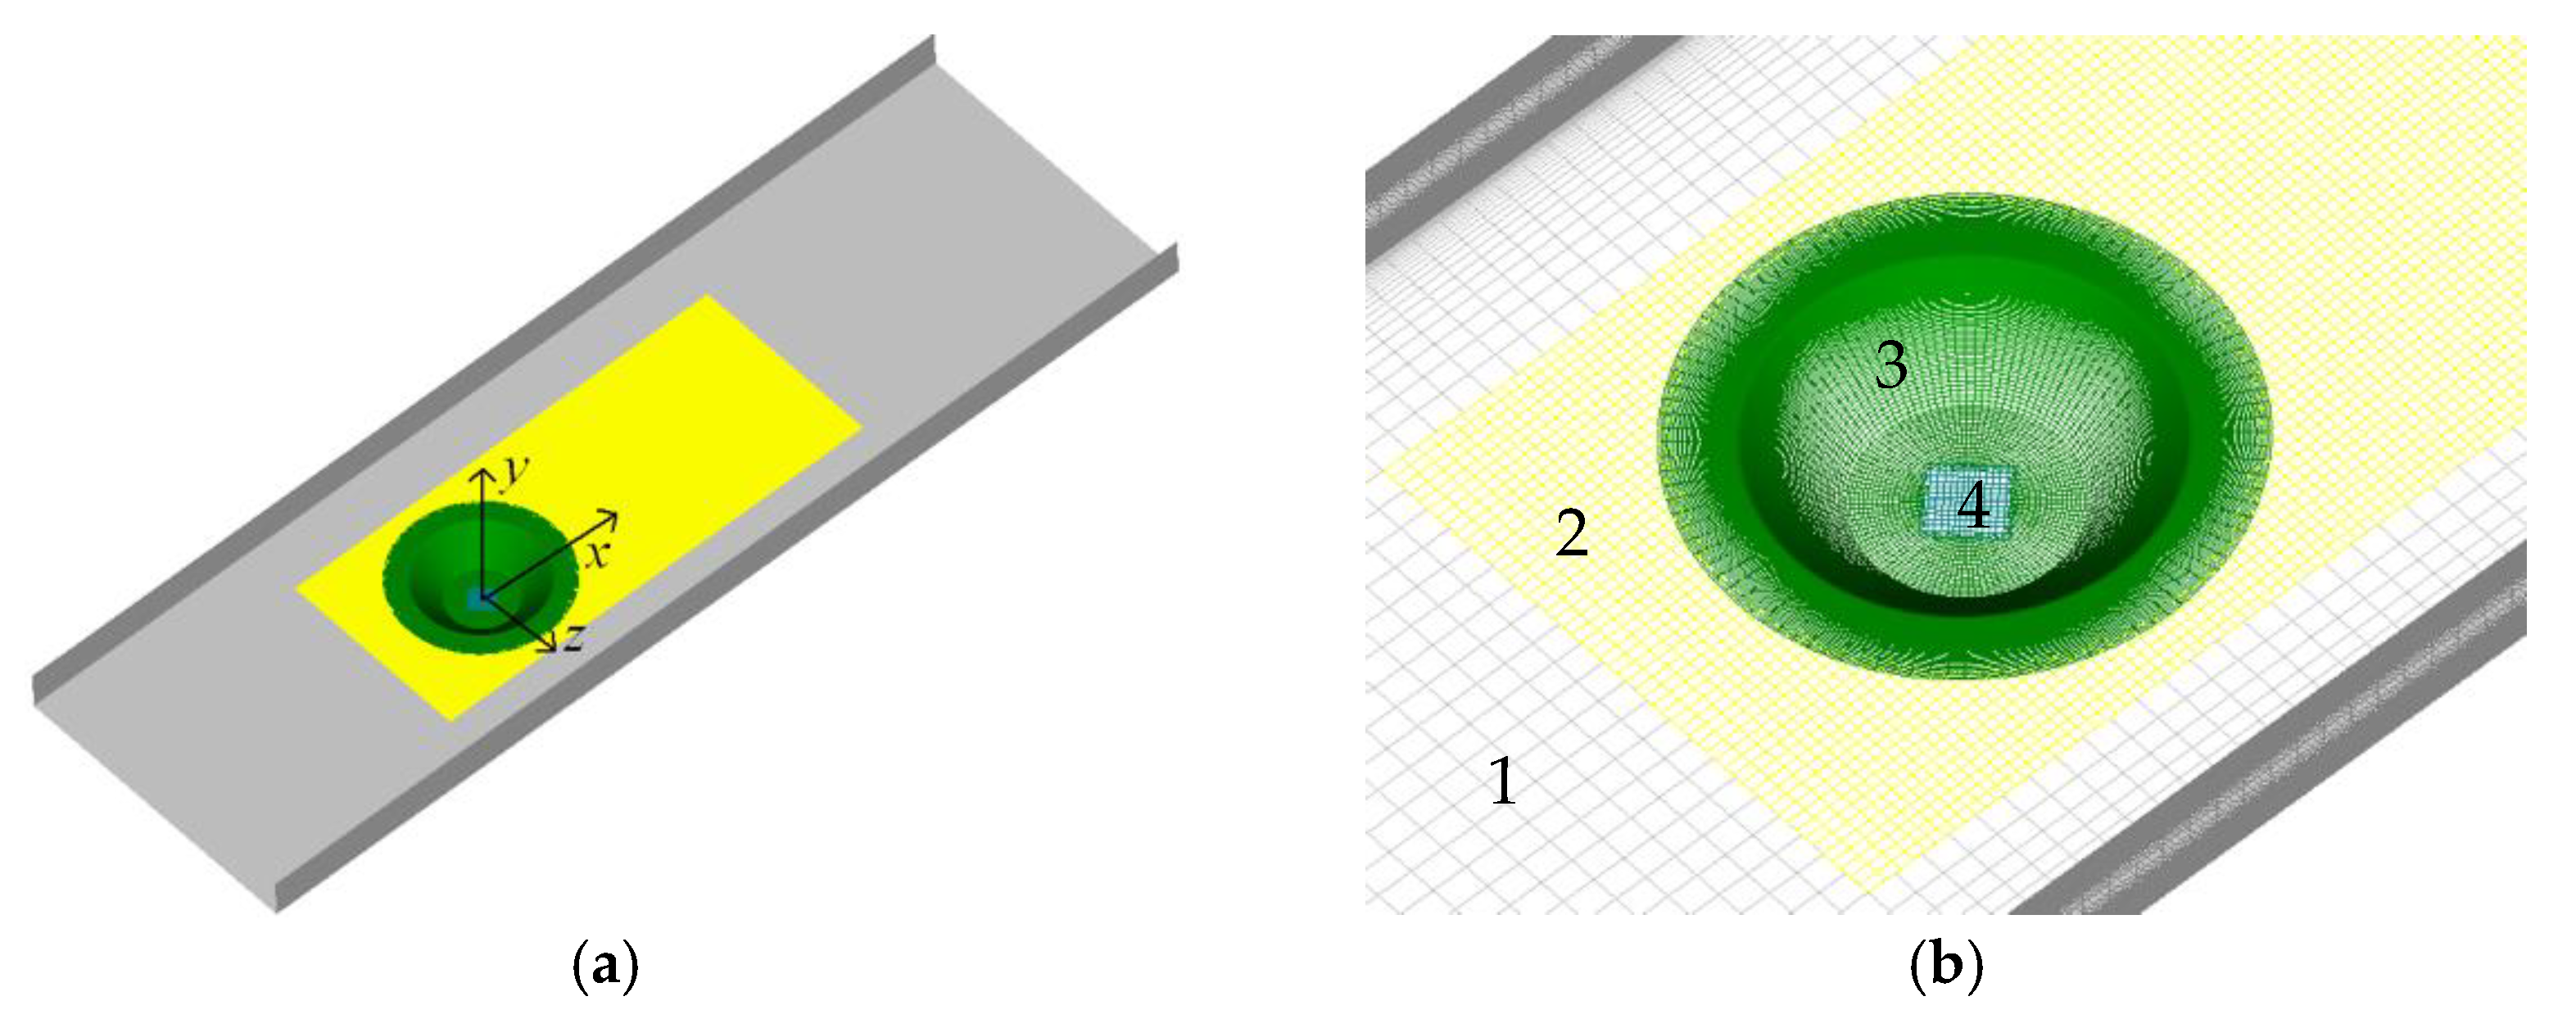
Turbulent heat transfer in the air flow in a narrow channel with a single conical dimple at an inclination angle of
on a heated wall (
Figure 1) was calculated. The stabilized area of flow in the channel, corresponding to the experiments [
86], was considered. The profile of the fully developed turbulent flow was assigned at the computational domain input. The dimple spot diameter
and the bulk flow velocity
were chosen as characteristic parameters. The Reynolds number was 104. The channel height was equal to 0.33, and the channel width was 2.5. The conical dimple depth
. The edge rounding radius was equal to 0.025. The turbulence level was assigned close to the experimental one (1.5%). The turbulence scale was of the order of the characteristic sizes. The Prandtl number was taken as equal to 0.7.
The heat and hydrodynamic tasks (the natural convection effects were not taken into account) were solved separately. The flow at the channel inlet was isothermal and had a temperature
. The lower streamlined channel wall with a dimple was heated. The supplied constant heat flux
was recalculated in a dimensionless form by the formula:
where
is the thermal conductivity. The side channel walls are adiabatic. The upper wall is isothermal and has a temperature
taken as the dimensionalization scale. The soft boundary conditions are assigned at the channel outlet for
. The order of
is 3.408 · 10
−5.
The task of convective heat transfer in 3D steady fully developed turbulent incompressible fluid flow in the channel with a single conical dimple on the heated wall was solved by means of the mathematical model based on the system of the Reynolds-averaged steady Navier–Stokes equations (RANS) and the energy equation. To close these equations, the modified Menter shear stress transport (SST) models, which proved themselves well in applications for typical near-wall flows, including separated flows [
29,
30], were used. The
model proposed by Menter is a generalization of two turbulence models: the Launder–Spalding
model for shear flow zones far from the wall [
7] and the Saffman–Wilcox
model for the near-wall region [
5]. The ideas realized in the Johnson–King turbulence model [
88] were used to construct the zonal shear stress transport model. As already mentioned, to determine the vortex viscosity, the Menter 1993 model [
29] used the vorticity modulus
and the modified Menter 2003 model [
30], as most of the differential-type semi-empirical models, included the strain rate tensor modulus
into the expression for vortex viscosity. It is important to emphasize that the semi-empirical models are mainly scaled with near-wall flows. Therefore, the necessity appears to adjust them to high-intensity separated flows. The Rodi–Leschziner–Isaev approach to correcting the Menter 2003 SST model means that the vortex viscosity coefficient
is subjected to the correction function:
where the additional constant
(index
stands for corrected) and the product
is to be within the range
(in the standard
model [
89], the semi-empirical constant
is used in the expression for vortex viscosity). It is fundamentally important to determine the turbulent Richardson number (
) for 3D flows (for 2D flows, it depends on a local flow velocity and curvature radius [
12]). Such a formula is proposed:
where
is the radius vector,
is the local flow velocity vector, and
;
is the specific dissipation rate.
The near-wall conditions for SST models were formulated so that the normal derivative to the wall for turbulence energy was equal to zero. The specific dissipation rate of the turbulence energy in the near-wall cell was determined according to reference [
30].
The methodology of solving the Reynolds-averaged steady Navier–Stokes equations is based on the concept of process splitting and is realized in the pressure correction procedure SIMPLEC [
90,
91,
92,
93], able to simulate convective heat transfer on multiblock overlapping structured grids. The developed methodology has been applied to cluster (multicore and multiprocessor) systems and generalized to cases of unstructured grids. Like reference [
90], the generalized transport equation is written in increments of dependent variables. The explicit hand-side of the equation is discretized according to the second-order approximation schemes (QUICK Leonard’s quadratic upwind interpolation [
94] for the convective terms of the momentum equations, the TVD scheme [
95] for the convective terms of the equations for turbulence characteristics, and the central-difference scheme for the diffusion terms). The implicit hand-side is presented with the use of the upwind scheme with one-sided differences. The use of the centered grids with the dependent variables located in the centers of computational cells leads to the need to monotonize the pressure fields by introducing Rhie–Chow correction [
96,
97]. The solution methods of algebraic equations are the preconditioned BiCGSHAB [
98] with the AMG preconditioner from Demidov’s library (amgl) [
99] for pressure correction and the ILU0 preconditioner for other variables.
The developed VP2/3 code (Velocity–Pressure, 2D/3D) uses the multiblock computational technique (MCT) described in reference [
90]. This technique is based on a set of different-scale, tier, and overlapping structured grids around the structural elements of the physical tasks of the relevant scales. In the two rows of the near-boundary cells of each of the overlapping or overset grids, the parameters are determined through linear interpolation [
90].
The computational domain is the space bounded by the walls of the narrow channel with a length of 6.7. The computational domain input is located at a distance of 1.4 from the projection of the dimple center onto the lower wall plane taken as the center of the Cartesian coordinate () system.
To solve the task, the basic multiblock computational grid containing 2.187 million cells is used. The grid consists of four different-scale fragments: (1) a rectangular channel grid CG (with a minimum step of 0.08 along the longitudinal coordinate and of 0.07 across the transverse coordinate) with densely packed nodes to the wall. It is meant for displaying flow in the channel; (2) a detailed grid meant for a detailed description of the flow in the near wake of the dimple, a Cartesian grid WG covering the 3.3 × 0.1 × 1.7 vicinity of the dimple (the front boundary is at a distance of 0.44 from the center); (3) a cylindrical grid near the dimpled curvilinear wall adjacent to the spherical dimple surface, an elliptical grid Ring with densely packed nodes to the wall; and (4) an oblique grid covering the axis of the dimpled cylindrical grid—“0.2 × 0.2 patches”. The near-wall step is chosen equal to 10−4. The channel grid contains 99 × 83 × 87 cells, and the detailed rectangular grid around the spherical dimple—132 × 35 × 59 cells. For detailed grid 2, the minimum value of the longitudinal and transverse steps is equal to 0.03. The cylindrical elliptical grid around the dimple contains 104 × 83 × 143, cells and the oblique grid covering the axis—19 × 83 × 19 cells.
The present work compares the local and integral characteristics of flow and heat transfer in the dimpled channel for different SST models.
The tables contain the integral values of the heat transfer
from the control area of the dimpled wall and from the surface inside the dimple, as well as the hydraulic loss coefficients
on the sections of the dimpled channel. The thermal performance
(index
pl stands for plate) and the relative hydraulic loss coefficients
on the 2.5 × 1.5 control area around the dimple with a 0.5 center shift downstream are determined by the methods of references [
51,
55]. The thermal performance (
) (index
stands for dimple) of the surface bounded by the dimple and the relative hydraulic loss coefficient (
) on the area of the channel with cross-sections at the leading and trailing edges of the dimple are also determined by the above methods. The thermal-hydraulic performance is determined as the ratio of the thermal performance to the relative hydraulic loss:
The characteristics of
and
and
and
are presented in
Table 1 and
Table 2 as a fraction in small numbers.
The compared parameters include the distributions of the pressure drop on the streamlined wall with the dimple and on the plane-parallel channel wall, the relative friction , and the wall temperatures in the middle longitudinal and transverse sections of the dimple. The distributions of the relative Nusselt numbers, both local in the middle section of the dimple and integrated over the transverse strips along the longitudinal and transverse coordinates of the control section, are compared. The dependence of the Cartesian flow velocity components ; the turbulence coefficient ; the vortex viscosity ; and the wall temperature on coordinate are compared.
3. Grid Convergence Justification
The influence of the computational grids on the uncertainty of the numerical predictions of characteristics of the separated flow and heat transfer in the narrow channel with a conical dimple is analyzed for the SST model corrected within the RLI approach.
Three multiblock different-scale grids are considered: simple (S), simplified (A), basic (B), and refined (C), containing approx. 984,000 (S), 1,561,000 (A), 2,187,000 (B), and 2,667,000 (C) cells.
The simple multiblock cell (S) is rough. Unlike the basic cell, it has a rather rough rectangular grid WG with minimum steps in the span-wise and streamwise directions . The space grid is very rarefied inside the dimple and has a number of computational cells that is almost an order of magnitude smaller than that in the basic cell. The simplified grid (A) differs from the basic one by a smaller number of cells in the curvilinear O-type cell in the area of the conical dimple—745,000 cells instead of 1,211,000 cells.
The grid (C), refined in comparison to the basic one, has a more detailed grid WG in the channel with the minimum steps in the streamwise and spanwise directions.
Some of the analysis results of the grid convergence and the numerical predictions are listed in
Table 2 and
Table 3.
A noticeable refinement of the predictions of the extreme characteristics is seen at a switch from the calculations on the rough multiblock grid (S) to the calculations on the grid (A) with an increasing number of cells in the area of the conical grid. The differences of , , , , , , , , , and on the considered grids are of the order of 5–10%. The switch from the basic grid (B), at which the turbulence models are compared, to the improved grid (C) slightly influences the characteristics.
The integral thermal and hydraulic characteristics of the control section of the channel with the conical dimple undergo less influence of the multiblock grids in comparison to the local extreme separated flow parameters. A small difference is seen in these characteristics when the rough grid (S) is replaced with the refined grid (A). A small change in these characteristics is seen at the switch from the rough grid (S) to the refined grid (A) within the dimple.
The data of
Table 2 and
Table 3 demonstrate the multiblock grid convergence results with an increase in the number of cells and the packing of cells in the dimple region.
4. Results and Discussions
The local and integral characteristics of the separated flow and heat transfer in the channel with a conical dimple of depth 0.233 and an inclination angle of
are calculated with the use of four SST turbulence models. The Menter 1993 [
29] and 2003 SST models [
4], as well as the two Menter 2003 models with the consideration of the streamline curvature influence corrected within the framework of the RLI [
54] and SM [
57] approaches, are considered. All the calculations used the basic multiblock grid.
Figure 2 illustrates the separated flow streamlines in the conical dimple and the computer visualization of the jet-vortex structure in it. They were obtained by means of the Menter 2003 SST model corrected according to the RLI approach. The calculation results obtained with the use of the other models are in qualitative agreement with the presented flow streamlines.
The streamlines in
Figure 2a are the trajectories of the liquid particles in the layer of computational cells adjacent to the curvilinear wall with indication of their direction. The calculated streamlines are the experimental visualization of the air flow along the wall obtained with the use of soot–oil coatings. They allow analyzing the vortex structures of 3D separated near-wall flows.
Figure 2b shows the 3D trajectories of liquid particles at the singularity points of source and sink type in the source streamline. The coordinates of the points are: the focus on the left slope (−0.144, −0.183, and −0.282) is the red strip; the sink on the right slope (−0.144, −0.183, and −0.282) is the blue strip; the focus in the center of the bottom (−0.088, −0.23, and 0.005) is the magenta strip; and the focus at the bottom (−0.128, −0.23, and −0.168) is the green strip.
As follows from
Figure 2, the separated steady flow zone covers the entire inner region of the dimple. The flow separation and attachment lines coincide with the leeward and windward rounded edges of the dimple, respectively. For deep dimples, the asymmetrical flow with an inclined jet-vortex structure inside the dimple is similar to the flow in the vicinity of the spherical dimple on the plate and on the narrow channel wall [
100,
101]. In the considered case, the near-wall air flow enters the conical dimple through the gap between the separation and attachment lines on the left side of the dimple. On the right side, air flows into the gap between the separation line, deviating from the dimple edge and the sink line of the interacting flows on the windward and side slopes. On the inner surface of the dimple, the rather complex separated flow is divided into a flow around the inclined slopes and a flow at the flat bottom similar to the case when the flow is formed inside the cylindrical dimple [
102]. On the left slope near the bottom, the source streamline shows the singularity point of focus (source) type, indicating the place where the inclined tornado-like vortex (the red strip in
Figure 2b) is generated. Air enters this place mainly when it flows along the dimple slopes, bypassing the bottom. The external flow entering the dimple from above interacts with the windward slope of the dimple.
Air is sucked into the spiral vortex not only from the surface of the left side wall but also when it flows on the right and leeward inclined slopes. The source streamline on the right side of the slope shows the occurrence of the sink-type singularity point, where the external flow turns in the vicinity of the windward edge of the dimple (the blue strip in
Figure 2b). The separated air flow at the conical dimple bottom is divided into two zones adjacent to the windward and leeward slopes. The separation line of the zones illustrates the occurrence of two focus-type singularity points, in the vicinity of which, column-shaped spiral vortices are formed. They are shown by green and magenta colors (
Figure 2b).
Figure 3,
Figure 4 and
Figure 5 compare the pressure fields, the relative friction, and the Nusslet number values on the streamlined surface of the control area of the heated wall with a conical dimple. The air source streamlines on the dimpled wall are plotted in the fields of the characteristics.
Figure 3 shows a sharp change in the pressure fields in the zone on the left side of the windward rounded edge of the conical dimple, where the flow stagnation region is also located. The low-pressure region is located behind the dimple in the vicinity of the surface curvature discontinuity line. By the maximum absolute value, the low pressure exceeds the maximum stagnation pressure at the edge. Generally, the static pressure changes inside and near the dimple are small, based on the color palette. All the pressure fields and the source streamlines obtained for the considered SST turbulence models are slightly different from each other.
In
Figure 4, the fields of the relative
x-component friction
in the projection onto the control plane, coinciding with the channel heated wall, refer to the same characteristics at the appropriate points on the non-dimpled wall of the plane-parallel channel. The air source streamlines (top view) are superimposed on the calculated fields of
. The general features of the presented streamlines are the sharp flow acceleration in the low-pressure narrow regions just behind the dimples, where
reaches a value of 8.
The relative negative friction regions are formed on the windward slopes and at the dimple bottom. The minimum values of decrease very strongly up to −1.5. The difference in the fields obtained with the use of the Menter 1993 and 2003 SST models corrected according to RLI and in the fields of calculated with the use of the Menter 2003 SST model and the Menter 2003 SST model corrected according to SM are significant. At the same time, the predictions with the use of the mentioned pairs of the turbulence models appear to be pretty close.
In
Figure 5, the fields of the relative Nusselt numbers demonstrate the narrow zones of the maximum heat transfer at the windward edge of the conical dimple.
reaches a value of 2.1. These high-heat zones correlate with the high-gradient regions, i.e., with the maximum values of
.
It should be noted that the low heat load regions with of the order of 0.3–0.5 appear in the vicinity of the places where tornado-like vortex structures are generated on the left slopes and on the dimple bottom parts adjacent to them, as well as on the leeward slopes.
The above-mentioned separated flow splitting at the dimple bottom into the zones adjacent to the windward and leeward slopes, where the transverse separating streamline is formed, correlates with different heat transfer regions.
The intense air flow on the windward slope and on the bottom part adjacent to it are characteristic of the higher relative Nusselt numbers than on the leeward slope. It should be noted that the fields of calculated with the use of the Menter 1993 model and the Menter 2003 model corrected according to RLI are close.
Figure 6 and
Figure 7 compare the distributions of the characteristics of the flow and heat transfer over the surface (
,
,
, relative Nusselt number
, and transverse strip-integrated averaged Nusselt numbers
) in the middle longitudinal and transverse sections of the control area with the conical dimple calculated with the use of the different SST models. Their analysis allowed us to compare the standard SST models and the models corrected with consideration of the streamline curvature, as well as to determine a quantitative difference between the predictions obtained with their use.
In
Figure 6a,b, the pressure drop
is determined in the projections of the dimpled wall points onto the control plane, coinciding with the dimpled heated flat wall of the channel, and at the appropriate points of the plane-parallel channel. As already mentioned in the analysis of the pressure fields on the dimpled wall of the channel, the maximum pressure is seen in the vicinity of the windward edge of the dimple. The static pressure drop in the middle longitudinal section is also observed on the rounded surface of the dimple edge, achieving a value of 0.25. A sharp pressure drop to a value of approx. −0.25 is seen behind the dimple edge at the place of curvature discontinuity. On the windward side,
decreases rather quickly when it moves away from the edge and somewhat increases near the bottom, up to a value of 0.1. While approaching the dimple center on the windward side, the pressure drop takes a value of −0.04 at the flat bottom, i.e., a slight rarefaction is observed in the dimple center. A small negative pressure drop close to a constant one is maintained on the bottom part adjacent to the leeward slope of the dimple, and on the slope itself, it is close to zero. A small static pressure drop up to a value of −0.02 is seen in the vicinity of the leading edge of the dimple. Generally, the pressure drop predictions obtained with the use of different SST models in the middle longitudinal section are close enough. Slight differences can be seen in the center of the dimple and at its trailing edge. The rarefaction and maximum stagnation pressure levels, predicted with the use of the Menter 2003 SST model and the Menter 2003 SST model corrected according to SM, appear to be underestimated. The changes in the predictions obtained by the different SST models for the pressure drop in the middle transverse section of the dimple appear to be quite visible in the background of the not-too-significant extreme values from −0.038 to 0.025. The differences are especially big in the dimple center. They reach a value of 0.02, which is almost 100% of the minimum pressure drop value determined by the Menter 2003 SST model. Thus, we should emphasize a good quantitative agreement of the
predictions, obtained by the Menter 1993 SST model and the Menter 2003 SST model corrected according to RLI, and a significant deviation from the predictions, obtained by the Menter 2003 model incorporated into the widely used software CFX, Fluent, StarCCM+, OpenFOAM, etc., and from those obtained by this model corrected according to SM.
In
Figure 6c,d, the relative friction distributions
in the middle longitudinal and transverse sections of the control area of the dimpled wall of the channel demonstrate that an inhomogeneous separated flow is formed inside the dimple. As already noted, the high-gradient narrow zone with multiplying the increasing
arises at the windward rounded edge. The narrow zone with a decreasing relative friction up to a value of 0.7 is also seen behind the above-mentioned high-gradient zone. The separated flow zone in the longitudinal section of the dimple can be divided into three areas: an intense backflow area on the windward side of the dimple with the minimum value of the ratio
equal to −1.4, a backflow area on the bottom flat part adjacent to the leeward side of the dimple with the minimum value of the ratio
equal to −1.6, and a secondary flow area on the bottom flat part adjacent to the leeward side of the dimple with the maximum value of the ratio
equal to 0.3. Attention should be paid to the large maximum absolute values of the relative friction of backflow in the dimple that are caused by developing an intense inclined swirling flow inside the separated flow zone. As in the analysis of the static pressure drop distribution predictions obtained with the use of different SST models, the longitudinal distributions of the relative friction appear to be close, although there is some difference in the minimum values of
for the SST models: −1.1 for the Menter 2003 model and −1.6—for the Menter 1993 model. In the transverse section, the minimum value of
equal to −1.1 is in the vicinity of the junction of the left slope of the dimple and its bottom, i.e., it is strongly shifted from the center. The maximum value of
inside the separated flow zone is seen at the dimple bottom near the right slope. The extreme values of
obtained with the use of the Menter 2003 SST model and the Menter 2003 SST model corrected according to SM are underestimated. A maximum deviation is very significant and is almost 50% of the extreme value. Therefore, for the Menter 2003 SST model,
.
The longitudinal and transverse temperature distributions in the middle sections of the control area of the dimpled wall of the channel (
Figure 6e,f) are very illustrative. In front of the dimple, the wall temperature is equal to 1.0055. In the longitudinal section on the leeward slope of the dimple, the temperature rises sharply, reaching a value of 1.011. The wall temperature decreases significantly to 1.008 at the junction of the leeward slope and the flat wall of the bottom. Further moving to the dimple center, the temperature rises rapidly to its maximum value (
), corresponding to the zero friction point and located in the region of the practically stagnation secondary separated flow of air. On the remaining part of the inner surface of the dimple, the temperature decreases rather quickly and has a small local maximum value at the junction of the bottom and the windward slope, achieving a minimum value of 1.003. It should be mentioned that the minimum value of
at the place of dimple curvature discontinuity at the switch to the smooth wall of the channel is significantly smaller than the wall temperature in front of the dimple. The differences in the predictions of the extreme wall temperature values inside the dimple obtained with the use of different turbulence models are very noticeable. The value of
on the leeward slope estimated by the Menter 2003 model is 1.01 and appears to be re-estimated with an error of 0.004. The values of
on the dimple bottom obtained with the use of all SST models are close, but the maximum values, predicted by the Menter 2003 SST model and the Meter 2003 SST model corrected according to SM, appear to be shifted to the leeward slope. The most distinct differences in the temperature predictions obtained with the use of different SST wall models are seen in the middle transverse section of the dimple. A sharp wall temperature increase on the left slope of the dimple to a value of 1.0115, obtained by the Menter 1993 SST model and the Menter 2003 SST model corrected according to RLI, appears to be somewhat smaller in comparison to the maximum values of
, obtained by the Menter 2003 SST model and the Menter 2003 SST model corrected according to SM. The greatest differences in the temperature predictions are seen on the bottom flat part adjacent to the left slope of the dimple. The minimum wall temperature value equal to 1.007 is obtained using two SST models: the Menter 1993 SST model and the Menter 2003 SST model corrected according to RLI. According to the Menter 2003 SST model, the temperature in this zone is 1.0085, and according to the SM correction, it is 1.008. The wall temperature behavior on the right slope and on the bottom flat part adjacent to it is almost the same for all the SST models, with the exception of the disagreement of the maximum temperature values on the slope near the rounded edge, where the predictions by the Menter 2003 SST model and its correction according to SM are somewhat overestimated in comparison to
. It should be noted that there is one local maximum temperature value of approx. 1.009 on the dimple bottom at the junction of the bottom and the right slope.
Generally, the predictions of the considered characteristics obtained with the use of the Menter 1993 model and the Menter 2003 model corrected according to RLI correlate well with each other. At the same time, there are differences in the predictions obtained with the use of the Menter 2003 SST model and the Menter 2003 SST model corrected according to SM that are mainly seen in the field of attaining extreme values. The greatest deviations are characteristic of the Menter 2003 SST model.
Figure 7 illustrates the calculation relations of the relative local Nusselt numbers
and the transverse strip-integrated Nusselt numbers
along the x- and transverse z-coordinates in the middle section of the control area of the heated wall with a conical dimple for the different SST turbulence models.
As already discussed, for the pressure drops and the relative x-component friction, the longitudinal distributions of the local and integral heat loads obtained by the standard and modified SST models are rather close, with the exception of the rather narrow zones in the fields attaining extreme values. The maximum values of are seen on the windward slope, on the bottom flat part adjacent to the windward slope, and on the windward rounded edge of the dimple. The values of are equal to 0.7, 1.1, and 2.05, respectively. The minimum values of are observed in the vicinity of the leeward rounded edge, on the dimple bottom in the region of the interacting backward and secondary flows, and at the junction of the bottom and the windward slope. The values of . are equal to 0.5, 0.4, and 0.9, respectively. The maximum difference in the predictions of is of the order of 0.15, which is approx. 20% of the extreme value.
The relative Nusselt numbers integrated over the transverse strips of the control area of the heated wall with a dimple achieved a maximum value equal to 1.36 in the strip, corresponding to the vicinity of the windward rounded edge, and a minimum value equal to 0.68 in the strip, passing through the junction of the dimple bottom and the leeward slope. The maximum prediction of obtained by the means of the different SST models is of the order of 0.05.
The dependence of for the different SST models have slight differences in the vicinity of the extreme values and substantial differences in the central region of the dimple bottom. The local minimum values of , equal to 0.5 and 0.65, are observed on the side left and right slopes of the conical dimple in the vicinity of the rounded edges. The local minimum value equal to 0.66 is at the junction of the bottom and the right slope. The local maximum value of , equal to 0.9, corresponds to the right slope of the dimple. The greatest differences between the predictions of are observed in the central region of the dimple at the place, where column-shaped tornado-like structures are generated. The deviation of the prediction obtained by the Menter 2003 SST model from that found by the Menter 1993 SST model is 0.17 when the value of is equal to 0.86.
The relative Nusselt numbers averaged over the longitudinal strips of the control area of the heated wall with a dimple have a local maximum value equal to 1.12 in the strip corresponding to the rounded edge of the left slope of the dimple. The maximum value of is seen in the center of the control area corresponding to the center of the dimple and the gradient flow zone in the wake behind it. This value predicted by means of the Menter 1993 SST model is 1.15 and appears to be much higher than that obtained by means of the Menter 2003 SST model and the Menter 2003 SST model corrected according to SM (). Generally, the predictions with the use of the Menter 2003 SST model corrected according RLI agree well with those obtained by the Menter 1993 SST model. At the same time, the predictions of the Menter 2003 SST model are significantly different from them. Unlike the correction according to RLI, the correction according SM has no strong influence on the results.
Figure 8 compares the calculated profiles of the Cartesian velocity components of the separated flow, temperature, and turbulence characteristics in the conical dimple center obtained with the use of different SST models. The predicted values of
are typical for separated flows in deep dimples [
72,
76]. The maximum backflow velocity reaches a value of 0.4. The prediction obtained with the use of the Menter 2003 SST model and the Menter 2003 SST model corrected according to SM somewhat underestimates this value (up to 0.3). In the channel flow core, all models yield the same profiles. The velocity profiles of the secondary swirling flow
are different for the different SST models. The maximum value of the positive velocity
near the wall is 0.27, and the minimum value of
in the shear layer is −0.15. In the channel flow core, approximately the same velocity
is maintained, showing that the right–left shear flow is formed under the dimple. The use of the Menter 2003 SST model and the Menter 2003 SST model corrected according to SM underestimates the secondary flow intensity.
decreases up to 0.2 and
increases up to −0.11. Thus, the maximum deviation of
is 30%. The profiles of the vertical velocity
show that a rather weak ascending flow with a maximum velocity of 0.055 is formed near the dimple bottom. This flow meets the descending flow at the maximum intensity in the shear layer of the order of
. Above the dimple in the flow core, the vertical velocity component is negative and decreases linearly while approaching the upper wall. The use of the Menter 2003 SST model and the Menter 2003 SST model corrected according to SM underestimates the intensity of the ascending and descending flows. The maximum deviation of the predictions of
does not exceed 0.01, which is 20–25% of the extreme value of
.
The temperature profiles in the separated flow in the dimple are divided into two prediction groups that agree well with each other. The first group uses the predictions obtained with the use of the Menter 1993 SST model and the Menter 2003 SST model corrected according RLI, and the second group uses the predictions obtained with the use of the Menter 2003 SST model and the Menter 2003 SST model corrected according to SM. In the first group, the S-shaped profile with a minimum value of 1.04 and a maximum value of 1.05 is formed inside the dimple. In the second group, the maximum value is practically absent, and in the swirling flow core in the dimple, the temperature is approximately the same at a level of 1.04.
The turbulence energy profiles show that the maximum value of is realized in the shear layer under the dimple (in the vicinity of ). Inside the separated flow zone, the predictions of are strongly different. In the above-mentioned first group, the swirling flow core is lowly turbulent, and the value of is equal to 0.017–0.02. It should be emphasized that the maximum value of in this case, is 0.04. The second group models predict higher turbulence levels in the separated flow. Therefore, in the swirling flow inside the dimple, the turbulence energy of the fluctuations increases, and the maximum value of in the shear layer is within 0.044–0.047. It is interesting to mention that, in the channel flow core, the profiles coincide.
As described in references [
53,
54,
63], when the Menter 2003 SST model is used to calculate the separated flows, the effect of artificial pumping of the vortex viscosity occurs in the cores of large-scale vortices. As seen from
Figure 8f, the predictions by means of the Menter 2003 SST model are characterized by a bell-shaped distribution when the maximum vortex viscosity value in the swirling flow core is equal to 0.0028. It should be noted that this maximum value hardly exceeds the maximum value of
in the shear layer (0.0022). The SM correction somewhat decreases the level of the vortex viscosity pumping (up to 0.0018), but it does not eliminate it. In the shear layer,
reaches a value of 0.002. The first group models actually eliminate the false vortex viscosity pumping. The profile
inside the dimple becomes a double peak with a maximum value of
in the swirling flow core within 0.001–0.0015. The second peak corresponds to the shear layer with a maximum value of µt = 0.0018. Outside the dimple in the channel flow core, the predictions of
by the means of all the SST models coincide.
The comparison of the extreme characteristics of the flow and turbulence in
Table 4 complements the analysis of the local characteristic profiles and the pressure distributions over the dimple surface. It is easy to see that the predictions of the characteristics confirm that the considered SST models are divided into two groups. The first group deals with the Menter 1993 SST model and the Menter 2003 SST model corrected according to RLI, and the second deals with the Menter 2003 SST model and the Menter 2003 SST model corrected according to SM. Only the maximum velocities in the dimpled channel appear to be close to each other. The predictions with the use of the second group models significantly decrease the intensity of the backflow and secondary flow and swirling flows, as well as ascending and descending flows. This is largely due to the overestimation of turbulent extreme characteristics.
The same conclusion can be made by comparing the thermal and thermal-hydraulic characteristics of the dimpled channel (
Table 2). The predictions of the heat transfer, thermal performance, and relative hydraulic losses of the control area of the channel and the surface bounded by the conical dimple contour appear to be rather close when the first group of the SST turbulence models is used. The Menter 2003 SST model yields the underestimated predictions of the thermal and thermal-hydraulic performances of the control area of the dimpled channel. It should be noted that the relative heat transfer of the channel area appears to be higher than that of an individual dimple. This significantly contributes to the thermal performance of the heat transfer in the wake behind the dimple.


 ,
, 


